oregon strategy for greenhouse gas reductions
TRANSCRIPT

Oregon Strategy forGreenhouse Gas ReductionsGovernor’s Advisory Group On Global Warming
State of Oregon, December 2004

Governor’s Advisory Group On Global Warming
Co-ChairsMark Dodson CEO, Northwest NaturalDr. Jane Lubchenco University Distinguished Professor of Zoology and Wayne and Gladys
Valley Professor of Marine Biology, Oregon State University
MembersGail Achterman Director, Institute for Natural Resources, Oregon State University, and
Dept. of Transportation Commissioner
Jeff Allen Executive Director, Oregon Environmental CouncilRandy Berggren General Manager, Eugene Water & Electric BoardBill Blosser Environmental Consultant (Sustainability Board Member)
Bill Bradbury Secretary of State and Sustainability Board ChairSusan Bragdon Environmental AttorneyRex Burkholder Portland Metro Commissioner
Michael Burnett Executive Director, The Climate TrustAngus Duncan President, Bonneville Environmental FoundationJudi Johansen CEO, PacifiCorp
Al Jubitz Former President, Jubitz CorporationDavid Leslie Executive Director, Ecumenical Ministries of OregonHenry Lorenzen Attorney, FarmerJudge Michael McArthur Sherman County Board of Commissioners
Dr. Ronald Mitchell Professor, University of OregonSteve Schell Attorney, Chair of Oregon Energy TrustJack Southworth Cattle Rancher
Erik Sten Commissioner, City of PortlandJean Wilkinson Principal, Underhill FarmsBill Wyatt Executive Director, Port of Portland
Duncan Wyse President, Oregon Business Council
Ex Officio MemberDr. Ron Neilson US Forest Service
State Agency MembersMichael Grainey Director, Oregon Department of Energy
Stephanie Hallock Director, Oregon Department of Environmental QualityJohn Savage Commissioner, Oregon Public Utility CommissionDavid Van’t Hof Sustainability Policy Advisor, Governor’s Office
The Oregon Department of Energy published this report on behalf of the Advisory Group.

Oregon Strategy forGreenhouse Gas Reductions
Governor’s Advisory Group On Global Warming
State of Oregon, December 2004

Oregon Strategy for Greenhouse Gas EmissionsReprinted June 2005
For copies of the report, seewww.oregon.gov/ENERGY/GBLWRM/Strategy.shtml
or contact:
Oregon Department of Energy625 Marion Street NE, Salem, Oregon 97301-3737
(503) 378-4040 or 1-800-221-8035, toll-free in OregonE-mail to: [email protected]

Table of ContentsExecutive Summary i
The Governor’s Advisory Group on Global Warming vii
PART ONE
1. Introduction ...........................................................................................................................3
2. Vision: Oregon Acts on Global Warming............................................................................. 62.1 Oregon’s “Fair Share” of Global Greenhouse Gas Emissions Reductions................................... 62.2 Principles................................................................................................................................... 72.3 Goals, Strategies and Implementation........................................................................................ 82.4 An “Investment-Based” Solutions Strategy............................................................................... 132.5 The Economics of Addressing Global Warming: Costs, Investments and Opportunities........... 162.6 Partners....................................................................................................................................24
3. Context................................................................................................................................. 273.1 A Primer on Global Warming...................................................................................................273.2 Costs and Consequences to Oregon of a “Business As Usual” Strategy.....................................353.3 Mitigation and Adaptation.......................................................................................................39
PART TWO
1. Introduction to Recommended Actions ........................................................................... 43Criteria and Categories............................................................................................................ 45Estimated Reductions from Implementing Actions................................................................... 46
2. Recommended Actions ......................................................................................................48Integrating Actions (IA)........................................................................................................... 48Energy Efficiency (EE)..............................................................................................................55Electric Generation and Supply (GEN).....................................................................................66Transportation (TRAN)........................................................................................................... 75Biological Sequestration (BIOSEQ)...........................................................................................91Materials Use, Recovery and Waste Disposal (MW).................................................................99State Government Operations (GOV).....................................................................................114
3. Conclusion and Next Steps ............................................................................................ 117
APPENDICESA. Advisory Group Members and BiographiesB. Inventory and Forecast of Oregon’s Greenhouse Gas EmissionsC. Scientific Consensus Statement on the Likely Impacts of Climate Change
on the Pacific NorthwestD. Briefing Paper: Materials and Greenhouse GasesE. Executive Summary of West Coast Governors’ Global Warming Initiative “Staff
Recommendations to the Governors”F. Glossary of Energy and Global Warming Terms


Governor’s Advisory Group On Global Warming | page i
Executive SummaryGlobal warming is not just another environmental issue.
It’s not “just another issue,” period.
Absent decisive actions across the globe of the sort proposed in this report, the warming alreadyunderway is expected to lead to changes in the earth’s physical and biological systems that wouldbe extremely adverse to human beings, their communities, economies and cultures. These arechanges that we would have unintentionally brought upon ourselves, but that are also in ourpower to reverse. Our failure to return atmospheric accumulations of greenhouse gases (GHG)back to levels that will sustain historic climate patterns may lead to an Earth that is dramaticallyaltered and far less habitable within only a few generations.
The impacts of such changes on Oregon citizens, businesses and environmental values are likelyto be extensive and destructive. Coastal and river flooding, snowpack declines, lower summerriver flows, impacts to farm and forest productivity, energy cost increases, public health effects,and increased pressures on many fish and wildlife species are some of the effects anticipated byscientists at Oregon and Washington universities.
The means to arrest and reverse these effects are at hand or within technological reach. Many ofthem carry co-benefits that would justify acting on them without the impetus of global warming:positive economic returns on dollars invested in energy efficiency, energy price stability, andhealthier air and water. Others will cost us something up front for insurance against the deeplydisruptive and costly effects that we can expect absent any action. The earlier we take many ofthese actions, the less drastic they will have to be to achieve the same emissions reduction result.
The Governor’s Advisory Group on Global Warming developed this Oregon Strategy forGreenhouse Gas Reduction.1 Governor Ted Kulongoski appointed the Advisory Group early in2004 to perform this task. This Strategy, if implemented, will complement the agenda of the WestCoast Governors’ Global Warming Initiative undertaken by the governors of California, Oregonand Washington to address greenhouse gas emissions at a state and regional level.
The ProblemSeveral thousand of the earth’s scientists worked together on the Intergovernmental Panel onClimate Change to review the exhaustive evidence and describe the plausible range of outcomes.They agree that global warming caused by greenhouse gas pollution from human activitiesrepresents a profoundly serious threat to human civilization and to even the most robust andinsulated natural ecosystems. Their comments are echoed in the Scientific Consensus Statementon the Likely Impacts of Climate Change on the Pacific Northwest prepared by scientists atOregon and Washington universities in the fall of 2004 following a thorough regional review ofthe science (Appendix C).
1 The Advisory Group and its 2004 process are described in greater detail below.

page ii | Oregon Strategy for Greenhouse Gas Reductions
Oregon ChoicesAs Oregonians and Americans, we clearly have choices about how we will respond to thewarming of our planet. We can choose a “business as usual” path of contributing ever-increasinggreenhouse gas emissions to already high atmospheric concentrations. But if we choose “businessas usual,” we leave a legacy for our children and grandchildren of a changing global climate thatthreatens human habitation and biological ecosystems. The costs to adapt to and remedy thesechanges will be much higher than they would be if we act today.
Alternately, we can adopt the goals and the set of actions recommended in this report to arrestand reverse Oregon’s contribution to these global warming trends. In doing so, we will setourselves on a path to reduce emissions over time and stabilize the global climate conditions webequeath to our children.
GoalsThe Advisory Group believes that setting goals for Oregon, expressed together with actions thatcan plausibly meet those goals over time, gives purpose and structure to the task of reducinggreenhouse gas emissions. The Advisory Group proposes the following new goals:
1. By 2010, arrest the growth of Oregon’s greenhouse gas emissions (including, but notlimited to CO2) and begin to reduce them, making measurable progress toward meetingthe existing benchmark for CO2 of not exceeding 1990 levels.
2. By 2020, achieve a 10 percent reduction below 1990 greenhouse gas levels.
3. By 2050, achieve a “climate stabilization” emissions level at least 75 percent below 1990levels.
The goals offer a pathway to climate stabilization that requires vigorous action, but also allowstime for necessary individual and business adjustments.
Economic Investments and OpportunitiesIn any discussion of addressing global warming, it’s easy to get trapped in the underbrush ofnear-term costs and to miss the forest of rational economic calculation of long-term savings. Insome cases those near-term costs are going to be higher, but often the costs will be matched bythe returns that Oregon families and businesses will see directly.2
The economic dimension of dealing with climate change can be stated as a series of “costs,” butit can also be stated in a more affirmative way. Many actions proposed in this report carry pricetags, but they are generally in the nature of investments that can generate net economic returnsto us over time. Most are investments we are experienced in making, from improving theefficiency of our homes, farms, factories and appliances to developing non-polluting new energysources such as wind, solar, agricultural biomass and other renewable resources. These shouldremind us of our long investment in hydroelectricity.
2 The effects of global warming on Oregonians and the costs we will bear in adapting to climate change are not justa function of what we do in one state. They also depend on the degree to which our leadership and actions arematched by leadership and actions across the country and around the globe.

Governor’s Advisory Group On Global Warming | page iii
Near-term costs are further offset by helping Oregon businesses stay competitive in a worldmoving to greenhouse gas limits. Costs of recommended actions should also be measured againstthe economic opportunities that will open for Oregon businesses that develop goods and servicesfor sale to a world in the market for low greenhouse gas solutions.
Other costs are similar to buying insurance policies against events that would otherwise cost farmore to cope with. Avoiding the potentially destructive storms, floods and forest fires that areprojected to accompany global warming would likely be less costly than the repairs we wouldneed to make following such events. These measures will bring the same welcome returns thatpast investments in flood control have earned.
We believe there will be many economic opportunities for companies and communities that riseto the challenge by developing the practices and technology products that our trading partners inother states and countries also will need to cope. We have ample experience in Oregon with thisoutcome. Many companies here have built prosperous business lines in energy efficiencyproducts and consulting practices, in developing renewable energy technologies and adapting thepower system for optimal use. We believe Oregon’s entrepreneurs, supported by Oregon’sacademic and technical capabilities, can prosper by positioning themselves at the leading edge ofchange.
Principles and StrategiesThe set of principles the Advisory Group used to guide its efforts placed primary emphasis onreal, measurable and meaningful reductions in the state’s greenhouse gas emissions. The AdvisoryGroup also emphasized the need to focus first on the most cost-effective actions and those thatcreate investment and entrepreneurial opportunities. We agreed we would not take actions thatcould impair reliability in our electrical and other energy supply systems, and we believe thatmany of our recommendations will actually enhance this quality.
The principles create the right direction and focus for Oregon. The Strategy further articulatesfour broad strategies that complement the principles:
1. Invest in energy, land use and materials efficiency.
2. Replace greenhouse gas-emitting energy resources with cleaner technologies.
3. Increase biological sequestration (farm and forest carbon capture and storage).
4. Promote and support education, research and technology development.
Recommended ActionsThe Advisory Group has recommended a set of actions – some very specific, others more in thenature of shifting Oregon’s long-term policy orientation – that collectively will meet our first goalof reversing the upward trend of Oregon’s greenhouse gas emissions. The list of actions wechoose or must take over the next fifty years is far from complete, since many needed actions andopportunities will only reveal themselves as we proceed. New, more cost-effective technologiesand applications will emerge. Improved scientific understanding will open new doors.

page iv | Oregon Strategy for Greenhouse Gas Reductions
The Strategy recommends actions in seven areas as outlined in Part Two:
(1) Integrating Actions
(2) Energy Efficiency
(3) Electric Generation and Supply
(4) Transportation
(5) Biological Sequestration;
(6) Materials Use, Recovery and Waste Disposal
(7) State Government Operations
Within these areas, the Advisory Group identified two categories of actions.3
Category I: Significant Actions for Immediate State ActionThese actions promise significant greenhouse gas savings, are technically feasible todayand are often the most cost-effective first actions to be taken.
Category II: Other Immediate ActionsThese actions make sense for Oregon to undertake immediately. In most cases thegreenhouse gas savings are less significant, but costs are also proportionately lower andmany actions are cost-effective now.
Accomplishing Category I actions will usually require the most concerted and disciplined efforton the part of Oregonians. Equally meaningful progress toward the proposed goals will beextremely difficult to achieve without substantially achieving most or all Category I actions.
Some of the major Category I actions include:
Integrating Actions (IA-1): Arrest the growth of and begin to reduce Oregon’s greenhousegas emissions by 2010. Meet a goal of 10 percent below 1990 Oregon emissions levels by2020 and at least 75 percent below 1990 levels by 2050.
Energy Efficiency (EE-1): Meet Oregon’s energy efficiency target set by the NorthwestPower and Conservation Council for the next 20 years, capturing at least 960 averagemegawatts of electricity savings and comparable conservation of natural gas and oil.
Electric Generation and Supply (GEN-1): Increase the renewable content of electricity.
Electric Generation and Supply (GEN-2): Recommend that the Governor create a specialinterim task force to examine the feasibility of, and develop a design for, a load-basedgreenhouse gas allowance standard.
3 The Advisory Group considered Category III Actions that, for various reasons including manageability of theprocess, it chose to defer. As these and other possible actions are proposed, they can be developed and consideredby a successor to this Advisory Group.

Governor’s Advisory Group On Global Warming | page v
Transportation (TRAN-1): Convene an interim task force to recommend a proposal forthe Environmental Quality Commission or the Governor and the Legislature to adoptgreenhouse gas emission standards for vehicles.
Materials Use, Recovery and Waste Disposal (MW-1): Achieve the waste disposal andrecovery goals already adopted by Oregon in statute.
Of the 19 Category I actions, two are constrained by law to be cost-effective. The NorthwestPower and Conservation Council’s 20-year energy efficiency goals (incorporated in action EE-1)must meet a test, established in federal law, of being cost-effective to the region (and in nearly allcases, to individual electricity consumers). The California state law establishing the “Pavley”auto tailpipe pollution standards (TRAN-1) requires that new cars be able to meet the twin testsof low greenhouse gas emissions and cost-effectiveness to the purchaser.
The other Category I action with the greatest potential for cost consequences is the proposedgreenhouse gas allowance for electricity, gas and oil (GEN-2). Estimating the costs and benefitsof this measure depends on its design, on future energy markets and costs, on technologyevolution and on future regulatory actions. We can model different paths to our greenhouse gascontent (also referred to as “carbon content”) goal and select one that offers the greatestgreenhouse gas savings at the lowest cost and risk. By relying on energy efficiency and renewabletechnologies that are unaffected by fossil fuel markets and price swings, compliance actions canminimize abrupt rate shocks to consumers and cost impacts that could undermine thecompetitiveness of Oregon businesses.
An effective design may maximize the ability to trade emissions savings and offsets withCalifornia and Washington, lowering compliance costs. The design of a greenhouse gasallowance mechanism can be made sensitive to competitive pressures on Oregon businesses ifother states and countries are not pursuing parallel paths to greenhouse gas reductions.
There are also 27 Category II recommendations in Part Two. Although individually smaller, theseactions add up to significant reductions. All actions combined could result in reversing thecontinued growth of greenhouse gas emissions generated from Oregon and set the state on a pathof declining emissions. However, if we continue “business as usual,” by 2025 Oregon’sgreenhouse gas emissions would be 61 percent higher than 1990 levels (today they are 15 percenthigher). On the other hand, if we accomplish reductions from all the actions recommended in thereport, our emissions would only be 7 percent higher than they were in 1990 and, trendingdownward, consistent with the Advisory Group’s recommended 2020 goal.
In addition to overseeing the implementation of the recommendations, there is a next set of tasksfor the Governor’s next Advisory Group – further development of some of the more complexrecommendations. This new group must also consider what Oregon must do to adapt to theunavoidable warming conditions from greenhouse gas emissions that have already accumulatedover the past centuries.

page vi | Oregon Strategy for Greenhouse Gas Reductions
Oregon’s RoleThe key to stabilizing CO
2 concentrations is limiting total world emissions for the 21st century.
What should be Oregon’s “share” of this global responsibility?
We are a small state, but part of a country that is the world’s largest consumer of fossil fuels andemitter of greenhouse gases. Both U.S. and Oregon emissions are growing rapidly. Oregon totalgreenhouse gas emissions in 2000 were about 68 million metric tons of carbon dioxideequivalent.4 About 84 percent of Oregon’s greenhouse gas pollution comes from CO
2 emissions
directly. Emissions from methane, primarily from cattle and landfills, contribute 7 percent ofgreenhouse gas pollution; nitrous oxide emissions, primarily from agricultural practices,contribute about 6 percent to the state’s greenhouse gas pollution. Manufactured halocarbons,which include hydrofluorocarbons, perfluorocarbons and suflurhexafluoride, account for theremaining 3 percent.
We recognize that Oregon’s contribution to both the problem and its solution is a small part ofthe whole. We can’t succeed without complementary activity on the part of states and nationswhose emissions dwarf our own.
Fortunately, many countries that have ratified the Kyoto Protocol and other U.S. states areembarking on their responsibilities in parallel with Oregon. For example, the agreement reachedamong the three governors of Oregon, Washington and California, who joined to form the WestCoast Governors’ Initiative on Global Warming, means the West Coast states will proceed inparallel and sometimes joint efforts. We also have other partners in the six New England statesand five eastern Canadian Provinces that form the Conference of New England Governors andEastern Canadian Premiers, who have committed to a regional “Climate Change Action Plan.”In addition, Connecticut, Delaware, Maine, Massachusetts, New Hampshire, New Jersey, NewYork, Rhode Island and Vermont are designing a regional cap-and-trade system for carbondioxide emission from power plants. Many of these states and Kyoto-signing countries are alsoour trading partners, so we may also be preserving access to these markets for Oregon’sbusinesses.
The Advisory Group has made its recommendations based on detailed technical and policyanalysis and a broad range of comments from citizens, businesses, academic institutions andother organizations. Now we must decide, as an Advisory Group, a Governor and a State,whether we are prepared to adopt the meaningful carbon reduction goals proposed and theactions that will be required to meet those goals. There couldn’t be more of Oregon’s futureriding on the outcome.
4 As a reference, Oregonians emitted almost 17 metric tons of CO2 per capita, compared to a world wide average ofabout 4 metric tones. On this basis, Oregon is producing about four times its “share.”

Governor’s Advisory Group On Global Warming | page vii
The Governor’s Advisory Groupon Global WarmingThe Advisory Group is made up of citizens and public officials who were asked by GovernorKulongoski to serve for the limited duration necessary to draft a Global Warming Strategy. TheGroup’s citizen members include representatives of the business community that both deliver anduse energy, farmers, environmentalists, scientists and others (a list of members is included inAppendix A).
Individual members of the Group may have conflicts of interest with respect to many of theactions it considered. Such conflicts are inescapable given that the subject matter (energyproduction and consumption, transportation, waste generation and management, etc.) is integralto the lives and businesses of all Oregonians. Moreover, the Governor wanted citizens whowould understand the science and the economic and technical issues involved, and who would besensitive to the impacts to Oregonians of the actions being considered. State agencies (such as theDepartment of Environmental Quality) that are directed by independent state commissions (e.g.,the Environmental Quality Commission) participated as ex officio members and anyrecommended actions are subject to subsequent commission policy determinations.
After reviewing public comments, the Advisory Group met to incorporate changes whereappropriate and decide on final recommendations to the Governor and other appropriate parties.The Advisory Group reached consensus on the strategies and actions it chose to recommend andadopted these final recommendations unanimously.
Some recommendations emerged as state administrative actions, while others will still needlegislative approval. Where there are fiscal or workload effects on state agencies, the Governorand agency heads will determine where these recommendations fit into priorities. The AdvisoryGroup expects that more complex actions will require their own task forces to work out detailsfor legislative consideration.
This report offers final recommendations to the Governor, to state agencies having statutoryauthority and to Oregonians generally. The Group is advisory only, and its recommendations willtake effect only if state and local governments, private businesses and other organizations believethey merit adoption.
Advisory Group members would like to acknowledge the financial assistance provided by TheEnergy Foundation of San Francisco. This assistance made it possible for the Group to rely onthe services of the National Policy Consensus Center and Oregon Consensus Program atPortland State University for logistical and facilitation support.

page viii | Oregon Strategy for Greenhouse Gas Reductions

Part One
ODOT ODOT Ken Niles

page 2 | Oregon Strategy for Greenhouse Gas Reductions
Governor’s Advisory Group On Global Warming | page 3
IntroductionGlobal warming is not just another environmental issue.
It’s not “just another issue,” period.
Absent decisive actions across the globe of the sort proposed in this report, the warming alreadyunderway is expected to lead to changes in the earth’s physical and biological systems that wouldbe extremely adverse to human beings, their communities, economies and cultures. These arechanges that we would have unintentionally brought upon ourselves, but that are also in ourpower to reverse. Our failure to return atmospheric accumulations of greenhouse gases (GHG)back to levels that will sustain historic climate patterns may lead to an Earth that is dramaticallyaltered and far less habitable within only a few generations. Figure 1 below shows historic andprojected greenhouse gas emissions for Oregon.
S E C T I O N 1
Oregon Strategy forGreenhouse Gas Reductions
Report to the Governor
The Governor’s Advisory Group on Global Warming — December 2004
“There is new and stronger evidence that most of the warming observed over the last 50 years isattributable to human activities.” (Intergovernmental Panel on Climate Change [IPCC], ClimateChange 2001: The Scientific Basis, Summary for Policymakers, p. 5)
“Greenhouse gas forcing in the 21st century could set in motion large scale, high-impact, non-linear, and potentially abrupt changes in physical and biological systems over the coming decadesto millennia ….” (IPCC 2001, Summary for Policymakers, p. 14)
“Here in Oregon we’re putting together a battle plan to reduce greenhouse gases – the primarycause of global warming . . . We are not going to wait for federal leadership. We’ve got too muchto lose if global warming continues unabated. And we’ve got too much to gain by being a leaderin climate solutions.”
Governor Ted KulongoskiMay 4, 2004

page 4 | Oregon Strategy for Greenhouse Gas Reductions
FIGURE 1Historic and Forecast Greenhouse Gas Emissions in Oregon
The black line that rises from 1990 to 2000 represents historical greenhouse gas emissions fromOregon. The orange line that continues beyond that represents a forecast of future emissionsunder a “business as usual” approach, which assumes we continue present activities (includingmany that now restrain greenhouse gas emissions), but take no additional special actions toreduce these emissions.
The vertical axis on the left is in million metric tons of carbon dioxide-equivalent (MMTCO2E).“CO2E” is the equivalent radiative impact of all the greenhouse gases expressed as tons of CO2. It islarger than that of CO2 alone, because it accounts for the radiative effects of other gases. The verticalaxis on the right shows differences from 1990 levels, with 1990 representing 100 percent of emissions.
The impacts of such changes on Oregon citizens, businesses and environmental values are likelyto be extensive and destructive. Coastal and river flooding, snowpack declines, lower summerriver flows, impacts to farm and forest productivity, energy cost increases, public health effects,and increased pressures on many fish and wildlife species are some of the effects anticipated byscientists at Oregon and Washington universities.
The means to arrest and reverse these effects are at hand or within technological reach. Many ofthem carry co-benefits that would justify acting on them without the impetus of global warming:
0
10
20
30
40
50
60
70
80
90
100
1990 1995 2000 2005 2010 2015 2020 2025
Year
MM
TCO
2 E
0%
10%
20%
30%
40%
50%
60%
70%
80%
90%
100%
110%
120%
130%
140%
150%
160%
170%
Perc
ent
of
1990
Em
issi
on
s
“Business-As-Usual”
1990 emissions level
Historical emissions Forecast emissions after 2000

Governor’s Advisory Group On Global Warming | page 5
positive economic returns on dollars invested in energy efficiency, energy price stability, andhealthier air and water. Others will cost us something up front for insurance against the deeplydisruptive and costly effects that we can expect absent any action. The earlier we take many ofthese actions, the less drastic they will have to be to achieve the same emissions reduction result.
But why is global warming an Oregon concern? We’re one medium-sized state among 50 statesand a world of nations, all emitting greenhouse gases. What can we do about it anyway? Whatdo we stand to lose if we do nothing? What do we stand to lose – or gain – if we take the issuehead-on?
These are the kinds of questions the Governor asked this Advisory Group on Global Warming tohelp answer, and this report is its response. It’s far from a complete one. The choices made overmany decades have led to the threat of global warming, and the solutions will take time anddeliberate effort. There will be difficult choices along the way and surprising, promisingopportunities as well. We will have the company of other knowledgeable and committedpartners. And while the challenges are formidable, so are our skills and spirit andresourcefulness.
This report tries to answer the Governor’s questions in stages. Part One, Section 2 (below) seeksto set out a pragmatic vision for how Oregon can address its global warming responsibilities and,in the process, seek investment and market opportunities for Oregon business and new jobs forOregon workers. Section 2 also discusses proposed goals, categories of actions to achieve thesegoals and criteria for selecting actions. Section 3 sets out the scientific context for this response,while addressing the general "What is it?" and "What does it mean to me?" kinds of questions.The Advisory Group also reviewed the consequences for Oregon and Oregonians of a globalfailure to act decisively.
Part Two contains the detailed set of recommended actions. The Conclusion sums up theAdvisory Group’s proposition to Oregonians.

page 6 | Oregon Strategy for Greenhouse Gas Reductions
S E C T I O N 2
Vision: Oregon Acts onGlobal Warming
2.1 Oregon’s “Fair Share” of Global Greenhouse Has Emissions Reductions
Scientists from the United Nations Intergovernmental Panel on Climate Change and othersestimate that global CO2 emissions need to be reduced by 60 to 80 percent below 1990 levels toavoid dangerous interference with the climate system. This target is based on limiting CO2 todouble the level that existed prior to 1750. Beyond this level, the risks of catastrophic climatechange rise steeply. Serious adaptation actions will still be needed, even if emissions are heldbelow this threshold.
The key to stabilizing CO2 concentrations below this threshold is limiting total world emissionsfor the 21st century. What should be Oregon’s “share” of this global responsibility? We are asmall state, but are part of a country that is the world’s largest consumer of fossil fuels andemitter of greenhouse gases. Both U.S. and Oregon emissions are growing rapidly.
Figure 2 below shows that Oregon has slightly lower CO2 emissions per capita than the U.S. as awhole, largely due to our hydro-electric endowment. While about 43 percent of Oregon’s electricitycomes from carbon-free hydroelectricity, about 42 percent comes from the most carbon-intensesource – coal (see Figure 6, Sec. 3.1). Oregon utilities are contemplating a mix of new resources (windgeneration and gas- and coal-fired power plants) that is typical for U.S. utilities.
In 2002, electricity sources for the U.S. as a whole emitted 1.34 pounds of CO2 per kWh. Oregonutilities emitted 1.05 pounds of CO2 per kWh. Figure 2 also shows per capita CO2 emissionsfrom fossil fuels for the world as a whole and a sample of other countries. Oregonians emittedalmost 17 metric tons of CO2 per capita, compared to the worldwide average of about 4 metrictons. On this basis, Oregon is producing four times its “share.”

Governor’s Advisory Group On Global Warming | page 7
FIGURE 2CO2 Emissions Per Capita From Fossil Fuels
Sources: United Nations, U.S. Department of Energy, Oregon Department of Energy
Other factors will play into global negotiations that will eventually have to allocate pollutionrights and reduction obligations. It is unlikely, however, that in any such negotiations the UnitedStates and its constituent parts – the states – would be allocated any reduction target that is lessthan the worldwide average, given our higher than average per capita emissions. More likely, itwould be some weighting of population, current emissions levels, cumulative greenhouse gasemissions and other factors.
Thus, a 2050 goal of reducing greenhouse gas emissions 75 percent below 1990 levels wouldlikely be the least demanding target we might merit. We will likely be called upon to deliver moresignificant reductions than this, rather than less.
2.2 Principles
The Advisory Group began with the following principles to guide the selection of goals andactions to reduce Oregon’s greenhouse gas emissions:
A. Oregon’s greenhouse gas reduction goals and solutions must be meaningful, firmlygrounded in science, and lead to effective reductions in Oregon’s greenhouse gasemissions, commensurate with the state’s share of the larger global problem.
World
India
China
Argentina
Italy
United Kingdom
Japan
Germany
Oregon
United States

page 8 | Oregon Strategy for Greenhouse Gas Reductions
B. Oregon should first begin with the most cost-effective solutions.
C. To the fullest extent possible, Oregon’s actions should be designed to serve both the long-term economic well-being of the state and the goal of climate stabilization.
D. Recognizing that there are always tradeoffs between a long-term investment strategy andnear-term costs and cash flow, the Advisory Group believes Oregon can and should be aleader – but the State can’t get so far ahead that Oregon’s businesses are not competitive inthe short term. The State will need some safety valves to relieve short-term competitivepressures if others aren’t living up to their responsibilities along with Oregon.
E. Oregon creates long-term economic well-being with an "investment strategy" that buysefficiency savings, new technologies, energy price stability and a competitive edge inmarketing – and profiting from – the tools developed and the lessons learned.
F. Oregon will take no actions that impair energy reliability.
G. Oregon will look for ways to support innovation, especially if it leads to marketableproducts and services.
H. Oregon will partner with other states, Canadian provinces, tribal nations and othernations, where doing so will enhance the effectiveness of state-level actions and their co-benefits for Oregonians.
I. Reducing the state’s greenhouse gas emissions won’t eliminate the need to adapt to thewarming climate that will result from changes already fixed in the atmosphere. Oregonmust next develop an adaptation strategy.
J. Oregon is committed to equity in allocating both costs and benefits of this enterprise.
2.3 Goals, Strategies and Implementation
The package of actions recommended by the Advisory Group represents no more than a downpayment on the long-term commitment the State – and nation – must make. Many other choiceswill be required of Oregonians and their successors over the next several decades to arrest andreverse the growth of greenhouse gas emissions that threaten our world. But isolated action,viewed out of context, will not persuade Oregonians to support the commitments and participatefully in implementing the actions, as they must, if we are to stabilize our climate at historicallyhabitable levels.
The Advisory Group offers its recommendations embedded in a pragmatic vision of goals, waysand means. This vision statement may seem deceptively simple, but the Advisory Group believesit can serve to anchor the full range of its recommendations.
2.3.1 Goals
The Advisory Group believes that setting goals for Oregon, expressed together with actions thatcan plausibly meet those goals over time, gives purpose and structure to the task of reducing

Governor’s Advisory Group On Global Warming | page 9
greenhouse gas emissions. The goals proposed here offer a pathway to climate stabilization thatrequires vigorous action, but also allows time for necessary individual and business adjustments.Oregon should adopt greenhouse gas emissions standards along with other states and localgovernments. A fuller discussion of the rationale for setting goals and for proposing these can befound in Integrating Action IA-1 in Part Two.
Near-term Goal: The Advisory Group believes the State should first seek to meet itsexisting Benchmark #76, that CO2 emissions not exceed 1990 levels. The Advisory Grouprecognizes that Oregon is unlikely to meet that benchmark by 2010 because Oregonexceeded the benchmark by 18 percent in 2000.
In Integrating Action IA-1 (see Part Two), the Advisory Group recommends, as a near-term goal, that by 2010 Oregon will arrest the growth of and begin to reduce the state’stotal greenhouse gas emissions, meeting or making measurable progress toward meetingOregon’s current CO2 benchmark.
Based on current scientific guidance and targets adopted by other states and countries, theAdvisory Group considers the following goals to be appropriate for Oregon:
Intermediate Goal: By 2020, Oregon’s total greenhouse gas emissions will not exceed alevel 10 percent below 1990 levels.
Long-term Goal: By 2050, Oregon’s total greenhouse gas emissions will achieve a“climate stabilization” level at least 75 percent below 1990 levels.
The Intermediate and Long-term Goals are predicated on the United States government and theglobal community achieving comparable goals roughly synchronous with Oregon’s efforts.Oregon can exercise leadership in setting goals and acting to attain them, understanding thatleaders need followers (or, better yet, partners) to accomplish the global goal.
Having long-term goals will facilitate a long-term Oregon investment strategy to achieve thosegoals, rather than a series of short-term controls and costs (see Section 2.4, An “Investment-Based” Solutions Strategy, below). Figure 3 shows the projected emissions compared to the goals.

page 10 | Oregon Strategy for Greenhouse Gas Reductions
FIGURE 3Historic and Forecast Gas Emissions in OregonShowing Proposed Goals
Along with the historical and forecast emissions shown in Figure 1, the horizontal lines in Figure 3above show the level of greenhouse gas emissions (a) in 1990, (b) at 10 percent below 1990 levels,and (c) at 75 percent below 1990 levels. These levels represent proposed goals for the State’sstrategy and provide a context for the reductions from the proposed actions. The 75 percentreduction of greenhouse gas emissions is what is required globally to stabilize atmosphericconcentration of greenhouse gases at 550 parts per million (ppm) of carbon dioxide. Althoughdouble the pre-industrial concentration, this level is assumed to avoid serious climate impacts.
2.3.2 Strategies
Implementation of the Advisory Group’s recommended actions will greatly reduceOregon’s greenhouse gas emissions. Collectively the actions can be summed up in thefollowing four common sense strategies:
Strategy One: Invest in Energy, Land Use and Materials EfficiencyThis is nothing new for Oregonians, who have often set the pace for the rest of the country inthe efficient use of these commodities. Oregon’s efficiency investments have almost always
0
10
20
30
40
50
60
70
80
90
100
1990 1995 2000 2005 2010 2015 2020 2025
Year
0%
10%
20%
30%
40%
50%
60%
70%
80%
90%
100%
110%
120%
130%
140%
150%
160%
170%
Perc
ent
of
1990
Em
issi
on
s
"Business-As-Usual"
1990 emissions level
75% below 1990 emissions by 2050
10% below 1990 emissions by 2020
MM
TCO
2E

Governor’s Advisory Group On Global Warming | page 11
generated positive economic returns, together with environmental and quality-of-lifedividends. Some payouts are quick (e.g., energy-efficient appliances); others may generatereturns over decades (e.g., “green” buildings and mass transit in urban areas).
Many investments of this type will also generate business opportunities as describedbelow in Section 2.5: The Economics of Addressing Global Warming: Costs, Investmentsand Opportunities.
Over the next 20 years, Oregon must, at a minimum:
• Equal the electric energy conservation savings achieved over the last 20 years,about 1,000 average Megawatts (aMW).
• Achieve comparable efficiency savings among natural gas and oil users.
• Offer more convenient and more efficient transit and other alternatives todriving cars and trucks, principally in urban areas along the I-5 corridor. Thoseareas have the ability to reduce the number of vehicle miles traveled and tripstaken through careful land use and transportation planning.
• Insist on products that: 1) use fewer materials and require less energy to produceand transport to market; 2) last longer; and 3) are designed to be reused andrecycled more easily and completely using less energy.
Strategy Two: Replace Greenhouse Gas-Emitting EnergyTechnologies With Cleaner TechnologiesThis strategy calls for reducing the amount of conventional coal, oil and natural gas usedin vehicles, homes and businesses unless technological means can be devised to lower theirgreenhouse gas emissions dramatically.
It requires focusing investment dollars (and government policies) on developing renewablegenerating technologies that today are not sufficiently advanced to take up the slack.
Higher marketplace costs of conventional, mostly fossil-fueled energy sources are alreadyupon us and are stimulating research and development. But new and more effectivegovernment policies – such as greenhouse gas emissions allowances and tradingmechanisms – will be needed to meet the proposed goals. No less critical will begovernment procurement policies that explicitly value low greenhouse gas content (alsoreferred to as “carbon content”), thereby creating a base market for these resources andsetting an example.
By using a variety of electric-hybrid and other technologies, Oregonians will have new gasand diesel cars and trucks that produce far less CO2 per mile traveled than existingvehicles. The transportation sector may ultimately rely on electric or hydrogen-poweredvehicles, but biofuels are available now and hold considerable near-term promise, not tomention economic opportunity for Oregon’s farmers.
page 12 | Oregon Strategy for Greenhouse Gas Reductions
The fossil fuel industries are exploring geological greenhouse gas sequestration (captureand storage) that could ultimately have costs comparable to other mitigation technologies.
Strategy Three: Increase Biological Sequestration (farm and forest carboncapture and storage)Oregon’s fields and forests are valued by Oregonians for economic, environmental andrecreational reasons, but they can and must perform an additional service. The AdvisoryGroup recommends actions to increase the amount of carbon that can be captured andfixed in new or restored forest and field growth and in the soil beneath. Decades ofclearing forests, turning the soil, and building cities and highways where there had beenundisturbed ground have both released large quantities of greenhouse gases and impairedthe land’s physical ability to take up and sequester excess gases. While we will continue towork the lands that must feed, clothe and shelter us, there are still land managementchoices that will restore much of this natural sequestration capability. Reforestation andconservation reserves in lands of marginal economic value are familiar tools. These usesmust be stepped up dramatically, encouraged and sustained with government policies andpublic investment dollars.
Strategy Four: Educate Citizens, Conduct Research and Develop TechnologyReversing the causes of global warming and adapting to its near-term effects will be multi-generational tasks for Oregonians. Success is more likely if succeeding generations ofOregonians are educated about causes and cures and how these will evolve over time.Oregon also will cope better if it enlists the expertise in its colleges and universities toeducate citizens and to conduct research into impacts and remedies that also can producemarketable products and services. Developing electrical and mechanical engineering skillswill be essential.
Oregon can benefit from taking the early initiative in addressing global warming withsuch tools. Economic and export opportunities may emerge, particularly in areas such asenergy efficiency, small-scale distributed renewables, and bio-sequestration techniques,where techniques and smaller-scale technologies can have broad application with lowercapital requirements. Developing good quality curricula on global warming for freshmanphysical science, chemistry and physics courses is also essential.
2.3.3 Implementation
The Advisory Group issued a Draft Oregon Strategy for Greenhouse Gas Reductions for publicreview on October 13, 2004. After three public meetings and a public comment period (October13 through November 15, 2004) the Advisory Group revisited the draft recommendations inlight of 250 public comments and modified them where appropriate.
The recommendations are now forwarded to the Governor and copied to the SustainabilityBoard, which can then offer its thoughts to the Governor.
Even after the Governor acts to accept, decline or defer the recommendations, the processdoesn’t end. For some recommended actions, the next step will be an interim task force focusing
Governor’s Advisory Group On Global Warming | page 13
on a specific measure and including a more targeted group of stakeholders along with state staff.
Finally, some actions will require legislative action. Some of this may come in the 2005 session,but more complex and far-reaching questions may not be ripe for legislative treatment until2007. This is to ensure that sufficient analytic work has been performed to gauge costs andbenefits and their distribution. It also will ensure that interested parties will participate as themeasure is designed and evaluated.
The Advisory Group appreciates that major actions with significant and widely distributedconsequences will require deliberation, not a rush to judgment. Given the imperatives of climatechange effects, the Advisory Group does not suggest indefinite delay, but strongly favors adeliberate, yet urgent process with access for all affected parties.
2.4 An “Investment-Based” Solutions Strategy
Many, perhaps most, of the actions considered by the Advisory Group look and act more like aninvestment portfolio than unrecoverable costs. That is, they require that the State and its citizensinvest financial — and political — capital in energy efficiency and new technologies. The neteffect will be both reduced emissions of greenhouse gases such as CO
2 and positive long-term
financial and quality of life returns to the State and to Oregonians.
To collect these benefits, Oregonians will have to be disciplined investors with a long-term investmenthorizon. Year by year state and private business investment dollars must be put into improving theemissions efficiency of Oregon’s economy. While some of these investments may not pay off for years,or in a few cases, even decades, many will recover their costs and pay dividends within only a year ortwo. Some may involve actions that would not have been taken except to contain the effects of globalwarming. Short-term needs and satisfactions may have to be deferred.
Advisory Group members understand there will be competing demands for these investmentdollars and political tradeoffs to be made. Political processes often yield to near-termconsumption over investment, whether expressed in popular government benefit programs ordemands for tax cuts. It will be necessary to distinguish and perhaps separate these capitalinvestments from the costs of day-to-day government and business operations.
Two examples from our own Pacific Northwest history are pertinent to choices facing us todayand illustrate this effect.
1) The Columbia River Hydropower System: In the 1930s, investment began in what hasbecome one of the largest hydroelectric power plants in the world with the energizing ofBonneville and Grand Coulee dams on the Columbia River. The projects were very costlyat the time. Concerns were expressed that they would be financial “white elephants,”producing far more electricity than the region could absorb or pay for. Roosevelt’s NewDeal Administration went ahead with them anyway, justifying them on other publicpolicy grounds: they would put people to work during the Depression; they would makethe central Washington desert bloom with agricultural products; and they would ease

page 14 | Oregon Strategy for Greenhouse Gas Reductions
navigation and river commerce inland past the Cascades of the Columbia, the fearful rapidsnow covered by the waters behind Bonneville Dam.
In the ensuing seventy years, the long-term financial benefits have paid back the initial invest-ment many times over, as some of the lowest power rates in the nation have supported theregion’s economic development. Today about 40 percent of Oregon’s electric power comesfrom this system at low and relatively stable rates that modulate swings in fossil fuel commod-ity costs. While we are still struggling to reconcile hydroelectricity with sustainable salmon andsteelhead populations, the hydroelectric system gets us over 40 percent of the way to climateneutrality in our electric power system.5
Several of the Advisory Group’s key recommendations involve developing a second generation ofrenewable resources: new wind, solar and biomass plants added to the existing hydroelectric baseto meet our energy supply needs while producing no greenhouse gases.6
2) Energy Efficiency Investments Under the Northwest Power Act of 1980: The secondexample is more contemporary. In 1980 the region decided that, as new electric generatingcapacity was needed, we would invest first in energy conservation – in reducing demand forpower – if that was less costly than building new power plants. We would do so, principally,by investing in more energy-efficient light bulbs and refrigerators and in set-back thermostatsthat lowered the heat when you weren’t home, then automatically raised it when you returnedfrom work. We invested in more efficient commercial lighting and industrial motors. Overallthe utilities in the Pacific Northwest invested some $2.3 billion between 1991 and 2002,resulting in savings of some 1,818 average megawatts (aMW) annually. That’s equivalent tothree large coal plants’ worth of electricity we have not had to generate. It came at a fractionof the cost of nuclear generation, gas, coal, or any other source, and at near-zero environmen-tal cost. The average real levelized cost of these savings was approximately $12 per MWh.This is about one-third the market price of electricity during this period.
That entire $2.3 billion investment is fully recovered in electricity bill savings about once every24 months.7 The Advisory Group proposes to rely heavily on Oregon’s ability to replicate thisinvestment and these returns again in the next 20 years, realizing 960 aMW in Oregon and aregionwide total of 3,000 aMW, at comparable investment levels and savings.
5 The hydropower system is, however, threatened by global warming, which is projected to reduce Cascade Mountainsnowpack by 50% or more by 2050 (University of Washington: “Effects of Climate Change on Water Resources inthe Pacific Northwest.” July 3, 2001). The snowpack serves as an extra “reservoir” for storing water to be usedthroughout the year. Potential increases in spring runoff would have to be spilled, rather than used to generate power.
6 Recent studies have evaluated the cost-effectiveness of a “Renewable Portfolio Standard” that would require at least20% of a utility’s supply come from renewable resources. In 2001 the U.S. Energy Information Administration(USEA), using generally conservative assumptions – stable fossil fuel costs, higher renewable costs – found virtually nocost difference between the first case (no RPS) and the second (20% RPS). Two other studies, by USDOE’sInterlaboratory Working Group and the Union of Concerned Scientists, using cost assumptions closer to marketconditions that have prevailed since 2001, both found the 20% RPS case produced lower consumer costs as well asconferring co-benefits such as more jobs and reduced local air pollution. For Oregon, the UCS study projected +1500more jobs and $620 million in consumer cost savings by 2020.
7 Per personal communication Tom Eckman, Conservation Resources Manager, Northwest Power and Conservation Council,September 16, 2004. This assumes an average value of the savings (i.e., the costs utilities avoided from reduced purchasesfrom the short-term wholesale power market) of $37/MWh (= 3.7¢/kWh). In 2001, when West Coast market prices forelectricity spiked to $250/MWh and higher, the savings realized in the Pacific Northwest were commensurately greater.

Governor’s Advisory Group On Global Warming | page 15
These investments to create lower energy costs for Oregon and Northwest businesses havealso created new jobs insulating houses, installing thermostats, and designing and buildingenergy-efficient windows and manufactured housing. Along the way Oregon companiesdeveloped markets in other states for those same windows and manufactured housingunits, bringing new dollars and jobs back into Oregon.
Today, if Oregonians had the option of driving more fuel-efficient cars that still met their needsand the option of driving them fewer miles to work or shopping, they would realize a similarreturn on investment when gasoline prices rise as they did in 2004.8 Citizens would be betterinsulated against the disruptions that such price spikes cause in Oregon’s economy, and thedollars saved could circulate within Oregon, creating more state jobs and goods.
This time the “public purposes” are different from those of other eras: not creating jobs in aDepression or saving energy in an oil embargo, but reducing emissions of CO2, methane andother greenhouse gases. They also include creating energy price stability and building economicopportunity for the next generation of Oregon workers and entrepreneurs.
The tools should look very familiar, however. They are tools for investing in energy efficiency —in homes and businesses, in the means of transportation, and in land use and transportationsystems design for our urban areas. They are also investments in a new generation of renewableenergy technologies — not in large hydroelectric dams this time, but in smaller, run-of-the-riverprojects, wind turbines, solar photovoltaic cells, and crops from Oregon farms that can beconverted to biodiesel fuels.
Some energy efficiency investments can be earning positive returns in two years or less. Somerenewable energy technologies, such as large wind, are competitive today with fossil fuels, sothose early returns will be positive also. Other investments will take longer to turn positive, asthe dams did, but they will immediately result in more stable energy costs for Oregonians, again,as the dams did.
In the larger process, Oregonians will discover products and services to be marketed to otherareas that are slower in responding to global warming threats as described in Section 2.5 below.
There will be other less intuitively obvious benefits. Lower emissions from power plants andvehicles will mean cleaner air in Medford, Bend, Portland and other communities. Not only willthere be more clear days for admiring Mt. McLoughlin, the Sisters and Mt. Hood, but there willbe healthier people to enjoy the view and fewer kids handicapped by asthma and otherrespiratory diseases.
Energy market competition from conservation and renewables can have the effect of loweringdemand for fossil fuels and, therefore, damping energy prices from those and competing sources.9
A future energy user who is relying on a mix of conservation, renewables and gas will be
8 Even before 2004’s price increases at the gas pumps, from 1999 to 2003 Oregon monthly household energybudgets were squeezed by average increased costs of 12% in electricity, 17% in natural gas, and 50% in gasoline(data compiled by The Oregonian from USEIA and other sources, September 11, 2004).
9 See, for example, U.S. Energy Information Administration Study SR/OIAF/2001-03, June 2001.

page 16 | Oregon Strategy for Greenhouse Gas Reductions
contributing to environmental values, and saving on energy not used due to efficiency gains, andpaying a lower rate for each delivered kilowatt hour (or therm of gas).
Where it seems the fairest and most efficient way to accomplish our goals – especially incapturing energy efficiencies in buildings and equipment – we rely on regulatory tools such asbuilding codes. We appreciate that regulation can be politically difficult to propose and sustain.We note, however, that over 40 percent of the 3,000 MW the region now is conserving is comingfrom building codes and appliance efficiency standards. These are the lowest cost savings beingcaptured day in and day out. Households save money directly on their energy bills and in lowercosts for the goods they buy. Oregon businesses save on operating costs and produce more cost-competitive products and services. Designed properly and applied consistently, regulatory toolscan contribute to a competitive “level playing field” among businesses. Each could make comparableinvestments to conserve energy, so that no one competitor can offer lower costs in the short term bydeferring these investments and the benefits they confer on the community as a whole.
2.5 The Economics of Addressing Global Warming:Costs, Investments and Opportunities
2.5.1 Overview
In any discussion of the economics of addressing global warming, it’s easy to get trapped in theunderbrush of near-term costs and to miss the forest of rational economic calculation of long-term savings. In some cases, those near-term costs are going to be higher, but often the costs willbe matched and more by the returns Oregon families and businesses will see directly. The savingsthat are captured as avoided costs of adaptation to a warmer, wetter and more uncertain worldmay be more substantial still.10
Near-term costs are further offset by helping Oregon businesses stay competitive in a worldmoving to greenhouse gas limits. Costs of recommended actions should also be measured againstthe economic opportunities that will open for Oregon businesses that develop goods and servicesfor sale to a world in the market for low greenhouse gas solutions.
Most activities we engage in as Oregon citizens and businesses – driving a car, turning on a light,disposing of garbage – result in emissions of greenhouse gases. Any serious proposal to reducethese emissions affects us all, and we need to understand its costs and benefits. This ischallenging for a set of actions that looks ahead fifty years. Much is unknowable: what fuelprices will do; what statutory constraints may be adopted; and what technology breakthroughscan mitigate costs. Once firm decisions have been made on actions, we can use computer modelsto predict costs and benefits (with the qualification that uncertainty increases the farther aheadwe look).
10 The effects of global warming on Oregonians and the costs we will bear in adapting to climate change are not justa function of what we do in one state. They also depend on the degree to which our leadership and actions arematched by leadership and actions across the country and around the globe.

Governor’s Advisory Group On Global Warming | page 17
It also may be useful for us to think about “cost” in more than one way. For example, there isthe “cost” of an investment we might make, whether in the stock market or in buying a moreefficient refrigerator. We pay an up front “cost,” but we recover that cost and begin to earn net“benefits” (e.g., savings on energy costs) if it is a good investment. Many actions proposed hereaccomplish both lower emissions and efficiencies that are cost-effective. That is, they will returnto consumers a net return independent of their value in reducing greenhouse gas emissions.
Other actions involve developing products and services that can be marketed outside of Oregon,as well as applied at home. As greenhouse gases are increasingly regulated by states, the federalgovernment and, through international agreements, Oregon can gain an economic advantage byselling mitigation actions we have developed to reduce Oregon’s emissions.
We incur a “cost” when we buy health or fire insurance. We don’t know if we’ll be sick or haveour house burn down, but we believe paying these “costs” is justified to mitigate our risk againstthose outcomes. We still shop for the lowest-cost insurance that will do the job, but weunderstand it’s a good decision even though it may not provide a return under all scenarios.We’re advised not to underinsure, so there’s enough coverage to rebuild our house or our health.
When we pay for building dams and levees to protect against devastating floods, we’re incurringa similar “cost” for a different kind of insurance, one that diverts the potential for catastrophicdanger and damage. There is a difference: we speculate that our house might burn down, but weknow floods will occur. We know that occasionally – every fifty to one hundred years – a trulycatastrophic flood will occur (for example, in 1996, 1948 and 1894). We pay an upfront costand get our return in the form of less destruction and lower costs to rebuild. We think it ismoney well spent.
The actions in this package are insurance that is similar in different respects to both examples.We are insuring against the potentially calamitous consequences of overheating the planet. Wecan only approximate their specific effects, geographic distribution and intensities; but sciencetells us that they are at least as likely as that hundred-year flood. We can choose to pay an upfront “cost” to mitigate against the worst of these effects by reducing our use of fossil fuels andthe emissions that are released. We want the lowest cost actions in our “policy,” certainly. Wealso want them to add up to an effective response.
The question for Oregonians is: Do we think these measures are a good value for our dollars?
2.5.2 Costs of Measures
The Advisory Group is recommending to the Governor a package of 46 actions across sevenareas of State, business and citizen activity. In most cases, staff has developed a preliminaryestimate of whether an individual measure is projected to be cost-effective to the consumer overthe effective lifetime of the measure.11 More than 60 percent of the proposed measures meet this
11 The summary tables at the front of each category of measures (e.g., Energy Efficiency) show, in two columns tothe right, the estimated savings in greenhouse gas emissions and a preliminary staff estimate of whether themeasure is cost-effective.

page 18 | Oregon Strategy for Greenhouse Gas Reductions
first test (or are policy choices without direct cost implications). Other measures may also proveto be cost-effective for their insurance value or when weighed against the costs of adaptation.
Some measures – developing renewable energy technologies or increasing forestation of under-producing lands – in many applications can be expected to yield commercial profits and jobs tooffset implementation costs.
Of the most significant (Category I) actions, two are constrained by law to be cost-effective. TheNorthwest Power and Conservation Council’s 20-year energy efficiency goals (incorporated inaction EE-1) must meet a test, established in federal law, of being cost-effective to the region (andin nearly all cases, to individual electricity consumers). The California state law establishing the“Pavley” auto tailpipe pollution standards (TRAN-1) requires that new cars be able to meet thetwin tests of low greenhouse gas emissions and cost-effectiveness to the purchaser.12 For theseand other recommended measures, the Advisory Group has adhered to this “investment”standard of cost-effectiveness to the buyer over the life of the measure or vehicle. Note also, thatif the energy-efficient appliance or auto purchase is financed, the added capital costs would beoffset by the consumer’s month-to-month savings.
The other Category I action with the greatest potential for cost consequences is the proposedgreenhouse gas allowance for electricity, gas and oil (GEN-2). Estimating the costs and benefitsof this measure depends on its design, on future energy markets and costs, on technologyevolution and on future regulatory actions. We have little control over most of this, but we canmodel different paths to our greenhouse gas content goal and select one that offers the greatestgreenhouse gas savings at the lowest cost and risk. For example, a least-cost path may be onethat allows utilities and other suppliers time to phase out old equipment and ramp in newrenewable and other technologies. An effective design may maximize the ability to tradeemissions savings and offsets with California and Washington, lowering compliance costs. Byrelying on energy efficiency and renewable technologies that are unaffected by fossil fuel marketsand price swings, compliance actions can minimize abrupt rate shocks to consumers and cost impactsthat could undermine the competitiveness of Oregon businesses. The design of a greenhouse gasallowance mechanism can be made sensitive to competitive pressures on Oregon businesses if otherstates and countries are not pursuing parallel paths to greenhouse gas reductions.
It is also true that many of the actions that could be required to meet a greenhouse gas contentallowance will be cost-effective, beginning with the energy efficiency actions recommended above(EE-1). Many of the wind, hydroelectric and biomass projects that could be used to comply withthe standard are cost-effective today and are being installed. We can also expect technologies thatare still higher-cost today, such as solar photovoltaics, to drop in price as production economiesof scale are achieved and technological gains are made.13 Well-crafted public policies such asRenewable Portfolio Standards can accelerate this effect by creating market demand thatencourages technological advances and cost gains. The nation and the Northwest have
12 California, AB1493, Pavley, 2002.13 When modern wind turbines were first being designed and installed in 1980, they offered about the same
unsubsidized output cost ($0.25/kWh) that unsubsidized photovoltaic solar generation offers today, supportingexpectations that similar output cost reductions can be anticipated. See also Footnote 6 for renewable energy costprojections from different informed analysts.

Governor’s Advisory Group On Global Warming | page 19
experience with this effect through development of auto, appliance and housing energy efficiencystandards that resulted in miles-per-gallon gains, more efficient refrigerators and thermally-efficient windows.
Because the cost and other consequences of a greenhouse gas content allowance are notknowable until a design has been developed and modeled against a range of future scenarios, theAdvisory Group recommends that an interim task force do the designing and modeling over thenext 12 to 18 months. Prior to the submission of any proposal to the 2007 legislature, allinterested parties will have a reasonable idea of how the allowance mechanism would work andwhat the cost and other outcomes should be.
All far-reaching measures such as these three will need to be revisited regularly by State officialsand legislators. Circumstances will change, new choices will emerge, market costs of energy willmove up or down, and adjustments will be needed to maintain a least-cost path.
2.5.3 Avoided Costs
No one likes paying more up front for an appliance, a car or a house. But as noted above, we’vebeen doing just that in Oregon and the Pacific Northwest for the last 20 years as we’ve boughtmore efficient appliances, cars and houses, installed insulation and better windows, orintroduced more efficient equipment in our stores and factories. They’ve paid back the extracost, on average, in about eighteen months from the date of purchase.
Avoided costs from efficiency gains are just the beginning. Slower growth in demand for powerand gas means less new transmission infrastructure – poles and pipelines – has to be built, savingmore cash. Competition from new efficiency measures and renewable technologies will act tohold down costs from competing fossil fuels.
Efficiency gains are exactly like having a share of your power coming in at a fixed price(renewables also possess this price stability attribute). So households, and especially businesses,avoid the uncertainty for a crucial cost input into their budgets and cost-of-goods. Any energy-dependent company can tell you about the cost of electricity price uncertainty whenunprecedented price spikes hit the West Coast as they did in 2001.
Then there are the avoided costs of coping with the physical changes global warming is alreadybringing: heavier rains, longer dry spells and more extreme storms. We think of those as “future”costs that we can discount (maybe they won’t arrive?). But we’re already starting to pay them inthe form of higher insurance premiums today, as insurers try to anticipate their liabilities forfuture loss claims. Companies that are susceptible to higher costs of doing business in a warmerworld are paying higher insurance premiums if they fail to address this business risk. Floodinsurance costs are rising in low-lying coastal and other storm-prone areas.
There’s one other aspect of avoiding costs that gets too often overlooked. It’s the value to Oregonof keeping dollars at home, circulating in our local economy, supporting new businesses(preferably ones that can export products and import more dollars). When we spend our limitedcapital on imported energy from the Middle East or Venezuela, on coal from Wyoming, on gas

page 20 | Oregon Strategy for Greenhouse Gas Reductions
from Alberta, and soon from overseas as liquid natural gas (LNG), it’s gone. Every dollarexported to buy non-local energy is like a little loss of muscle fiber from our collective economicbody. We have to compete in a muscular world economy, and we’re a little weaker each time wefill the gas tank.
2.5.4 Staying Competitive
Our major trading partners in Europe, Canada and Japan are already investing in new goods andservices to deal with global warming. We cannot stay competitive by standing still. If you’re amultinational doing business in the European Union or Japan (think Intel, Hewlett-Packard,Boeing, or Nike), you’re already working out your greenhouse gas reduction and tradingstrategies. This is particularly true now that the Kyoto Protocol on greenhouse gas reductionsbecame effective following Russia’s signature. All of Oregon’s major trading partners in Europeand Asia, plus Canada, will be doing business with consideration for the greenhouse gasemissions consequences of their actions. If trading with the United States results in a greenhousegas penalty, these countries may adjust the volume or value of their transactions. Conversely, ifOregon’s products and services come at a lower greenhouse gas cost, we could gain a tradingadvantage over states that are slower off the mark.
Oregon businesses will need to adjust to a Kyoto-constrained world or risk their overseasmarkets going to companies, states and countries that anticipated the greenhouse gas rules takingshape globally. As Canadian Ambassador Michael Kergin warned in speaking to a Portlandbusiness breakfast on December 8, 2004, “American businesses risk being shut out of manycommercial opportunities in Kyoto-compliant markets.”14 Kergin applauded the self-startingqualities of U.S. businesses that adapt their products and practices to the expectations of theircustomers, an attribute he said they must leverage to compete in a Kyoto-constrained world.
14 Quote from notes taken during Ambassador Kergin’s presentation.

Governor’s Advisory Group On Global Warming | page 21
The Kyoto Protocol
The Kyoto Protocol to the United Nations Climate Change Convention will becomelegally binding on its 130 Parties on February 16, 2005. The Protocol’s entry into forcemeans that from that date:
1) Thirty industrialized countries will be legally bound to meet quantitative targets forreducing or limiting their greenhouse gas emissions.
2) The international carbon trading market will become a legal and practical reality.The United States will not be able to participate in that market unless it elects toratify the Protocol.
3) The Clean Development Mechanism (CDM) will move from an early implementationphase to full operations. The CDM will encourage investments in developing-countryprojects that limit emissions while promoting sustainable development.
4) The Protocol’s Adaptation Fund, established in 2001, will start preparing to assistdeveloping countries to cope with the negative effects of climate change.
Under the Kyoto Protocol, industrialized countries are to reduce their combined emissionsof six major greenhouse gases during the five-year period 2008-2012 to below 1990levels. The European Union, for example, is to cut its combined emissions by 8 percent,while Japan will reduce emissions by 6 percent. The total cut in greenhouse gas emissionsis at least 5 percent from 1990 levels in the commitment period 2008-2012.
Only four industrialized countries have not yet ratified the Kyoto Protocol: Australia,Liechtenstein, Monaco and the United States. Together Australia and the United Statesaccount for over one third of the greenhouse gases emitted by the industrialized world.The 30 industrialized countries that have committed to individual, legally-binding targets tolimit or reduce their greenhouse gas emissions represent 62 percent of the greenhouse gasemissions emitted by the industrialized world, which is 32 percent of total global emissions.
2.5.5 Exploiting the New Markets
Business Week, in its August 16, 2004, cover story on global warming, argues that “Companiesthat pioneer low-emissions cars . . . or find cheap ways to slash emissions will take over fromthose who can’t move as fast.” What are some of those opportunities for Oregon businesses andentrepreneurs?
(A) Services
The Pacific Northwest pioneered energy conservation in the 1970s and ‘80s. TheNorthwest Power Act of 1980 directed us to buy the cheapest “electricity” first, even

page 22 | Oregon Strategy for Greenhouse Gas Reductions
(especially) if it came from efficiency savings. In the process, we developed expertise thatwe’ve marketed elsewhere in the U.S. Portland Energy Conservation, Inc. (PECI) startedlife as a City of Portland office, spun itself off as a private enterprise, and pioneeredcommercial building “commissioning” to verify that the new building controls and otherefficiency technologies would deliver savings as advertised. It now sells these servicesnationwide.
In Oregon and Washington, members of the International Brotherhood of ElectricalWorkers (IBEW) and National Electrical Contractors of America (NECA) are developingskills in photovoltaic equipment installation, sometimes by providing their services free toinstall solar panels at schools. Lane Community College in Eugene now trains renewableenergy technicians.
Large wind energy projects in Eastern Oregon are generating power at competitive andstable costs, paying royalties to farming families double-cropping their lands withwindmills, and raising rural tax bases. They’re also creating marketable skills atengineering firms like CH2MHill and law firms like Stoel Rives, both of whom now selltheir project development services outside Oregon.
Another play for eastern Oregonians is likely to be bio-sequestration services – a fiftydollar word for growing more trees and plants that can retrieve carbon from theatmosphere and hold it for long periods of time. They could also make money fromanimal manure from which methane can be retrieved and converted to electricity. Othersources include biomass crops, which can be burned for energy with zero net CO
2
emissions, and changing fertilizing and tilling practices to approaches that reduceemissions or allow soil uptake of carbon. As carbon limits are imposed around the globeon utilities and other companies, agricultural practices that can offset carbon emissionswill have growing market value.
Portland has an international reputation in urban design circles for being a city that takesplanning and quality of urban life seriously. A co-benefit, which is becoming a marketableservice, is that a city planned for efficiency is a city that can manage its greenhouse gasemissions. Portland and Multnomah County are working toward a goal of reducinggreenhouse gas emissions to 10 percent below 1990 levels by 2010. Urban design firmslike David Evans and Associates can leverage their contributions to Portland intocompetitive advantages elsewhere. Oregon architecture and engineering firms are learningto design “green” buildings that can earn national certification points and lead tocontracts inside Oregon and out.
The Climate Trust, an Oregon-based private non-profit organization, has created a serviceniche that uses CO
2 offset dollars from new power plants and other sources to fund
renewable energy, energy conservation, transportation savings, bio-sequestration andother projects that reduce greenhouse gas emissions.
As an example of how we can gain even when Detroit is slow to react, Portland stands tobenefit as the market for hybrid (gasoline plus electricity) cars grows in the U.S., fueled by

Governor’s Advisory Group On Global Warming | page 23
new greenhouse gas-reduction regulations being adopted by California (and recommendedin this Oregon Strategy). The major companies supplying these cars today are Toyota,Honda and Ford. The Port of Portland is the primary West Coast port of entry for Toyotaand Honda. More manufacturers and suppliers are needed.
(B) Goods
Oregon builders of windows and manufactured housing, to take two examples, werepushed to build their products to the higher efficiency standards set under the NorhtwestPower Act of 1980. Both industries found outside markets for those same products asother areas responded to higher energy costs in the 1990s.
Their counterpart today may be Shell Solar in Vancouver, Washington, whichmanufactures photovoltaic panels. Soon Shell could be using the silicon-producingcapability of firms like Wacker Siltronics in North Portland or other wafer manufacturersfrom the high-tech community.
As markets generally value “green” products more highly, there can be spinoff benefits forOregon Country Beef, wild (and sustainably-harvested) salmon, and the emerging Oregonorganic natural foods cluster. It’s no coincidence that Kettle Chips, with a state tax credit,assistance from Oregon Department of Energy and funding help from the Energy Trust ofOregon – innovative responses – installed the largest grid-connected solar energy facilityin the region on its factory rooftop in Salem this year.
Oregon firms like PPM Energy develop wind farms all over the country. A new product,Green Tags, was pioneered by the Bonneville Environmental Foundation in Portland. BEFsells Green Tags that are wind-based (supplied by PPM, BPA), solar-based (from developerGerding-Edlen’s Brewery Blocks and other solar installations), and even cow manure-based (from the Port of Tillamook’s waste-to-energy project) in 30 states and up intoCanada.
As the market for efficient products and processes heats up, the high-tech and softwareindustries on the West Coast all stand to profit if they anticipate where more precise andresponsive instruments and controls will deliver efficient energy results. Opportunitiesrange from home heating systems to interstate high-voltage transmission lines.
(C) Investment Opportunities
The Pacific Northwest was once the international leader in renewable energy technologyand applications. That was when we were investing in and developing the hydropowercapability of the region’s rivers and snowpack.
Renewable energy could again be a key economic development “cluster.” In addition todevising new efficiencies for the existing hydropower and transmission infrastructure,Oregon has wind, biomass and waste conversion opportunities awaiting smartexploitation.

page 24 | Oregon Strategy for Greenhouse Gas Reductions
Oregon isn’t positioned to sell anyone gas or coal conversion technology, but we could beleaders and net gainers if we move earlier than the competition to develop the renewableand co-generation technologies and siting services that can then be offered for sale. What’sneeded? First, a regional market that’s big enough and active enough to stimulateentrepreneurial activity and attract investment capital. Oregon by itself probably isn’t bigenough. But this is no time to be parochial. The states of the Pacific Northwest, plusBritish Columbia, are a respectable market with a good number of companies alreadydeveloping products for the renewable energy market. If we want them to stay here,creating jobs and wealth, we have to offer them an accessible West Coast market. We’llhave to work California into the strategy as well.15
Fortunately, our Governor has joined with these neighboring jurisdictions to establish aframework – the West Coast Governors’ Global Warming Initiative – with the shared goalof reducing greenhouse gas emissions West Coast-wide. Developing renewable generatingtechnologies and infrastructure, including transmission capacity, is on the common agenda.
Oregon, Washington and California will all need to do their part, starting with publiccommitments to purchase output, setting expectations for greater utility reliance onrenewables to meet load growth and replacement needs, and addressing regionalinfrastructure needs (e.g., transmission and integration services, expedited siting andpermits). The states will need to consider how regulatory and tax codes may be adaptedto encourage local industry development.
Oregon’s educational system needs to be supported and, in turn, needs to provide industrysupport by building basic and applied skills in energy efficiency and renewabletechnologies. Our universities already support resource evaluation (Oregon StateUniversity has wind resource expertise and the University of Oregon has solar expertise).Technology research, development and demonstration are relatively weaker here. Oneidea is establishing a regional “incubator” for technologies that are past laboratory work,but not yet ready for commercial prime time, something Oregon and Washington couldelect to collaborate on.
2.6 Partners
So, Oregon makes its contributions and investments. What difference can we make? We’re noteven one of the largest states in this country, and global warming is a global concern. If we makethese investments today, what’s to keep competitors in other states from tilting the playing fieldto take short-term advantage of Oregon businesses while they invest for long-term sustainability?
15 California has demonstrated the importance of local market stimulation when it became the world leader ininstalled windfarm capability in the 1980s. Today it has a 20% Renewable Portfolio Standard requirement for itselectric utilities, tax credits for citizens and businesses to install their own equipment and is considering commit-ting an additional $100 million in state funding to further buy down the costs of solar installations and to buildsolar manufacturing capability in the state.

Governor’s Advisory Group On Global Warming | page 25
These are all good questions that the Governor must be prepared to answer, and the AdvisoryGroup offers its help in doing so.
First, we’re not alone. The agreement reached among the three governors of Oregon,Washington and California means the West Coast states will proceed in parallel and sometimesjoint efforts. If our three states were a single nation, we’d be the seventh largest emitter of CO
2
from fossil fuels globally, so we are a player. Our emissions are significant, and our efforts toreduce them can and must be comparably substantial. The actions being proposed in thatprocess, which parallel our own, include joint procurement efforts for hybrid and low-emissions vehicles for state fleets, providing electric hookups at truck stops along the Interstate-5 corridor, and other actions where lower costs and greater benefits can be obtained throughthree-state coordination.
While many recommendations that the Advisory Group is making to the Governor areconsistent with the West Coast Governors’ Global Warming Initiative, the Advisory Group alsoexplicitly adopted the seven key recommendations from the “West Coast Governors’ GlobalWarming Initiative, Staff Recommendations to the Governors,” November 2004 (Appendix E):
1. Set new targets for improvement in performance in average annual state fleet greenhousegas emissions.
2. Collaborate on the purchase of hybrid vehicles.
3. Establish a plan for the deployment of electrification technologies at truck stops in eachstate on the I-5 corridor, on the outskirts of major urban areas and on other majorinterstate routes.
4. Set goals and implement strategies and incentives to increase retail energy sales fromrenewable resources by one percent or more annually in each state through 2015.
5. Adopt energy efficiency standards for eight to 14 products not regulated by the federalgovernment, establishing a cost-effective efficiency threshold for all products sold on theWest Coast.
6. Incorporate aggressive energy efficiency measures into updates of state building energycodes, with a goal of achieving at least 15 percent cumulative savings by 2015 in eachstate.
7. Organize a West Coast Governors’ conference in 2005 to inform policy-makers and thepublic of climate change research concerning the West Coast states.
Second, we have other partners in the six New England states and five eastern CanadianProvinces that form the Conference of New England Governors and Eastern CanadianPremiers, who have committed to a regional “Climate Change Action Plan.” Other states —New York, New Jersey, Delaware, Maryland — are stepping up to their responsibilities. Thestate-based initiatives have one other important quality: they are bipartisan. Both Republicanand Democratic governors are leading their states into this effort.

page 26 | Oregon Strategy for Greenhouse Gas Reductions
Third, our major trading partners in Europe and around the Pacific Rim are Oregon’s partners aswell. The nations of the European Union are considering ways that would allow individual U.S.states to participate directly with European countries in greenhouse gas credit trading programsif the states adopt comparable limits on emissions.
In fact, we should be less concerned about acting prematurely and far more concerned with beinginto the marketplace too late. Already other countries have established leads in importantcommercial areas: Denmark in wind turbines, Japan in solar cells, and Canada in fuel cells. Webelieve Oregon and the West Coast can compete in greenhouse gas technology markets, but notif we lag behind in our commitments at home (see Section 2.5 above, The Economics ofAddressing Global Warming: Costs, Investments and Opportunities).

Governor’s Advisory Group On Global Warming | page 27
Context3.1 A Primer on Global Warming
The Earth is kept habitable by gases in the atmosphere that capture part of the sun’s energy.Those gases are called “greenhouse gases” because of their heat trapping properties. At arelatively stable concentration, these gases are beneficial. However, human activity has produceda significant increase in greenhouse gases in the atmosphere since the beginning of the IndustrialRevolution in the mid-18th century. At this point, additional greenhouse gases are pollutants thatare destabilizing the earth’s climate with potentially catastrophic consequences.
Climate and WeatherWe all confuse the two words in everyday speech, usually with no dire effect. But forpurposes of dealing with climate change, the distinctions are crucial.
Weather is changeable day by day. Cool, wet Augusts are not unknown, nor are 70 degreedays in February. Local, transient phenomena produce local, transient weather effects. Canthe planet truly be warming if we’re having a damp and dreary summer?
Yes, because climate is “weather” averaged over time. Western Oregon’s climate typicallyconsists of cool, wet winters that build snowpack in the mountains, showery springs that lastthrough the Rose Festival in June, and dry, warm to occasionally hot summers that end aboutmid-October. Eastern Oregon is colder in winter and hotter in summer, while the coast is thereverse due to climate effects of the ocean and mountains.
There are larger temporal climate effects too. Most of us recognize that an El Nino disturbance willresult in drier than normal weather over the year, while a La Nina will be wetter than usual. Moreexpansively, there is a switch (known as the Pacific Decadal Oscillation) that seems to flip overevery 20 to 30 years, going from a drier-than-usual climate to a wetter-than-usual one.
None of these tells us if it’s going to rain this weekend. That’s weather.
Global warming is a climate effect, a rise in average temperatures, a background effect with whichshorter-term climate effects interact to produce weather. A hot year will tend to be hotter and a coolyear not as cool. A La Nina might produce more intense rain in April and less moisture in Augustthan it would have absent the effects of climate change. Global warming will have – is likelyalready having – such weather effects. Some of these are predictable: overall warmer weather yearround, less snowpack, melting glaciers, more extreme storms and so on. Some are far harder topredict. Will it rain more or less? On the same time table as now or will the pattern shift?
We can’t use today’s weather to judge in what ways climate change is already affecting us. Wecan look at global average effects and effects observed over the passage of years to see wherethe disturbing patterns of climate change are coming into focus.
S E C T I O N 3

page 28 | Oregon Strategy for Greenhouse Gas Reductions
There are growing numbers of dramatic signs that this is occurring. Every writer on the subjecthas a favored illustration. The snows atop Mount Kilimanjaro that inspired Hemingway’sfamous story will be gone within fifteen years after enduring for thousands. Robins are seen 250miles north of the Arctic Circle, where native Inuits have no word in their language for “robin.”Alaska permafrost is melting, buckling highways built atop it, while the Iditarod sled race muststart two weeks earlier to be certain of snow on the trail to Nome. Glaciers are retreating aroundthe world. The Arctic ice cap is 20 percent smaller than it was 25 years ago, and scientists predictopen seas at the North Pole within 50 years.
Closer to home, University of Washington scientists project a 50 percent reduction in Northwestsnowpack by the middle of this century. The glaciers in Montana’s Glacier National Park areretreating at an accelerated rate, and the forest fire season is arriving earlier and staying longer.
The Third Assessment Report, published by the United Nations Intergovernmental Panel onClimate Change (IPCC) in 2001, concluded that human-generated emissions have contributedsubstantially to the observed global warming over the last 50 years (see Figure 7 below). Since1990, the globe has seen the 10 warmest years on record. Since 1980, we’ve seen 19 of the 20warmest. The Earth is warming faster than any time in the past 1,000 years.
Global warming, or global climate change caused by greenhouse gas pollution, is arguably thesingle most serious threat to human civilization and even to the most robust and insulatedecosystems. Sources of greenhouse gas pollution from human activity have changed the globalclimate and will continue to change the climate for the foreseeable future. Our challenge is toslow, then reverse these global changes, so their near-term effects can be contained and thelonger-term life-threatening impacts do not occur.
The United Nations Framework Convention on Climate Change (UNFCCC), ratified by theUnited States in 1992, set an objective to meet the challenge:
The ultimate objective of this Convention and any related legal instruments that theConference of the Parties may adopt is to achieve, in accordance with the relevantprovisions of the Convention, stabilization of greenhouse gas concentrations in theatmosphere at a level that would prevent dangerous anthropogenic [human-induced]interference with the climate system. Such a level should be achieved within a time-frame sufficient to allow ecosystems to adapt naturally to climate change, to ensurethat food production is not threatened and to enable economic development to proceedin a sustainable manner. (UNFCCC, Article 2)
Many IPCC scientists believe that stabilizing the atmospheric concentration of carbon dioxide at 500to 550 parts per million (ppm), which would represent a doubling since 1750, would help avoid themost dangerous changes. However, that is a best estimate and assumes that sudden, unanticipatedshifts in climate conditions do not occur. In any case, we are on a track to reach this level ofatmospheric CO2 by around 2050 and to continue onward to a tripling or quadrupling of pre-industrial CO2 concentrations in a “business as usual” scenario. At these higher levels, we facedangerous, potentially calamitous effects on our economy and our physical environment.

Governor’s Advisory Group On Global Warming | page 29
Methane, nitrous oxide and halocarbons are significant greenhouse gases, but the pollutant ofgreatest concern is CO
2. Figure 4 below illustrates that about 84 percent of greenhouse gas
pollution in Oregon comes from CO2 emissions. The majority comes from burning fossil fuels,
such as coal, gasoline, diesel and natural gas. Emissions from methane, primarily from cattle andlandfills, contribute 7 percent to the state’s greenhouse gas pollution; nitrous oxide emissions,primarily from agricultural practices, contribute about 6 percent. Manufactured halocarbons,which include hydrofluorocarbons, perfluorocarbons and suflur hexafluoride, account for theremaining 3 percent.
Figure 4Oregon Greenhouse Gas Emissions Sources in 2000
Source: Oregon Department of Energy (see Appendix B)

page 30 | Oregon Strategy for Greenhouse Gas Reductions
Figure 5 shows the percentage of CO2 emissions from each major sector in 2000. CO
2 is the
predominant greenhouse gas emitted by Oregon. The largest source of CO2 emissions is from the
production of electricity that Oregonians use including electricity generated out-of-state forOregon consumers. Transportation emissions, mostly from cars and trucks, account for a closesecond. Fossil fuels used directly in the industrial, residential and commercial sectors are mostlyfrom burning natural gas and distillate fuel.
Figure 5Oregon’s CO2 Emissions from Fossil Fuels by Sector
Source: Oregon Department of Energy (see Appendix B)
Figure 6 looks in greater detail at the types of electricity generation that supplied Oregon’sconsumers in 2002. The generation mix in Figure 6 is based on power plants whose output isdedicated to Oregon utilities. Utilities can generate this output at facilities that they own, eitherin-state or out-of-state. It also includes cases where a utility purchases the output of a specificpower plant. For Portland General Electric (PGE), the total of such purchases and ownership isless than its total electric load. In that case, the calculations for the figure assume that theremainder of the electricity is supplied to PGE by a mix of resources from the Northwest PowerPool. Utility purchases from the Bonneville Power Administration (BPA) under long termcontracts are credited with the BPA resource mix.

Governor’s Advisory Group On Global Warming | page 31
Figure 6Electricity Generation Mix Supplying Oregon 2002
Source: Oregon Department of Energy (see Appendix B)
In addition to these greenhouse gases, changing patterns of land use and land cover are alteringthe atmospheric concentrations, especially from changes to tropical forests. Everywhere, soils,forests and other vegetation have the potential to remove CO
2 from the atmosphere. They also
contribute emissions of CO2, methane and nitrous oxide as forests are cut and as agricultural
practices disturb soils and add chemicals.
Emissions of sulfate aerosols, microscopic airborne particles released from burning fossil fuels,introduce a further complexity. These aerosols tend to reflect sunlight before it reaches the Earthand, therefore, have a cooling effect on the atmosphere. On the other hand, carbon black, orsoot, is also released from burning fossil fuels, and it can have a localized warming effect that isonly just beginning to be understood.

page 32 | Oregon Strategy for Greenhouse Gas Reductions
Scientific UncertaintyCritics of efforts to contain global warming often argue that the science is “uncertain.” Ofcourse all science is “uncertain” in that it is subject to challenge by new evidence orinterpretation. The “scientific method” requires that challenges to an assertion orhypothesis must be based on data and analysis that are peer-reviewed and criticallyexamined by other scholars with expertise in the same field to see if it stands up toscientific scrutiny.
We rely on the “greenhouse effect,” a phenomenon not seriously disputed in any academicinstitutions, to maintain the habitability of the earth. This effect is the result of a layer ofgases in the upper atmosphere that surrounds the earth. This necessary layer traps, asheat, some of the solar energy that enters the atmosphere, maintaining a temperaturerange within certain optimal limits that sustains life on the planet as we know it. Withoutthis effect, scientists estimate that temperatures would be over 50 degrees F. cooler, toocold to be habitable. Conversely, too thick a “blanket” of these greenhouse gases canoverheat the surface of the earth and affect habitability.
Skeptics of global warming sometimes imply that “uncertainty” is the same as a 50/50possibility that global warming is either occurring or not. Even if this were true, a 50%chance that the world would see some of the likely impacts scientists are forecastingwould merit a determined response. But the inference is both misleading and untrue.
An overwhelming majority of the world’s climate scientists are finding a causal linkbetween growing concentrations of CO2 and other greenhouse gases generated fromhuman activity (fossil fuel and other sources) and a warming of the planet – beyond levelsknown to prevail in pre-industrial times. These scientists serve on the IntergovernmentalPanel on Climate Change (IPCC), assembled by the United Nations from leadingacademic institutions around the globe.
Considerable uncertainty remains over the timing, distribution and potential severity ofclimate change on storm activity, sea level rise, forest health, water supplies, tropicaldisease propagation and other terrestrial effects. These effects could as easily be moresevere, or occur more rapidly and abruptly, as less severe and slower to gather. Ascomputer models become more refined, we can expect to understand in greater detail thetiming and distribution of effects. What is clear, however, is that the more greenhouse gasconcentrations accumulate, the more we will be affected by these changes.
Climate science asks that we apply probabilities to complex, long-term effects and adoptpolicies in response that must span decades. For example, Climate Change 2001: TheSynthesis Report by the IPCC gives 66 percent to 90 percent confidence in data that showthat there were higher maximum temperatures and more hot days over land areas in thelatter half of the 20th century, but it has 90 percent to 99 percent confidence that the globewill see such changes during the 21st century. It also has 90 percent to 99 percentconfidence that there were and will be higher minimum temperatures, fewer cold days,fewer frost days, and a reduced range of temperature changes from day to night over landareas. We must learn to work with such probabilities, acknowledge both the evidence andthe remaining uncertainty, and focus on solutions.

Governor’s Advisory Group On Global Warming | page 33
When global climate change models incorporate the effects of increased concentrations ofgreenhouse gas pollution, aerosols and cyclic changes in the sun’s output, the models mostclosely recreate the past climate history and give us most confidence in future estimates. While allthree components play a role in our climate, greenhouse gases are now the major determinant.
Figure 7
Figure 7 above demonstrates the relationship between natural and anthropogenic (human-generated)sources of climate variation. Credible forecasts require modeling both sources of variation. In theperiod after 1960, most of the modeled variation is man-made, rather than natural. The combinedmodel (c) using both sources of variation closely tracks observed climate changes.Source: The Third Assessment Report of the Intergovernmental Panel on Climate Change,“Climate Change 2001: The Synthesis Report, Summary for Policymakers,” p.7.
Figure SPM-2: Simulating the Earth’s temperature variations (°C) and comparing the results to the measured changes can provide insightto the underlying causes of the major changes. A climate model can be used to simulate the temperature changes that occur from bothnatural and anthropogenic causes. The simulations represented in the band in (a) were done with only natural forcings: solar variation andvolcanic activity. Those encompassed by the band in (b) were done with anthropogenic forcings: greenhouse gases and an estimate ofsulfate aerosols. And those encompassed by the band in (c) were done with both natural and anthropogenic forcings included. From (b), itcan be seen that the inclusion of anthropogenic forcings provides a plausible explanation for a substantial part of the observed tempera-ture changes over the past century, but the best match with observations is obtained in (c) when both natural and anthropogenic factorsare included. These results show that the forcings included are sufficient to explain the observed changes, but do not exclude thepossibility that other forcings may also have contributed.

page 34 | Oregon Strategy for Greenhouse Gas Reductions
Complexity and Modeling Climate ChangeThe physical systems that shape our climate are staggeringly complex. Computer modelscan begin to simulate this complexity and predict the future, but in broad rather thandetailed terms. Current models of climate cause and effect are now delivering usefulresults at the global level. More localized effects – such as storm activity in the PacificNorthwest – are cautionary, but still imprecise. This is because local climate is affectednot just by global shifts in temperature regimes, but by the interactions of those changeswith local topography, ocean currents and heat exchanges.
Depending on how global heat exchangers (ocean currents and winds) are altered, theNorthwest might see more weather systems coming in from the Pacific (therefore, wetterweather) or from Alaska and Canada (more storms bringing less moisture). Moredramatic changes in the globe’s engines of heat exchange could bring weather patternsthat are largely unpredictable locally, except that as more heat is moved about the earth,there likely will be more intense storms and other weather events.
Since 1958, an observatory on Mauna Loa, Hawaii has measured atmospheric CO2
concentrations. Based on data from polar ice cores, the pre-industrial concentration was about275 parts per million (ppm). In March 2004, the atmospheric concentration reached 380 ppm.Until recently, the annual growth in the CO2 level was less than 2 ppm. For the last two years ithas been about 3 ppm. Because the immediate increase in the rate is not understood, it is notpossible to know how long concentrations will continue to increase at this higher rate.
About half of annual human CO2 emissions (which include the burning of tropical forests) are
absorbed by terrestrial plants and oceans. This absorption is also referred to as a “carbon sink,”or bio-sequestration, as mentioned earlier. It includes physical and biological processes in theupper layer of the oceans. It also includes re-growth of trees in the eastern U.S. and Europe andexpanding Siberian forests from changes in precipitation and temperature. It appears, however,that sinks are not taking up CO
2 as fast as they were. In any case, uptake is not increasing to
compensate for increased emissions. Science is finding the potential for serious adverseconsequences to ocean life from CO
2-induced changes in water chemistry.
The IPCC projects that CO2 concentrations will rise to between 450 and 550 ppm by 2050 and
will continue to increase until the international community agrees to change worldwideemissions. The increase in CO
2 emissions since 1750 has not been exceeded during the past
420,000 years and likely not during the past 20 million years.
Greenhouse gases affect global warming on long time scales, both because of their lifetime andthe long time it takes the atmosphere to reach equilibrium with the warming effect of the gases.Many greenhouse gases remain in the atmosphere from many decades to centuries. Achieving astabilized concentration level requires significantly reducing emissions over a long period. Evenon a path to significant reductions, carbon dioxide concentrations and temperature continue torise for centuries after emissions peak and begin to be reduced. Temperatures will also continue

Governor’s Advisory Group On Global Warming | page 35
to rise even after the concentration has stabilized at a new level, such as double CO2
concentrations at 550 parts per million. Even under the reduction scenarios depicted, we shouldexpect impacts at a scale that will require adaptation as well as mitigation actions.
Given the path we are on, the IPCC projects that global average temperatures will rise frombetween 1.4˚Celsius to 5.8˚C (2.5˚Fahrenheit to 10.4˚F) by 2100. While there is uncertaintyabout the specific consequences of global warming in the Northwest, scenarios from variousglobal climate change models show the types of changes we could expect to see within the nextfew decades. The Scientific Consensus Statement on the Likely Impacts of Climate Change onthe Pacific Northwest (see Appendix C) states, with intermediate certainty, that the averageannual temperature in the region will increase by 2.7˚F by 2030 and by 5.4˚F by 2050, withconsequences outlined below.
3.2 The Costs and Consequences to Oregon of a “Business as Usual” Strategy
Dr. Thomas Karl of the National Atmospheric and Oceanic Administration and Dr. KevinTrenberth of the National Center for Atmospheric Research published a paper in the December5, 2003 issue of Science warning that, on our current course, “the likely result is more frequentheat waves, droughts, extreme precipitation events and related impacts [such as] wildfires, heatstress, vegetation changes and sea-level rise.” A 2001 report from the National ResearchCouncil says greenhouse warming and other human alterations of the climate system mayincrease the possibility of large, abrupt and unwelcome regional or global climatic events.Researchers do not know enough about such events to predict them accurately, so surprises areinevitable.
In the Northwest, scientists at Oregon State University, the University of Washington and otherstudy centers have already observed measurable warming. The Institute for Natural Resources atOSU hosted an all-day symposium in June 2004, “Impacts of Climate Change on the PacificNorthwest,” to solicit guidance from the region’s own cadre of qualified climate and resourcescientists. The objectives included pooling what is now known about state-level and regionaleffects and identifying critical gaps in our knowledge. The symposium resulted in the ScientificConsensus Statement on the Likely Impacts of Climate Change on the Pacific Northwest.
The Climate Impacts Group of the Joint Institute for the Study of the Atmosphere and Ocean atUW reports that, over the last century, the regional average temperature increased by 0.8˚C(1.5˚F). Precipitation has increased both east and west of the Cascades. East of the Cascades, theincreases are dominated by changes from April to July. West of the Cascades, the largestincreases are in November, which has overtaken December as the wettest month. Whileprecipitation has increased, there has been a decline in snow water equivalent in the spring.Likewise, the timing of the peak snowmelt has advanced 10 to 40 days earlier in most of theWestern United States over the last 50 years, according to Dr. Edward Miles of the ClimateImpacts Group. Likely specific impacts are summarized in the next sections.

page 36 | Oregon Strategy for Greenhouse Gas Reductions
3.2.1 Water. Warmer temperatures will lead to less snow pack on the mountains in the winter,which would mean less water available later in the summer. A study by the ClimateImpact Group indicates the April 1 snowpack in the Cascades declined about 50 percentfrom 1950 to 2000. The largest losses are at the lower elevations, consistent withincreased warming. Scenarios of future climate change show a further decline by 2090that could reach 72 percent below the base period of 1960 to 1990. This could reducesummertime stream flows by 20 to 50 percent, according to an article in Science(February 20, 2004, p. 1124). Peak flows will occur four to six weeks earlier than present.This will increase the risks of both winter and spring floods and summer droughts. Inparticular, rainfall-dominated rivers in the low-lying basins west of the Cascades wouldlikely see increased flooding from more rain-on-snow events.
Earlier melting is expected to change the timing of water in the rivers, which will affect fishand wildlife and commerce on the river. Lower summer flows would reduce water forirrigation, especially in Eastern Oregon where irrigation districts rely on melting snow tosustain rivers through the summer and to refill reservoirs. Lower summer flows would alsoincrease the impacts of water pollution or require more restrictions on discharges into rivers.
In addition to increased winter runoff, streams and rivers are likely to be affected by moreintense storms. Both will increase the peak surge in rivers, which increases erosion andflooding. Increased storm intensity would affect smaller and urban drainages more thanlarger streams and rivers. Increased erosion can reduce available farmland, create hazardsand difficulties in navigable waterways, and harm fish and wildlife.
Warmer water temperatures will harm native species such as salmon and could interferewith the life cycle of all fish, as could a change in the timing of runoff and precipitationgoing into rivers. For example, the Climate Impacts Group reports that the migratingsmolt stage is when salmon are most vulnerable to climate variations. The timing ofarrival in the coastal waters plays a big role in their survival, and changes in water flowfrom climate variability can change that timing. Climate factors also influence the type,distribution and abundance of predators, as well as the salmon’s food supply in estuariesand the ocean.
Changes in the timing and volume of stream flow in the snow-melt dominated riverscould have economic impacts on the hydropower system. If climate change decreases thesummer flow at the same time rising temperatures increase demand, both locally and inCalifornia, then the price of summer power could rise substantially. On the other hand,the price of winter power could drop as warmer temperatures decrease demand forheating while more precipitation as rain increases the supply of hydropower.
The Climate Impacts Group projects that precipitation will increase above that of the1990s by about 7 percent by 2050, but it has less confidence in that projection, which isbased on the combined results of eight climate change models. There will likely be largeryear-to-year variation in precipitation.

Governor’s Advisory Group On Global Warming | page 37
On the other hand, some models suggest that as Arctic ice cover diminishes, storms willtend to track further north at key times of the year and the Pacific Northwest could seereductions of precipitation of up to 40 percent. Some 20 percent of the ice cap over theNorth Pole has melted since 1979, according to Dr. Kelly Falkner at Oregon StateUniversity. If the current rate of loss of the Arctic ice cover continues, the summertimecover could disappear by 2050.
There is little or no room for growth in supply in the regional reservoir storage system.According to Dr. Miles, the regional system was designed on the assumption that about70 percent of the regional storage would be snow pack. Consequently, we have the abilityto store behind dams only about 30 percent of the annual average flow. It would be hardto increase that storage. The level of water scarcity is relatively new. Demands on watersystems are growing, but supplies remain essentially fixed. There is less margin of safetyavailable to cope with the unexpected.
3.2.2 Human Health. Scientists expect a higher increase in human mortality due to highertemperatures, even though there may be a decrease in cold-related illnesses and mortality.Abnormally high temperatures in Europe claimed more than 20,000 lives in August 2003.Another potential threat is from changes in regional diseases when vectors, such as insectsthat live or thrive in warmer climates, migrate northward.
3.2.3 Agricultural Production. Changes in temperature, precipitation, water availability and soilmoisture will affect the distribution and productivity of crops. They will also increase theprevalence of diseases and pests. Although Northwest agriculture will probably be able toadapt to any changes with the first doubling of CO2, adaptation will likely be costly. Dr. EbanGoodstein and Laura Matson of Lewis and Clark College suggest, in an initial estimate, thatthe lost value of irrigation water could range from $465 million to $2.4 billion. They cautionthat the estimate should be considered illustrative, not predictive.
3.2.4 Oceans and Coasts. The IPCC’s most recent mid-range estimate is for an average rise in sealevel of 9 to 88 cm (4 inches to 35 inches) by 2100. Recent studies of Greenland glaciersindicate greater instability than previously expected. This indicates that average global sealevel rise may be close to one meter this century, the high end of the IPCC predictions.
This sea level rise could cause severe disruption for ecosystems and people along the coast.Likely effects include increased coastal erosion, both from sea level rise and increasedwave height. The Climate Impacts Group notes that the increased frequency of stormsurges may be more significant for low-lying areas than sea level rise alone.16 Likewise,increased storms could lead to saturated ground and more slope failure in coastal bluffsand hills. Impacts would vary along the Oregon coast because of the variation betweenrocky shores and sandy beaches and because the southern part of the coast is rising due to
16 Scientists and engineers in the United Kingdom have estimated that by 2080, “hundred-year” floods could beoccurring every three years, potentially affecting 3.5 million people in low-lying areas and inflicting costs in thetens of billions of pounds annually. Large numbers of properties would become uninsurable. (David King, Chief ofthe Office of Science and Technology, United Kingdom, quoted in Science Magazine, January, 2004, p 176).

page 38 | Oregon Strategy for Greenhouse Gas Reductions
geological forces. To the south, that coastal rise is offsetting initial sea level rise. However,relative sea level is rising between Florence and Astoria.
According to Dr. Roger Samuelson at Oregon State University, global climate change islikely to change the local coastal ocean circulation and ecosystem and regionalmeteorological conditions. There would be both direct and indirect effects from globalwarming on regional winds in terms of mean wind direction and, hence, waves; inaddition, warmer temperatures would result from the enhanced greenhouse effect. Winds,stratification of water levels and currents are extremely important for coastal habitat.
Concurrently, climate change will produce a different fish community in the ocean watersoff the Northwest coast. This fish community may not support large salmon populationsor other commercial species, according to Dr. Robert Emmet at the National Oceanic andAtmospheric Administration Northwest Fisheries Science Center. Dr. Goodstein and Ms.Matson estimate that economic damage from salmon population decline due to globalwarming will range from $359 million to $7.2 billion by 2050. Given other influences onsalmon productivity, the Climate Impacts Group notes that future changes in salmonpopulation and distribution are speculative; it is clear, however, that a warmer climate andlower summer stream flows can be expected to further affect the stocks adversely.
3.2.5 Forests. Forests are expected to experience stress as well. Tree growth is likely to belimited by drier summers, and the possible increase in wildfires, pests and disease aresignificant threats. At higher elevations there will be loss of alpine habitat.
In the near term, increased levels of CO2 may act as a fertilizer. Along with possibly
increased precipitation and slightly warmer temperatures, tree growth may increase.However, as forests become denser under favorable initial circumstances, they willdemand more water and, therefore, will become even more vulnerable to stresses fromincreasingly dryer, warmer summers and from climate variability.
The Climate Impacts Group points out that increases in summer temperatures withoutincreases in precipitation would result in greater potential evapo-transpiration anddecreased soil moisture. That would result in increased stress and decreased productivity,which would overwhelm any benefit from increased CO
2 fertilization of trees.
Warmer temperatures will also favor pests and disease. As the climate continues to changeand become more severe, the forests will become even more susceptible to variableclimate. Larger and more intense forest fires are a likely result.
Dr. Ron Neilson, U.S. Department of Agriculture Forest Service, reports that there havebeen high fluctuations in wet-dry climate cycles for the last 30 years in the Northwest.Climate change may increase the annual and decadal variability of precipitation. Heconcludes that climate variability, far more than fire suppression, has led to the suddenrise and severity of wildfires in recent years. In fact climate variability is the primarydeterminant of fire occurrence, location and timing. Fuel buildup from previous firesuppression exacerbates fire intensity, but not its occurrence, according to Neilson.

Governor’s Advisory Group On Global Warming | page 39
3.3 Mitigation and Adaptation
The Advisory Group distinguishes between “mitigation” of greenhouse gas emissions (actionsthat will reduce emissions and their warming effects) and “adaptation” to global warming(those actions necessary to cope with the warming effects that are already unavoidable). Nearlyall the actions included in this Strategy are mitigation actions intended to arrest and reverse thegrowth of such emissions, eventually reducing them to levels compatible with historically stableglobal climate patterns. Mitigation is generally afforded highest priority by scientists, given thepotentially calamitous consequences to the planet of unrestrained warming.
However, Oregonians and their counterparts in other states and countries will also faceadaptation questions, even if the mitigation actions are all adopted and implemented vigorously.This is because the accumulation of CO
2 and other greenhouse gases in the atmosphere has
grown significantly from levels generally associated with sustainable climate patterns; and, asdiscussed above, global temperatures are already rising and will continue do so for the nextseveral decades, even with deliberate and effective mitigation.
Since it is unrealistic to propose that modern industrial societies will be able or willing to endfossil fuel consumption abruptly and live with the ensuing social and economic disruptions,most scenarios assume continued emissions and accumulation of greenhouse gases well into thiscentury. Under the most optimistic assumptions, accumulations level off at between 450 partsper million (ppm) and 550 ppm by mid-century before effective mitigation – if it is vigorouslyand effectively pursued – begins to reduce concentrations. If this is the case, then Oregoniansand others will be adapting to the effects of warming for several generations to come.
These effects on Oregonians, discussed elsewhere, may include: more frequent and more intensefloods, forest fires and sea level rises that could threaten low-lying coastal communities.Additional effects will likely include altered habitats and changes in wildlife species distribution;more constrained water supplies (affecting hydroelectricity generation); warmer, wetter winters;hotter, drier summers; and heightened exposure to diseases now largely confined to the tropics.All of these effects and more will require adaptation.
If only Oregon and a few other jurisdictions act to mitigate emissions, the adaptation challengegrows commensurately and, eventually, beyond our capacity to adapt. The Advisory Group’smitigation strategy assumes that Oregon does not act to mitigate alone, but as one of a growingalliance of states and nations rising to this challenge.
The Advisory Group believes the next task, once Oregon has determined its near-termmitigation course, will be to identify adaptation actions, set an adaptation strategy andimplement it. This task is beyond the charter of this Group, but final recommendations includeencouraging the Governor to assemble a successor group of citizens and government agencies totake on this next great challenge.

page 40 | Oregon Strategy for Greenhouse Gas Reductions

Governor’s Advisory Group On Global Warming | page 41
Part Two

page 42 | Oregon Strategy for Greenhouse Gas Reductions

Governor’s Advisory Group On Global Warming | page 43
Introduction to Recommended ActionsThe Advisory Group’s list of recommended actions fall under seven major areas:
• Integrating Actions (IA)
• Energy Efficiency (EE)
• Electric Generation and Supply (GEN)
• Transportation (TRAN)
• Biological Sequestration (BIOSEQ)
• Materials Use, Recovery and Waste Disposal (MW)
• State Government Operations (GOV)
Actions are also grouped as Category I or Category II as follows:
Category I: Significant Actions for Immediate State Action. These actions promisesignificant greenhouse gas savings (usually greater than or equal to 0.25 million metrictons/year of CO
2 or equivalent savings); are technically feasible today; and are often the
most cost-effective first actions to be taken.
Category II: Other Immediate Actions. These actions make sense for Oregon to undertakeimmediately. In most cases the greenhouse gas savings are less significant, but costs arealso proportionately lower and many actions are cost-effective now.
Each specific action is identified with an abbreviation denoting the action area and a number forreference ( e.g., IA-1). Category I and State Government Operations actions are listed below. Afull discussion of Category I and II recommended actions under the seven major areas follows.
S E C T I O N 1

page 44 | Oregon Strategy for Greenhouse Gas Reductions
Table 1Category I and State Government Operations
Integrating Actions
IA-1 Recommend the Governor adopt near-term, intermediate and long-term greenhouse gas emissions goals for Oregon.
IA-2 Urge the Governor to renew the charter of the Advisory Group onGlobal Warming (or a successor body) to continue the Advisory Group’sunfinished agenda.
IA-3 The Oregon University System should develop strategic and targetedresearch, development and demonstration (RD&D) programs forgreenhouse gas reduction technologies.
IA-4 The Advisory Group should work with state agencies, colleges anduniversities, schools, non-profit organizations and businesses todevelop a global warming education program that will provideinformation and outreach to the public.
Energy Efficiency
EE-1 Meet the Northwest Power and Conservation Council goal ofimplementing cost-effective electricity efficiency measures for electricusers and an equivalent goal for natural gas users.
Electric Generation and Supply
GEN-1 Increase the renewable content of electricity.
GEN-2 Recommend the Governor create a special interim task force toexamine the feasibility of, and develop a design for, a load-basedgreenhouse gas allowance standard.
GEN-3 Support Oregon PUC’s review of rules and tariffs for renewable andcombined heat and power facilities.
Transportation
TRAN-1 Convene an interim task force to recommend a proposal for theEnvironmental Quality Commission or the Governor and theLegislature to adopt emission standards for vehicles.
TRAN-2 Integrate land use and transportation decisions with greenhouse gasconsequences.
TRAN-3 Promote biofuel use and production.

Governor’s Advisory Group On Global Warming | page 45
Biological Sequestration
BIOSEQ-1 Reduce wildfire risk by creating a market for woody biomass fromforests.
BIOSEQ-2 Consider GHG effects in farm and forest land use decisions.
BIOSEQ-3 Increase forestation of under-producing lands.
Materials Use, Recovery and Waste Disposal
MW-1 Achieve the waste generation and recycling goals in statute.
MW-2 DEQ should develop guidance to clarify alternative final coverperformance at larger landfills: Demonstrate control of gas emissionscomparable to geomembrane cover.
MW-3 Provide incentives for larger landfills to collect and burn a minimumpercentage (65 percent to 80 percent) of methane generated.
State Government Operations
GOV-1 State agencies should use their agency Sustainability Plans as the toolfor agencies’ dynamic involvement in greenhouse gas reductions withrespect to both their internal operations, and their external programor regulatory activities.
GOV-2 Through a collaborative effort, the Departments of Energy,Environmental Quality and Administrative Services should develop aprocess to educate agency personnel about opportunities for GHGreductions including how to set goals and calculate GHG reductions.
Criteria for Reviewing andAssigning Actions to CategoriesThe Advisory Group is a diverse group of Oregon citizens who brought equally diverse lifeexperiences and perspectives to their task. Applying their perspectives was a valuable first step inevaluating the choices Oregon faces, but the Group used a more systematic evaluation tool. TheGroup agreed on the following criteria, although each Group member may weigh and prioritizethese independently.
1. Are significant quantities of CO2 or other greenhouse gases reduced, avoided orsequestered?
2. Are the reductions captured early or delayed?
3. Is the measure technically feasible? How do its costs compare to the costs of alternativeactions (or inaction)?

page 46 | Oregon Strategy for Greenhouse Gas Reductions
4. Does the measure require new legislation or regulatory action? By whom? Are therepolitical barriers to be addressed?
5. What collateral benefits or costs may accompany the measure? These might include unevendistribution of impacts, economic development gains, education values, demonstration values,and overlap with the West Coast Governors’ Global Warming Initiative.
Estimated Reductions from Implementing ActionsFigure 8 below integrates several aspects of historical and forecast emissions of greenhouse gasesfor Oregon, the mitigation actions and their relationship to the recommended goals. Emissionsare expressed as million metric tons of carbon dioxide-equivalent (MMT CO2E) in the leftvertical axis from 1990 through 2025. It shows how far we can expect to reduce greenhouse gasemissions by implementing all the recommended actions in Part Two.
1. As in Figure 3 in Part One above, the horizontal lines show the level of greenhouse gasemissions (a) in 1990, (b) at 10 percent less than 1990 levels, and (c) at 75 percent below1990 levels. These levels represent proposed goals for the State’s strategy and provide acontext for the expected reductions from the proposed actions. The 75 percent reductionof greenhouse gas emissions is what is required globally to stabilize atmosphericconcentration of greenhouse gases at 550 parts per million of carbon dioxide equivalent,or double the pre-industrial concentration. Although double the pre-industrialconcentration, this level is assumed to avoid serious climate impacts.
2. As in Figure 1 in Part One above, the black line that rises from 1990 to 2000 representshistorical greenhouse gas emissions from Oregon. The orange line that continues beyond thatrepresents a forecast of future emissions under a “business as usual” approach, which assumeswe continue present activities (including many that now restrain greenhouse gas emissions),but take no additional special actions to reduce these emissions. The vertical axis on the rightshows differences from 1990 levels, with 1990 representing 100 percent of emissions.
3. The graph then shows the cumulative, sequential reductions that would result from theproposed actions as subtractions from the “business as usual” approach. The reductions beginin 2008, based on the assumption that it would take that long for most of the new proposalsto begin to be effective. The “actions” are the sum of the emissions reductions from each of themajor types of recommended actions. Each “action” creates a new, lower forecast ofemissions. For example, all of the reductions from energy efficiency actions are subtractedfrom “business as usual,” then all of the reductions from adopting a 25 percent renewableportfolio standard are subtracted from the level achieved by the energy efficiency actions, andso forth. The reductions also account for the interactive nature of specific actions, as describedin the discussion of the actions. Therefore, the total of all actions for a sector and betweensectors is not necessarily the sum of all the individual actions within every sector.
Also, the reduction labeled “25% Renewable Portfolio Standard” (RPS) should be seen asa placeholder for the carbon allowance standard proposal. In fact, the State could set acarbon allowance standard at any amount of reduction. If the recommendation for a

Governor’s Advisory Group On Global Warming | page 47
carbon allowance standard is adopted, it would be up to the task force designing thecarbon allowance standard to recommend a specific level of reduction and the means –possibly including an RPS – to achieve that level.
FIGURE 8Historic and Forecast Greenhouse Gas Emissions in Oregon andEstimated Cumulative Reductions from All Measures in Sequence
In sum, Figure 8 shows that if we continue “business as usual,” by 2025 Oregon’s greenhousegas emissions would be 61 percent higher than 1990 levels. On the other hand, if we accomplishreductions from all the actions recommended in the report, our emissions would only be 7percent higher than they were in 1990 and trending downward, consistent with the AdvisoryGroup’s recommended 2020 goal.
“Business -As-Usual”
Energy Efficiency Actions
25% RenewablePortfolio Standard
Transport Actions
Materials Actions
BiologicalSequestration Actions
MM
TCO
2E

page 48 | Oregon Strategy for Greenhouse Gas Reductions
S E C T I O N 2
Recommended Actions
Integrating Actions to Reduce Greenhouse Gases
Issue:The four recommended Integrating Actions described in this section are crosscutting and affectthe six other action areas. In order to slow and then reverse greenhouse gas (GHG) emissions, itis essential to have a long-term focus.
Solutions:Action IA-1 recommends goals that provide a long-term context for all other actions. The goalsextend out 45 years.
IA-2 recommends that the Governor continue the work this group has begun. This includesappointing a successor group that could oversee implementation of global warming actions,develop adaptation actions and develop additional actions to reduce GHGs.
IA-3 recommends the Oregon University System develop a research strategy for technologies andtechniques to reduce GHGs and adapt to climate change. This would allow Oregon to foster newindustries and would help Oregon’s economy.
IA-4 recommends that the subsequent Advisory Group develop an education and informationplan and implement it with stakeholders throughout the state.
Table 1 (IA)Category I – Significant Actions for Immediate State Action
IA-1 Recommend the Governor adopt near-term, intermediate and long-term greenhouse gas emissions goals for Oregon.
IA-2 Urge the Governor to renew the charter of the Advisory Group onGlobal Warming (or a successor body) to continue the Advisory Group’sunfinished agenda.
IA-3 The Oregon University System should develop strategic and targetedresearch, development and demonstration (RD&D) programs forgreenhouse gas reduction technologies.
IA-4 The subsequent Advisory Group should work with state agencies,colleges and universities, schools, non-profit organizations andbusinesses to develop a global warming education program that willprovide information and outreach to the public.

Governor’s Advisory Group On Global Warming | page 49
IA-1: Recommend the Governor adopt near-term, intermediate and long-term greenhouse gas emissions goals for Oregon.
Near-term Goal: The Advisory Group recommends the State meet its existing Benchmark #76,which specifies that carbon dioxide (CO
2) emissions should not exceed 1990 levels. Recognizing
that Oregon is unlikely to meet that benchmark by 2010, the Advisory Group still recommendsthat Oregon retain this benchmark. As a near-term strategy, we recommend that by 2010 Oregonwill arrest the growth of and begin to reduce Oregon’s total greenhouse gas emissions, meetingor making measurable progress toward meeting Oregon’s current CO
2 benchmark.
Based on current scientific guidance and goals adopted by other states and countries, we considerthe following additional goals to be appropriate for Oregon:
Intermediate Goal: By 2020, Oregon’s total greenhouse gas emissions will not exceed a level10 percent below 1990 levels.
Long-term Goal: By 2050, Oregon’s total greenhouse gas emissions will achieve a “climatestabilization” level at least 75percent below 1990 levels.
Background: Setting a GoalSetting a goal and adopting actions that constitute a path to meet this goal send an importantsignal about the seriousness of Oregon’s commitment to reduce greenhouse gas emissions. Itencourages the expanded use of renewable energy and increased energy efficiency. It positionsOregon to take significant steps to protect the economic and environmental health of the region.
The appropriate objective of a greenhouse gas (GHG) emissions reduction goal or program isultimately to prevent dangerous climate change, as stated in the goal of the United NationsFramework Convention on Climate Change. In order to meet such a goal, the first step must beto stabilize emissions and then begin to reduce them.
Most greenhouse gas goals are based on either returning to 1990 emission levels or achieving areduction in emissions to a level below 1990. Often, there will be an initial goal of reaching 1990levels, then later achieving the lower emissions target. For example, the Kyoto Protocol to theUnited Nations Framework Convention on Climate Change uses 1990 as the baseline year for itstargets. The Protocol is scheduled to go into effect in February 2005.
Although the Bush Administration has stated it will not submit the Kyoto Protocol forratification to the U.S. Congress, it is useful to use the same baseline year for goals that theProtocol and other entities have adopted. The first targets of the Protocol differ from what theAdvisory Group has recommended for Oregon. If the Congress were to ratify the Protocol, itwould have to meet a binding target for the U.S. of achieving a level that is 7 percent below its1990 greenhouse gas emissions level, on average, over the period from 2008-2012. The AdvisoryGroup is recommending that Oregon work on a longer time frame and aim for greaterreductions over a longer time.

page 50 | Oregon Strategy for Greenhouse Gas Reductions
Numerous states and cities have adopted goals, either in plans or legislatively. Some address onlyCO
2; others address all GHGs. Most set 1990 as the base year and then set targets for 2010 and
sometimes later for achieving levels below 1990. For example, the City of Portland and MultnomahCounty have a goal of reducing GHG emissions 10 percent below 1990 levels by 2010. In mostcases, the states and cities have developed or are in the process of developing strategies to achievetheir goals. Those that set long-term goals often include provisions to revisit the goal on a regularbasis and provide for revisions.
Most state goals are expressed in terms of achieving a certain quantity of emissions at a specificyear in the future. Current federal policy takes a second approach and sets a target expressed as“emissions intensity,” which it measures as the ratio calculated by dividing the greenhouse emissionsin a given year by the economic output for that year. A third approach is to set technology-basedstandards. This approach is tied to specific technologies or sub-sectors, such as Oregon’s CO
2
standard for new energy facilities.
Setting absolute quantity limits provides simplicity and certainty. One knows in advance howmany tons of GHGs will be emitted into the atmosphere if the goal is achieved. Moreimportantly, absolute quantities of atmospheric GHG levels are scientifically meaningful, whilerelative amounts (e.g., relative to transient human factors such as economic activity or growth)are not scientifically meaningful if the object is to control and mitigate global warming.Historically, moderate concentrations of such gases are benign, while the higher concentrationsthat we are generating pose an extremely serious threat to the ability of the planet to sustainhuman and other life. The physical processes that take place in the earth’s atmosphere, and thethreat they pose, are facts that must be faced, whether or not they are convenient to one set ofeconomic strategies or another. Most states and cities have used absolute quantities as goals.
Certainly our mitigation strategies must be sensitive to economic effects if we are to choose themost cost-effective and least disruptive mitigation path; but we must not lose sight of the fact thatthe ultimate objective is a physical one – benign levels of the gases – not a short-term economic one.Thus, fixed physical emissions goals must be set and achieved independent of changes in populationor economic activity.
The current U.S. Administration’s goal is to reduce carbon emissions intensity by 18 percent between2000 and 2012. The Government Accounting Office17 estimates that this target would representonly a 2 percent absolute reduction from the likely GHG emissions that would otherwise accumulateover the period 2002-2012. Under this scenario, GHG levels in 2012 would remain significantlyabove 1990 levels. IPCC scientists generally agree that a climate stabilization level of emissionswould need to be some 75 percent to 85 percent below 1990 emissions levels.
Technology-based targets (e.g., emissions caps for new power plants) can contribute to reducingphysical concentrations of GHGs in the atmosphere, but they are likely to be more effective inthe context of established goals to which other actions can also contribute. Oregon, Washington,
17 United States General Accounting Office, Letter from John B. Stephenson to Senator Ernest F. Hollings andSenator John F. Kerry, regarding “Climate Change Trends in Greenhouse Gas Emissions and Emissions IntensityFactors in the Unites States and Other High-Emitting Nations,” October 28, 2003.

Governor’s Advisory Group On Global Warming | page 51
New Hampshire and Massachusetts have all set technology-based standards for power plants,either new or existing. California has set technology-based standards for new vehicles. TheNortheastern states and some Mid-Atlantic states are considering setting a cap on emissions frompower plants.
Consistency with Goals Established by Other StatesIn 2001, the New England Governors and Eastern Canadian Premiers (NEG/ECP) adopted goalsto reduce GHG emissions: (a) to 1990 levels by 2010; (b) to 10 percent below 1990 levels by2020; and (c) to a long-term goal of 75 to 80 percent below current levels eventually. These goalsare consistent with the objectives of the United Nations Framework Conventions on ClimateChange. They are ambitious, but they represent the path the region must be on to beginresponding to global warming. The Governors and Premiers acknowledged that the science – andthe consequences of a failure to respond – compel us to set these goals, even if we don’t yet haveall the tools and technologies we’ll need to meet them. Setting expectations is itself a stimulus todeveloping needed responses.
The Advisory Group is recommending goals generally consistent with those of the NEG/ECP. Inaddition to the scientific defensibility of setting such goals, Oregon’s action will reinforce theemergence of a common, more predictable level of commitment within the state-led action onglobal warming.
IA-2: Recommend that the Governor renew the charter of the AdvisoryGroup on Global Warming or appoint a new successor body to continue theAdvisory Group’s unfinished agenda.
The Advisory Group strongly recommends that the Governor appoint one successor advisorygroup to deal with the following topics:
• Develop a “Global Warming Adaptation Strategy for Oregon.”
• Evaluate and report on implementation progress.
• Reconsider deferred actions.
• Develop an education plan.
• Advise the Governor on influencing and integrating Oregon actions with international,federal and other state-level greenhouse gas reduction policies and activities.
• Appoint two related task forces, one addressing how to limit utility and other stationaryGHG emissions, and the second advising the Environmental Quality Commission (orpotentially the Governor and the Legislature) on adopting the California tailpipe emissionstandards for passenger and light-duty vehicles.
To ensure coordination and systematic progress in implementing this Strategy, the AdvisoryGroup recommends that the Governor ask each state agency with implementing responsibilities

page 52 | Oregon Strategy for Greenhouse Gas Reductions
to designate lead staff. In addition, the Group asks the Governor to appoint a senior member ofhis staff to oversee implementation and the ongoing work of a future Advisory Group.
The Advisory Group recommends that the Governor continue the work this Advisory Group hasbegun. The State of Oregon has devoted policy and technical attention to global warming issuesdirectly and indirectly, through energy, waste management, transportation and other policiessince 1988. Even if Oregon chose not to be proactive on global warming, we would have torespond to the changing climate and the growing attention paid to this issue globally, nationallyand regionally. However, Oregon can continue to do more than react. It can continue to lead byargument and example. In doing so, Oregon will be able to achieve the GHG reductionsultimately required of it at the lowest possible cost. It can capture the co-benefits that its pastcommitments to carbon constraints, energy efficiency and renewable technologies have alreadydemonstrated are available. It also can position itself to be a market leader in selling goods andservices to its slower-to-respond trading partners.
GW Adaptation Strategy: This Advisory Group has left a very large task – adaptation –barely visible on the State’s radar screen. And yet we know that if we could arrest the growth inGHGs tomorrow, we face more than a century of climate change and its oceanic and terrestrialconsequences. We need to think through strategies for dealing with lower snowpack and alteredregional hydrology; forests more susceptible to variable weather, pest infections, stress, andcatastrophic fires; and other consequences that are already locked in. The Advisory Group asksthat the Governor direct a successor Advisory Group and staff to work with Oregon’s academicexpertise and with governments and businesses to develop our adaptation strategy for the next100 years. By then we hope to see a downturn in the atmospheric concentrations of GHGs, theresult of beginning today to reduce the emissions that are the subject of this report.
Evaluate and Report on Implementation Progress: The successor Advisory Group shouldalso oversee and report on progress the State, its citizens and businesses have made inimplementing the strategy adopted in the current process. Recommending actions is the first andeasiest step. Action is more difficult and problematic, the more so in the absence of accountability.The Advisory Group recommends that it or a successor body provide that accountability.
Reconsider Deferred Actions: The Advisory Group began by considering a wide range ofoptions. While it dropped some ideas because they do not seem appropriate at this time, itdeferred consideration of many others because they require additional evaluation. This wouldfurther quantification of costs and benefits before they are ripe for recommendation to theGovernor and Legislature. The successor Advisory Group can work with state staff andinterested parties to develop these ideas, as well as other ideas we expect to receive asOregonians increasingly commit to addressing global warming issues.
Develop an Education and Outreach Plan: The Advisory Group recommends that thesubsequent advisory group work with state agencies, colleges, universities, schools, businesses,and non-profit organizations to develop an education and outreach plan:
• to inform Oregonians about the potential impacts to the state, the region, and the globe;
• to inform Oregonians about what they can do to reduce greenhouse gas emissions; and

Governor’s Advisory Group On Global Warming | page 53
• to inform Oregonians about what actions may be required to adapt to the changes fromglobal warming that are already unavoidable, and the costs these adaptation actions mayimpose.
Advise the Governor on international, federal and other state-level greenhouse gasreduction policies and activities: While Oregon acts to reduce its greenhouse gas emissions,it is also participating in regional, national, and international forums. The Advisory Group needsto stay informed and keep the Governor informed of actions that other states are taking,especially on the East and West coasts. It also needs to follow the national dialogue on globalwarming if there is potential to influence Congressional action. Finally, it needs to be informed ofinternational activities that may affect Oregon’s opportunities for finding ways to trade in aninternational market.
Appoint two related task forces: In addition to a continuation and expansion of the role ofthe current Advisory Group, the Group separately recommends two additional task forces. Onetask force would advise the Governor and Legislature on how to limit utility and other stationaryGHG
emissions. This activity is discussed in GEN-2 and GEN-2a in the Electric Generation and
Supply section below. The second task force would advise the Environmental QualityCommission (or potentially the Governor and Legislature) on adopting the California tailpipeemission standards for passenger and light-duty vehicles. This is discussed in the Transportationsection under TRAN-1 below.
IA-3: The Oregon University System should develop strategic and targetedresearch, development and demonstration (RD&D) programs for greenhousegas reduction technologies.
Oregon universities have expertise related to mitigation and biological sequestration (carboncapture and storage) of GHG emissions. Enhanced efforts to develop and deploy specifictechnologies, services or applications can enable Oregon to foster new industries. Possible areasof effort include renewable generation technologies; biofuels production; energy efficiency forelectricity, natural gas and oil uses; bio-sequestration; materials disposal; and renewable energyproduction using landfill gas or agricultural or forestry biomass. Large emission reductionsare possible.
Oregon’s higher education system is capable of designing and identifying applications for beyondoff-the-shelf technologies. It is likely Oregon and other states will need such applications inresponses to global warming. Oregon has significant competitive advantages. We have a broadarray of educational expertise in energy efficiency research, forestry and renewable energy.Oregon has been an early adopter of these technologies and services.
State RD&D funds, combined with funds from competitive grants, could enable Oregon’seconomy to benefit from local deployment. In addition U.S. and worldwide efforts to reduceGHG emissions will create additional demand for these services. Increased state revenues fromincreased economic activity could more than offset any state expenditures. Local investment and

page 54 | Oregon Strategy for Greenhouse Gas Reductions
demonstrations can help develop export markets. Collaboration with other West Coast statescould better leverage institutional strengths and develop complementary regional capacity.
Legislative appropriations are required to conduct an inventory of current programs, capabilityand interests and to plan future development and support for these programs. Not alltechnologies for GHG reduction merit funding. The Oregon University System, in coordinationwith GHG work groups in Oregon, Washington and California, should develop strategic andtargeted RD&D programs for GHG reduction technologies.
IA-4: The subsequent Advisory Group should work with state agencies,colleges and universities, schools, non-profit organizations and businessesto develop a global warming education program that will provideinformation and outreach to the public.
Public education is needed to assist Oregonians in making informed decisions and to participatein developing State and individual actions to reduce greenhouse gas emissions that will bepractical, effective, and supported by the citizens of Oregon. The Advisory Group would workwith stakeholders to develop a plan for public education and outreach on global warming.Topics would include the potential impacts of global warming, what Oregonians can do toreduce greenhouse gas emissions, and how to adapt to changes caused by global warming.

Governor’s Advisory Group On Global Warming | page 55
Energy Efficiency Actions to ReduceGreenhouse Gases
Issue: For the past twenty years and more, Oregon has had successful energy savings programsfor electricity, natural gas and petroleum users. These have included incentive programs andbuilding codes. Even so, significant savings remain to be captured, and new technologies createopportunities for still more savings. Petroleum and natural gas use emits CO
2 and other
greenhouse gases directly. Almost half of the electricity used in Oregon is met by coal and gas-fired generation that emit GHGs.
Solutions: To reduce emissions, Oregonians will need to use all energy more efficiently.Oregon’s incentive and building code programs need to be reviewed and upgraded, based onconcerns over global warming.
Note that, while therecommended Energy Efficiencyactions will require significanteffort and investment, the levelof effort remains roughlycomparable to how Oregon hasperformed over the last 20years. In other words, thisOregon Strategy to ReduceGreenhouse Gas Emissionsassumes the State will continueits current aggressive level ofinvestment and accomplishmentin this area.

page 56 | Oregon Strategy for Greenhouse Gas Reductions
Table 1 (EE)
Category I: Significant Actions MMT C/E?for Immediate State Action CO2E
2025
EE–1 Meet the Northwest Power and Conservation Council(NWPCC) goal of implementing cost-effective electricityefficiency measures for electric users and an equivalentgoal for natural gas users.
EE-1a: Expand and coordinate electric incentive 3.20 Yprogramsfor Investor-Owned Utilities (IOUs).
EE-1b: Upgrade Oregon building codes to reduce 0.52 Yenergy use by at least 15 percent by 2015(building shell measures).
EE-1c: Amend building codes to set minimum space 0.09 Yand water heating/cooling standards.
EE-1d: Adopt state appliance efficiency standards. 0.41 Y
EE-1e: Advocate with Bonneville Power Administration 1.24 Y(BPA) and Oregon electric consumer-owned utilities(COUs) to meet the NWPCC goal.
EE-1f: Support Oregon Public Utility Commission (OPUC) 0.24-0.48 Yactions to evaluate NW Natural/ETO and ODOE naturalgas incentive programs.
EE-1g: Advocate with OPUC for Avista and Cascade 0.05 Ynatural gas utilities to meet energy savings goalscomparable to NW Natural.
EE-1h: Advocate for federal equipment and appliance 0.40 Yefficiency standards.
EE 1i: Strengthen state marketing of energy efficiency Yand incentive programs; initiate Governor’s Awards.
SUB-TOTAL FOR EE-1 6.15-6.39
Category II: Other Immediate Actions
EE-2 Support OPUC and COU efforts for modified rate 0.16 Ydesigns to reflect daily and seasonal peak demand.
EE-3 Support OPUC initiatives for natural gas and 0.10 Yfuel switching.
TOTAL ALL EE ACTIONS 6.41 -6.65
Generation mix affects efficiency saving. In the table above, column three shows estimated CO2equivalent savings in million metric tons (MMT) through 2025. Column four asks if the action is cost-effective (C/E) - yes (Y) or no (N) - to the consumer over the action’s lifetime. (This does not addresswhether it is cost-effective to Oregon and Oregonians broadly, considering the projected effects ofglobal warming and the costs of adapting to those effects.) The estimates assume displaced generationat a 50-50 mix of gas-fired and coal-fired generation. Refer to Figure 8 in Part Two, Section 1(Introduction to Recommended Actions) for the cumulative impact of actions.

Governor’s Advisory Group On Global Warming | page 57
EE-1: Meet the Northwest Power and Conservation Council (NWPCC) goal ofimplementing cost-effective electricity efficiency measures for electric usersand an equivalent goal for natural gas users.
The Advisory Group recommends achieving Oregon’s 960 average Megawatts (aMW) share ofthe Northwest Power and Conservation Council’s regional cost effective energy efficiency for2005 to 2025 (18 percent of 2002 sales). Meeting this target over 20 years would be theequivalent of saving more than three times the current energy use of a city the size of Eugene.Also recommended are savings of 7.5 trillion Btus (TBtu) of Oregon commercial and residentialnatural gas between 2005 and 2025 (11 percent of 2003 commercial and residential gas sales).
In March 2004 the NWPCC published its draft conservation resource assessment. Theassessment indicates that the NWPCC region (Oregon, Washington, Idaho and the western thirdof Montana) could reduce electric sales by 2,880 aMW by 2025 if fully effective conservationprograms and regulations were implemented. Oregon’s share of this savings is 960 aMW. TheCouncil also notes that about 3,000 aMW were saved in the period 1980 through 2002. Whilemany measures have been implemented, technological change has created new opportunities.
Savings of 960 aMW electricity and 7.5 trillion Btus of natural gas are assumed in the energyefficiency case forecast of CO
2 emissions. The efforts needed to accomplish this goal are shown
in Table 2 (EE) and Table 3 (EE) below. All of these actions are cost-effective and would improveOregon’s economy. With all these measures, Oregon electric loads would grow 1.0 percent peryear from 2002 to 2025. If none of this energy efficiency is captured, loads would grow at 1.6percent per year and CO
2 emissions would be 5.6 million metric tons (MMT) higher than
assumed. The generation displaced by the energy efficiency is assumed to be a 50-50 mix of gasand coal-fired power plants. Acronyms used in the tables below include IOUs (investor-ownedutilities) and COUs (consumer-owned utilities), which include people’s utility districts,cooperatives and municipal utilities.
TABLE 2 (EE)Oregon Electric Efficiency Case Energy Savings
MMT CO2 aMW Measure
3.20 545 EE 1a State and Utility Incentives (IOUs)
1.24 212 EE 1e State and Utility Incentives (COUs)
0.37 63 EE 1b (electric only) Improved Building Codes (building shell)
0.32 55 EE 1h (electric only) Federal Standards
0.09 15 EE 1c Calif. Equipment Standards*
0.41 69 EE 1d Calif. Appliances Standards**
5.63 960 Total Electricity
* Oregon can adopt California equipment standards through rule changes.** Adopting appliance standards in Oregon would require legislation.

page 58 | Oregon Strategy for Greenhouse Gas Reductions
Efficiency case natural gas utility incentive savings are for Energy Trust of Oregon (ETO)programs for Northwest Natural and savings from state energy efficiency programs. Estimates ofsavings from incentive programs and improved building codes are from the Oregon Departmentof Energy (ODOE).
TABLE 3 (EE)Oregon Natural Gas Efficiency Case Savings
MMT CO2 Trillion Btu Measure
0.29-0.53 4.6 EE 1f and 1g Utility and State Gas Incentives
0.15 2.9 EE 1b (gas only) Improved Building Codes (building shell)
0.08 EE 1h (gas only) Federal Standards
TBA Calif. Equipment Standards
TBA Calif. Appliances Standards
0.52-0.71 7.5 Total Natural Gas
The actions to achieve EE-1a through EE-1i are discussed as individual actions following thediscussion of the NWPCC goal below.
Discussion of NWPCC GoalThe most difficult or controversial element of achieving these CO
2 savings is possible legislation to
adopt appliance efficiency standards for devices not covered by Oregon building codes (EE-1d). Thiselement is discussed in the West Coast Regional Appliance Efficiency Codes and Standards WorkingGroup Paper (WG4 – from three-state West Coast Governors’ Global Warming Initiative).
Allowing builders to take an ODOE Residential Energy Tax Credit would require legislation, butmay not be controversial (part of EE-1a). The savings are small, but grow as penetrations growover time. Integrating efficient water-heating equipment at the time of construction is lessexpensive and requires fewer incentives than adding equipment later.
Actions by ODOE, ETO, the Oregon Public Utility Commission (OPUC) and the Building CodeDivision might accomplish the remainder of the savings. These might require budget adjustmentsfor the 2005 session. If a joint OPUC-ODOE assessment indicates the natural gas and electricityefficiency goals cannot be met with existing funding levels, legislation for the electric portionmay be needed in the 2007 session because of restrictions enacted in SB 114918 in 1999.
The savings goal is achievable. The NWPCC estimates that almost 3,000 aMW were saved in theregion between 1980 and 2002. Of this, roughly 40 percent was saved through codes and stan-dards. This is consistent with experience with Oregon programs where 35 percent of savings werefrom the energy standards in Oregon’s building codes. Figure 1 (EE) below shows the distribution of
18 SB 1149 is an electric industry restructuring law of the state’s largest investor-owned utilities. Restructuring isdesigned to give Portland General Electric and PacifiCorp consumers more energy options, while at the same timeencouraging the development of a competitive energy market. Current utilities continue to deliver power andmaintain the safety and reliability of the poles and wires that deliver power, regardless of who supplies it.

Governor’s Advisory Group On Global Warming | page 59
CO2 savings from state programs. Savings are annual savings from program activity from 1978through 2002. Savings from program measures reduce CO2 emission by 3.7 million metric tons peryear. Had these savings not occurred, 2002 emissions from Oregon stationary sources would havebeen 11 percent higher than they were. This indicates that further large CO
2 savings from energy
efficiency programs are achievable.
Historical savings in Figure 1 (EE) estimates do not include the additional savings from utility energyefficiency programs during the period. Utility programs added substantial saving, especially in theresidential sector. In addition to reducing CO
2 emissions, these and utility program savings reduced
costs to businesses, governments and households compared with purchasing fuel or power, and theyimproved Oregon’s economic performance.
Figure 1 (EE)Avoided CO2 Emissions in 2002 by Program(includes all projects from start of program through 2002)Total avoided emissions = 3,681,000 metric tons CO2
Key to Figure 1 (EE)BETC: ODOE Business Energy Tax CreditSEED: State Energy Efficient Design requirements for new state government buildingsICP: discontinued federal energy efficiency program for schools and hospitals (Institutional [building]Conservation Program)Schools: current K-12 school programsIndustrial Self-Direction: measures paid for by large electric users who self-direct their SB 1149 public purpose chargesRTC: ODOE Residential Energy Tax CreditSELP: ODOE Small-scale Energy Loan ProgramSHOW: ODOE State Home Oil Weatherization program
Program
mill
ion
met
ric
ton
s C
O2
avo
ided

page 60 | Oregon Strategy for Greenhouse Gas Reductions
EE-1a: Expand and coordinate incentives for electric investor-owned utilities (IOUs).
Electricity sales of IOUs accounted for 72 percent of Oregon sales in 2002. The Energy Trust ofOregon (ETO) began running the energy efficiency programs of PacifiCorp and Portland GeneralElectric (PGE) in 2002 and of Northwest Natural gas utility in 2003. Idaho Power runs utilityincentive programs in the Ontario area. These IOU programs and those of ODOE and theDepartment of Housing and Community Development might be better coordinated to be moreeffective with existing funds. Efforts to this effect are underway.
The most important need is to track total savings to compare to the global warming goals. Ifincreased coordination is not sufficient to meet the goal, increased funding will be needed.Application of the NWPCC’s estimates to Oregon indicates that IOU incentive programs couldsave 545 aMW by 2025. If this conservation goal were not achieved, Oregon’s emissions wouldbe 3.20 MMT CO
2 higher (this assumes the extra generation would be a 50-50 mix of new gas-
and coal-fired generation). Below are other actions needed to achieve this goal.
Assess Oregon program performance relative to the NWPCC goal in 2006. As partof the study due on January 1, 2007, as required under SB 1149 (1999 session), OPUC, ODOEand ETO should assess the effectiveness of existing electric programs and regulations in 2005and 2006 to see if Oregon is capturing its share of the NWPCC goal. These assessments shouldconsider state tax credits; loan financing programs and other state incentives; regulatory toolssuch as building and equipment codes; technology assessments; utility planning assessments;ETO programs; and other SB 1149 mechanisms. The agencies should conduct a similar programfor natural gas programs. If an assessment indicates substantial increases in electric funding andauthorities are needed, this would indicate legislation may be needed in the 2007 session.
Similarly the State should review the effectiveness of BPA and COU energy efficiency programsand whether the State’s programs are consistent with and supportive of comparable efficiencyefforts among non-regulated utilities (see EE-1e below).
Through legislation, allow homebuilders to take state Residential Energy TaxCredits (RETC) for heat pump water heaters (HPWH), solar photovoltaic (PV) andsolar domestic hot water (DHW). Currently, only the homeowner is allowed to take the credit.With this change, either the builder or the homeowner could get the RETC. The NWPCCestimates that the region could acquire 195 aMW of cost-effective savings from HPWH by 2025.Oregon’s share of this would be 64 aMW, which would reduce annual CO
2 emissions in 2025 by
0.35 MMT CO2. This measure will make an important contribution to achieving the NWPCC
target for heat-pump and solar water heating.
Solar PV and solar DHW savings are not included in the NWPCC plan, as the plan estimatesthese measures are not currently cost-effective. Savings or production from solar PV would be inaddition to the NWPCC goal. Savings from solar DHW are included in the 195 aMW of savings,because homes will have either a solar DHW or HPWH system, but not both.
For new homes built on speculation, the builder is the decision-maker on whether to integrateHPWH, solar PV or solar DHW systems. Integration is less expensive than adding these systemslater. This would require a statutory change, but it may not be controversial.

Governor’s Advisory Group On Global Warming | page 61
EE-1b: Upgrade Oregon building codes to reduce energy use by at least 15percent by 2015 (building shell measures).
Amend the energy portions of the residential and commercial building codes for shellmeasures that address exterior structure walls, ceilings and floors to save energy.Because technologies continue to change, Oregon needs additional revisions to its building codes.Significant additional cost-effective savings are possible. As an example, many new orrefurbished commercial buildings do not operate properly. Today’s building energy systems arecomplex and should be commissioned (certified) to ensure they perform properly as designed.
ODOE estimates that structural codes improvement (shell measures) from 2005 through 2025could save 63 aMW of electricity for a savings of 0.37 MMT CO2 in 2025 at the assumeddisplaced generating mix of 50-50 natural gas and coal plants. ODOE also estimates that CO2
savings in natural gas heated homes and commercial buildings could be 0.15 MMT CO2. Thesesavings include building commissioning and increased enforcement measures described belowand are included in the energy efficiency forecast. Achieving these savings requires a strongerchange in state policy than achieving the energy efficiency savings in EE-1a above. Oregoncurrently has substantial energy efficiency incentives such public purpose charges for investor-owned utilities, consumer-owned utility programs and state tax credits and loans. Residentialand commercial building codes should be upgraded to reduce energy use and costs on a scheduleto meet or exceed the target of at least 15 percent savings by 2015 recently set by the staff reportof the West Coast Governors’ Global Warming Initiative. Otherwise, building users will miss costsaving opportunities from new technologies.
Require commissioning certification of new buildings and major renovations. Themajor barrier to requiring commissioning by code is that code officials don’t have the time orexpertise to verify that building systems are operating as designed. A viable alternative is a seal ofapproval from an accredited (certified) commissioning agent. Oregon, Washington, andCalifornia should work together to develop commissioning and certification standards thatwould be incorporated into building codes. These standards could be developed in cooperationwith the American Society of Heating, Refrigerating and Air-Conditioning Engineers (ASHRAE)and the Building Commissioning Association. This would also facilitate re-commissioning ofexisting commercial buildings. This could be relatively easy, if done cooperatively with Californiaand Washington. This program is likely cost-effective. This would also help achieve cost-effectiveconservation in new gas- and oil-heated commercial buildings.
Support the infrastructure for enforcement of building energy codes. Codes only saveenergy if compliance is met. Among competing priorities, energy efficiency is often overlooked.There should be a renewed effort to provide information and training for code officials,designers, contractors, equipment vendors and others on energy code requirements and thebenefits of energy efficiency. These measures would be cost-effective.

page 62 | Oregon Strategy for Greenhouse Gas Reductions
EE-1c: Amend building codes to set minimum space and water heating/cooling standards.
Amend the residential and commercial building codes to require minimumefficiencies for space heating/cooling and water heating/chilling based on cost-effectiveness and modeled after California equipment standards.
Oregon, Washington and California have long been leaders in building energy codes. Federalstandards preempt state standards for some equipment, but not all. Failure of the federalgovernment to set standards for several types of equipment allows Oregon, along with otherWest Coast states, to set equipment standards in codes. To date, Oregon building codes generallyhave not addressed equipment standards.
It would be cost-effective to raise the minimum efficiency of the equipment through changes inthe building code. The Building Codes Division has no plans to do this. Also, Oregon currentlyhas no efficiency certification or compliance-monitoring infrastructure for implementingstandards, but may be able to adopt California protocols. This is an element of WCGGWIrecommendations (see EE-1d below). ODOE estimates this measure will reduce CO2 emissions in2025 by 0.09 MMT CO2 at the assumed displacement of a 50-50 gas and coal plant mix.
EE-1d: Adopt state appliance and equipment efficiency standards for Oregon.
Propose legislation for state appliance efficiency standards (California standards)that cannot be covered under the building code. Federal appliance efficiency standards couldbe achieving higher levels of cost-effective conservation. Federal standards preempt statestandards for some appliances, but not all. California, Washington and Oregon are jointlyexploring efficiency standards for appliances and equipment that cannot be covered by buildingcodes. Appliance standards for products outside the scope of building energy codes wouldrequire legislation. This legislation will likely be controversial. The legislation would have toprovide a mechanism for product efficiency certification (possibly by relying on California’scertification program and database) and for compliance monitoring. These actions would becost-effective. In the WCGGWI, the staff report recommends that all three states adopt energyefficiency standards for 8 to 14 products not regulated by the federal government, establishing acost-effective efficiency threshold for all products sold on the West Coast. ODOE estimates thismeasure will reduce CO2 emissions in 2025 by 0.41 MMT CO2 at the assumed displacement of a50-50 gas and coal plant mix.
EE-1e: Advocate with BPA and Oregon electric consumer-owned utilities tomeet the NWPCC goal.
Continue Oregon and NWPCC efforts to work with the BPA and COUs to assure programs orincentives for effective energy efficiency programs. COUs account for 28 percent of the electricity soldin Oregon. Achieving the NWPCC goal in these areas will save 212 aMW and 1.24 MMT CO2 at the

Governor’s Advisory Group On Global Warming | page 63
assumed mix of new generation. Recent funding levels by BPA and Oregon COUs are comparable to thepublic purpose charge for PacifiCorp and PGE. BPA is evaluating its funding levels for 2006-2011.
This will require effective programs for Oregon COUs, either run by BPA or by the utilitiesthemselves. It is recommended that the governor’s office follow the regional dialogue on thisissue and make recommendations to BPA if necessary. Continued coordination among theexisting and new programs of ODOE, ETO, BPA and Oregon COUs is also needed.
EE-1f: Support OPUC actions to evaluate Northwest Natural energyefficiency programs.
Support Oregon PUC’s reexamination of Northwest Natural’s gas utility efficiencyprograms and ODOE’s energy efficiency programs and modify where cost-effective.This measure would evaluate the success of ETO’s programs for NW Natural and ODOE’s gasenergy efficiency programs. The ETO has a goal of 1.9 trillion annual Btus (TBtu/year) by 2012.Extrapolated, this would imply savings of 4.6 TBtu per year in 2025 or 0.24 MMT CO
2 per year.
More cost-effective savings may be possible through higher levels of ratepayer funding of utilitymarketing and information programs, better coordination with ODOE programs, increasing the levelof NW Natural’s public purpose charge, or by expanding or modifying ODOE programs. The PUCcould examine how to improve the marketing of ETO programs to NW Natural’s customers. Thismight involve increasing the overall level of funds for marketing and information or adjusting thebalance of funds between the ETO and NW Natural’s efforts. Whether these changes are possible orneeded would be determined by a joint study of the OPUC, ODOE and ETO. Because the publicpurpose funding for NW Natural is not in statute, legislation would not be required to change it.
This evaluation could also involve filling gaps between ETO’s gas program for NW Natural andODOE school gas programs. ODOE’s K-12 schools program (under SB 1149) for all fuels doesnot cover schools in COU territories. ETO programs for NW Natural cover some of these COUareas, but don’t have targeted COU schools programs.
Substantial changes in ODOE programs would likely require legislation in 2007. Currently, theOPUC has a program that automatically compensates NW Natural for most of the revenue lostdue to reduced sales from energy efficiency programs. If not for this program, conservationwould reduce NW Natural profits. Before this program, lost revenue had discouraged NWNatural from aggressively pursuing conservation. Continuing this program is likely necessary forconservation to succeed. Doubling the implied ETO goal would reduce NW Natural’s 2025emissions by 0.24 MMT CO
2 per year.
EE-1g: Advocate with OPUC for Avista and Cascade natural gas utilities tomeet energy savings goals comparable to NW Natural.
Recommend the OPUC institute programs for Avista and Cascade that resemblethose of NW Natural (See EE 1f). Together these utilities sell 19 percent of the natural gassold by utilities in Oregon. NW Natural sells the remainder. The OPUC and these utilities could

page 64 | Oregon Strategy for Greenhouse Gas Reductions
adopt a public purpose charge to fund ETO programs and could also remove rate-makingdisincentives that inhibit pursuit of cost-effective efficiency measures. Extrapolating the savings ofNW Natural to these utilities yields a reduction in 2025 emissions of 0.05 MMT CO
2 per year.
EE-1h: Advocate for federal equipment and appliance standards.
Advocate for federal appliance and equipment standards that fully capture cost-effective energyefficiency. In recent years the federal government has decided not to apply its standards to severaltypes of equipment and appliances and has not included all cost-effective savings in recentchanges to appliances and equipment it does regulate. For example, the U.S. Department ofEnergy’s attempt to weaken federal air conditioner standards in 2001 was overturned by federalcourts. States have successfully lobbied for tougher standards in the past. Also, having statestandards for non-regulated products has goaded federal action to avoid multiple state standards.
Federal standards and programs have been effective in reducing the economic impacts of electricprice spikes and the high cost of imported natural gas and oil, as well as reducing CO
2 emissions.
Oregon should vigorously support continued improvements in federal appliance and equipmentefficiency standards. ODOE estimates that full implementation of cost-effective standards forfederally covered appliances would save Oregon 55 aMW and 0.32 MMT of CO
2, assuming a 50-50
mix of new coal and gas-fired generation. Gas savings are estimated to be 0.08 MMT of CO2.
EE-1i: Strengthen state marketing and public information of energyefficiency and incentive programs.
Improve marketing and public information for incentive programs. In cooperationwith state agencies, local governments, utilities and conservation organizations, Oregon couldenhance the effectiveness of public information, marketing and branding of energy efficiencyefforts. This could involve a Governor’s awards program.
EE-2: Support OPUC and COU efforts for modified electric rate designs toreflect daily and seasonal peak demand.
Support efforts by the OPUC and COUs to re-examine rate design measures that reflect dailyand seasonal peak demand and reduce CO2, and implement where cost-effective. Savings forthese potential programs would be in addition to Oregon’s share of the NWPCC goal of a 2,880aMW reduction in electrical sales.
Electricity – Voluntary Peak Shaving: Examine voluntary demand-response (peak-shaving) rates and programs for PGE and PacifiCorp in Oregon and implementwhere cost-effective. These reduce CO2 emissions because the gas-fired power plants thatmeet peak loads are the least efficient. This could be ranked as easy to accomplish, because theOPUC has adopted this goal. This measure might save an annual 0.05 MMT CO2 in 2025.

Governor’s Advisory Group On Global Warming | page 65
Electricity – Residential: Redesign residential rates to reflect better the higher costsof electricity during peak seasons or times. Revise PGE’s residential rate design from flatrates to rates that increase with use (inclining block rates). Revenues from the higher prices forhigher use levels would be refunded to ratepayers through a lower price for the initial rate block.This could be ranked as easy. PacifiCorp’s Oregon residential rates already have this feature. Thismeasure might save 0.11 MMT CO
2 in 2025.
EE-3: Support OPUC actions for natural gas and fuel switching.
Support efforts by the OPUC and others to re-examine fuel switching to natural gasto reduce CO2 and implement where cost-effective. Savings for the electric water heaterprogram would be in addition to Oregon’s share of the NWPCC efficiency goal, roughlyestimated as 960 aMW.
Electric Water Heaters to Gas: Examine gas utility programs that would convertresidential electric water heaters to gas and implement where cost-effective. TheOPUC approved the concept in October 1991, but the program was not implemented due toconcerns that most of the incentives would go to households who would have switched anyway(the so called free-rider effect).
A new issue would be the relative cost-effectiveness and CO2 savings of switching existing
electric-resistance water heaters to gas water heaters or heat-pump electric water heaters. TheOPUC has adopted an objective to: “Investigate whether to promote the direct use of natural gasto meet customer needs over its use to generate electricity for that purpose.” Savings in 2025from this program would be 0.09MMT CO
2 per year at the assumed mix of new generation of
50-50 coal and gas plants.
Commercial OilBoilers to Gas:Examine gas utilityprograms to convertexisting commercial oil-fired boilers to efficientgas-fired boilers andimplement if cost-effectiveand if the increased gasutility sales revenue wouldcover program costs. Thiscould be controversial,especially among oil dealers.Savings from this programin 2025 would be 0.01MMT CO2 per year.

page 66 | Oregon Strategy for Greenhouse Gas Reductions
Electric Generation and Supply Actionsto Reduce Greenhouse GasesIssue: Oregon electricity supplies, once nearly all renewable (hydro), are now over 40 percentfrom coal and another 8 percent from natural gas. The latter two emit CO
2 and other greenhouse
gases (GHGs) in combustion (although gas has lower emissions).
Solutions: To reduce GHG emissions, we must use all energy more efficiently, while meetingnew load growth and replacing existing fossil fuel generation with energy efficiency andgeneration that does not produce GHGs.
Table 1 (GEN)
CATEGORY I: SIGNIFICANT ACTIONS MMT C/E?FOR IMMEDIATE STATE ACTION CO2E
2025
GEN-1 Increase the renewable content of electricity. 0.80 Y
GEN-1a: Increase retail energy sales fromrenewable resources by one percent or moreannually in Oregon through 2015.
GEN-2 Recommend the Governor create a special interim task At least ?force to examine the feasibility of, and develop a design 7.0*for, a load-based greenhouse gas allowance standard.
GEN-2a: The GEN-2 interim task force should also ?consider an Oregon Renewable Portfolio Standard(RPS) and potential changes to public purpose chargesas tools to meet a greenhouse gas allowance standardand overall state CO2 goals.
GEN-3 Support the Oregon Public Utility Commission’s 0.54 Yreview of rules and tariffs for renewable andcombined heat and power facilities.
CATEGORY II: OTHER IMMEDIATE ACTIONS
GEN-4 Encourage state government to purchase renewables. 0.08 N?
GEN-5 Advocate for specific federal policies or legislation. varies varies
GEN-6 Advocate with BPA to support Oregon’s varies variesrenewables measure.
Generation mix affects efficiency saving. In the table above, column three shows estimated CO2equivalent savings in million metric tons (MMT) through 2025. Column four asks if the action is cost-effective (C/E) - yes (Y) or no (N) - to the consumer over the action’s lifetime. (This does not addresswhether it is cost-effective to Oregon and Oregonians broadly, considering the projected effects ofglobal warming and the costs of adapting to those effects.) A question mark means that the estimatesof cost-effectiveness are uncertain and more analysis is needed. The estimates assume displaced genera-tion at a 50-50 mix of gas-fired and coal-fired generation. Refer to Figure 8 in Part Two, Section 1(Introduction to Recommended Actions) for the cumulative impact of actions.
* Assumes a carbon constraint at least equal to an RPS of 25 percent.

Governor’s Advisory Group On Global Warming | page 67
GEN-1: Increase the renewable content of electricity.
The forecast mix assumes Oregon will implement the final versions of the Oregon RenewableEnergy Action Plan (currently in draft form) and the West Coast Governor’s Global WarmingInitiative (WCGGWI). This could have small fiscal impacts. The draft Oregon renewable plancalls for completing the following new renewable energy actions in calendar year 2005 and 2006:
• 300 megawatts (MW) of new wind energy capacity, of which 10 percent will be fromcommunity or locally-owned projects
• Effective solutions to the transmission capacity bottleneck(s) between Eastern and WesternOregon to provide access to renewable and other resources in Eastern Oregon to load centers
• Have all electric utilities offer a “stable price” renewable energy product to customers.
• 500 additional solar photo-voltaic electric installations (about 1 new MW)
• 25 MW of new biomass-fueled electric generation built or under construction (of which 5MW will be from new biogas generation facilities from wastewater treatment, dairies andlandfills)
• 25 MW of efficient new combined heat and power generation systems built or underconstruction
• 1 MW of new fuel cells
• 20 MW or more of geothermal generation projects built or under construction
• 1 to 4 MW of additional environmentally sustainable hydroelectric capacity in the processof being developed (primarily irrigation piping channels)
• An assessment of the feasibility of a renewable portfolio standard (RPS) for Oregon
These projects will produce about 150 average megawatts of electric energy. This is about 50percent more than the load for the city of McMinnville. This would raise the fraction of loadsmet by non-hydro renewables to 5 percent. These measures, other than wind, will likely requireadditional staff of about 3 full-time employees (FTE). The staff could be spread out over severalnatural resource agencies or a single natural resource agency. These staff would primarily draftand oversee federal grants. Initially, this would require general funds, but after successful grantawards, only the grant writing portion would require general funds for about one FTE.
The generation mix is based roughly on the Northwest Power and Conservation Council draftmix that includes reduced load growth from energy efficiency actions applied in Oregon. Themix also assumes the equivalent of the Oregon Energy Facility Siting Council’s (EFSC) CO
2
standard being applied gradually throughout the West. The resource additions listed above save0.80 million metric tons (MMT) of CO
2 per year starting in 2006, assuming the displaced mix is
half new coal-fired plants and half new natural gas-fired plants. Short-term impacts on powerplant operations are similar because existing plants with higher fuel costs and CO
2 per kWh are
displaced first when renewable resources are added.

page 68 | Oregon Strategy for Greenhouse Gas Reductions
GEN-1a: Increase retail energy sales from renewable resources by onepercent or more annually in Oregon through 2015.
The WCGGWI (See Appendix E) calls for Oregon, Washington and California to set goals andimplement strategies and incentives to increase retail electricity sales from renewable resources,adding one percent of load or more annually in each state through 2015. This is consistent with apath to meeting 20 percent of load with renewables by 2020 (not including large hydro-electricgeneration). Savings for this element of GEN-1 are included in GEN-2 below.
GEN-2: Recommend the Governor create a special interim task force toexamine the feasibility of, and develop a design for, a load-based allowancestandard.
This standard would reduce total amounts of CO2 and other GHG emissions due to consumptionof electricity, petroleum and natural gas by Oregonians in a deliberate, predictable, effective, equitableand verifiable manner. The task force should be directed to provide the Governor with itsrecommendation in time for legislative action, if necessary, in the 2007 session.
The task force should include a fair representation of parties with economic and environmentalinterests at stake, along with appropriate state agency staff and legislators. The long-term (2050)goal should be to reduce GHG emissions from all sources to levels that are consistent with a stategoal of climate stabilization emissions levels. A secondary goal should be to capture and reinvest orequitably distribute economic benefits from energy efficiency, renewables and bio-sequestrationstrategies. Tools may include: utility and government resource programs (including those of theETO and BPA’s transmission and integration capabilities); government tax, long-term financingand incentive programs; and offsets and trading. Barriers to meeting allowance goals should beidentified and addressed including current state regulatory signals if appropriate.
At a minimum the task force should address the following questions:
1. Long-Term and Interim Sector Allowances: What long-term (2050) sector GHGemissions allowances should be set for electricity, gas and oil (consistent with anoverall State of Oregon GHG emissions goal)? What interim emissions levels should beset (e.g., what are the shape and slope of the compliance curves) that are feasible andallow deliberate, but not delayed, action? What intervals should be set for interimcompliance? Should there be a brief “beta” period at the beginning of enforcement ofthe cap to test accounting principles and other mechanisms, during which greatercompliance flexibility would be permitted?
2. Different Fuels and Suppliers: How can equitable standards and/or program options beapplied to diverse energy sources (electricity, natural gas, petroleum) andsuppliers (includ-ing public- and investor-owned utilities, non-utility suppliers and self-generators)? Shouldcompliance curves be identical for all suppliers or different to reflect different suppliercircumstances? Should other significant non-energy emitters of GHG’s (e.g., industrialemissions) be incorporated into this mechanism, or will they require a different one?

Governor’s Advisory Group On Global Warming | page 69
3. Emissions Credits Trading: Should – and could – such a system be designed toincorporate features compatible with a regional emissions trading mechanism betweenOregon and its West Coast partners (Washington and California) on the premise thatthe wider the market, the more efficiently it should function? Between the West Coastand the Eastern states? Could we design a system that includes and harnesses theinitiative of non-utility contributors (e.g., renewable resource developers and otherswho do not emit GHGs and would not therefore receive an allocation to use or trade)?
4. Compliance Flexibility: How can such a system be designed to allow sufficientcompliance flexibility – including trading, acquiring offsets from energy efficiency,renewable energy and/or GHG sequestration, and financial off-ramps – while stillachieving real reductions of GHG emissions and a transition to a low-carbon energysupply system? Can we quantify these different kinds of contributions in comparableand tradable units? Can we, while avoiding being prescriptive, ensure a diverseportfolio of responses? How can we credit the appropriate utilities and ratepayers forthe contributions of non-utility participants such as the Energy Trust of Oregon?
5. “Leakage”: How can such a system be designed to withstand “leakage” or gamingresulting from reallocation of generating resources across state boundaries? Inparticular, is there a way to account for new and existing resources among the statesPacifiCorp serves, so that Oregon emissions reductions do not translate into emissionincreases elsewhere in the PacifiCorp system?19
6. Economic Development: How can such a system be designed to capture economicdevelopment benefits for Oregon including developing technologies, products andservices for marketing outside the state? How can it be designed to reinvest energyefficiency savings into new job-creation and carbon-saving investments? Can we devisestrategies for reconciling such investment objectives with the goal of keepingcompliance costs manageably low?
7. Protecting Oregon’s Competitiveness: How can a system be designed to capture theeconomic gains of Oregon’s investments in GHG mitigation, while avoiding loss ofcompetitiveness in energy pricing between Oregon and its neighbor states or othercompetitors? If there are near-term rate effects – costs or benefits – how can they beallocated in an equitable manner? How can a “safety valve” be designed into thesystem to create temporary breathing room to respond to critical competitivenessissues, energy market price spikes or other unanticipated and transient pressures?
8. Federal Preemption: Could such a mechanism be fitted with an automatic response –that is, an “off-ramp” – in the event of meaningful federal action that could constitutepreemption. What should be considered “meaningful” federal action?
19 Both this leakage issue and PacifiCorp’s concerns about inconsistent state-by-state treatment could be addressed,in part, if Washington and California were to adopt compatible emissions credit trading mechanisms.

page 70 | Oregon Strategy for Greenhouse Gas Reductions
The discussion below focuses on CO2, the principal GHG emission from fossil fuel and electricityuse. To stabilize CO2 concentrations in the atmosphere at roughly double pre-industrial levels,world-wide CO2 emissions will have to be reduced by 60 to 80 percent of the 1990 rate this century.Cumulative CO2 emissions over the 21st century are the key variable. This is the only proposedoption other than a CO2 tax that could reduce Oregon’s electric emissions below the 1990 level.Other energy efficiency and generation actions primarily impact the amount and mix of newgenerating plants. If adopted, this measure could provide substantial incentives for renewable resourcedevelopment, which would make Gen-2a (a Renewable Portfolio Standard or RPS) unnecessary.Alternately, an RPS could be enacted as one tool to assist the State and energy suppliers in complyingwith the allowance curve. The measure could also address the risks to Oregon’s utilities and ratepayersof likely future carbon regulation affecting new coal plants.
To stabilize climate in this century requires reducing emissions from existing power plants. Someolder coal-fired plants will be almost 100 years old in 2050. Without new regulations, these plantsmight continue to operate past 2050.
Clear long-term guidance on CO2 is needed for utility planning. Utilities are considering retrofits atcoal plants to reduce emissions of criteria pollutants (e.g., subject to Clean Air Act constraints) andmercury. If utilities face clear CO2 emission limits in the near future, they can avoid wasting moneyupgrading the oldest coal-fired power plants and later having to shut them down because of CO2
regulations.
To begin to address the difficult long-term issues, Northeast and Mid-Atlantic states are consideringa regional cap-and-trade system for electric CO2 emissions. Depending on how an Oregon or WestCoast allowance mechanism is designed, Oregon and other West Coast states might be able toparticipate with an East Coast trading system and lower costs to achieve the needed emissionsreductions.
Eastern states are designing a system based on allocations to generating plants located in theirstates. Designing allowances on GHG emissions for only those power plants located in Oregonwould be inequitable for the state’s two largest utilities. PGE has most of its fossil-fueled generationfacilities in Oregon, while most of PacifiCorp’s plants are in other states. Even though the disparitiesare less severe in the Northeast, this problem is serious enough to consider a different kind of cap.
Another problem with an allowance solely for in-state plants is that it might only encourage newpower plants to be built outside of Oregon as it becomes more stringent. If so, this would onlyharm Oregon’s economy with no reduction in CO2 emissions.
Rather than a system based on generating plants located in Oregon, this action would develop asystem to allocate emissions from utility power plants and purchases to their Oregon load and setlimits on those emissions. This system is sometimes referred to as a load-based cap-and-trade system.It would be consistent with Oregon’s CO2 accounting system and the Oregon Public UtilityCommission’s (OPUC) labeling requirements for PacifiCorp and PGE.
Such a limit would be on total tons of utility CO2 or GHG emissions, calculated by the pounds perkWh of utility generation sources multiplied by kWh of load during an accounting period, such as

Governor’s Advisory Group On Global Warming | page 71
annually. The limits could be designed to provide the appropriate trajectory of utility emissions forthe 21st century. The limits for early years could be near existing emission levels. The limit would bereduced on an established, predictable curve through 2050 to achieve the desired mid-centuryemissions levels.
An alternative is to set limits only on the emission rates (pounds of CO2 per kWh for each load-
serving entity) rather than total CO2 tons emitted. This is referred to as an emissions portfolio
standard (EPS). While more comprehensive than a Renewable Portfolio Standard (see Gen-2a below),an EPS does not ultimately limit total emissions and would not incorporate emissions reductionsfrom energy efficiency actions.
A greenhouse gas allowance system (unlike an EPS, an RPS or a ban on new coal plants) should bedesigned to allow utilities to minimize the cost of meeting an emissions target. An allowance systemmay allow explicit consideration of imported power and recognition that new gas-fired generationmay serve to reduce overall average emissions from electricity generation and may also complementnew, intermittent renewable generation such as solar and wind. If one utility has lower-cost energyefficiency or generation options, it can reduce its emissions below its allowance and sell allowancesto another utility or load-serving entity. This trading could occur between East Coast and WestCoast utilities if states adopted a coordinated system. It could also include appropriately designedproject offsets. Allowing the use of project offsets can help limit the costs of meeting the limits onCO
2 emissions.
There are many details to be worked out. For example, utility limits would need to deal with lossof load through changes in utility service territories or customers choosing retail access suppliers.The design of the Oregon system should be coordinated with other states wherever possible.
GEN-2a: The GEN-2 interim task force should also consider an OregonRenewable Portfolio Standard (RPS) and potential changes to public purposecharges as tools to meet a greenhouse gas allowance standard and overallstate CO2 goals.
Through legislation, substantially expand the amount of new renewable power projects. This couldserve as a strategy to implement Gen-2 (above) and to be considered by the special interim task forcethat examines the feasibility of, and develops a design for, a load-based GHG allowance mechanism.This option could be accomplished with a renewable portfolio standard (RPS) complementing theexisting public purpose charge for renewables. If applied in support of GEN-2, an RPS could helpprovide a better balance in the types of renewables. The mix should include small amounts ofpromising, but relatively expensive, renewable sources. This could help achieve aggressive long-termGHG emission goals. An RPS, together with Oregon’s existing public purpose funding mechanism,can help achieve an appropriate mix and pace of renewable development.
The fraction of load-growth met by renewable resources could be increased by adopting an RPSfor Oregon electric utilities and other retail electric suppliers. Another approach would be toexpand the 0.5 percent renewable portion of the public purpose charge applied to PGE andPacifiCorp retail electric bills from SB 1149 (1999 session). In either case, the 0.5 percent

page 72 | Oregon Strategy for Greenhouse Gas Reductions
renewable public purpose charge should not be repealed entirely, because part of the funds go torenewables such as solar photovoltaics. These are expensive now, but have good long-termpotential.
There are several states with an RPS that could serve as a model. A poorly devised RPS could implyaction but be ineffective. Any RPS legislation would have to address several issues. These issues include:
• Resource eligibility (perhaps including separate targets for resources or sub-resourcetechnologies within each category; inclusion of hydro and definitions of biomass tend tobe controversial)
• Vintage (only projects built after a specific year)
• Size of targets (absolute capacity or energy, percent of load, or percent of load growth)
• Timing of targets (deferred until a time when loads have grown or fixed targets for specificyears)
• Compliance paths (whether to require bundled power purchases or whether to allowrenewable energy certificates or “green tags”)
• Price or cost caps (absolute or pegged to shifting market values)
• Covered entities (all utilities or investor-owned only, inclusion of retail access suppliers)
• Geographic eligibility (in- and out-of-state plants or in-state only)
• Banking (carryover from over-compliance years to future years and true-up provisions)
This legislation would be highly complex and controversial. It may be perceived as violating thelegislative intent of SB 1149. If so, this could lead to repeal of the renewable portion of the existingsystem benefit charges.
Having a 15 percent RPS by 2025 (as percent of 2025 load) would reduce annual carbon dioxideemissions between 3.6 MMT CO2 (if it had the effect of banning new coal-fired power plants), and2.8 MMT CO2 (if it did not). A 25 percent RPS would fulfill all new baseload requirements anddisplace some existing gas- and coal-fired generation under the energy efficiency case forecast ofone percent annual load growth. Estimated savings are 7.0 MMT CO2 in 2025.
An RPS could be designed with earlier implementation for earlier savings, but an RPS is generallydesigned to address only new power plants that serve load growth. An RPS that acquires moreelectricity than is needed for load growth would necessarily back down existing generatingplants, either utility-owned or purchased. However, without further direction, the plants wherereductions occur may not be the least-cost source of CO
2 reductions. Emissions from existing
plants would be better addressed by a load-based cap and trade system.

Governor’s Advisory Group On Global Warming | page 73
GEN-3: Support the Oregon Public Utility Commission’s (OPUC) review of rulesand tariffs for renewable and combined heat and power (CHP) facilities.
Support Oregon PUC’s review of rules and tariffs to ensure they accurately reflect the costs andbenefits to the utility system from CHP systems, also called cogeneration, especially within thedistribution system. Also recommend that consumer-owned utilities conduct similar reviews. Thisshould increase the number of CHP systems, especially efficient gas-fired technologies, whichhave lower CO
2 emissions than stand-alone gas generation and much lower emissions than coal
plants. This requires action by an independent board or commission, but could be ranked as easybecause the OPUC, which covers 72 percent of Oregon load, has begun this process. Theemissions reduction in 2025 could be 0.54 MMT CO
2 per year assuming displacement of 200
average megawatts of the assumed mix of half coal and half gas-fired power plants.
GEN-4: Encourage state government to purchase renewables.
Suggest that the Governor establish a 2005-2007 budget for renewable purchases by state agencies.This could be through a “one percent for renewables” requirement for new state and universitybuildings (similar to the “one percent for art” program) or through state purchase of renewablepower or renewable energy certificates (green tags) without the power. Spending the funds on visibletechnologies in new buildings, such as solar photovoltaic (PV), daylighting or ground-source heatsystems, might increase public awareness and advance distributed renewable technologies more thanpurchases of renewable power. A combination of new building measures and purchases is possible.These options would require legislative approval of funding, but might not be controversial, depend-ing on the level of funding.
Buying renewable power, along with renewable energy certificates, would insulate state energy billsfrom future fossil fuel cost increases or CO
2 regulations. If the State buys only the certificates, it
would reduce the added costs to state government for the same number of megawatt hours of renew-able claims by the State, but would not provide the price stability benefit.
Eugene Water & Electric Board (EWEB) is the only utility or retail electricity service supplier (ESS)that offers a fixed-price renewable product. The City of Portland is exploring this idea with PortlandGeneral Electric, either as a utility product or with PGE helping shape a renewable product from anESS. If state government pursues this idea, it should be in collaboration with the City of Portland.
This measure refers only to costs of renewable energy in excess of the expected market price of elec-tricity or fuel. Even if renewable resources are more expensive than expected market purchases, theywould help insulate future state budgets from electric and natural gas price spikes. If actual fuel orelectricity prices are higher than expected, these actions would reduce the cost of state operations overthe lifetime of the buildings. It is unlikely fuel or electricity prices will be substantially below currentlevels. The 2000-2001 West Coast energy crisis showed that upside price risk is nearly unbounded.
During the last 15 years, the State spent about a billion dollars on new state buildings. Onepercent of this would be about $670,000 per year. For comparison, spending this same amounton the above-market cost of electric renewables purchases would make about one-third of the

page 74 | Oregon Strategy for Greenhouse Gas Reductions
state government’s power renewable (assuming renewable power costs $5/MWh more thanwholesale market power). This would add 2 to 3 percent to the State’s electric bill. This wouldsave 0.08 MMT CO
2 per year if the displaced mix of new generation were half coal and half
natural gas-powered plants.
GEN-5: Advocate for specific federal policies or legislation.
State agencies could advocate for federal policies (U.S. DOE and EPA) on:
• energy tax breaks (including the renewable production tax credit);
• a Renewable Portfolio Standard;
• CO2 caps (such as the McCain-Lieberman Climate Stewardship Act);
• CO2 or other energy taxes;
• budgets for research, development and demonstration;
• appliance and equipment efficiency standards;
• biological and non-biological sequestration research and programs; and
• material use/recycle/disposal research or programs.
For critical legislative issues the Governor could work with the Oregon Congressional Delegation.
GEN-6: Advocate with Bonneville Power Administration (BPA) to supportOregon’s renewables measure.
BPA’s role in the Northwest since the passage of the NW Power Act of 1980 has been to supportdevelopment of resources designated by the Act as higher priority (conservation and renewables)through direct acquisition, customer utility programs, products and transmission services. BPA’s roleis particularly pivotal with COUs, many of whom are small and reliant on the services the largerfederal agency can provide.
BPA owns and operates the largest part of the Northwest transmission system and manages anddispatches output from the Federal Columbia River Power System. BPA also has the greatestcapability to integrate and firm up intermittent generating technologies such as wind.
Oregon’s renewable generation actions will be more effective if BPA continues to actively providesuch support. Oregon should work with BPA in the following areas: a more effective Conservationand Renewable Discount, transmission sufficiency, affordable integration services, power rate designsthat provide incentives for COUs to develop renewable resources; new non-firm and “near-firm”transmission products; and strategic renewable resources acquisitions. For critical issues, theGovernor could support BPA through intervention with the Oregon Congressional Delegation.

Governor’s Advisory Group On Global Warming | page 75
Transportation Actions to Reduce Greenhouse Gases
Issue: One-third of Oregon’s total greenhouse gas (GHG) emissions are from vehicle exhaust.Cost-effective opportunities to reduce these emissions are available, particularly in urban areas.
Solutions: Two categorical solutions are: 1) to reduce GHG emissions from consumption offossil fuels by displacing conventional combustion engines with hybrid, electric and othertechnological/fuel options, and 2) to guide land use choices, especially in Oregon’s urban areas,toward more efficient choices including higher densities, transit options, mixed-useneighborhoods, and common wall dwelling designs.
TABLE 1 (TRAN)
Transportation Actions
Reductions in C/E?**Greenhouse Gas
Emissions in MMTCO2E2025
TRAN-1 Convene an interim task force to recommenda proposal for the Environmental QualityCommission or the Governor and the Legislatureto adopt emission standards for vehicles.
TRAN-1a: Adopt Low Emission Vehicle (LEV II) 0.24 YEmission Vehicle Standards.
TRAN-1b: Adopt greenhouse gas Tailpipe > 6.0 YEmission Standards (per California AB 1493“Pavley” standards).
TRAN-2 Integrate land use and transportation decisions 0.40 Ywith greenhouse gas consequences.
TRAN-3 Promote biofuel use and production. 1.0 Y
CATEGORY II – OTHER IMMEDIATE ACTIONS
TRAN-4 Review and enhance state tax credits and local -* ?incentives for citizens purchasing highefficiency vehicles.
TRAN-5 Incorporate greenhouse gas emission impacts - Yinto transportation planning decisions.
TRAN-6 Expand “Transportation Choices Programs” - Yand “Travel Smart Pilots.”
TRAN-7 Adopt state standards for high efficiency/low 0.12 Yrolling resistance tires.
TRAN-8 Reduce GHG emissions from government - Yfleet purchase and vehicle use.
CATEGORY I: SIGNIFICANT ACTIONSFOR IMMEDIATE STATE ACTION

page 76 | Oregon Strategy for Greenhouse Gas Reductions
TRAN-9 State and local governments should switch to 0.10 Y“clean diesel” fuel, vehicle purchases and retrofits.
TRAN-10 Adopt state and local incentives for high - Yefficiency vehicles.
TRAN-11 Set and meet goals for reduced truck idling - ?at truck and safety stops.
TRAN-12 Set up traffic flow engineering “Best Practices.” 0.08
TRAN-13 Set and meet goals for freight (truck/rail) - ?transportation efficiency; achieve this throughequipment, coordination and land use.
TRAN-14 Establish consumer awareness education link - Yto transportation choices.
TRAN-15 Improve mass transit and inter-city transit links.
TOTAL 7.84
* Symbol “-” denotes savings of less than .0001, or unable to be estimated.** Column four asks if the action is cost-effective (C/E) - yes (Y) or no (N) - to the consumer overthe action’s lifetime. (This does not include whether it is cost-effective considering the projectedeffects of global warming.) A question mark means that the estimates of cost-effectiveness areuncertain and more analysis is needed. Refer to Figure 8 in Part Two, Section 1 (Introduction toRecommended Actions) for the cumulative impact of actions.
Background
The goal of this effort is to reduce GHG emissions from transportation-related activities inOregon. Oregon can achieve this goal by optimizing freight and people movement through theuse of new technologies and diverse modes, land use planning and the use of low carbon-contentfuel. As a result, Oregonians will live in a healthier environment and show leadership in meetingthe challenge of global warming.
How we plan for our future and build our communities can reduce GHG emissions and bringother benefits. Communities can create a range of housing choices, mixed uses and a variety oftransportation choices. Mixed uses can provide for more efficient use of buildings. Communitiescan plan for streets and land use in a way that creates livable, transportation-efficientcommunities. Providing safe streets for bikes and walking can lead to healthier lifestyles. Adultscan walk or ride bikes to work and children can walk or ride bikes to schools. Such walkableneighborhoods create a strong sense of place. Strengthening development in existing communitiesthrough coordinated land use and transportation planning can help preserve open space, farmand forest lands, natural beauty, and critical environmental areas. Strengthening existingcommunities can also make transit a feasible alternative. Building upon existing infrastructure isalso a more fiscally sound public policy.

Governor’s Advisory Group On Global Warming | page 77
Transportation and electricity use are Oregon’s two largest contributors to GHG emissions –more than each of these other direct energy use sectors: industrial, commercial or residential.One-third of Oregon’s GHG emissions is from transportation. Modes contributing to theseemission levels include cars, light trucks, sport utility vehicles (SUVs), buses, large trucks,airplanes, trains and marine vessels. In Oregon there are over 3.1 million motor vehicles registered forroadway use. Oregonians spend more than $3 billion for transportation fuels each year.
A balanced approach is needed to improve Oregon’s climate, air quality and transportationefficiency objectives. Alternative transportation fuels and better designed vehicles can providelower emissions and insulation from petroleum price spikes. A reduction in emissions from alltransport sectors can result in a more stable climate, cleaner air and more livable communities.
It is difficult to rank actions separately based on their GHG emission-savings potential. Therankings can be misleading for a number of reasons. For example, emission standards could beset at various levels, thus affecting the level of GHG savings from actions that reduce vehiclemiles traveled. In addition, most of the following actions are listed exclusive of each other.However, it will be a combination of these ideas that will produce the greatest benefit.
Estimates of effectiveness rely upon key economic and behavioral assumptions, which aresomewhat uncertain. Strategy effectiveness depends on vehicle emissions and upon the responseof travelers to changes in fuel prices (price elasticity), non-monetary travel costs (i.e., time) andland use patterns. Alternative assumptions about economic parameters and determinants oftravel demand can also lead to different policy impacts.
Current Emission Levels and Trends in the Transportation Sector
According to U.S. Department of Energy (USDOE) Energy Information Administration data,1990 Oregon emissions were 18.3 million metric tons (MMT) of CO
2. By the year 2000,
emissions reached 21.5 MMT CO2, for an annual growth rate of 1.6 percent. Based on the
Oregon Department of Transportation’s forecast for taxed fuels and USDOE forecasts for jet fueland freight diesel, the Oregon Department of Energy (ODOE) forecasts an annual growth rate of1.6 percent, leading to emissions of 32.0 MMT CO
2 by the year 2025. The current
transportation CO2 emissions are forecast to grow 33 percent between 2000 and 2025.

page 78 | Oregon Strategy for Greenhouse Gas Reductions
Figure 1 (TRAN)Historic and Projected CO2 Emissionsfrom Transportation Use in Oregon
TRAN-1: Convene an interim task force to recommend a proposal for theEnvironmental Quality Commission or the Governor and the Legislature toadopt emission standards for vehicles.
Specific Recommended Actions:
• TRAN-1a: Adopt Low Emission Vehicle (LEV II) Standards.
• TRAN-1b: Adopt greenhouse gas Tailpipe Emission Standards (per California AB 1493,“Pavley” standards).
Currently, Oregon adheres to emission standards (Tier 2 Program) for passenger vehicles set bythe federal government. Under federal law, Oregon could adopt California’s stricter tailpipestandards. Doing so would ensure that auto-makers selling passenger vehicles in Oregon couldonly sell vehicles that produce less air pollution and fewer global warming gases than thenational average.

Governor’s Advisory Group On Global Warming | page 79
LEV II Standards: Current California emission standards fall under its Low Emission Vehicle IIprogram requirements. The LEV II program establishes emission standards for all new cars soldin California or any state that adopts the program. These standards are designed to addresscriteria pollutants (non-methane organic gas [NMOG], nitrogen oxides [NO
x], and carbon
monoxide [CO]). California first adopted its first Low Emission Vehicle (LEV) standards in1990. They were aimed at lowering the emissions of passenger and light duty vehicles. The LEVstandards ran from 1994-2003. LEV II regulations, running from 2004 to 2010, representcontinuing progress in emission standards. New “Pavley” standards, discussed below, will applyto motor vehicles manufactured in 2009 and thereafter. Adopting LEV II before Pavley comesinto effect means that the standards automatically progress from LEV II to Pavley.
New York, Massachusetts, Connecticut, Vermont and Maine have adopted the California LEV IIemission standards under Section 177 of the Clean Air Act. In addition, the State of Washingtonis pursuing the adoption of LEV II standards. Canada, a Kyoto Protocol signatory and itself asignificant part of the North American vehicle market, is also likely to adopt tailpipe standardsidentical or comparable to the California “Pavley” standards. Vehicles that meet those currentstandards (which do not include new “Pavley” standards) result in about a $200 added stickerprice compared to federal standards.
The LEV II program consists of two components: the LEV requirement and the advanced technologyvehicle program. Under the California standards, 90 percent of a manufacturer’s vehicle fleet isrequired to meet strict baseline emissions standards. Some studies have found that the emissionstandard for LEV vehicles, which is stricter than the federal standard, and can be achieved throughthe application of conventional pollution-control technology to the internal combustion engine. Theremaining 10 percent of the vehicle fleet must be lower emitting than LEV standards, which qualifyfor credits under the advanced technology component of the program. The advanced technologycomponents of the LEV II standards are summarized in the following table.
TABLE 2 (TRAN)Advanced Technology Requirements of theLEV II Emission Program, 2005-2008
Category Vehicle Type Examples Percent of Percent of TotalTotal Fleet Alternative
Compliance
Gold Pure-Zero Emission Electric vehicles 2 250 total fuel cellVehicle (PZEV) and fuel cells vehicles by 2008
Silver Advanced technology High Efficiency 2 3(AT) ZEVs Vehicle (HEV),
CNG* vehicles
Bronze SULEVs Super Ultra Low 6 6Emissions Vehicle(SULEV)
*Compressed natural gas

page 80 | Oregon Strategy for Greenhouse Gas Reductions
AB 1493 (Pavley bill) Standards: In 2002, recognizing that global warming would imposecompelling and extraordinary impacts on California, the legislature adopted and the Governorsigned AB 1493. That bill directs the California Air Resources Board (CARB) to adoptregulations to achieve the maximum feasible and cost effective reduction of GHG from motorvehicles. The Pavley standards would take effect for the 2009 model year when the LEV IIprogram expires.
The Pavley bill requires that the new regulations be economical to the consumer over the lifecycle of the vehicle. Consistent with this direction, the technology packages that provide the basisfor the standard result in operating cost savings that exceed the initial capital cost. This results ina net savings to the consumer over the life cycle of the vehicle.
On September 23, 2004, CARB adopted regulations that achieve “the maximum feasible andcost-effective reduction of GHG emissions” from passenger vehicles and light-duty trucks. TheCalifornia legislation requiring CARB to develop these GHG regulations explicitly states thatCARB cannot impose taxes or restrict speed limits, vehicle size, or other consumer drivingchoices. It also gives auto-makers flexibility in meeting GHG emissions targets.
The regulations will go into effect in January 2006 and will apply to motor vehiclesmanufactured in model year 2009 and thereafter. Criteria to be used in determining “maximumfeasible and cost-effective” include: 1) the ability to be accomplished within the time provided,considering environmental, economic, social, and technological factors, and 2) the economy tovehicle owners and operators, considering full life-cycle costs of a vehicle. CARB is required toconsider the technical feasibility of the regulations and to consider their impact on the state’seconomy including jobs, new and existing businesses, competitiveness significantly affected by aircontaminants, automobile workers and related businesses in the state. CARB is also flexible, tothe maximum extent feasible, in terms of complying with the regulations. CARB must ensurethat any alternative methods for compliance achieve equivalent or greater reduction in GHGs.
Under the new Pavley standards, the average first cost increase will be about $367 per passengervehicle in 2012 and about $1,064 per passenger vehicle in 2016. The retail vehicle price increase isslightly less for SUVs and large trucks. This range results from the phasing in of higher standardsstarting in year 2009 and continuing through 2016. By 2020 the estimated savings from maximumfeasible technology will result in a reduction of about 18 percent in total GHG emissions frompassenger cars and light duty trucks and a 28 percent reduction by 2030. Despite higher initial costs,vehicles that meet these standards are less expensive over the life of the vehicle.
The Oregon Environmental Quality Commission has the authority to adopt emission standardsfor passenger and light duty vehicles, however legislative support would likely be prudent.Therefore, the Governor might choose to ask the Legislature to adopt the standards, given thesignificance of the action. By adopting California’s vehicle emission standards, Oregon will havein place a progressive standard to curb emissions from vehicles, which will have a significantimpact on meeting the Oregon Progress Board benchmark on climate change and the new goalsrecommended by the Advisory Group.

Governor’s Advisory Group On Global Warming | page 81
TRAN-2: Integrate land use and transportation decisions with greenhousegas consequences.
Specific Recommended Actions:
• Revise the Oregon Transportation Plan to consider and implement non-road alternativesbefore road capacity is expanded. Alternatives that could be implemented now includetransportation demand management and expanded transit service. Intelligenttransportation systems and value pricing can be considered for later implementation.
• When transportation plans are updated and air quality conformity determinations arerequired, calculate estimates of GHG emissions from transportation sources using EPAapproved methods. Comparisons with earlier GHG emission forecasts should be madeavailable to document change over time.
• Through local planning and state policy, target infrastructure investments in GHG efficientlocations (locations where people’s homes are located near the places they regularly go).
• Foster a Location Efficient Mortgage pilot program, such as Fannie Mae’s SmartCommuteTM Initiative to encourage home ownership near public transportation.
The primary purpose of integrating land use and transportation decisions is to reduce the need totravel (or reduce trip length) by providing nearby access to goods and services. The State shouldconsider policies to further limit sprawl and encourage efficient development of residential,commercial and industrial lands.
This action supports continued integration of land use and transportation planning byincorporating “Smart Growth” principles in decision-making processes, particularly inapplication of Goal 12 and 1320 for Transportation and Energy, respectively. Smart growthconcepts related to transportation include:
• Promoting transit oriented development
• Mixed-use development
• Minimum street connectivity standards
• Minimum densities and/or minimum floor-area ratios and parking standards (e.g.,reducing the minimum number of parking spaces required, employee cash payoutprograms and pricing parking)
Specific standards for the strategies listed above will vary by community.
The State could accelerate “smart growth” objectives by continuing to support the on-goingimplementation of the Transportation Planning Rule (TPR) and Transportation GrowthManagement program that provides funds to local governments to help carry out TPR planning.
20 Oregon Land Conservation and Development Commission’s 19 Statewide Planning Goals and Guidelines.

page 82 | Oregon Strategy for Greenhouse Gas Reductions
Studies of the vehicle miles traveled (VMT) impacts of integrated packages of land use andtransportation measures have found regional and statewide VMT reductions ranging from 2-10percent below business-as-usual projections, resulting in roughly equivalent CO
2 reductions
(1 VMT equals about 1 lb. of CO2 emitted).
TRAN-3: Promote biofuel use and production.
Specific Recommended Actions:
• Establish fuel standards that meet engine makers’ requirements.
• Require nearly all diesel fuel sold in the state to contain at least 2 percent biodiesel (B-2)by the time Ultra Low Sulfur Diesel (ULSD) fuel is mandated by the federal government(mid 2006). ULSD requires the use of a lubricity additive; biodiesel is a non-toxic lubricityagent.
• All diesel fuel sold in Oregon will contain 5 percent biodiesel (B-5) by 2010, growing to20 percent (B-20) by 2025. All biodiesel will meet applicable American Society for Testingand Materials standards.
• Adopt a statewide ethanol fuel requirement for all gasoline sold in Oregon, such as allstandard gasoline sold in Oregon will contain 10 percent ethanol by 2010.
• Mandate a minimum biofuel content for all state-owned fueling stations; for example, 10percent of the gasoline used by state government vehicles will be E-85 by 2010 and 20percent of the diesel used by state fleet vehicles will be B-20 by 2010. This percentage willgrow to 25 percent by 2025.
• Review the effectiveness of federal and state incentives for producers, blenders or retailers.
Recommended biofuels include biodiesel and ethanol that reduce GHG emissions. Biodiesel candisplace conventional diesel with blends ranging from 2-100 percent. Blends up to 20 percentrequire no engine modifications. Ethanol can be blended with conventional gasoline up to 10percent without any engine modifications. Blends using 85 percent ethanol (E-85) require slightengine modifications.
Biodiesel is a cleaner burning alternative fuel, produced from domestic, renewable resources. Itcontains no petroleum, but it can be blended at any level with petroleum diesel to create abiodiesel blend. It can be used in compression-ignition (diesel) engines with little or nomodifications.
According to a USDOE/USDA life cycle analysis, biodiesel has the highest energy balance of anyfuel. For every one unit of fossil fuel it takes to produce biodiesel, 3.2 units of energy are gained(using renewable fuel crops). That same study concluded that biodiesel also results in a 78percent lifecycle reduction in carbon dioxide.

Governor’s Advisory Group On Global Warming | page 83
Ethanol alcohol fuel is usually mixed with gasoline at 85 percent ethanol and 15 percent unleadedgasoline to form what is called E-85. Currently, gasoline in Oregon has zero to 10 percent ethanol,with an overall average of 2 to 3 percent. No E-85 fuel is commercially available in Oregon.
Typically derived from distilling corn, ethanol is also a byproduct of starch manufacturing.Depending on the life cycle of the feedstock, how it is transported and the production process tomake ethanol, ethanol from corn can reduce GHG emissions. Ethanol made from cellulose (e.g.,woody crops, wood waste, switchgrass, agricultural residues, municipal solid wastes) generatessubstantially fewer GHGs than fossil fuels or ethanol made from corn, but the technology toproduce cellulosic ethanol is not developed.
TRAN-4: Review and enhance state tax credits and local incentives forcitizens purchasing high efficiency vehicles.
This action reviews and considers modifying the Business Energy Tax Credit and the ResidentialEnergy Tax Credit programs to ensure that they are effectively promoting the purchase of morefuel-efficient vehicles. An incentive could be based on the fuel efficiency (miles per gallon) of thevehicle rather than a specific technology.
ODOE offers tax credits to assist the added costs of alternative fuel vehicles. These vehiclesinclude those powered by ethanol, methanol, electricity, compressed natural gas, liquefiednatural gas, liquefied petroleum gas, biodiesel, hydrogen, and hybrid vehicles.
Purchasing more efficient lower-emission gasoline-powered vehicles provides benefits similar toalternative fuels, most often at a lower first cost. The tax credit program could be reviewed toinclude fuel efficiency and polluting qualities of the vehicle, rather than the vehicle technology.The tax credit available to private citizens, now at $1,500 per vehicle, could be raised to paritywith the credit available to businesses under the Business Energy Tax Credit program at about$2,000 per vehicle.
TRAN-5: Incorporate GHG emission impacts into transportation planningdecisions.
Specific Recommended Actions:
• Develop a mechanism to better coordinate growth forecasts and Urban Growth Boundarydecisions within each metropolitan area and adjacent “travel-sheds.”
• Develop a method to account for GHG emissions and use it as a ranking criterion intransportation planning decisions. (e.g., MOBILE 6.2 software)
• Communicate to the Oregon Road User Fee Task Force the need to keep incentives inplace for the purchase of fuel-efficient vehicles.

page 84 | Oregon Strategy for Greenhouse Gas Reductions
Incorporating climate change as a key criterion in Oregon Department of Transportation(ODOT) funding decisions would provide an opportunity to give priority to those serviceimprovements and expansions that offer the greatest GHG reductions. Use of the MOBILE 6.2air quality software could be required as a readily available tool for estimating likely GHGemission results.
The Oregon Road User Fee Task Force is charged with developing a road user fee that will eventuallyreplace the gas tax. While a vehicle miles traveled fee might make sense from a road-user equityperspective, a switch to such a fee might influence consumers to purchase less fuel-efficient vehicles,because the cost impact of different fuel efficiencies (miles per gallon) will be less.
TRAN-6: Expand “Transportation Choices Programs” and “Travel Smart Pilots.”
Specific Recommended Actions:
• Expand City of Portland TravelSmart programs. City of Portland programs includeenvironmental and air quality, education, and transportation options.
• Expand CarpoolMatchNW.org statewide and enhance marketing. Encourage the use ofODOT’s TripCheck program.
• Provide incentives for investment in station car services (car-sharing link to mass transit).Station service cars would allow access to ‘car-share’ vehicles at transit stations.
• Using existing transit and social service programs, promote the State’s use of additionalflexible federal funds to support the efforts of transit providers to coordinate elderly anddisabled transportation options.
The Department of Environmental Quality (DEQ) manages the Employee Commute Optionsprogram and ODOE provides tax credits and technical assistance to businesses that encouragealternatives to driving alone, such as telecommuting (teleworking). Transportation ManagementAssociations (TMAs) work with major employers to reduce single occupancy vehicle commuting.TMAs assist in coordinating vanpools, carpooling and formation of transit pass programs; thesealso offer information about transportation demand management options.
TravelSmart is a social marketing program that identifies individuals who want to change theway they travel, motivates them to think about their travel options, and provides them withinformation about how to use transit, bike, walk or carpool for some of their trips.
TRAN-7: Adopt state standards for high efficiency/low rolling resistance tires.
Specific Recommended Actions:
• Use the West Coast states’ combined purchasing power to reduce petroleum dependenceby obtaining “low-rolling resistance” (LRR) tires for motor pool fleets.

Governor’s Advisory Group On Global Warming | page 85
• Ensure state procurement by requiring state fleets to purchase LRR tires; encourage localgovernments to act consistently with and support state procurement on their behalf.
• Develop a marketing program with tire dealers and consumers to encourage the purchaseof LRR tires. This effort might include a voluntary labeling program for tire fuel efficiency.
• Alternate 1: Establish West Coast mandatory labeling requirement by 2010.
• Alternate 2: Establish legislation to set LRR standards for tires by 2010.
Fuel efficiency is directly related to rolling resistance (RR). The greater the RR, the more fuel isburned. The average RR of replacement tires is about 20 percent higher than that of tires thatautomakers put on new cars. Ecos Consulting estimates the fuel efficiency savings of using LRRtires at 3 percent annually. They estimate a typical driver would save $87 to $260 on fuel at anincremental cost of $9 to $22 for four LRR tires.
The California Legislature passed legislation in 2003 requiring the State to implement by 2008 areplacement tire efficiency program that is designed to ensure that replacement tires sold in thestate are at least as energy efficient, on average, as the original equipment.
TRAN-8: Reduce GHG emissions through changes in government fleetpurchase and vehicle use.
Specific Recommended Actions:
• Use the West Coat states’ combined purchasing power to obtain fuel-efficient vehicles formotor pool fleets; encourage local governments to act consistently with and support stateprocurement on their behalf.
• Seek a change in the implementation of the federal Energy Policy Act of 1992, whichcurrently excludes hybrid vehicles as an allowable mechanism for compliance with thealternative fuels in state fleets requirement.
• As the fleet turns over, require all state vehicles to be low-GHG and the most efficient intheir class.
• Coordinate emission standards for fleet vehicle specifications.
• Develop a model “Green Fleet” Policy Statement that describes policies and/or standardsthat consider best practices for fleets in a comprehensive way.
• Provide training for fleet managers on how to educate employees about fuel-efficient drivingtechniques, optimizing vehicle operation and maintenance, and reducing the need to travel.
Public fleets can lead by example in implementing effective purchasing policies and bestmaintenance practices. The actions above are intended not only to improve pricing and otherfactors for the three states’ purchases, but also to have a positive impact on the market forefficient vehicles and replacement parts.

page 86 | Oregon Strategy for Greenhouse Gas Reductions
TRAN-9: State and local governments should switch to “clean diesel” fuel,vehicle purchases and retrofits.
Specific Recommended Actions:
• Support DEQ’s efforts to create a buying club for ultra low sulfur diesel fuel, as well as itswork to promote diesel engine retrofits to reduce black carbon (soot) emissions.
• Establish a state contract requirement for low-emission fleets and construction equipment.
• Clean up Oregon’s school bus fleet by providing funding for replacement of older schoolbuses, retrofit of newer school buses, and purchase of biodiesel fuel. This would haveimmediate positive impacts on children’s health and safety and would result in CO2
reductions, as well as black carbon emissions. EPA has allocated funds to retrofit schoolbus fleets under the Clean School Bus USA demonstration program (www.epa.gov/otaq/schoolbus/funding.htm).
DEQ is working to promote voluntary retrofit of diesel engines in both on- and off-highwaysituations. Users of heavy-duty diesel engines, who retrofit with emission controls, can qualifyfor a credit against Oregon income taxes of up to 35 percent of the retrofit costs. Retrofits wouldreduce emissions of black carbon, which contribute to the greenhouse effect.
TRAN-10: Adopt state and local incentives for high efficiency vehicles.
Specific Recommended Actions:
• Pursue legislative approval of a climate-friendly vehicle registration fee (2007).
• Encourage local governments to devise incentive and recognition programs for hybridowners.
The State could shift the amount drivers pay to title and register their cars in a revenue neutralmanner, raising the $55 title transfer fee and $27 per year registration fee for cars with belowaverage MPG (EPA miles per gallon rating) and lowering the fees for more efficient vehicles. Thiswould have mostly a symbolic effect as the increased cost would be about the cost of a fill-up.Raising the fee for less efficient vehicles, but maintaining the fee for more efficient vehicles, couldhave more impact. In the latter scenario, the additional funds could be used to fix Oregon’sbridges and roads.
Local governments could offer revenue neutral incentives such as preferred or free meter parking,recognition decals and other incentives.

Governor’s Advisory Group On Global Warming | page 87
TRAN-11: Set and meet goals for reduced truck idling at truck and safety stops.
Specific Recommended Actions:
• Establish a core network of facilities along the West Coast Interstate 5 (I-5) corridor thatuse techniques to enable truck drivers to rest or “overnight” in their sleeper cabs; thiswould replace idling their truck engines.
• Support the Oregon Solutions Team on truck idle reduction.
• Support the West Coast Diesel Emissions Reduction Collaborative.
• Institute similar and compatible programs to encourage truck operators to use thesefacilities as they are established.
• DEQ and ODOE secure federal funding and carbon offset funding for alternatives toengine idling.
• Market existing incentives to support deployment of this technology.
• Increase the number of trucks participating in Oregon’s “Green Light” program. GreenLight allows trucks to pass over weigh-in-motion (WIM) scales and under transponderreaders to pre-clear the weigh station, thus cutting down on idling.
• Review transponder and WIM requirements of Washington and California. Implementconsistent equipment requirements along the West Coast.
Supporting the development of infrastructure will reduce diesel truck idling at truck stops andsafety stops. Currently, technology exists to outfit truck stops with a custom heating, ventilationand air conditioning system that can be ducted directly to the truck, eliminating the need for idlepower. Auxiliary power units are another solution to reduce idling of the main diesel engine.
Truck drivers idle their engines during their rest periods to provide heat or air conditioning for thesleeper compartment, keep the engine warm during cold weather and provide electrical power fortheir appliances. About 500,000 trucks travel 500 or more miles as their primary range of operation.Based on this travel distance, truck drivers will likely require an extended rest period and may idletheir engines during this time. Some studies indicate that the typical duration rest period lasts fromsix to eight hours per day over 300 days per year.
The West Coast Governor’s Global Warming Initiative sets a goal of having the I-5 corridor outfittedwith electrified truck stops to reduce truck idling. The governors of Oregon, Washington andCalifornia have made this a priority goal for each of their administrations. The goal of this projectis to establish a network of truck stop operators and truck fleet managers willing to develop thenecessary infrastructure to reduce truck idling in Oregon along the I-5 corridor. This project willlay the groundwork for a core network of facilities to enable truck drivers to use their sleeper cabsand auxiliary appliances without idling.
An Oregon Solutions Team has been convened to implement idle reduction options for Oregon.The goal of the Team is to equip 600 parking spaces at truck stops along I-5 in Oregon with idle

page 88 | Oregon Strategy for Greenhouse Gas Reductions
reduction technology. This should reduce 24,000 metric tons of CO2 annually. There are 1,977
commercial truck parking spaces on the Oregon segment of I-5 alone and about 5,000commercial spaces across the entire State. As the advantages of idle reduction technologies becomebetter known and tested, and as demand grows, the broader goal of the collaborative effort is toinstall this technology in the majority of truck stops in the State as well as throughout the West Coast.The Team partners include DEQ, ODOE, truck stop owners, Oregon Trucking Association,PacifiCorp, Oregon State University, Oregon Environmental Council and The Climate Trust.
The Oregon project is underway and funding comes from the following key partners:
• EPA is contributing $200,000.
• The Climate Trust will purchase CO2 offsets for $2 million (plus another $200,000 inWashington).
• The Oregon Business Energy Tax Credit Program (administered through ODOE) willprovide $2.3 million in credits.
• The Small-scale Energy Loan Program or SELP (also administered by ODOE) will provideloans for $1.4 Million.
• Technology providers IdleAire and Shurepower have agreed to contribute a portion ofoverall project costs, if they are selected as equipment providers, as a matchingcontribution valued at $1.6 million.
TRAN-12: Set up traffic flow engineering “Best Practices.”
Specific Recommended Actions:
• Improve signal timing by leveraging The Climate Trust, Federal Highway Administrationand City of Portland initiatives.
• Enforce speed limits.
• Apply Intelligent Transportation System solutions.
• Identify, prioritize and reduce recurring traffic congestion and optimize highway speeds tothe preferred range.
• Analyze potential projects using value pricing (i.e., congestion pricing).
Truck and auto travel is most energy efficient when vehicles travel in the 40 to 50 mph rangewithout frequent stops and starts. Traffic flow can be optimized through targeted infrastructureinvestments, traffic signal re-timing, value pricing, and investments in alternatives to theautomobile. Projects that improve traffic flow through road widening or traffic managementstrategies will reduce fuel use in the short-term if vehicles operate at more efficient speeds withless braking and accelerating. However, increasing or improving road capacity may attract moredrivers, thereby increasing vehicle miles traveled and eroding GHG benefits.

Governor’s Advisory Group On Global Warming | page 89
Intelligent transportation systems encompass a broad range of wireless and wirelinecommunications-based information, control and electronics technologies. When integrated intothe transportation system infrastructure and in vehicles themselves, these technologies helpmonitor and manage traffic flow, reduce congestion, provide alternate routes to travelers,enhance productivity, and save lives, time and money.
TRAN-13: Set and meet goals for freight (truck/rail) transportationefficiency; achieve this through equipment, coordination, and land use.
Specific Recommended Actions:
• Site industrial land/facilities along key freight corridors. Encourage warehouse anddistribution center development in existing urban areas.
• Work with ports statewide to adopt “green port” goals and promote state and federalinvestment in rail/truck/barge mode split.
• Increase rail capacity.
• Support “ConnectOregon.”
The State needs to play a larger role in addressing freight rail needs. Improvements for freight rail alsowould help address conflicts between passenger rail and freight rail needs. Actions include:
• Make strategic investments in multi-modal freight transportation options (e.g., rail,shipping, waterways and any of these in combination with road transport).
• Use Intelligent Transportation Systems (explained in TRAN-12 above) to maximize freightefficiency. Freight railroads move a significant percent of the nation’s freight and connectbusinesses with each other across the country.
“ConnectOregon” is a concept where lottery-backed bonds are used to improve connectionsbetween the highway infrastructure and rail, port, transit and marine facilities across the state.Investing in rail and marine transportation systems preserves Oregon’s highway investmentbecause commodities that travel via rail and marine tend to be heavy and low volume. If thosecommodities can be moved by rail or barge, savings will be realized in the increased life-span ofthe state’s highways.
TRAN-14: Establish a consumer awareness education link to transportation choices.
Specific Recommended Actions:
• Use and make available public awareness materials from USEPA/USDOT’s It All Adds Upto Cleaner Air program through state and local governments, transportation providers andair quality agencies.

page 90 | Oregon Strategy for Greenhouse Gas Reductions
• Participate in the development of the second generation of It All Adds Up to Cleaner Airmaterials.
• Develop an educational campaign to promote fuel-efficient driving behavior and bestpractices auto maintenance to be used as part of driver education classes in public schools,Department of Motor Vehicles programs and Vehicle Inspection Program outreach.
• Offer drivers an opportunity to donate to the Climate Trust to offset their CO2 emissions.Require that car registration materials (or car titling materials) include an educationalbrochure about fuel-efficient driving.
• Work with car dealers to promote the sale of GHG-efficient vehicles.
• Team up with gas stations to develop an anti-idling campaign, e.g., “Turn your key and beidle free.”
• Team up with the automotive service industry to offer “green” auto maintenance optionsto drivers (e.g., regular maintenance, recycled oil, bio-products, etc.) either in conjunctionwith maintenance work or oil changes.
Develop an education program to raise public awareness about the connection between globalwarming and driving. Focus on the benefits of low-GHG vehicles and available incentives for theirpurchase, as well as ways to boost fuel efficiency through driving techniques and vehicle maintenance.
TRAN-15: Improve mass transit and inter-city transit links.
Specific Recommended Actions:
• The State should make a greater commitment to funding urban transit system expansionand operation as well as inter-city transit links (rail and bus).
Transit can play a key role in reducing GHG emissions and the State should make a greatercommitment to funding urban transit system expansion and operation as well as inter-city transitpassenger rail and bus. There are many parts of the state in need of better transit systems.

Governor’s Advisory Group On Global Warming | page 91
Biological Sequestration Measuresto Mitigate Greenhouse GasesIssue: Carbon dioxide is sequestered (captured and stored) in trees, soils and other biomass.Human activities can release this carbon or increase sequestration.
Solution: To increase sequestration or reduce emissions for forest and other lands, Oregoniansneed to maintain and increase good land use practices.
TABLE 1 (BIOSEQ)Refer to Part One, Figure 8 in Section 4 for the cumulative impact of actions.
CATEGORY I: SIGNIFICANT ACTIONS MMT C/E?FOR IMMEDIATE STATE ACTION CO2E
2025
BIOSEQ- 1 Reduce wildfire risk by creating a market for 3.2 Ywoody biomass from forests.
BIOSEQ-2 Consider greenhouse gas effects in farm and 0.6 Yforest land use decisions.
BIOSEQ-3 Increase forestation of under-producing lands. 0.5 Y?
CATEGORY II: OTHER IMMEDIATE ACTIONS
BIOSEQ-4 Expand the application of water-erosion reducing 0.2 Y?practices for cereal production.
BIOSEQ-5 Leverage the Conservation Reserve Program 0.2 N?to expand reserved acreage.
BIOSEQ-6 Establish a municipal street tree restoration program. less Nthan 0.1
In the table above, column three shows estimated CO2 sequestration in million metric tons(MMT) in 2025. Column four asks if the action is cost-effective (C/E) - yes (Y) or no (N) - to theconsumer over the action’s lifetime. (This does not address whether it is cost-effective to Oregonand Oregonians broadly, considering the projected effects of global warming and the costs ofadapting to those effects.) A question mark means that the estimates of cost-effectiveness areuncertain and more analysis is needed. Because actions interact, CO2 savings cannot be added.Refer to Figure 8 in Part Two, Section 1 (Introduction to Recommended Actions) for thecumulative impact of actions.

page 92 | Oregon Strategy for Greenhouse Gas Reductions
Biomass — Suppression of Wildfires
Background: All plants use energy from the sun’s light to make their own food in a process calledphotosynthesis. During photosynthesis, carbon dioxide absorbed through leaves is broken down bythe sun’s energy and combined with hydrogen from water to make sugars that plants live on. Thisprocess releases oxygen into the air. The carbon in the sugars is stored as biomass in the plant’s leaves,branches, trunk, and roots. Plants break down the sugars into energy. This process, called respiration,releases CO
2 back into the air. Plants use much more CO
2 in making their food and storing it as
biomass than they release during respiration. The remainder of the carbon is stored in their tissues.21
Carbon sequestration performed by plant and soil systems is called biological (or terrestrial)sequestration. Plants and soils fix the CO
2 and store the carbon in living and dead plant tissues
and as organic material. Stored carbon can return to the atmosphere as CO2 when plant biomass
or soil organic carbon is oxidized or decomposes through processes such as burning or turningthe soil over. When trees are harvested and manufactured into wood products, some carbonremains stored in lumber and other wood products until the wood is discarded and disposed. If it isburned, the stored carbon is released back as CO
2. Wood discarded into landfills continues to store
carbon, but may contribute to other greenhouse gases (GHGs) from landfills such as methane.
Much work remains to reduce the risk of high carbon release during catastrophic wildfires.Expanding the amount of forest area that is treated and restored to healthier forest conditionswill reduce the risk of extreme fires. It could also provide economic benefits by using hazardouswildfire material as biomass fuel through viable markets for chips and small diameter trees.
In addition, current treatments do not take advantage of small woody biomass that can be usedfor fuel in energy production, thus displacing fossil fuel CO
2 emissions. The CO
2 savings from
increased renewable biomass projects are counted in the GEN-1 action in the Electric Generationand Supply section.
BIOSEQ-1: Reduce wildfire risk by creating a market for woody biomassfrom forests.
Dense growth has limited the size and resiliency of trees in some forested areas of the state.In the Blue Mountains of Eastern Oregon, for example, the health of large areas of forestlandhas deteriorated.
The condition of the forest in these overgrown areas is not natural. It is largely the result of firesuppression and past logging practices combined with vegetative expansion due to climatechange. Thinning removes dead, suppressed and other competing trees. It improves the health ofthe remaining trees and changes the behavior of fires. Rather than stand-replacing crown firesthat kill larger trees, fires would tend to be less intense, confined to the ground, and wouldremove under-story brush and small trees.
21 The Bio-sequestration technical subcommittee of the Governor’s Advisory Group did not look at forest managementand forest conservation. The successor advisory group will consider incorporating the findings of the West CoastRegional Carbon Sequestration Partnership as it further develops Oregon’s strategy to reduce greenhouse gases.

Governor’s Advisory Group On Global Warming | page 93
Carefully planned forest thinning activities can preserve wildlife habitat and minimize soilerosion. With less competition for nutrients and water, the remaining trees can grow and increasethe amount of carbon stored in standing trees.
However, without a market for forest fuels and small diameter timber, biomass forest thinning islimited by federal and state funds. The alternative of also removing larger, healthy and morevaluable trees could offset the cost of thinning, but would not sequester CO
2. There are not
enough funds to thin most of the overgrown areas. Development of an economic biomassgeneration technology could increase the number of acres treated.
An additional 100 MW produced from woody biomass plants would result in the thinning of 2.4million acres over 30 years. The average annual sequestration from reduced crown fires andimproved forest health would be 3.2 million metric tons of CO
2. This CO
2 reduction is in addition to,
and does not include, displacing fossil fuels with biomass fuels. The GHG benefit of displaced fossilfuels is included in GEN-1. Additional benefits from this action include rural economic development(1,600 to 2,000 direct jobs), reduced costs of fighting wildfires and avoided smoke pollution.
Viable markets for forest biomass could cover the cost of removing woody biomass fromunhealthy forests. The key is to locate smaller biomass-fueled generating plants near forests toreduce hauling costs and to reduce harvest pressure on local forests. Otherwise, the cost oftrucking the fuel would outweigh the value of the power generated. Also, diesel trucks emit CO
2,
reducing the net reduction of CO2 from sequestration.
Viable markets will require new smaller generation technologies (2 to 5 MW) and increased stateor federal incentives for constructing these small facilities. There are technical and institutionalissues with getting power onto the grid from these smaller sized plants. However, smaller plantscould improve reliability of the power grid in rural areas.
Most importantly, electric generation using biomass from thinning overstocked stands is noweligible for the federal production tax credit. Previously this tax credit was reserved for wind andclosed-loop, energy-dedicated, plantation biomass projects.
Several possible incentives could supplement the federal production tax credit. Biomassgeneration is eligible for state energy tax incentives and loans. The Public Utility Commission’sPortfolio Advisory Committee could promote environmentally sound woody biomass projects inits mix of green-tag sales to PacifiCorp and Portland General Electric. In addition, the EnergyTrust of Oregon might be able to accelerate efforts to use public purpose charge funds for small(under 5 MW) woody biomass projects.
Land Use
Background: Since 1973, Oregon has maintained a statewide program for land-use planning(Oregon Revised Statutes (ORS) 197.010 – ORS 197.245). The foundation of the program is aset of 19 statewide planning goals (Oregon Administrative Rules (OAR) Chapter 660,

page 94 | Oregon Strategy for Greenhouse Gas Reductions
Division 015 – Statewide Planning Goals and Guidelines, Oregon Department of LandConservation and Development; http://www.lcd.state.or.us/goalhtml/goals.html). Goals 4 and 5,respectively, address maintaining and conserving the forest and agricultural land base. Oregon’sstatewide goals are achieved through local comprehensive planning for city and countygovernments. This has led to a system for state-approved local comprehensive plans that coverthe entire state.
Trend (Western Oregon): During the period 1974 to the present, urban growth boundariesand land use zoning in local comprehensive plans have prevented the loss of 1.2 million acres offorest and agricultural land to low-density residential or high-density urban development (Figure1 [BIOSEQ]).
Figure 1 (BIOSEQ)Trends in Loss of Forests and Agricultural LandsWith and Without Land Use Planning
Adapted from Kline, Jeffrey D. 2004. Estimated forest and farmland conservation effects ofOregon’s land use planning program, 1984-2024. [Unpublished]. Portland, Oregon: U.S.Department of Agriculture, Forest Service, Pacific Northwest Research Station.
Projections through 2024 indicate that local comprehensive plans, if maintained consistent withcurrent statewide planning goals and guidelines, will prevent additional forest and agriculturalland conversions to development, though at a slower rate (Figure 1 [BIOSEQ]). Using average
WithLand UsePlanning
WithoutLand UsePlanning
Mill
ion
s o
f A
cres
Lo
st t
o D
evel
op
men
t

Governor’s Advisory Group On Global Warming | page 95
carbon stocks of 35 metric tons/acre for forest and agricultural lands and 4.2 metric tons/acre forlow-density residential and developed lands (adapted from Delaney 2004), Oregon’s land useplanning program has prevented 51 MMTCO
2 emissions over the 1974-2004 time period or 1.7
MMTCO2 per year.
BIOSEQ-2: Consider greenhouse gas effects in farm andforest land use decisions.
The recommendation is to maintain Oregon’s statewide program for land-use planning (ORS197.010 – ORS 197.245; OAR Chapter 660, Division 015). Carbon dioxide emission reductionbenefits from this measure are about 0.6 MMTCO
2 per year from avoided emissions by
maintaining the forest and agricultural land base.
BIOSEQ-3: Increase forestation of underproducing lands.
Convert marginal agriculture, pasture and unproductive brush lands (capable of growing forests)back into healthy, productive forests (both riparian and upland). Develop market mechanismsand accompanying carbon accounting mechanisms for the transfer of CO
2 emission offsets from
non-federal forest landowners to emitting entities. Continue use of existing state and federalprograms (e.g., Oregon’s Reforestation of Underproducing Lands 50 percent Tax Credit and theConservation Reserve Enhancement Program) as a means to provide landowners technical andfinancial assistance. Increase the current rate of accomplishment by 40 percent.
Carbon dioxide emission reduction benefits from this measure are 0.5 MMTCO2 per year from
delayed (beginning in year 2030) permanent carbon sequestration and storage in healthy,productive forests. Additional benefits include expanded timber supply, increased wildlifehabitat, improved fish habitat and water quality.
Agriculture and Range
Background: A large proportion of stored carbon in agricultural and rangeland systems isfound in the upper soil profile. Factors affecting the amount of stored carbon include the amountof CO
2 sequestered by agricultural crops or range grasses, the amount of biological oxidation of
soil organic carbon to CO2, and the physical loss of soil through erosion. Agricultural and range
management practices can affect all three factors. The combined effects can result in a net sink(more CO
2 is sequestered and stored than carbon lost), a net source (more carbon is lost as CO
2
than is stored) or break-even (neither source nor sink).

page 96 | Oregon Strategy for Greenhouse Gas Reductions
0
2
4
6
81982
1997
Ton
s/A
cre/
Yea
rEastern Oregon Western Oregon
1982
1997
1982
1997C
ranberry & Strawberry
Nut orchards
Caneberry, Fruit trees, Vineyards, & H
opsPotatoes
Flowers
Row
cropsC
ereals
Conservation R
eserve Program
Grass & C
lover Seeds, and Mint
Hay and Pastureland
Other C
ropland Not Planted
Orchards, Vineyards, & H
opsR
ow C
rops
Flowers
Cereals
Other C
ropland Not Planted
Conservation R
eserve Program
Alfalfa & Grass Seeds, and M
int
Grass H
ayland & Pastureland
Legume H
ayland
1982
1997
Crop or Land Cover/Use Type
Ton
s/Y
ear
(mill
ions
)
0
50
10
15
Crop or Land Cover/Use Type
Figure 2 (BIOSEQ)
Trends in water-erosion soil losses between 1982 and 1987 by crop or land use cover (data from U.S.Department of Agriculture, Natural Resource Conservation Service, National Resources Inventory).
Water-erosion soil loss is used as a surrogate indicator for trends in stored carbon in agriculturalsystems. Based on site specific capability, agricultural practices such as no tillage, reduced tillage,chemical fallow, and conservation retirement are likely to increase carbon storage over time.These practices reduce erosion and return enough carbon in organic matter to offset the carbonlost to soil oxidation. The amount of precipitation and soil water holding capacity influence the

Governor’s Advisory Group On Global Warming | page 97
carbon storage ability of rangeland systems. Areas of deep soils and good water holding capacityhave more carbon storage potential.
Trend: Between 1982 and 1997, changes in agricultural management practices have generally led to areduction in water-erosion soil losses for most crop types found in Oregon agriculture (Figure 2[BIOSEQ]). Most notably, water-erosion soil losses from cereal production systems – by far the singlelargest source of water-erosion soil loss – have been cut by over 50 percent. Opportunities forenhancing this trend through an expanded application of water-erosion reducing practices are greatestfor cereal production systems of the Columbia Plateau. In general, rangeland systems act as carbonstorage sinks for most of the year. Through 1997, 486,600 acres of environmentally sensitivecropland have been enrolled in the Conservation Reserve Enhancement program.
BIOSEQ-4: Expand the application of water erosion-reducing practices forcereal production.
Develop new and expand the use of existing incentives for shifting from traditional winterwheat-summer fallow production systems to continuous winter wheat systems for lands capableof this type of system. Where appropriate, incorporate other practices such as reduced tilling.Concentrate efforts in the Columbia-Plateau Major Land Resource Area in Northeast Oregon.
CO2 emission reduction benefits total about 0.2 MMT per year through avoided emissions and
increased sequestration over an 80-year period. Additional benefits are reduced soil erosion andimproved water quality.
BIOSEQ-5: Leverage the Conservation Reserve Program (CRP) to expandreserved acreage.
Continue to encourage landowners to convert environmentally sensitive cropland to permanentvegetative cover through the U.S. Department of Agriculture’s (USDA) Conservation ReserveProgram as administered by the Farm Service Agency. USDA Natural Resource ConservationService provides technical land eligibility determinations, Environmental Benefit Index Scoring,and conservation planning. Participating farmers receive an annual rental payment over a multi-year contract period. Financing for the Conservation Reserve Program should occur through thefederal Commodity Credit Corporation. Developing incentives to maintain existing ConservationReserve Program acres after existing contracts expire would extend GHG-reducing benefits.
CO2 emission reduction benefits would be about 0.2 MMT per year through avoided emissions
and increased sequestration over a 45-year period. Landowners would be compensated foropportunity costs through annual rental payments. Additional benefits would include reducedsoil erosion, improved water quality, improved air quality and increased wildlife habitat. There ispotential to put emphasis on restoration of native bunchgrass-sage habitats.

page 98 | Oregon Strategy for Greenhouse Gas Reductions
Urban Biomass Sequestration
Background: Urban forests provide many benefits to neighborhoods and communitiesincluding the filtering of air pollutants, stormwater runoff control, wildlife habitat, beauty andaesthetics, energy conservation, and carbon sequestration and storage. Urban forests play threeimportant roles in reducing GHGs such as carbon dioxide.
1) Trees connect urban populations to an awareness of the environment and environmentalissues such as global warming.
2) Trees provide shade to buildings, so a well-developed urban forest canopy reducesincreased temperatures associated with pavement and urban development - both of whichlead to reduced energy consumption.
3) Trees sequester and store carbon in the tree biomass.
When calculated solely for their carbon sequestration and storage benefit, renewing andexpanding urban forest canopy through tree planting programs appears as a costly strategy dueto the high costs of planting and maintenance with relatively modest carbon sequestrationbenefit. However, the role urban forests play in educating and connecting people with theirenvironment, improved livability in communities and their role in reducing energy consumptionare reasons for still including urban tree planting measures as an important part of GHGmitigation.
BIOSEQ-6: Establish a Municipal Street Tree Restoration Program.
Establish a Municipal Street Tree Restoration Program in the Oregon Department of Forestryand administer the program in cooperation with the Oregon Department of Transportation.Funding for the Municipal Street Tree Restoration Account would come by transferring 25 centsfrom vehicle registration fees collected under ORS 803.420. Funds from the Municipal StreetTree Restoration Account would provide grants to local governments for the purpose of plantingstreet trees within treeless sites along urban street rights-of-ways.
Carbon dioxide emission reduction benefits from this measure are less than 0.1 MMTCO2 per
year from delayed (beginning in year 2020) permanent carbon sequestration and storage throughincreased tree biomass along urban street public rights-of-ways. All registered vehicles in Oregonwould pay a fixed share of the cost ($0.25 per registration). This measure has high publiceducation and awareness value due to the explicit connection and direct action on climatechange. Additional benefits include reduced storm water runoff, improved neighborhoodlivability and increased urban forest canopy for wildlife.

Governor’s Advisory Group On Global Warming | page 99
Materials Use, Recovery and Waste DisposalActions for Reducing Greenhouse GasesIssue: The use of materials by Oregon households and businesses contributes to greenhouse gas(GHG) emissions, primarily carbon dioxide from energy use in the production andtransportation of materials, and methane from the decomposition of wastes in landfills.
Solutions: To reduce greenhouse gas emissions, Oregonians can
• decrease the use of materials, particularly those with higher greenhouse gas emissions overtheir life-cycles;
• increase recycling and composting of certain materials;
• decrease burning of fossil-derived wastes such as plastics;
• reduce the emissions of methane from landfills; and
• recover energy generated during the combustion of wastes and methane at disposal sites.
This discussion evaluates actions relative to a common baseline and independent of othermeasures. Table 1 (MW) lists the measures that are recommended by the Advisory Group.
Information sources used to evaluate specific measures include waste composition studies,existing policy documents and feasibility studies, reports from evaluation of existing programs inOregon and elsewhere, and, in some cases, estimates informed by professional judgment.
Table 1 (MW)
CATEGORY I: SIGNIFICANT ACTIONS MMT C/E?FOR IMMEDIATE STATE ACTION CO2E 2025
MW-1 Achieve the waste generation and 5.2 Yrecycling goals in statute.
MW-2 DEQ should develop guidance to clarify 0.53 Nalternative final cover performance atlarger landfills: Demonstrate control ofgas emissions comparable togeomembrane cover.
MW-3 Provide incentives for larger landfills @65 percent: 0.47 Nto collect and burn a minimum @80 percent: 0.88percentage (65 to 80 percent)of methane generated.
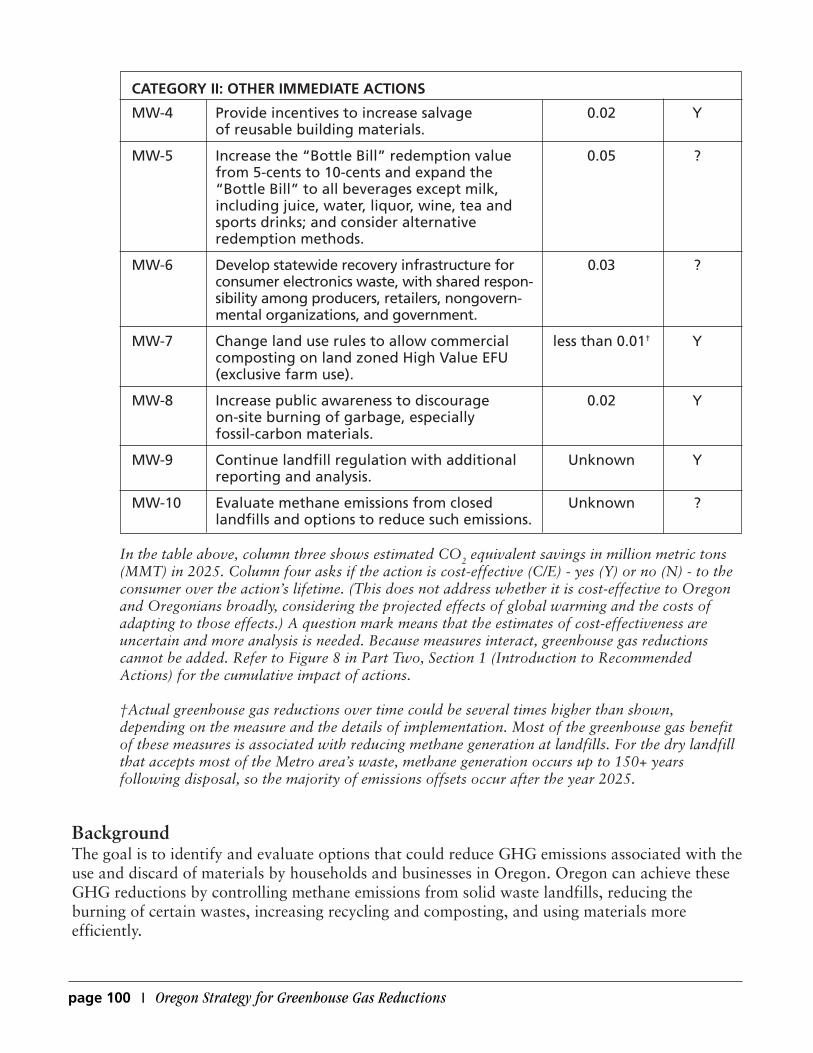
page 100 | Oregon Strategy for Greenhouse Gas Reductions
CATEGORY II: OTHER IMMEDIATE ACTIONS
MW-4 Provide incentives to increase salvage 0.02 Yof reusable building materials.
MW-5 Increase the “Bottle Bill” redemption value 0.05 ?from 5-cents to 10-cents and expand the“Bottle Bill” to all beverages except milk,including juice, water, liquor, wine, tea andsports drinks; and consider alternativeredemption methods.
MW-6 Develop statewide recovery infrastructure for 0.03 ?consumer electronics waste, with shared respon-sibility among producers, retailers, nongovern-mental organizations, and government.
MW-7 Change land use rules to allow commercial less than 0.01† Ycomposting on land zoned High Value EFU(exclusive farm use).
MW-8 Increase public awareness to discourage 0.02 Yon-site burning of garbage, especiallyfossil-carbon materials.
MW-9 Continue landfill regulation with additional Unknown Yreporting and analysis.
MW-10 Evaluate methane emissions from closed Unknown ?landfills and options to reduce such emissions.
In the table above, column three shows estimated CO2 equivalent savings in million metric tons(MMT) in 2025. Column four asks if the action is cost-effective (C/E) - yes (Y) or no (N) - to theconsumer over the action’s lifetime. (This does not address whether it is cost-effective to Oregonand Oregonians broadly, considering the projected effects of global warming and the costs ofadapting to those effects.) A question mark means that the estimates of cost-effectiveness areuncertain and more analysis is needed. Because measures interact, greenhouse gas reductionscannot be added. Refer to Figure 8 in Part Two, Section 1 (Introduction to RecommendedActions) for the cumulative impact of actions.
†Actual greenhouse gas reductions over time could be several times higher than shown,depending on the measure and the details of implementation. Most of the greenhouse gas benefitof these measures is associated with reducing methane generation at landfills. For the dry landfillthat accepts most of the Metro area’s waste, methane generation occurs up to 150+ yearsfollowing disposal, so the majority of emissions offsets occur after the year 2025.
BackgroundThe goal is to identify and evaluate options that could reduce GHG emissions associated with theuse and discard of materials by households and businesses in Oregon. Oregon can achieve theseGHG reductions by controlling methane emissions from solid waste landfills, reducing theburning of certain wastes, increasing recycling and composting, and using materials moreefficiently.

Governor’s Advisory Group On Global Warming | page 101
The manner in which materials are used and discarded in Oregon, which contributes to GHGs, ismulti-faceted and complex. Some GHG emissions occur inside Oregon, while others occur in otherstates or even other nations. Some options that reduce emissions lead to an immediate reduction inemissions, while other options may reduce emissions by smaller amounts each year for many yearsinto the future. For a more thorough explanation of the materials life cycle, its GHG emissions,background on waste recovery and disposal in Oregon, and the accounting framework, refer to thedocument, “Briefing Paper: Materials and Greenhouse Gases,” provided as Appendix D.
Projection of GHG EmissionsWaste generation is the sum of recovery plus disposal. According to DEQ, per-capita wastegeneration in Oregon rose from 5.9 pounds per person per day in 1993 to 7.5 pounds per personper day in 2002. Of this, recovery (recycling, composting and certain types of waste combustion)grew from 1.8 to 3.2 pounds per person per day, while landfilling (disposal) held fairly constantthroughout 1993-2002 ranging from 4.1 to 4.5 pounds per person per day.
This historic trend is used as the starting point for projecting future growth in waste generation.To project future per-capita waste generation, we first divided the waste stream into 33 differentmaterial categories. These are listed in the addendum to Appendix D. Using DEQ and EPA data,estimates were made of the rate of change in per-capita waste generation during the period 1993to 2002 for these 33 different categories. These are adjusted to account for changes in reportingand assumptions regarding shifts of waste into the waste system (such as shifting waste fromopen burning, which isn’t counted, to recycling, which is). The accuracy of these estimates isbetter for some material categories than others. The rates of adjusted growth in per-capita wastegeneration (by material) were then related to the rate of growth in inflation-adjusted Oregonpersonal income during the same period, 1993-2002.
The Advisory Group projects that per-capita waste generation, aggregated across all 33 materialcategories, will grow to 10.1 pounds per person per day in 2025 under the baseline, or a“business as usual” scenario. This assumes relationships between personal income and materialsuse/waste hold constant. It is based on projections of inflation-adjusted personal income from theOregon Department of Administrative Services. Coupled with projected population increases,total in-state waste generation (all discards, including recycling and composting) is projected togrow from 5.1 million tons in 2003 to 8.4 million tons in 2025.
Emissions factors over the entire materials life cycle (materials production, transportation andend-of-life management) are applied to these projections of in-state waste generation. Oregonalso imports significant quantities of municipal solid waste (garbage) from other states. Wasteimports are modeled, growing at a rate of about 4.6 percent per year, from about 1.5 milliontons projected in 2003 to 4.0 million tons in 2025. Only emissions associated with the disposalportion of the life cycle are counted for these imported wastes.
For the sake of projections, it is further assumed that:
1. Per-ton emissions factors for materials production, transportation and end-of-lifemanagement of each material type (glass, corrugated paper, grass clippings, etc.) remainconstant between 2003 and 2025.

page 102 | Oregon Strategy for Greenhouse Gas Reductions
2. Open burning of wastes continues to fall.
3. The disposition of all remaining wastes (between recycling, composting, energy recovery,and different landfills) remains fairly constant.
Under these assumptions, GHG emissions are projected to rise from 7.0 million metric tons ofCO
2 equivalent (MMTCO
2E) in 2003 to 13.6 MMTCO
2E in 2025. This represents almost a
doubling of emissions between 2003 and 2025, or an average annual growth rate of about 3.1percent under the business-as-usual scenario.
Relative Importance of Different Life Cycle StagesThe different life cycle stages (production, recycling, landfilling, etc.) contribute differentamounts to the estimate of total net emissions. The relative importance of different life cyclestages varies widely across different types of materials. For example, most of the GHG emissionsassociated with steel result from energy used during manufacturing, while most of the GHGemissions associated with yard debris occur during landfilling. For the mix of materials andwaste as a whole, emissions associated with resource extraction and product manufacturing are,on average, significantly higher than any other category of emissions. Put differently, themajority of emissions occur “upstream” of the user (Oregon household or business).“Downstream” emissions associated with management of discards tend to be smaller, onaverage, than upstream emissions.
Table 2 (MW) shows the contribution of different life cycle stages to the projected net emissionsof 8.9 MMTCO
2E in 2015 associated with the materials life cycle for materials used and
discarded in Oregon. These are not included in Appendix B, Inventory and Forecast of Oregon’sGreenhouse Gas Emissions.

Governor’s Advisory Group On Global Warming | page 103
Table 2 (MW)Oregon Materials Life Cycle, 2015 (Baseline Scenario)
Negative numbers represent offsets. Positive numbers represent net emissions.
Waste generation MMTCO2E
“Upstream” activities of resource extraction, product 10.92manufacturing, and transportation
Recycling
Material production and transportation -1.01
Indirect carbon storage in forests -2.13
Composting
Production and transportation 0.02
Carbon storage in soils treated with compost -0.10
Combustion
Open burning* 0.06
Mass incineration of garbage (Marion, Coos counties) 0.10
Emissions from combustion of other wastes for energy 0.22
Energy recovery offset -0.58
Landfilling**
Pre-2003 waste 1.30
Waste 2003-2015 0.04
Total 8.94
* Agricultural and forestry open burning not included** For pre-2003 waste, only methane emissions and energy recovery offsets are included. Forwaste disposed of in 2003 and subsequent years, the number shown includes methane emissions,energy recovery offsets, transportation/equipment emissions in 2015, and the sizeable carbonstorage offsets for materials disposed of in landfills.
Regulatory Versus Non-Regulatory ApproachesSeveral measures listed below are characterized as new regulatory requirements. All of theregulatory measures have costs associated with them. However, for some measures, theassociated reduction in GHG emissions could be achieved through financial incentives in lieu ofregulation. For example, while the State could require all large landfills to capture 65 percent ofmethane by 2010 through a statutory requirement, the State (or another party) could alsoprovide financial incentives that, by fully or partially offsetting these costs, would achieve thesame goal. In some cases, financial incentives (such as grants or tax credits) might be a betteroption than regulation, especially where the costs and benefits are not well established.
Uncertainty in Evaluating MeasuresFor the most part, the Advisory Group has relied on EPA emissions factors for the many differenttypes of materials/wastes (steel, aluminum, corrugated, newsprint, etc.) and their different

page 104 | Oregon Strategy for Greenhouse Gas Reductions
management options (recycling, landfilling, etc.). Some estimates of GHG emissions and savingspotential have significant uncertainty and should be considered in that context. Tools, data, andaccounting standards for evaluating GHG impacts of the materials life cycle are still relativelynew, and substantial research is needed to improve their accuracy.
Several measures vary in their degree of impacts. For example, incentives for landfills to collect50 percent of generated methane will have a different effect on emissions than an incentive forlandfills to collect 80 percent of generated methane; and this will have correspondingly differenteconomic repercussions. Some measures are evaluated at varying levels of intensity orimplementation, while others are evaluated at only one level.
The effectiveness of measures also varies over time. For example, the placement of a ton of wastein a solid waste landfill is expected to generate a certain quantity of methane over the period ofits decomposition. However, decomposition in “wet” landfills (such as those in Western Oregon)occurs much faster than decomposition in “dry” landfills (including the Columbia Ridge landfillin Arlington, the largest in the state and the repository for most of the Portland area’s garbage).Thus, diverting putrescible wastes from landfills in any single year will lead to reductions inactual methane emissions over a period of several decades (in Western Oregon) or even severalcenturies (in Eastern Oregon). An important corollary to this fact is that programs that divertcertain carbonaceous wastes from landfills, even if only for one year, will result in reductions inmethane emissions spread over many subsequent years. Therefore, for some measures, theestimates of GHG reductions in the years 2015 and 2025 significantly understate the fullquantity of emissions reductions associated with the measure.
The difference between wet and dry landfills also means that waste-related GHG emissions andreduction potentials – both in terms of absolute amounts and timing – vary in different areas ofthe state.
Projections of methane emissions from solid waste landfills also are uncertain and somewhatcontroversial because of limited data. A variety of computer models are used to project methaneemissions, but the models suffer from some uncertainty and results are dependent on the qualityof data inputs and assumptions. Measuring actual methane emissions from landfills is quitedifficult.
The GHG reduction impacts of individual measures are also influenced by whether or notadditional measures are implemented. Estimates of reductions are not additive when multiplemeasures are implemented simultaneously. For example, the GHG benefit of food wastecomposting is a function of many variables including:
• the presence or absence of gas collection and energy recovery at landfills;
• the timing of any changes in gas collection; and
• whether the food is being diverted from a wet or a dry landfill.
Therefore, enhancing methane collection at landfills will reduce the GHG benefit of divertinghighly putrescible wastes, such as food, away from those landfills and towards composting sites.

Governor’s Advisory Group On Global Warming | page 105
Conversely, achieving the State’s waste generation and recovery goals will result in loweremissions from landfills over time, thus decreasing the benefit of enhanced energy recoverysystems at those landfills. The cumulative net GHG reduction in 2025 of all of the measuresrecommended by the Advisory Group for implementation is about 6.0 MMTCO
2E.
Finally, it is important to note that all emissions reported below are net emissions. In theaccounting approach used by the U.S. EPA and the Advisory Group, certain types of activitiescontribute to offsets, which are counted as negative emissions. Using landfills again as anexample, there are four categories of emissions, two of which are offsets (negative emissions):
• CO2 emissions from equipment used to operate the landfill (positive number)
• methane emissions from the landfill (positive number)
• an offset for landfills that recover energy from landfill gas, which decreases the need toburn fossil fuels elsewhere (negative number)
• an offset for that portion of biogenic carbon that is not expected to decompose in alandfill (negative number). (An example of this would be that portion of dimensionallumber that does not decompose. The EPA has defined a carbon sequestration offset for“carbon storage in landfills.”)
Because of this storage offset, a landfill with a moderately effective gas collection system mightappear to have zero or even negative net emissions. However, ongoing emissions of heat-trappingmethane continue and could be further reduced through enhanced gas collection systems.
MW-1: Achieve the waste generation and recycling goals in statute.
ORS 459.015 establishes the following solid waste generation and solid waste recovery goals forOregon:
Generation:• By 2005 and in all subsequent years, no increase in per-capita waste generation
• By 2009 and in all subsequent years, no increase in total waste generation
Recovery:• 45 percent recovery rate in 2005
• 50 percent recovery rate in 2009
These two parallel sets of goals address waste generation (total discards, a rough proxy formaterial use) and the recovery rate (the fraction of discards diverted from disposal to recycling,composting, and certain energy recovery activities).
The waste generation goals were added to statute by the 2001 Legislature. DEQ and several localgovernments have a number of pilot projects in various stages of implementation and evaluation.

page 106 | Oregon Strategy for Greenhouse Gas Reductions
DEQ is scheduled to develop a waste generation plan during the current biennium. Lackingdetails on how these goals would be achieved, it is not realistic to evaluate the cost, feasibility,etc. of this measure. Therefore, this measure is evaluated for its GHG reduction potential only,assuming that reductions in waste generation occur across all material types.
Because of significant emissions in manufacturing stages of the life cycle, some materials, such asaluminum, carpet, and electronics, have relatively high per-ton reductions in GHG emissionsassociated with waste prevention and reuse. Other materials have relatively low per-tonemissions reductions, but are present in such large quantity that significant emissions reductionscan still be realized through waste prevention.
Similarly, the GHG benefit of material recovery varies widely across material types (mixed wastepaper, film plastics, tires, etc.) and management methods (recycling, composting, combustionwith energy recovery). For example, recycling a ton of aluminum reduces net emissions morethan recycling a ton of office paper, but there is more office paper disposed of in Oregon thanaluminum cans. And while many recovery activities decrease net emissions, a few (such as energyrecovery from tires and motor oil) actually increase net emissions.
Accomplishing the waste generation goals is projected to result in much greater reductions inGHG emissions (5.0 MMTCO
2E) in 2025 than accomplishment of the recovery goals (0.25
MMTCO2E). In part, this is because of how the goals are defined and the fact that Oregon is
already very close to achieving the recovery goals, while achieving the generation goals wouldinvolve a larger quantity of materials. However, because the two goals are interactive, thecombined reduction would be 5.19 MMTCO
2E.
In 2002, the State’s recovery rate was 46.6 percent. In 2003 it was 47.3 percent. Achieving therecovery goals may require several new initiatives, examples of which are described assubsequent measures below. Therefore, like the waste generation goal, this measure is evaluatedfor its GHG reduction potential only.
The State of Oregon and all wastesheds in Oregon (“wastesheds” include Metro, all othercounties, and one city) have waste recovery goals for 2005 and 2009. Because the waste recoveryrates are calculated on a tonnage basis, strategies to achieve the goals have often involvedtargeting materials that are heavy and/or are disposed of in significant quantities. Some recoveryproposals have emphasized the idea of “keeping material out of landfills” without considerationof broader environmental impacts. Increased environmental benefits of waste recovery programsas a whole would result if the following were included in program planning:
• Improved analysis and evaluation tools
• Education of private industry and government staff
• Directives from the Governor’s office and/or Legislature to include environmentalconsiderations other than recovery rates (such as GHGs)
It is not known at this time if the waste generation or recovery goals can be achieved withoutadditional regulation and costs, but at a minimum, the Advisory Group recommends that both

Governor’s Advisory Group On Global Warming | page 107
sets of goals be achieved to the extent that they can be accomplished cost-effectively.Achievement of the recovery goals is highly dependent on strong market demand for recyclables,compostables and energy recovery. Some waste prevention and recovery activities will reducecosts to Oregon households and businesses. Waste prevention may create business opportunitiesfor producers of some materials and services while reducing opportunities for others. Recoveryalso provides economic development opportunities. There are significant other environmentalbenefits and potential education and demonstration values associated with achieving these goalsas well.
The State should create incentives that will contribute to achievement of the waste generationand recovery goals in a cost-effective manner. “Cost effectiveness” should recognize all costs,including externalities, and quantify them where possible. Achieving the waste generation andrecovery goals can reduce GHG emissions and other environmental problems. Incentives shouldreflect (and monetize, if possible) the environmental and social benefits of achieving the wastegeneration, recovery and GHG reduction goals.
MW-2: DEQ should develop guidance to clarify alternative final coverperformance at larger landfills: Demonstrate control of gas emissionscomparable to geo-membrane cover.
Municipal solid waste landfills in wet climates are normally closed with a cover system thatincludes an impermeable geo-membrane barrier layer to reduce infiltration of precipitation intothe landfill. Because methane cannot easily pass through such a cover, geo-membrane barriershave the added advantage of improving the effectiveness of methane collection systems. EPA andstate rules allow DEQ’s Director to approve “alternative final cover” designs (such as thicklayers of soil) as long as these covers are, at a minimum, comparable to the standard design (geo-membrane) at reducing infiltration and controlling erosion. As a practical matter, alternativefinal covers are only feasible in dry areas east of the Cascades.
Under this measure, DEQ would revise its solid waste guidance for landfills subject to existingEPA New Source Performance Standards for landfill gas (40CFR60 Subpart WWW) so thatalternative final covers at such landfills would also need to reduce GHG emissions comparable toa conventional (geo-membrane) cover. Such a guidance change would currently effect only fourlandfills in Eastern Oregon. No new legislation would be required. The DEQ believescomparable control of gas emissions could likely be achieved by incorporating a gas venting layerand/or compost layer into the alternative cover design, resulting in an estimated reduction ofGHG emissions of 0.53 MMTCO
2E in 2025. Greenhouse gas reduction benefits would be
sustained for decades; much of the methane generation in eastside landfills occurs afterindividual cells are closed. This would increase landfill costs by about $14 million between 2010and 2025.
Assuming that the costs are passed back to landfill customers through rates, this would increasegarbage costs for users of these four landfills. Users of other large landfills would not see anynew rate impacts, as their landfills are already using or planning to use the more protectivegeo-membrane covers.

page 108 | Oregon Strategy for Greenhouse Gas Reductions
MW-3: Provide incentives for larger landfills to collect and burn a minimumpercentage (65 to 80 percent) of methane generated.
Under this measure, existing funding incentives would be leveraged, and additional fundingwould be provided, if necessary, to encourage larger landfills to increase methane collection orother methane controls.
For the purpose of this analysis, we have modeled this measure at two different levels: 65 percent and80 percent by the year 2010. These percentages were applied to the eight landfills expected to be openin 2010, which are, or are eventually expected to be, subject to existing EPA New Source Perfor-mance Standards for landfill gas. Of these, six are privately owned, while the other two are owned byLane and Deschutes counties. Three of the eight landfills are already at or above 80 percent gascollection rates; two more are estimated at being between 65 percent and 80 percent; two are in the20 percent to 40 percent range; and the last has minimal gas collection.
Setting a 65 percent collection goal would reduce emissions in 2025 by an estimated 0.47MMTCO
2E, while an 80 percent goal would reduce 2025 emissions by 0.88 MMTCO
2E.
Achieving the 65 percent goal at all eight landfills would cost about $3.4 million, while achievingthe more ambitious 80 percent goal would cost about $4.9 million. It is unclear if existingincentives are sufficient to lead to these levels of additional GHG reductions; additionalincentives may likely be required. Of course landfills that have already invested in advancedlandfill gas collection systems, either because of regulation or on a voluntary basis (to captureenergy), would not have as much opportunity to take advantage of this incentive. The incentiveis targeted more at landfills that have below-average gas collection systems.
Some landfills with gas collection simply flare the methane, while others have installed energy recoverysystems to use the methane to generate heat or electricity. The state Business Energy Tax Credit (BETC) isalready available to help incent landfill gas energy recovery systems including collection systems above andbeyond those required for compliance with environmental regulations. (Current environmental regulationsrequire landfill gas collection and combustion, but do not address energy recovery. BETC cannot be used ifgas is merely collected and flared, the current practice at some landfills.)
Because of the potent GHG impact of methane, which is 23 times as powerful as CO2, most of the
GHG benefit of this measure is associated with gas collection and combustion (converting methaneto carbon dioxide), regardless of whether or not energy recovery is included. This alternative wouldsupplement BETC with additional incentives in order to increase gas collection at those landfills withbelow-average gas capture rates.
Alternatively, the Legislature could establish mandatory methane collection goals for these landfills ordirect the DEQ to establish such goals through rule. In this case, compliance would be paid for bycustomers of those landfills that have below-average gas capture rates. Gas collection rates aredefined as gas collection divided by gas generation. One significant challenge is that while gascollection is easily measured, gas generation is not. Normally landfill engineers rely on computermodeling to estimate gas generation. Landfills required to increase their gas collection rate wouldhave the opportunity to demonstrate an alternative gas generation estimate in order to achieve partialor full compliance with the goals.

Governor’s Advisory Group On Global Warming | page 109
MW-4: Provide incentives to increase salvage of reusable building materials.
Salvage of reusable building materials, sometimes called “deconstruction” is growing inpopularity in Oregon. Some buildings slated for demolition contain valuable furnishings andfixtures, high-value wood flooring, molding and structural lumber, and other materials that canbe reused, such as doors and sinks. A growing number of not-for-profit organizations are tryingto capture reusable building materials and resell them for reuse.
In this measure, the State would provide incentives, such as grants, to help establish aninfrastructure of reusable building materials sites. Presumably, the incentives would primarilysupport capital and other start-up expenses, as revenue from the re-sale of materials should besufficient to pay for ongoing operational costs. In addition to environmental and resourcebenefits, building material salvage provides more affordable materials to middle- and lower-income households. Material salvage programs can also provide living-wage jobs.
At a cost of about $2.3 million between 2010 and 2025, greenhouse gas reductions in 2025 areestimated at 0.016 MMTCO
2E.
MW-5: Increase the “Bottle Bill” redemption value from 5 cents to 10 centsand expand the “Bottle Bill” to all beverages except milk, including juice,water, liquor, wine, tea and sports drinks; consider alternative redemptionmethods.
The deposit and redemption value for beverage containers covered under Oregon’s “bottle bill”was established at 5 cents in 1970. Adjusted for inflation, it is worth about 1.6 cents in today’sdollars. In recent years, the percentage of containers returned for deposit under the bottle bill hasfallen. Further, many beverage containers currently in use are not covered by the bottle bill,because they were not commercially available (or were uncommon) when the bottle bill wasestablished in 1970.
This measure would make at least two changes to the bottle bill. First, it would change the deposit/redemption value of the bottle bill from 5 cents to 10 cents. Second, it would expand the bottle bill tocover a wider variety of beverage containers. As a result, the recycling of these containers wouldincrease. Most of the associated reductions in GHG emissions result from energy savings when post-consumer aluminum, glass and plastic displace the production of virgin resources.
There are other changes to the structure of the bottle bill that might also be proposed, althoughthese have more impact on distribution of costs and responsibilities and political feasibility, andless impact on environmental results. These other issues include:
• allowing redemption to occur at locations other than grocery stores and exemptinggrocery stores from providing redemption if nearby alternatives are available;
• the formation of an industry-operated container stewardship organization to oversee andoperate the redemption system;

page 110 | Oregon Strategy for Greenhouse Gas Reductions
• the disbursement of unredeemed deposits (escheats), which are currently maintained bythe distributors; and
• the addition of a processing fee to compensate redemption centers for their costs inhandling bottle bill materials.
Bottle bill expansion would require statutory change and would face varying levels of politicalopposition, depending on the nature of the proposed re-design. Higher handling costs associatedwith processing the additional materials are projected to be roughly $3.5 million annually. GHGreductions in 2025 are estimated to be 0.050 MMTCO
2E.
MW-6: Develop statewide recovery infrastructure for consumer electronicswaste, with shared responsibility among producers, retailers, non-government organizations and government (reuse and recycling).
Electronic waste (“e-waste”), such as computers, monitors, and televisions, is a rapidly growingwaste stream in Oregon and the U.S. Options for end-of-life management of e-waste includedisposal, stockpiling, recycling, and reuse. For personal computers (PCs), both reuse andrecycling reduce GHG emissions. Because of the large amounts of energy used to manufacture aPC (particularly fabrication of silicon wafers), reuse has much greater GHG benefits thanrecycling, as long as the reuse displaces or delays the production of a new computer.
Oregon has been a participant in the National Electronics Product Stewardship Initiative(NEPSI), a four-year effort to negotiate a national end-of-life management program for e-waste,where responsibility for managing e-waste is shared between manufacturers, retailers,governments, consumers, non-governmental organizations (NGOs) and businesses. Althoughagreement has been reached on significant aspects of a national system, manufacturers have yetto agree on an up-front financing approach for the system. Electronics manufacturers heldmeetings in 2004 to develop a recommendation to bring back to the full NEPSI group forconsideration. They were unable to reach agreement. The NEPSI process will produce a finalreport in early 2005 and various NEPSI stakeholders continue to work on state and nationalproduct stewardship solutions. The U.S. Environmental Protection Agency will hold an electronicwaste summit in March 2005.
In Oregon the 2003 Legislature passed Senate Bill 867, establishing a statewide Task Forcecomprised of industry, governments and NGOs, to look at issues related to end-of-lifemanagement of e-waste in Oregon. The effort is intended to build upon the concept of productstewardship and the national NEPSI discussions, look at what currently exists and determinewhat measures would be needed to establish a sound reuse and recovery system for Oregon. TheTask Force completed its effort in December 2004. The information gathered by this Task Forcewill inform any future legislation or efforts in Oregon to manage e-waste at end-of-life. A finalTask Force report was published in January 2005.
In addition to the legislation passed in Oregon in 2003, the states of California and Maine havepassed landmark legislation in the past year. The California legislation, which will be

Governor’s Advisory Group On Global Warming | page 111
implemented in 2005, addresses only cathode ray tubes (CRTs) and plasma screens as hazardouswaste. It establishes an advance recovery fee on the sale of these devices in order to fund agovernment-managed recycling program for this specific waste stream. The Maine legislation,passed in the spring of 2004, is a producer responsibility approach requiring manufacturers to beresponsible for paying for and providing the transportation and processing of discardedcomputers, CRTs, television and other computer peripherals through internalization of costs.Government is responsible for setting up the collection infrastructure. Washington also passed a“study bill” similar to Oregon’s in the spring of 2004.
The design and funding of a statewide program in Oregon for reusing and recycling e-waste is acomplicated issue. For the sake of the Governor’s Advisory Group on Global Warming’srecommendations, this report assumes a system of shared responsibility, where manufacturershelp to pay for and/or operate the infrastructure for reuse and recycling of e-waste, withoutdefining the details of how such a program would operate. Regardless, increasing the recyclingand reuse of e-waste would reduce net GHG emissions, with a “middle of the road” estimate of0.034 MMTCO2E in 2025. Other benefits include reducing disposal of toxins, increasedcomputer ownership opportunities for lower-income households (via reuse) and potentialeconomic development opportunities.
It is assumed that such a system would require new legislation and that this would require thecooperation of industry, nonprofits and the public sector. Costs of the program depend on itsdesign and scope; at a minimum, collection infrastructure requires financing.
MW-7: Change land use rules to allow commercial composting on landzoned High Value EFU (exclusive farm use).
Composting of food wastes can significantly reduce net GHG emissions, both by reducingmethane emissions from landfills and by sequestering carbon in agricultural soils treated withfinished compost. However, food waste composting operations, even when operated at highstandards, can create odor problems. Because of this, commercial food waste composters are notideally suited for land zoned as industrial and, as a practical matter, cannot locate nearresidential or commercial lands without major capital investments (such as mechanical aerationsystems with biofilters or totally enclosed composting operations).
Commercial composting that is not in conjunction with farm use is not allowed on lands zonedfor high value exclusive farm use (EFU). According to compost industry experts, this makes itvery difficult to site a commercial composting operation in most areas of the Willamette Valley,which are zoned high value EFU.
The goal of this measure is to allow for the establishment of composting capacity that isrelatively close to waste generators (cities) and is protective of the environment while beingaffordable. Amending Oregon Administrative Rules (OAR) 660-033-0120 to allow commercialcomposting as a conditional use on lands zoned High Value EFU would likely allow for theestablishment of a few commercial composting operations in the Willamette Valley. Because ofhigh disposal fees for garbage in Marion County and the Metro area, a nearby commercial

page 112 | Oregon Strategy for Greenhouse Gas Reductions
composter could likely set tip fees high enough to be profitable, yet low enough that larger wastegenerators could realize financial savings from separating their food wastes from their garbage.In addition to these financial savings to Oregon businesses, expanding food waste compostingprovides economic development opportunities, GHG benefits and other environmental benefits. TheGHG benefits are relatively small in earlier years, but continue for decades due to reduced methanegeneration at landfills associated with the avoided long-term decomposition of food wastes.
MW-8: Increase public awareness to discourage on-site burning of garbage,especially fossil-carbon materials.
Burning of garbage in burn barrels, burn piles and fireplaces is a source of GHGs and a widevariety of air toxics. It also can create fire risks. GHGs of concern are carbon dioxide from thecombustion of fossil-derived materials (plastics, synthetic fabrics, tires, rubber) and nitrous oxidefrom combustion of paper and wood.
Outdoor burning of plastics, rubber and tires is already illegal in Oregon. Additional restrictionson open burning at both the state (DEQ/EQC) and local (city, fire district) level further limit theoutdoor burning of other wastes in some areas. Still, in some areas of the state, significantquantities of wastes are burned.
The State could work with local governments, including fire districts, to further discourage on-site burning of garbage. (The baseline scenario assumes that existing restrictions and enforcementprograms remain in place.) This could include education of households and businesses and thedevelopment of model ordinance language to make it easier for local governments to adoptburning restrictions.
This measure is easy to implement, except for the additional funding required for coordinationand promotion/education, and any local enforcement activities. Reducing burning of wastes hassignificant public health benefits above and beyond reductions in GHGs. GHG savings aredifficult to project due to insufficient data on the quantity and composition of wastes burned,but are estimated to be around 0.02 MMTCO
2E in 2025.
MW-9: Continue landfill regulation with additional reporting and analysis.
Specific Actions:
• Continue to implement Title V regulations for control of methane emissions at landfills andinstallation of wells in active areas where waste has accumulated for five or more years.
• Require annual reporting of methane generation, collection and collection effectiveness(much of this reporting is already occurring).
• Encourage landfill owners/operators to collect actual data on gas generation.
• Evaluate the accuracy of measurement efforts.

Governor’s Advisory Group On Global Warming | page 113
DEQ will continue to require the installation of methane controls at landfills to meet federal andstate regulations. Under this measure, DEQ would require additional reporting of estimates ofmethane generation, collection, and collection system effectiveness at larger landfills.
Collection system effectiveness is defined as gas collection divided by gas generation. Onechallenge is that while gas collection is easily measured, gas generation is not. Normally landfillengineers rely on computer modeling to estimate gas generation. Under this alternative, DEQwould support landfill operators interested in conducting actual measurements and enhancedmodeling of generation.
Ongoing administration of current environmental laws, and compliance with those laws, isassumed as part of the baseline forecast. This measure would result in additional reductions ingas emissions if landfill owners chose to improve further upon gas collection systems in order tomaintain competitiveness in a marketplace where potential customers (particularly localgovernments) might include GHG considerations in their procurement of disposal services.
MW-10: Evaluate methane emissions from closed landfills and options toreduce such emissions.
Oregon is home to many smaller landfills that are now closed and have no or very limitedengineered methane controls. The quantity of methane emitted from these landfills is unknown,but was estimated in 2003 to be about half as much as the emissions from the larger openlandfills. Emissions from these closed landfills are (on the whole) assumed to be falling, whileemissions from larger open landfills continue to climb as waste disposal continues to increase.
Under this measure, the State would evaluate methane emissions from closed landfills andconduct a feasibility and cost-benefit study of methods to reduce emissions, at a cost of about$50,000 to $100,000. Few, if any, of these closed landfills have closure funds available to spendon methane controls, so implementation of any such controls would require additional funding.Statewide costs would potentially be in the millions of dollars, depending on the number oflandfills involved and the scope of methane control measures recommended.

page 114 | Oregon Strategy for Greenhouse Gas Reductions
State Government Operations Actionsto Reduce Greenhouse GasesIssue: State agencies, through their internal management practices and external programoperations or regulatory activities, can add to or reduce Oregon’s greenhouse gas (GHG)emissions. Opportunities exist to reduce those GHG emissions and serve as examples for localgovernments, businesses and other organizations.
Solution: In support of the Advisory Group, state agencies evaluated how they can promotepolicies and programs that will move Oregon toward GHG reductions. They conducted theirreview in context of Governor Kulongoski’s Executive Order EO 03-03 on sustainability, whichhe issued in June 2003 and which is also the basis for the Advisory Group’s report on reducingGHGs.
The Executive Order and subsequent guidance outlined expectations for 20 state agencies todevelop plans that would incorporate sustainability into their management practices. TheGovernor called for specific actions each agency could take and provided standards andguidelines. Throughout the document, activities were cited as areas of focus for the agencies.These included use of renewable energy, improved water efficiency, expanded materials reductionand recycling, new fleet management opportunities, and alternative fuels use.
While the link to climate change advantages was not a focus of the first Sustainability Plansspecified by the Executive Order, the plans typically include GHG reduction activities. Therefore,the Sustainability Plans set in motion a mechanism for moving agencies toward GHG reductionsin a united front. All state agencies will be expected to meet GHG reductions proportional to thegoals stated in “Recommendation IA-1.”
Table 1 (GOV)
GOV-1 State agencies should use their agency Sustainability Plans as the tool foragencies’ dynamic involvement in GHG reductions with respect to boththeir internal operations, and their external program or regulatoryactivities. Operational and other activities in the areas of electricity,natural gas, land use, transportation, land use, waste and water will bethe particular but not exclusive focuses for reductions opportunities.Agencies should approximately calculate and report to the SustainabilityBoard the greenhouse gas effects of all actions that have potentiallysignificant greenhouse gas emissions consequences: either emissionsincreases or reductions.
GOV-2 Through a collaborative effort, the Departments of Energy, EnvironmentalQuality and Administrative Services should develop a process to educateagency personnel about opportunities for GHG reductions including howto set goals and calculate GHG reductions.

Governor’s Advisory Group On Global Warming | page 115
GOV-1: State agencies should use their agency Sustainability Plans as the tool foragencies’ dynamic involvement in greenhouse gas reductions with respect to both theirinternal operations, and their external program or regulatory activities. Operational andother activities in the areas of electricity, natural gas, land use, transportation, land use,waste and water will be the particular but not exclusive focuses for reductionsopportunities. Agencies should approximately calculate and report to the SustainabilityBoard the greenhouse gas effects of all actions that have potentially significantgreenhouse gas emissions consequences: either emissions increases or reductions.
Staff reviewed the agency Sustainability Plans and calculated GHG reductions that agenciesmight achieve through implementation of the plans. Unfortunately, most of the agencySustainability Plans did not have activities for which GHG reduction calculations could be madewith certainty.
The Sustainability Plan review showed that agencies were knowledgeable about how to movetoward sustainability. What was missed in the first round, for purposes of the climate changework, is the link between those selected sustainability activities and GHG reductions and anunderstanding of the metrics used to calculate those reductions.
The Sustainability Plans are an effective mechanism to move forward the goals of GHGreductions. Table 2 (GOV) shows a summary of those activities where GHG reduction could becalculated. The table does not represent all agencies or all proposed action items. Please refer towww.sustainableoregon.net for a complete list of Sustainability Plans.

page 116 | Oregon Strategy for Greenhouse Gas Reductions
Table 2 (GOV)Selected GHG Reduction Actions from Agency Sustainability Plans
Agency Activity GHG reductions(metric tons)
Energy Truck stop electrification 24,000(with DEQ)
High performance school plan 2880
Train resource conservation managers 4at state agencies
Technical assistance to agencies 216
State Energy Efficient Design Program 997(new state buildings)
Housing and Energy efficiency and weatherization 4600Community Service
Corrections Solar hot water at Pendleton 1.3
Geothermal closed loop water system in Lakeview 2800
Burner controllers on boilers/tuning at 278various facilities
Consumer and Extend life of personal computers 170Business Services
Administrative Reduce non-renewable energy use byServices 10 percent below 2000 levels 1500
TOTAL 37,446
Note: This table identifies specific actions that state agencies will take as described in theirSustainability Plans and approved by the Sustainability Board. Not all agencies are listed here andthese are not the only activities agencies will take. These are the only actions in the plans whereGHG savings could be quantified and forecasted for the purposes of this report.
GOV-2: Through a collaborative effort, the Departments of Energy,Environmental Quality and Administrative Services should develop aprocess to educate agency personnel about opportunities for GHGreductions including how to set goals and calculate GHG reductions.
As noted, while Sustainability Plans can lead to GHG reductions, many current plans do not addressthat directly. By providing each agency a simple and uniform record-keeping program for GHGemissions, the agencies will be able to identify and pursue opportunities to reduce emissions.

Governor’s Advisory Group On Global Warming | page 117
Conclusion and Next StepsOregon ChoicesAs Oregonians and Americans, we clearly have choices about how we will respond to thewarming of our planet. We can choose a “business as usual” path of contributing ever-increasinggreenhouse gas emissions to already high atmospheric concentrations – a path that American andinternational scientists consider dangerous and alarming. If we choose “business as usual,” weleave a legacy for our children and grandchildren of a changing global climate that threatenshuman habitation and biological ecosystems – with much higher costs required to adapt to andremedy these changes than we will face if we act today.
Alternately, we can adopt the goals recommended in this report and the initial set of actions thatwill arrest and reverse Oregon’s contribution to these atmospheric trends. In doing so, we will setour feet on a path to reduce emissions over time and stabilize the global climate conditions webequeath to our children. Figure 8, in Part Two above, charts our choices and referencespotential actions to 1990 emission levels and to our proposed intermediate and long-term goals,although it shows we have not yet proposed actions to achieve the goals fully.
What Scientists Tell UsSeveral thousand of the earth’s scientists, working together as the Intergovernmental Panel onClimate Change, agree that global warming caused by GHG pollution from human activitiesrepresents a profoundly serious threat to human civilization and to even the most robust andinsulated natural ecosystems. Their comments are echoed in the Scientific Consensus Statementon the Likely Impacts of Climate Change on the Pacific Northwest prepared by scientists atOregon and Washington universities in the fall of 2004.
Emissions of CO2 and other GHGs are materially altering the envelope of GHGs that now keep
the earth warm enough to be habitable. It’s like adding another blanket, and another, until thecumulative effects exceed the capacity of the earth’s systems for absorbing the gases anddissipating the heat.
These same scientists can generally describe the effects on the earth of this gathering threat.These effects range from melting glacial formations and rising sea levels, to more severe storms,heat waves, more frequent and more intense forest fires, ecosystem disruptions, speciesextinctions, and mounting costs to cope with these changes in our world. Already, according toNorthwest scientists, we’ve lost 50 percent of the snowpack in the Cascades since 1950, withglobal warming identified as the probable cause.
Economic Investments and OpportunitiesThe economic dimension of dealing with climate change can be stated as a series of “costs,” butit can also be stated in a more affirmative way. Many actions proposed in this report carry price
S E C T I O N 3

page 118 | Oregon Strategy for Greenhouse Gas Reductions
tags, but they are generally in the nature of investments that can generate net economic returnsto us over time. Most are investments we are experienced in making, from improving theefficiency of our homes, farms, factories and appliances to developing non-polluting new energysources such as wind, solar, agricultural biomass and other renewable resources. These shouldremind us of our half century-long investment in hydroelectricity.
Other costs are similar to buying insurance policies against events that would otherwise cost farmore to cope with. Avoiding the potentially destructive storms, floods and forest fires that areprojected to accompany global warming would likely be less costly than the repairs we wouldneed to make otherwise. These measures will bring the same welcome returns that pastinvestments in flood control have earned.
Moreover, we believe there will be many economic opportunities for companies and communitiesthat rise to the challenge, developing the practices and technology products that our tradingpartners in other states and countries also will need to cope. We have ample experience inOregon with this outcome. Many companies here have built prosperous business lines in energyefficiency products and consulting practices, in developing renewable energy technologies, and inadapting the power system for optimal use. We believe Oregon’s entrepreneurs, supported byOregon’s academic and technical capabilities, can prosper by positioning themselves at theleading edge of change.
Moreover, taking state action on global warming will position Oregon to trade freely with othercountries acting similarly – a group which now includes most of our major trading partners inAsia, Europe and elsewhere. Most of these countries are party to the Kyoto Protocol on ClimateChange, which will become effective international law in February 2005 for the countries thathave ratified the Protocol.
Principles and ActionsThe set of Principles (Section 2.1 in Part One) used to guide our efforts placed primary emphasison real, measurable and meaningful reductions in the state’s GHG emissions. We alsoemphasized the need to focus first on the most cost-effective actions and those that createinvestment and entrepreneurial opportunities. We agreed we would not take actions that couldimpair reliability in our electrical and other energy supply systems, and we believe that many ofour recommendations will actually enhance this quality. Our principles create the right directionand focus for Oregon.
We also have proposed a set of actions – some very specific, others more in the nature ofchanging course – that collectively will meet our first goal of reversing the upward trend ofOregon’s GHG emissions. The list of actions we choose or must take over the next fifty years isfar from complete, since many needed actions and opportunities will only reveal themselves aswe proceed. New, more cost-effective technologies and applications will emerge. Improvedscientific understanding will open new doors. Our purpose is to set a firm course on the road toemissions reduction, understanding that our successors will have their turn at the wheel as well.We have assembled a first set of recommended actions to meet our goals and make the most ofour opportunities.

Governor’s Advisory Group On Global Warming | page 119
Oregon’s RoleWe recognize that Oregon’s contribution to both the problem and its solution is a small part ofthe whole. We can’t succeed without complementary activity on the part of states and nationswhose emissions dwarf our own. Fortunately, many countries that have ratified the KyotoProtocol and other U.S. states are embarking on their responsibilities in parallel with Oregon. Sowe can anticipate cooperating states – beginning with our neighbors in Washington andCalifornia who have joined to form the West Coast Governors’ Global Warming Initiative – andcompetitors as we look for ways to profit from our enterprise. Both should be welcome.
There is a next set of tasks for the Governor’s next “advisory group” – further development ofsome of our more complex recommendations. This new group must also consider what Oregonmust do to adapt to the unavoidable warming conditions from GHG emissions that have alreadyaccumulated over the past 150 years and that will continue to accumulate for some time.
But first we must decide, as an Advisory Group, a Governor and a state, whether we areprepared to adopt meaningful carbon reduction goals as proposed and to take the actions thatwill be required to meet those goals.
There couldn’t be more of Oregon’s future riding on the outcome.

page 120 | Oregon Strategy for Greenhouse Gas Reductions

Appendices


Oregon Strategy for Greenhouse Gas Reductions – Appendix A | page A-1
Appendix A
Members of the Governor’s Advisory Groupon Global WarmingAchterman, Gail L.Gail L. Achterman is the Director of the Institute for Natural Resources at Oregon StateUniversity. She received her undergraduate degree from Stanford University in economics andthen went to the University of Michigan where she received her J.D. in 1974 and an M.S. innatural resource policy and management in 1975. She started her career working for theDepartment of the Interior in Washington, D.C. before returning to Oregon in 1978 to join aprivate law firm. Her law practice emphasized natural resource and environmental law. From1987-1991 she served as Governor Neil Goldschmidt’s Assistant for Natural Resources beforereturning to private practice. She left Stoel Rives LLP in 2000 to become Executive Director ofthe Deschutes Resources Conservancy in Central Oregon before joining OSU in 2003 as the firstfull time director of the Institute.
Allen, JeffJeff Allen became executive director of the Oregon Environmental Council in October 1996, andOEC’s membership, budget, and staff have more than doubled during his tenure. He holds aMaster’s degree in public policy from the University of California, Berkeley, and graduated PhiBeta Kappa from the University of Michigan. His diverse environmental policy experienceincludes work for the Union of Concerned Scientists, Clean Water Action, the Center for CleanAir Policy, and the California Senate. Jeff is a manic fisherman who also enjoys backpacking,fishing, and wine. He, his wife Martha and son Sam live in Hood River.
Berggren, RandyRandy L. Berggren has been the General Manager of the Eugene Water & Electric Board sinceAugust 30, 1990. He is a professional electrical engineer registered in California. He began hiscareer at EWEB as an Engineering Manager, and was promoted to assistant general manager forplanning & development in 1988. Prior to joining EWEB, Jeff held a variety of engineering andadministrative positions with the Springfield Utility Board and Southern California EdisonCorporation over a 16-year period. He received his bachelor’s degree in electronic engineeringfrom the California State Polytechnic University in 1969, and a master’s degree in electricalengineering from the University of Southern California in 1971. Randy was a board member forGovernor Kitzhaber’s Willamette Restoration Initiative and has served as a board member andchairperson on various regional energy associations.
Blosser, BillBill Blosser has worked for 35 years in Oregon as a consultant and public official in land use,environmental and sustainability planning. He founded the sustainable development practicewithin CH
2MHILL and developed sustainability plans for a variety of clients. He served as

page A-2 | Oregon Strategy for Greenhouse Gas Reductions – Appendix A
Governor Kulongoski’s sustainability advisor in 2002-2003 and led the development of thegovernor’s executive order on sustainability and the guidance document for state agencies toimplement the order. He currently serves on the Oregon Sustainability Board and the boards ofthe International Sustainable Development Foundation, the China-US Center for SustainableDevelopment, and Sustainable Northwest. As a land use and environmental planner, Bill hasparticipated in developing numerous environmental impact studies, municipal water plans,transportation systems plans, and city comprehensive plans. He served for six years as Chair ofthe Oregon Water Resources Commission and for 9 years as Chair of the Oregon LandConservation and Development Commission. He served six months as the Interim Director ofthe Department of Land Conservation and Development.
Bradbury, BillBill Bradbury grew up in Chicago, and moved to Bandon, Oregon in 1971. In Bandon, heowned and operated a small business before beginning his career in government. He served inthe Oregon legislature for 14 years, representing Oregon’s South Coast, and went on to direct alocal non-profit organization. As Secretary of State, Bill Bradbury is our second-highest-rankingconstitutional officer. He is the auditor of public accounts, the chief elections officer, and themanager of the state’s official legislative and executive records. Along with the Governor andTreasurer, he sits on the State Land Board, and he was appointed by the Governor to chair theOregon Sustainability Board. He was elected Secretary of State in 2000, and he now lives inSalem with his wife Katy.
Bragdon, SusanSusan H. Bragdon (B.A. biology, Williams College; M.Sc. Resource Ecology, University ofMichigan; J.D. University of Michigan) uses her educational background and experience inscience and law to work on critical global issues such as the conservation, use and managementof biological diversity; creating compatibility with environment and agriculture; and promotingfood security. She was the lawyer for the Secretariat for the Intergovernmental NegotiatingCommittee for the Convention on Biological Diversity, providing legal advice to the workinggroup handling intellectual property rights, transfer of technology including biotechnology andaccess to genetic resources. When the treaty was concluded Susan joined the treaty Secretariat asits Legal Advisor. Susan also served as the top Senior Legal Officer for the Basel Convention onthe Control of Transboundary Movement of Hazardous Waste before joining International PlantGenetic Resources Institute as a Senior Scientist, Law & Policy in 1997. She now works on legaland policy issues related to plant genetic resources and in particular manages projects onintellectual property rights, biotechnology and biological diversity and on developing decision-making tools for the development of policy and law to manage access to and benefit-sharingfrom genetic resource. Susan is invited by governments worldwide to provide advice and givelectures on issues of importance related to the conservation of biological diversity and its links todevelopment.
Burkholder, RexRex Burkholder serves as vice-chair of the Joint Policy Advisory Committee on Transportation(JPACT) and as the council liaison to the JPACT Bi-state Transportation Committee and otherregional transportation committees. Rex helped found the Bicycle Transportation Alliance andworked as the policy director for the nonprofit organization, helping to make it one of Oregon’s

Oregon Strategy for Greenhouse Gas Reductions – Appendix A | page A-3
most active grassroots organizations. He also has taught high school science and served asfaculty at Portland State University Office of Student Development. As a community activist forthe past 20 years, he was a founding trustee of the nationally recognized Coalition for a LivableFuture, which unites more than 50 citizen groups on the issue of sustainability. As a parent-volunteer, Rex helped establish the Northeast Community School, an innovative, diverse charterschool in Portland. He has been honored as the 1998 Most Effective Citizen Advocate in themetro region by 1000 Friends of Oregon and as a 1999 founder of a New Northwest bySustainable Northwest. Rex received a bachelor’s degree in biology and a teaching certificatefrom Portland State University. He earned a master’s degree in urban and environmental policyfrom Tufts University in 1989. He is married, has two sons and enjoys playing tenor guitar,spending time with his family and hiking or kayaking around the Northwest.
Burnett, Michael G.Michael Burnett is the Executive Director of the Climate Trust. He is an environmental engineerwith twenty-seven years of executive, management, policy, and technical experience in climatechange, energy efficiency, and renewable resources, mostly in the Pacific Northwest. As theTrust’s initial Executive Director, Mike took the organization through its start up phase,overseeing the development of its accounting system and assisting the Board in developing itspolicies regarding the selection of offsets. He works with the Board on strategic planning for theTrust, oversees the development of annual work plans and budgets, and manages the staff tomeet the work plans. Under his guidance, the Trust has assembled a project carbon offsetportfolio totaling $5 million and 2.5 million metric tons of carbon dioxide. Mike led thenegotiations on the Trust’s first five offset projects and put the stamp of his creativity on the termsheets for the current batch of six projects. He is an active participant in the national andinternational policy debate regarding GHG mitigation.
Mike was a Vice President for Trexler and Associates, Inc., an international leader in climatechange mitigation. There, he prepared corporate climate change strategies, developed a climatechange early action crediting proposal for a national sustainable technology industry group, andprepared a feasibility study for a major international carbon offset project. Mike was also thefounding CEO for Conservation and Renewable Energy System (CARES), a consortium of publicpower utilities in Washington State. Mike also has worked in energy conservation, renewableenergy, and power planning for two utility trade associations, Bonneville Power Administration,the Western Solar Utilization Network, and the National Park Service. Mike earned an M.S. inEnvironmental Engineering from the University of Florida while on a National ScienceFoundation Graduate Fellowship.
Dodson, Mark S.Mark Dodson has served as NW Natural’s President and Chief Executive Officer since Januaryof 2003. He joined the company in 1997 as senior vice president and added the general counselrole in 1998. In May of 2001, he was appointed NW Natural’s President & Chief OperatingOfficer. Before coming to NW Natural, Mr. Dodson practiced law for more than 20 years. In1979, he worked in the General Counsel’s office of the Department of Transportation and thenbecame special counsel to the Federal Aviation Administrator in Washington, D.C. After leavingWashington, D.C., he spent 17 years with the law firm of Ater, Wynne, Hewitt, Dodson, Skerrittin Portland, Oregon. His practice focused on regulated industries, international and national

page A-4 | Oregon Strategy for Greenhouse Gas Reductions – Appendix A
transactions and legislative issues. Over the years, Mr. Dodson has been actively involved in avariety of civic activities. He has been chairman of the Oregon State Board of Higher Education,chair of the Neighborhood Partnership Fund, secretary of the Oregon Health Sciences UniversityBoard and co-chair of Governor Kitzhaber’s Task Force on Scholarship and Student Aid. Healso headed the transition of Oregon Governor Neil Goldschmidt. He is currently the chair-electof the Portland Business Alliance, chair of the Mayor’s Business Roundtable and a member of theexecutive committee of the Associated Oregon Industries. Mr. Dodson grew up in Beaverton,Oregon, and attended Sunset High School. He graduated from Harvard University in 1967 andfrom Boalt School of Law, University of California at Berkeley in 1973. He is married to RuthAnn Dodson, and they have two children: Carrie attends Harvard University; and Kevin is asenior at the University of Oregon.
Duncan, AngusAngus Duncan has served as President and CEO of the Bonneville Environmental Foundationsince its formation in 1998. The Foundation generates revenues from regional and national salesof renewable energy and Green Tags. Since 1998, over $1.5 million in Foundation revenues havebeen dedicated to new renewable energy projects and watershed restoration in the PacificNorthwest. In 1995 Mr. Duncan founded and served as President of The Columbia/PacificInstitute at Portland State University, where he holds an appointment as Adjunct AssociateProfessor. Mr. Duncan represented three Oregon governors on the Northwest Power PlanningCouncil from 1989 to 1995, including service as Council Chairman (1994-95). Previously heserved as Director of Energy Policy, US Department of Transportation. Mr. Duncan has thirtyyears experience in regional and national energy and environmental affairs, at all levels ofgovernment, and in private sector energy development at home and overseas. He speaks andwrites frequently on energy and environmental questions, and serves on the Boards of theOregon Environmental Council and the Northwest Energy Coalition.
Jubitz, AlA native Oregonian, Al graduated from Beaverton High School in 1962, Yale University (BS) in1966 and the University of Oregon School of Business (MBA) in 1968. Al married NancyThompson of Chestnut Hill, MA and together they have three grown daughters and twograndsons. Al recently retired from the family business (Jubitz Corporation) after a careerspanning 34 years. He is Past President of and active in the Rotary Club of Portland andcurrently serves on the Portland Schools Foundation Board. He is Director Emeritus ofMorrison Child and Family Services and a Director of Outward Bound West. He also is engagedin the Jubitz Family Foundation and serves as a director of two private companies. His interestsare in the areas of peace, environmental stewardship and early childhood education. He enjoysplaying squash and golf.
Leslie, David A.David Leslie has been executive director of Ecumenical Ministries of Oregon (EMO) since 1997.EMO is a statewide association of 17 Christian denominations including Roman Catholic,Orthodox and Protestant and is one of the nation’s largest and longest-lasting regionalecumenical associations. Prior to coming to EMO, David served as Executive Director ofInterfaith Ministries for Greater Houston, a coalition of more than 300 congregations andregional and national organizations representing Christian, Muslim, Jewish, Buddhist and Hindu

Oregon Strategy for Greenhouse Gas Reductions – Appendix A | page A-5
communities. He is a founding member and past president of the National InterfaithCommunity Ministry Network and was the founding Executive Director of the Habitat forHumanity affiliate in Austin, Texas. Leslie’s other professional experiences include the OhioCouncil of Churches and World Council of Churches.
Community involvement includes service with Network Behavioral Health Housing Board ofDirectors, Oregon Department of Human Services (ODHS) Reorganization Stakeholders Group,ODHS Faith-based Advisory Group, Oregon Senate Interim Committee on Farmworker Issues,as well as the Salmon and Economic Development Citizens Forum convened by The OregonWheat Growers League and Confederated Tribes of the Umatilla Reservation. Born in SanAugustine, Texas, David received his Masters of Divinity from Austin Presbyterian TheologicalSeminary and his Bachelor of Arts in history from The University of Texas at Austin. He is a laymember of the Presbyterian Church (USA). He is married to Leigh Mohney Leslie, and they havethree sons Ian, Ryan and Michael.
Lorenzen, HenryHenry Lorenzen is a partner in the Pendleton law firm of Corey, Byler, Rew, Lorenzen & Hojem,L.L.P, which he joined in 1984. He has represented numerous utilities and parties acquiringutility system assets, including: the condemnation action by which the City of Hermistonacquired PacifiCorp’s electrical distribution system in Hermiston, Oregon; attorney responsiblefor acquisition of a $45,000,000 electrical distribution system by a newly formed cooperative,Oregon Trail Electric Consumers Cooperative; and serves as General Counsel for Oregon TrailElectric Consumers Cooperative, Baker City, (1988 - present), Umatilla Electric Cooperative,Hermiston, Oregon, (1984 - present), and Columbia Power Cooperative, Monument, Oregon,(1984 - present). Henry is currently retained by the City of Portland for potential condemnationof assets of Portland General Electric.
Henry served as an Assistant United States Attorney (1977-1983). He is Vice President (1973-1990), and President (1990 - present) of H & C Lorenzen Farm, Inc., which is a 4,000 acrefamily wheat farming operation located near Pendleton, Oregon. He received Umatilla CountyConservation Farmer of the Year Award (1992).
Lubchenco, JaneDr. Jane Lubchenco is an environmental scientist and marine ecologist who is actively engaged inteaching, research, synthesis and communication of scientific knowledge to interested citizensand policy makers. She received her B.A. from Colorado College, M.S. from the University ofWashington and PhD. from Harvard University. She was assistant professor at HarvardUniversity for two years before moving to Oregon State University. She holds two positions atOregon State University: Wayne and Gladys Valley Professor of Marine Biology andDistinguished Professor of Zoology. Her research interests include biodiversity, climate change,sustainability science and the state of the oceans. She is lead Principal Investigator (of 13 Co-PIs)for a $43 million, 4-university consortium called the Partnership for Interdisciplinary Studies ofCoastal Oceans (PISCO) that is focused on understanding the dynamics of the nearshoreportion of the large marine ecosystem along the west coast of the US. She and her husband,marine ecologist Bruce Menge, students and collaborators are also engaged in a comparisonof coastal upwelling ecosystems along the coasts of the US West coast, New Zealand, Chileand South Africa.

page A-6 | Oregon Strategy for Greenhouse Gas Reductions – Appendix A
Jane is the first woman President of the International Council for Science, a Past President of theAmerican Association for the Advancement of Science (AAAS) and of the Ecological Society ofAmerica. She serves on the U.S. National Science Board (having been twice nominated byPresident Clinton and twice confirmed by the US Senate) and she recently completed a term onthe Executive committee of the Council of the U.S. National Academy of Sciences. She co-founded and leads the Aldo Leopold Leadership Program and is a Principal of COMPASS, theCommunication Partnership for Science and the Sea. Her research contributions in ecology arewidely recognized. Eight of her publications have been named Science Citation Classic Papers.She is an elected member of the National Academy of Sciences, the American Academy of Artsand Sciences, the American Philosophical Society and the European Academy of Sciences.She serves on the Pew Oceans Commission, an independent group of American leadersconducting a national dialogue on the policies needed to restore and protect the marineecosystems in US waters. She is a Director or Trustee of the David and Lucile PackardFoundation, the Monterey Bay Aquarium, SeaWeb, the Royal Swedish Academy of Sciences’Beijer Institute for Ecological Economics and Environmental Defense. She has receivednumerous awards including a MacArthur Fellowship, a Pew Fellowship, eight honorary degrees(including one from Princeton University), the 2002 Heinz Award in the Environment, the 2003Nierenberg Prize for Science in the Public Interest and the 2004 Distinguished Scientist Awardfrom the American Institute of Biological Sciences.
McArthur, Mike W.A native Oregonian, Mike McArthur graduated from Lewis and Clark College in 1970 with a BSin Psychology. He played intercollegiate football for fours years and competed on the track teamat LC. He then went to Western Oregon to earn a teaching degree and certification with asecondary social science endorsement. Five years of teaching and coaching followed in Portlandand the south coast community of Bandon. He married Jeanney, an accomplished multi-mediaartist, in 1973. In 1977 they left teaching and Bandon to moved to Sherman County, OR towork on a dryland wheat and cattle operation. Mike was elected to and served on the board ofdirectors of the regional grain cooperative: Mid Columbia Producers for six years. Heparticipated in the National Wheat Industry Leaders of Tomorrow program and was CountyWheat League president in 1998. They are still involved in the 115 year old family farmingoperation although not as actively due to Mike’s full time job as County Judge, a position towhich he was elected in 1992. The county judge in Sherman County is the chair of the board ofcommissioners and county administrator as well as juvenile and probate judge. In 1999McArthur served as the President of the Association of Oregon Counties and currently representsOregon counties on the board of the National Association of Counties. He has held a number ofother positions related to community and economic development and now serves in the positionof chair of the Rural Affairs Sub-Committee of the Agricultural Steering Committee for NACo.Also, he currently serves on the Governor’s Industrial Lands Task force and is Co-Chair of theState Community Development Forum.
MacRitchie, Andrew (alternate for Judi Johansen, PacifiCorp)Andy MacRitchie became PacifiCorp’s executive vice president of Strategy and Major Projects inJanuary 2002. Andy is responsible for strategy, business planning and environmental policy forthe U.S. Division of ScottishPower, which includes oversight of the major issues program. He isalso a member of the PacifiCorp’s Board of Directors. Prior to assuming his current position,

Oregon Strategy for Greenhouse Gas Reductions – Appendix A | page A-7
Andy formed and served as executive vice president of the Power Delivery business. Here he wasresponsible for the operational management of PacifiCorp’s $4 billion asset base covering electricdistribution, transmission and customer service for its 1.5 million customers in Oregon, Utah,Washington, California, Idaho and Wyoming.
Andy moved to the US in December 1998 to lead the ScottishPower merger team through stateregulatory commissions’ approvals during the company’s merger with PacifiCorp. Uponcompletion of the regulatory process, Andy led the transition planning process, involving acombined PacifiCorp/ScottishPower senior management team in the development of plans totransform PacifiCorp into a top 10 U.S. utility. Andy joined ScottishPower in 1986. Prior toworking for ScottishPower, Andy was operations manager at Stagecoach Holdings. He is amember of the Institution of Electrical Engineers (IEE) and is a Chartered Engineer in the U.K.Andy has an honors degree in electronics and electrical engineering as well as an MBA fromStrathclyde Graduate Business School in Scotland. He also completed an Executive DevelopmentProgram at Wharton Business School in the United States.
Mitchell, Ronald B.Dr. Ronald B. Mitchell is an Associate Professor with tenure in the Department of PoliticalScience at the University of Oregon. He earned his PhD in Public Policy at Harvard University in1992. He was a Visiting Associate Professor at the center for Environmental Science and Policyat Stanford University from June 1999 through December 2001. He has an award-winning bookpublished with MIT Press as well as numerous articles in scholarly journals. His research focuseson the effectiveness of international institutions at influencing the behavior of states and nonstateactors as well as on the influence of environmental science on international policymaking. Heteaches courses on international relations theory, international environmental politics, andinternational regimes.
Schell, SteveSteven R. Schell is a partner in the Portland Law Firm of Black, Helterline, LLP. He practicesenvironmental, land use and real estate law. He is a native Oregonian, having graduated fromFranklin High School in Portland, the University of Oregon with two degrees, in 1961 a BA inPolitical Science, and in 1968 a J. D in Law. He has a 1965 M.A. from the University of Denverin Economics. He served in the United States Air Force from 1961 to 1965. He served as amember and vice-chairman of Oregon’s Land Conservation and Development Commission from1973 to 1976, on the Oregon Law Commission task force that resulted in the creation of theLand Use Board of Appeals in 1978-1979, on the State’s Energy Facility Siting Council from1990 to 1998. He currently chairs the Oregon non-profit corporation, Energy Trust of Oregon.
Southworth, JackJack Southworth and his wife, Teresa own and operate Southworth Bros. Ranch, a cow-calf-yearling ranch located on the south side of the Strawberry Mountains near the small town ofSeneca. The ranch was homesteaded by Jack’s great-grandfather in 1885 and has been operatedby his family ever since. He and Teresa graduated from Oregon State University in 1977, marriedin 1978 and have been operating the ranch since then. Jack is president of the Grant CountyFarm Bureau, serves as a director of Blue Mountain Hospital, Oregon Agricultural EducationFoundation, the E. R. Jackman Foundation and the Blue Mountain Healthcare Foundation. Heis an amateur historian and enjoys collecting photos and stories having to do with the history of

page A-8 | Oregon Strategy for Greenhouse Gas Reductions – Appendix A
southern Grant County. He believes that when ranching is done well, ranchers can produce safeand delicious beef, a healthy ecosystem and do it in a manner that is profitable and enjoyable forthe people involved.
Sten, ErikOver the past 7 years, Portland City Commissioner Erik Sten has led the city’s efforts to combatclimate change in an urban environment. In 1994, the City of Portland was the first city in theUnited States to adopt a Local Action Plan on Global W arming. Since then over 400 municipalgovernments world-wide have followed Portland’s lead and adopted climate change mitigationplans. In 2001, Portland City Council and the Multnomah County Board of Commissionersadopted a joint Local Action Plan on Global Warming with a goal of reducing carbon dioxideemissions to 10 percent below 1990 levels by 2010. This target is slightly more aggressive thanthe 1997 Kyoto Protocol, which, though not ratified by the U.S., set a national reduction goal ofseven percent below 1990 levels by 2008 to 2012. Commissioner Sten has conveyed Portland’sefforts at many national and international gatherings including a presentation at the UnitedNations Conference of the Parties on Climate Change in Buenos Aires.
Wilkinson, JeanJean Underhill Wilkinson is a partner in Martin Underhill Farms, a family owned wheat andcattle ranch that has existed since 1878. Prior to joining her family business, Jean worked as alobbyist and legal counsel for the Oregon Cattlemen’s Association and the Oregon Farm BureauFederation. Jean is a current member of the Oregon State Bar, and is Chair Elect for theAgriculture Law Section. She is also President of the Wasco County Wheat Growers Association,and a board member for the Multnomah County Farm Bureau.
Wyatt, BillBill Wyatt has been Executive Director of the Port of Portland since October of 2001. The Portof Portland, governed by a nine member Commission appointed by the Governor, operates fourmarine terminals, three general aviation airports and Portland International Airport (PDX). ThePort has just over 800 employees and annual revenues of approximately $250 million.
Prior to his appointment as the Port’s Executive Director, Wyatt served as Chief of Staff toformer Oregon Governor John A. Kitzhaber for seven years, preceded by six years as President ofthe Oregon Business Council, and five years as Executive Director of the Association forPortland Progress, then, Portland’s downtown development association. Wyatt served as a staterepresentative from the Astoria area from 1974-1977. He attended public schools in Astoria, andAlexandria, Virginia, and later attended both Willamette University and the University ofOregon, where he was also student body President. Wyatt has been a member of the Board ofDirectors of Oregon Public Broadcasting, and was Board Chair of the Urban League of Portland.He served as a Director of the Crabbe-Huson mutual funds until their sale to Liberty Mutual in 1998.
Wyse, DuncanDuncan Wyse became the President of the Oregon Business Council in June 1995. The OregonBusiness Council is a private non-profit, non-partisan organization consisting of 46 businessexecutives of some of Oregon’s largest businesses. OBC’s function is to focus the knowledge andresources of its members on key, long-range public policy issues facing Oregon. Prior to thisposition, Wyse was Executive Director of the Oregon Progress Board, where he developed

Oregon Strategy for Greenhouse Gas Reductions – Appendix A | page A-9
Oregon Shines, Oregon’s long-range strategy for economic growth, and Oregon Benchmarks,indicators measuring how Oregon is doing as a people, place and economy. Previously, he spenteight years at the California Public Utilities Commission, serving as advisor to the President andDirector for Policy and Planning. He was heavily involved in restructuring thetelecommunications, electricity and natural gas industries in California. He currently serves onthe Oregon Quality Education Commission, the E3: Employers for Education Excellence Boardof Directors, the Oregon Mentors Leadership Council, the Multnomah County LeadersRoundtable, Portland-Multnomah Progress Board, the Multnomah County Commission onChildren, Families and Community, the Portland Public Schools Foundation, the WillametteRestoration Initiative and the Governor’s Global Warming Advisory Group. Wyse holds aBachelor’s degree from Pomona College and a Master’s in Business Administration from StanfordUniversity. He grew up in Portland, and is married with three children.
Ex Officio Member
Neilson, Ronald P.Ronald P. Neilson is a BioClimatologist with the USDA Forest Service, Pacific NorthwestResearch Station and a Professor (Courtesy) with the Department of Botany and Plant Pathologyand the Department of Forest Science at Oregon State University. Dr. Neilson has focused on thetheory, mechanisms and simulation of vegetation distribution for nearly three decades. Hereceived the Cooper Award from the Ecological Society of America for his research on oakdistribution in the Rocky Mountain region. Dr. Neilson’s MAPSS biogeography model and MC1dynamic general vegetation model have contributed to national and global assessments by theIntergovernmental Panel on Climate Change (IPCC) and the U.S. Global Change ResearchProgram and to Our Changing Planet, the formal description of the U.S. Global ChangeResearch Program. Dr. Neilson was the lead author for the Forest sector for the IPCC’s specialreport on The Regional Impacts of Climate Change and the convening lead author for an Annexto the Special Report on simulations of global vegetation re-distribution under climate change.His current work extends into Earth System Modeling, Landscape System Modeling and large-scale fire forecasting. Dr. Neilson received the Forest Service Chief’s 1999 Honor Award forSuperior Science and the USDA Secretary’s Honor Award for Superior Service in 2003. Hereceived a BA in 1971 from the University of Oregon, an MS in 1975 from Portland StateUniversity, and a Ph.D. in 1981 from the University of Utah.
State Agency Members
Grainey, Michael W.Michael Grainey is Director of the Oregon Department of Energy in Salem, Oregon. Mikegraduated from New York University Law School and received his undergraduate degree fromGonzaga University in Spokane, Washington. He is admitted to practice law in Oregon,Washington and the District of Columbia. His civic activities have included membership on theBoard of Directors of the Salem Chamber Orchestra, coaching youth soccer in the Salem Parksand Recreation Program, debate coach for Blanchet High School in Salem and chair of hischurch’s social justice committee.
page A-10 | Oregon Strategy for Greenhouse Gas Reductions – Appendix A
Hallock, StephanieStephanie Hallock was appointed Director by the Oregon Environmental Quality Commissionon Nov 6, 2000. Previous to her appointment she was on a special one-year assignment as awater quality policy adviser for Governor John Kitzhaber’s Natural Resources Policy Group.Hallock has been with DEQ since August 1988, serving as Administrator of the Hazardous andSolid Waste Division, Acting Administrator of the Water Quality Division, and Administrator ofDEQ’s Eastern Region, overseeing agency work in eighteen Oregon counties. She also served atthe U.S. Environmental Protection Agency’s Region 9 office in San Francisco as chief of thePolicy and Grants Branch, and has worked in advertising and public relations at the Hallock/Modey Agency in Portland. Hallock has a master’s degree in Public Administration and aBachelor of Arts degree in English, both from Portland State University.
Savage, JohnJohn Savage has been a Public Utility Commissioner since September, 2003. From January 2002through August, 2003, he directed the Public Utility Commission’s 70-person regulatory staff.From December, 1993 to January 2002, he served as director of the Oregon Department ofEnergy. During that time, the 1997 Legislature passed the carbon dioxide emissions law for newpower plants. From January 1987 to December 1993, John headed the Policy and PlanningDivision of the Oregon Department of Energy. The Division was responsible for producing thestate’s energy, global warming, and petroleum contingency plans.
Van’t Hof, DavidDavid Van’t Hof is the sustainability and renewable energy policy advisor for GovernorKulongoski. Mr. Van’t Hof will be implementing the Governor’s Executive Order onsustainability, the Governor’s three state climate change initiative, and fostering the developmentof renewable energy and associated technologies in Oregon. He previously served as GovernorKulongoski’s natural resources advisor on water, energy and land use issues. Prior to workingfor the Governor, Mr. Van’t Hof was a private sector attorney who focused on natural resources,land use, and administrative law, with an emphasis on major project permitting and water rights.He advised clients on complex regulatory matters such as environmental and siting issues forprojects including natural gas, wind, and hydroelectric facilities. He also assisted a variety ofpublic and private clients with National Environmental Policy Act (NEPA), Endangered SpeciesAct (ESA), water rights, and water quality issues and represented several clients in the KlamathBasin Water Rights Adjudication and in contested cases before the Water Resources Department.
Mr. Van’t Hof was a former clerk for then Supreme Court Justice Ted Kulongoski. He graduatedcum laude from the University of Michigan Law School and was Phi Beta Kappa at TrinityCollege in Hartford, Connecticut. He attended the Institute for European Studies in Vienna,Austria and was a Peace Corps volunteer in Senegal, West Africa. His past professional activitiesinclude: member of the Oregon Water Resources Congress, Rocky Mountain Mineral LawFoundation, Oregon State Bar Environmental and Natural Resources Section, AdministrativeLaw Section, and Indian Law Section, Community Water Supply Task Force, organized by theOregon Water Resources Commission; board member, African Refugee and Immigrant Networkof Oregon; founder and former board member and board president, Hands On Portland;volunteer immigration attorney, Sponsors Organized to Assist Refugees; chair of Large FirmAssociates Committee, Campaign for Equal Justice.

Oregon Strategy for Greenhouse Gas Reductions – Appendix B | page B-1
Appendix B
Inventory and Forecast ofOregon’s Greenhouse Gas EmissionsIn 2000, Oregon’s greenhouse gas (GHG) emissions were 67.7 million metric tons of carbondioxide equivalent1 (MMTCO2E).2 That was about one percent of US GHG emissions, whichexceeded 7 billion metric tons CO2E.
By 2000, there was an 15 percent increase over Oregon’s 1990 GHG emissions of 58.7 MMTCO2E.According to its worst case forecast, the Department of Energy estimates that GHG emissions fromOregon will be 61 percent higher by 2025. Figure 1 shows change in emissions between 1990 and2000. Table 2 shows historical emissions and Table 3 shows the forecast emissions.
Figure 1Oregon Greenhouse Gas Emissions
1 “Carbon dioxide equivalent (CO2E)” refers to a comparison of the radiative force of different greenhouse gases related toCO2, based on their global warming potential. It is a way to compare all greenhouse gases on a uniform scale of how muchCO2 would be needed to have the same warming potential as other gases over the same time scale. Following US Environ-mental Protection Agency (EPA) and international reporting protocols per the Second Assessment Report, methane is 21times more powerful than CO2 over 100ºyears and nitrous oxide is 310 times more powerful for example.
2 The Department used the US Environmental Protection Agency State Tool for Estimating Greenhouse Gas Emissionsto prepare its inventory except for variations in accounting for CO2 emissions from electricity use, methane emissionsfrom landfills, and a few minor sources. Exceptions are explained in the discussion of gases. EPA’s Emissions Inven-tory Improvement Program Volume VII: Estimating Greenhouse Gas Emissions serves as a guide.
0
10
20
30
40
50
60
70
80
1990 1991 1992 1993 1994 1995 1996 1997 1998 1999 2000
HFC, PFC, SF6Nitrous OxideMethaneCarbon Dioxide
MM
TCO
2E

page B-2 | Oregon Strategy for Greenhouse Gas Reductions – Appendix B
Of the GHG emissions from Oregon in 2000, 84 percent came from CO2. The primary source ofCO2 pollution came from burning fossil fuels, such as coal at power plants serving the state,gasoline, diesel, and natural gas. There were also emissions from industrial processes, such asmanufacture of cement and from combustion of fossil-fuel derived products in burning municipaland industrial wastes.
Table 1Oregon Greenhouse Gas Emissions, MMTCO2E
1990 1995 2000
Gross CO2 49.2 52.6 57.9
Net CO2 48.4 51.9 57.0
CO2 from Fossil Fuel Combustion 48.5 51.9 57.0
Industrial Processes 0.3 0.3 0.6
Waste 0.3 0.4 0.3
Landfill Carbon Storage (0.8) (0.8) (0.8)
Methane 4.2 4.4 4.5
Stationary Combustion 0.1 0.1 0.1
Mobile Combustion 0.1 0.1 0.1
Natural Gas and Oil Systems 0.6 0.6 0.6
Enteric Fermentation 2.0 2.2 2.2
Manure Management 0.3 0.3 0.3
Waste 1.0 0.9 1.1
Wastewater 0.2 0.2 0.2
Nitrous Oxide 4.4 4.9 4.2
Stationary Combustion 0.1 0.1 0.1
Mobile Combustion 0.6 0.8 0.8
Manure Management 0.1 0.1 0.1
Agricultural Soil Management 3.4 3.8 3.1
Waste 0.0 0.0 0.0
Wastewater 0.1 0.1 0.1
HFC, PFC, and SF6 1.7 1.8 2.0
Hydrofluorocarbons 0.0 0.3 0.7
Perfluorocarbons 1.1 1.1 0.9
Sulfur Hexafluoride 0.5 0.5 0.3
Gross Emissions 59.5 63.8 68.6
Net Emissions (Sources and Storage) 58.7 63.0 67.7

Oregon Strategy for Greenhouse Gas Reductions – Appendix B | page B-3
The inventory includes a reduction in emissions from storage of carbon from yard trimmings,wood products, and other miscellaneous products in landfills. The inventory does not includeother land use and forest-management related sources and sinks, such as forest sequestration,because data were not available. They are being collected as part of another study, the West CoastCarbon Sequestration Partnership. Because that effort was already underway when the AdvisoryGroup on Global Warming began, the Department did not attempt to duplicate its efforts.
Table 1 provides a summary of the major sources of greenhouse gas emissions. The individualsources are described in later sections.
In 2000, emissions from methane (CH4), primarily from cattle and landfills, contributed 7percentof greenhouse gas pollution. Nitrous oxide (N2O) emissions, primarily from agriculturalpractices, contributed about 6 percent to greenhouse gas pollution. Manufactured halocarbons,which include hydrofluorocarbons (HFC), perfluorocarbons (PFC), and suflur-hexafluoride (SF6),accounted for the remaining 3 percent.
Carbon Dioxide EmissionsFossil fuel combustion is the primary source of CO2 emissions. Table 2 shows the breakdown ofCO2 emissions from fossil fuel combustion for the majors sectors: electricity generation,transportation, industrial, residential, and commercial.
Table 2CO2 Emissions by Sector from Fossil Fuel Combustion, MMTCO2
1990 1991 1992 1993 1994 1995 1996 1997 1998 1999 2000
Electricity generation 20.7 21.0 20.6 21.4 21.6 22.0 22.7 22.9 21.7 22.9 24.2
Transportation 18.2 18.7 18.5 18.5 19.2 19.4 20.1 20.2 21.2 21.6 21.5
Industrial 5.6 5.6 6.2 6.3 6.3 6.9 6.7 6.9 6.6 7.4 6.8
Residential 2.1 2.2 1.8 2.2 2.1 2.1 2.3 2.3 2.4 2.6 2.6
Commercial 1.9 1.8 1.6 1.7 1.6 1.6 1.8 1.8 1.9 1.9 1.9
TOTAL 48.5 49.3 48.8 50.1 50.8 51.9 53.6 54.1 53.8 56.3 57.0
Oregon has a Benchmark to hold its CO2 emissions at 1990 levels. However, between 1990 and
2000 total net CO2 emissions grew almost 18 percent.
Electricity Generation. Electricity was the major source of CO2 from fossil fuels in 2000,
representing 42 percent of those emissions. Emissions from electricity grew 17 percent from 1990to 2000, but its relative contribution stayed the same.
The Department calculates emissions from electricity generation based on the carbon content ofthe regional mix of electricity for the 11 contiguous western states. The Department took theaverage carbon content from 1990 through 2000 and applied that to electricity loads. While

page B-4 | Oregon Strategy for Greenhouse Gas Reductions – Appendix B
some states inventory only emissions from generating facilities within the state, the Departmentbelieves a regional carbon mix better reflects the carbon mix associated with the delivery ofelectricity to Oregon’s consumers.
The regional approach better reflects carbon emissions for the following reasons: 1) The regionalgrid provides electricity to the state. 2) Taking credit for the hydropower generated for theBonneville Power Administration from dams on the Columbia River, as it is allocated to Oregonin national inventories, does not reflect the way that electricity is distributed in the region. 3)Oregon’s second-largest investor-owned utility, PacifiCorp, has most of its generation out ofstate, and most of that is coal-fired.
Although the comprehensive emissions inventory stops at 2000, the Department does have datafrom 2002 that reflect the carbon content of the electricity serving the state. This is based ondata specific to Oregon utilities, rather than the more general regional average. However, it doesnot differ significantly from the regional number. Figure 2 shows the sources of electricity thatsupplied the state in 2002.
The generation mix for 2002 in Figure 2 is based on power plants whose output is dedicated toOregon utilities. Utilities can generate this output at facilities that they own, either in-state orout-of-state. It also includes cases where a utility purchases the output of a specific power plant.For Portland General Electric, the total of such purchases and ownership is less than its totalelectric load. In that case, the calculations for the figure assume that the remainder of theelectricity is supplied by a mix of resources from the Northwest Power Pool. Utility purchasesfrom the Bonneville Power Administration (BPA) under long term contracts are credited with theBPA resource mix.
The mix of sources shows hydropower, which has no direct emissions, at 43 percent and coal at42 percent. At 8 percent, natural gas-fired plants were the third largest source of electricitysupply. Non-fossil fuel sources also included biomass and municipal solid wastes, shown as onecategory, and nuclear, which each supplied about 3 percent. Wind and geothermal togethersupplied only 1 percent.

Oregon Strategy for Greenhouse Gas Reductions – Appendix B | page B-5
Figure 2Electricity Generation Mix Supplying Oregon 2002
Transportation. Gasoline and diesel fuel use in transportation3 were the second largest sources ofemissions from fossil fuels at 38 percent in 2000. Emissions from transportation grew 18 percentfrom 1990 to 2000, but the relative contribution has not changed.
Direct Natural Gas and Distillate Use. CO2 emissions from the industrial and residential sector
from direct natural gas and distillate fuel combustion grew by 22 and 23 percent, respectively,from 1990 to 2000. Other sources were asphalt and petroleum coke in the industrial sector andliquefied petroleum gas in the residential sector. Emissions from the commercial sector were flat.
MethaneMethane emissions contributed about 4.5 MMTCO
2E in 2000. That represented about 7 percent
of Oregon’s 2000 greenhouse gas inventory. The distribution of methane emissions for 2000 isshown in figure 3.
More than half of methane emissions came from agricultural practices. Enteric fermentation, orburps from cattle and other domesticated animals, contributed 48 percent. The methane isgenerated in the rumen, or first stomach, of cattle and other ruminants. Another 6 percent came
Coal42%
Biomass & MSW3%
Hydro43%
Nuclear3%
Wind & Geothermal
1%
Natural Gas8%
3 Residual fuels use by vessels is not included because international ships are the primary purchasers. Theypurchase fuel at any port, based on price. Therefore combustion of the fuel is not directly related to economicactivity within Oregon.

page B-6 | Oregon Strategy for Greenhouse Gas Reductions – Appendix B
from manure management, both from that managed in lagoons on farms or that simplydeposited on the ground.
The second largest source of methane was from waste in municipal and industrial landfills at 26percent.4 Another 4 percent came from wastewater from pulp and paper production, fruit andvegetable processing, and red meat and poultry processing.
Figure 3Methane Emissions in Oregon
Other sources include leaks from natural gas and oil systems (calculated from miles of pipelineand number of services), emissions from vehicles, and emissions from combustion of natural gas,distillate, residual fuel, and wood in homes and businesses.
Nitrous OxideNitrous oxide (N
2O) emissions contributed about 4.2 MMTCO
2E in 2000. That represented
about 6 percent of Oregon’s 2000 GHG emissions. The distribution of N2O emissions for 2000 is
shown in figure 4.
4 This represents an estimate of methane actually released to the atmosphere. The amount of methane produced inlandfills is significantly higher, but some is converted to CO2 as it passes through surface soils and some Oregonlandfills also capture and flare methane. Since the CO2 released from landfills is not fossil-based, it is not calcu-lated separately. It is assumed to be recycling through the biosphere.

Oregon Strategy for Greenhouse Gas Reductions – Appendix B | page B-7
The primary source of N2O emissions is from agricultural soil management through numerous
pathways. N2O is emitted from agricultural soils due to synthetic and organic fertilizer use,
application of animal wastes through daily spread activities, application of managed animalwastes, crop residues remaining on agricultural fields, biological nitrogen fixation by certaincrops, cultivation of highly organic soils, and land application of sewage sludge. N
2O also is
emitted from soils from direct deposit of animal wastes in pastures, ranges and paddocks. Thereare also indirect emissions from fertilizers and from leaching and runoff. In addition toagricultural soils management, N
2O is directly emitted from the manure decomposition process.
Figure 4Nitrous Oxide Emissions 2000
Small amounts of N2O are emitted from internal combustion engines and during the catalytic
after-treatment of exhaust gases, but these processes are not well understood. In any case, thoseemissions stayed relatively flat over the period 1990-2000.
Perfluorocarbons (PFCs)Aluminum production was the major source of PFCs between 1990 to 1996. The emissions occurduring the reduction of alumina in the primary smelting process. (As of 2001, aluminum is no longerproduced from alumina in Oregon, and recycling aluminum does not produce PFC emissions.)
Beginning in 1997, emissions from PFCs for plasma etching and chemical deposition processes inthe semiconductor industry exceeded aluminum production, and by 2000 represented about 70percent of PFC emissions. However, total emissions of PFCs dropped from 1.2 MMTCO
2E in

page B-8 | Oregon Strategy for Greenhouse Gas Reductions – Appendix B
1990 to 0.9 MMTCO2E in 2000. Overall, PFC emissions were about 1 percent of the state’s
GHG emissions in 2000.
Hydrofluorcarbons (HFCs)HFCs are most commonly used as a replacement for CFC in cooling and refrigeration systems.(CFC was formerly the most common refrigerant. However, CFC destroys the stratosphericozone layer. Its production is banned by international treaty.) Use and discharge of HFC is con-trolled as a refrigerant, but not for other uses.
HFCs are used for foam blowing, fire extinguisher applications, aerosols, sterilization, and assolvents. HFCs are also used in plasma etching and chemical deposition processes in the semicon-ductor industry. While HFCs do not damage the ozone layer, they are powerful greenhouse gases.HFC emissions rose from nearly zero in 1990 to about 0.7 MMTCO
2E in 2000, when they
accounted for about 1 percent of Oregon’s GHG emissions.
Sulfur Hexafluoride (SF6)SF
6 is one of the most powerful greenhouse gases. It is 23,900 times more powerful than CO
2.
The largest use of SF6 is as an electrical insulator in transmission and distribution equipment. SF
6
is also used for plasma etching and chemical vapor deposition processes in the semiconductorindustry. There was some SF
6 emitted from aluminum production as well.
SF6 emissions dropped from 0.5 MMTCO
2E in 1990 to 0.3ºMMTCO
2E in 2000, primarily
because of declines in emissions from the electricity sector due to better control practices. SF6
was about 0.5 percent of total GHG emissions in 2000.
ForecastsThe Department forecasts that Oregon’s greenhouse gas emissions will grow by 36 MTCO
2E, or
61 percent, in the worst case (business-as-usual) estimate from 1990 to 2025. That rate assumesno change from current practices. In reality, it will probably grow less. Table 3 shows the fore-cast by sources of gases. The following discussion highlights major elements of the forecast.
Electricity and Natural Gas. For CO2 emissions from electricity and natural gas, the Department
used a growth rate of 1.6 percent, which is a composite of Northwest Power and ConservationCouncil forecasts and forecasts in the integrated resource plans of Portland General Electric,PacifiCorp, and Northwest Natural.
Transportation. For transportation, the 1990 Oregon emissions were 18.3 MMTCO2, according
to the Federal Energy Information Administration (EIA) data. By the year 2000, emissionsreached 21.5 MMT CO
2, for an annual growth rate of 1.6 percent. Based on the Oregon Depart-
ment of Transportation’s forecast for taxed fuels and U.S. Department of Energy forecasts for jetfuel and freight diesel, the Oregon Department of Energy forecast an annual growth rate of 1.6percent, leading to emissions of 32.0 MMT CO
2 by the year 2025. The base case transport CO
2
emissions grow 33 percent between 2000 and 2025.
Methane. The forecast for methane emissions from landfills is described in the introduction tothe section on materials use in the main report. In summary, the historic trend is used as the

Oregon Strategy for Greenhouse Gas Reductions – Appendix B | page B-9
starting point for projecting future growth in waste generation. Using Department of Environ-mental Quality and US EPA data, estimates were made of the rate of change in per-capita wastegeneration during the period 1993 to 2002 for 30 different categories of wastes. The rates ofadjusted growth in per-capita waste generation (by material) were then related to the rate ofgrowth in inflation-adjusted Oregon personal income during the same period.
TABLE 3Historical and Forecast Oregon Greenhouse Gas Emissions, MMTCO2E
1990 1995 2000 2015 2025
Gross CO2 49.2 52.6 57.9 70.6 80.3
Net CO2 48.4 51.9 57.0 69.6 79.0
CO2 from Fossil Fuel Combustion 48.5 51.9 57.0 69.4 78.8
Industrial Processes 0.3 0.3 0.6 0.9 1.1
Waste 0.3 0.4 0.3 0.3 0.4
Landfill Carbon Storage (0.8) (0.8) (0.8) (1.0) (1.2)
Methane 4.2 4.4 4.5 5.9 6.5
Stationary Combustion 0.1 0.1 0.1 0.1 0.0
Mobile Combustion 0.1 0.1 0.1 0.1 0.0
Natural Gas and Oil Systems 0.6 0.6 0.6 0.7 0.8
Enteric Fermentation 2.0 2.2 2.2 2.6 2.9
Manure Management 0.3 0.3 0.3 0.3 0.3
Waste 1.0 0.9 1.1 1.9 2.3
Wastewater 0.2 0.2 0.2 0.2 0.2
Nitrous Oxide 4.4 4.9 4.2 5.5 6.0
Stationary Combustion 0.1 0.1 0.1 0.1 0.0
Mobile Combustion 0.6 0.8 0.8 1.0 1.1
Manure Management 0.1 0.1 0.1 0.0 0.0
Agricultural Soil Management 3.4 3.8 3.1 4.3 4.7
Waste 0.0 0.0 0.0 0.0 0.0
Wastewater 0.1 0.1 0.1 0.1 0.2
HFC, PFC, and SF6 1.7 1.8 2.0 2.5 3.3
Hydrofluorocarbons 0.0 0.3 0.7 1.9 2.6
Perfluorocarbons 1.1 1.1 0.9 0.5 0.5
Sulfur Hexafluoride 0.5 0.5 0.3 0.2 0.1
Gross Emissions 59.5 63.8 68.6 84.6 96.0
Net Emissions (Sources and Storage) 58.7 63.0 67.7 83.6 94.8

page B-10 | Oregon Strategy for Greenhouse Gas Reductions – Appendix B
5 The non-landfill benefits of recycling, composting, and waste prevention, such as reduced fossil fuel use andincreased carbon storage in forests and landfills, were included in estimates of the greenhouse gas benefits ofspecific measures. However, the state inventory does not account for non-landfill offsets, such as savings inindustrial processes from using recycled feed-stocks, in part because many of the benefits involve emission reduc-tions outside of Oregon.
The estimate is that per-capita waste generation, aggregated across all 30 material categories, willgrow to 10.1 pounds per person per day in 2025 under the “business as usual” scenario. Thisassumes that relationships between personal income and materials use/waste hold constant and isbased on projections of inflation-adjusted personal income from the Oregon Department ofAdministrative Services. Coupled with projected population increases, total in-state wastegeneration (all discards, including recycling and composting) is projected to grow from 5.1million tons in 2003 to 8.4 million tons in 2025. The recovery rate (recycling and composting) ofthese rates, currently at about 46 percent, is assumed to hold constant, so not all discards end upin landfills.5
Oregon also imports significant quantities of municipal solid waste (garbage) from other states.Waste imports are modeled, growing at a rate of about 4.6 percent per year, from about 1.5million tons projected in 2003 to 4.0 million tons in 2025. Only emissions associated with thedisposal portion of the life cycle are counted for these imported wastes.
Other GHG. Most other projection sources are forecast based on linear regressions orexponential regressions of historical data. The Department did not have source-specific forecastsfor the many minor contributors. Because most major semiconductor manufacturers haveprograms to reduce HFC, PFC, and SF
6, we forecast that those emissions from that sector will
return to 1995 levels in the future. The 1995 level is therefore the value in the 2015 and 2025forecast for that sector.

Oregon Strategy for Greenhouse Gas Reductions – Appendix C | page C-1
The signatories of this statement seek to describe the state of scientific knowledge regarding likely impacts of climate change to the Pacific Northwest region. The intent is to assist Governor Kulongoski’s Advisory Group on Global Warming in its task of developing a greenhouse gas emission reduction strategy for Oregon. The signatories agree that climate change is underway and that it is having global effects as well as impacts in the Pacific Northwest region. Climate-related changes to date, likely future changes, key questions to answer and research priorities are listed below. Regional Climate Change Impacts in Recent Decades.
Temperature. Scientists are very certain that the Pacific Northwest is warming and that since 1975 the warming is best explained by human-caused changes in greenhouse gases. Precipitation. Since the beginning of the 20th century, average annual precipitation has increased across the region by 10% with increases of 30–40% in eastern Washington and northern Idaho. Sea Level. Land on the central and northern Oregon coast (from Florence to Astoria) is being submerged by rising sea level at an average rate of 0.06 – 0.08 inches (1.5–2 mm) annually, as inferred from data for the period 1930–1995. Snowpack. Between 1950 and 2000, the April 1 snowpack declined. In the Cascades, the cumulative downward trend in snow-water equivalent is approximately 35% for the period 1950–1995. Timing of the peak snowpack has moved earlier in the year, increasing March streamflows and reducing June streamflows. Snowpack at low-to-mid elevations is the most sensitive to warming temperatures.
Regional Climate Change Projections over the Next 10-50 Years.
Temperature. Scientists have intermediate certainty that average temperatures in the Pacific Northwest will continue to increase in response to global climate change. Assessments suggest that the average warming will be approximately 2.7¯ F by 2030 and 5.4¯ F. by 2050. These projected increases are highly likely to result in a higher elevation treeline, longer growing seasons, longer fire seasons, earlier animal and plant breeding, longer and more intense allergy season and changes in vegetation zones. Precipitation. Precipitation changes are very uncertain. The challenge will be to resolve scientific uncertainties about the interactions among atmosphere, land and ocean before significant climate change impacts occur. Oregon is expected to remain a wintertime-dominant precipitation regime (i.e., most precipitation will continue to occur in the winter). In addition, most precipitation will continue to occur in the mountains. Impacts on water resources due to low summer precipitation and earlier peak streamflow will likely include decreased summer water availability, changes in our ability to manage flood damage, shifts in hydropower
Appendix CScientific Consensus Statement on the LikelyImpacts of Climate Change on the Pacific Northwest
Executive Summary

page C-2 | Oregon Strategy for Greenhouse Gas Reductions – Appendix C
production from summer to winter, and decreased water quality due to higher temperatures, increased salinity and pollutant concentration. Sea Level. Sea level is very certain to continue to rise although the impact will vary depending upon how fast the land is rising. In addition to increases in sea level, maximum wave heights will likely also increase, resulting in increasing erosion in coastal areas. Snowpack. The April 1 snowpack will continue to decline corresponding to an earlier peak streamflow. Marine Ecosystems. It is very certain that ocean circulation will continue to change in response to ocean-atmospheric processes. These changes suggest a likely increase in the magnitude and duration of upwelling, which will affect marine ecosystems. It is uncertain whether these changes will have adverse impacts such as more frequent occurrences of the low-oxygen (“dead zone”) events seen in 2002 and 2004. Terrestrial Ecosystems. The impact of changes in temperature and precipitation on terrestrial ecosystems is poorly known. Due to current biomass densities, the anticipated drier summers will likely increase drought stress and vulnerability of forests to insects, disease and fire. Important Questions that could be Answered by Research. What will be the trend and pattern of precipitation in the region? What will be the patterns of coastal ocean winds? What are the dynamics of large, decadal-scale patterns of ocean/atmosphere interactions? Do thresholds exist for abrupt climate change and system shifts? How will these patterns affect ecosystem patterns and resilience? How will changes impact human health? How will changes affect regional economic and social conditions? Research Priorities
1. Improved and sustained observation of critical processes that can resolve interannual/decadal- scale variability.
2. Focused process experiments and studies of critical processes, such as impacts of increased CO2 on forest dynamics.
3. Improved numerical and statistical models focused on coupled atmosphere/ocean/land processes that include ecological as well as geophysical dynamics.
4. Modeling and analysis of the effects of economics and management policies interannual/decadal-scale processes in the region.

Oregon Strategy for Greenhouse Gas Reductions – Appendix C | page C-3
Scientific Consensus Statement on the
Likely Impacts of Climate Change on the Pacific Northwest
History and Objective
This Consensus Statement was drafted by a subcommittee of participants in the scientific meeting “Impacts of Climate Change on the Pacific Northwest” convened at OSU on June 15, 2004. The statement has been reviewed and signed by 50 meeting participants. The objective of the statement is to assist Governor Kulongoski’s Advisory Group on Global Warming (GAGGW) by describing the state of scientific knowledge and uncertainty regarding climate change impacts in the Pacific Northwest. The GAGGW is charged with recommending strategies for reduction of greenhouse gas emission for the State of Oregon. For more information about the consensus process and participants, see Appendix A. Global Effects of Climate Change
The signatories of this consensus statement agree with the scientific findings about climate change as reported in the Third Assessment Report of Working Group I of the Intergovernmental Panel on Climate Change (IPCC), published in 2001. The IPCC finds that
¶ over the last century, the global average surface temperature increased about 1¯ F, and ¶ sea level rose between 4 and 8 inches.
The IPCC predicts that if current trends continue, by 2100
¶ the global average temperature will increase 2.5–10.4¯ F and ¶ sea level will rise 4–35”.
The IPCC report concludes that
“There is new and stronger evidence that most of the warming observed over the last 50 years is attributable to human activities.”
An overview of these and other findings from the IPCC Third Assessment Report is attached in Appendix B. Regional Impacts of Climate Change
Climate change is also affecting important parameters and processes on a regional scale. This Consensus Statement addresses the following key questions related to the impacts of climate change on the Pacific Northwest:
¶ What are the areas of consensus on the impacts of climate change on the Pacific Northwest based on scientific findings and observed changes?
¶ What are the projections for impacts of climate change on the Pacific Northwest over the next 10–50 years?
¶ What are the areas of uncertainty affecting our ability to understand and predict likely climate change?
¶ What are the most important questions to be answered in the next 5–10 years? ¶ What are the priorities for future research?

page C-4 | Oregon Strategy for Greenhouse Gas Reductions – Appendix C
What are the areas of consensus on the impacts of climate change on the Pacific Northwest,
based on scientific findings and observed changes?
Some major parameters and processes in the Pacific Northwest affected by climate change are described below. Areas of consensus on these topics, based on scientific findings and observed changes, were gathered and synthesized from a variety of sources, including the U.S. Global Change Research Program Report (USGCRP 2001), papers in peer-reviewed scientific publications, and scientific presentations and breakout group summaries from the June 2004 Impacts of Climate Change in the Pacific Northwest meeting at OSU.
Temperature Scientists are very certain that the Pacific Northwest is warming. The USGCRP Report indicates that the annual average temperature has increased 1–3° F (0.6–1.7° C) over most of the region in the last century. Temperature change during this time is characterized by a steep rise from 1900 to 1940, a decline from 1940 to 1975, and a rise thereafter. Model simulations suggest that the earlier warming was largely due to natural causes, whereas the most recent warming is best explained by human-caused changes in greenhouse gases (Water Resources Breakout Group 2004). Since 1920, nearly every temperature monitoring station in the Pacific Northwest—both urban and rural—shows a warming trend (Mote 2003). Precipitation While there is little evidence of a consistent global warming signal for precipitation in the West since 1915, precipitation has increased modestly from 1916 to 1997 (Water Resources Breakout Group 2004). Since the beginning of the 20th century, the USGCRP Report indicates that annual precipitation has increased across the region by 10% on average, and the level of increase has reached 30–40% in eastern Washington and Northern Idaho. Sea Level During the period 1930–1995, land on the southern Oregon coast between Florence and Coos Bay has generally risen faster than worldwide changes in sea level by about 1 mm per year (Abbott 2004). However, the same data, which are based on geodetic leveling and tide-gauge records, indicate that land on the central and northern coast of Oregon (from Florence to Astoria) is being submerged by rising sea level at a rate of 1.5–2 mm per year.
Snowpack From 1950 to 2000, warming temperatures across the West have diminished snowpacks. During this period, most monitoring stations in the Pacific Northwest show a decline in April 1 snowpack (or “snow water equivalent”) (Miles 2004). In the Cascades, the cumulative downward trend in snow water equivalent is approximately 35%. Model simulations for the period 1950–1995 show that roughly half the reductions in the Cascades are due to warming trends, and half are due to downward trends in precipitation. Trends for the period 1916–1995 show smaller trends due to warming (a 20% decrease in 82 years) and little effect from precipitation (Water Resources Breakout Group 2004). Simulations of snow-water equivalent from 1916–1997 show that the timing of peak snow accumulation and 90% snowmelt have both moved toward earlier calendar dates across the West (Water Resources Breakout Group 2004; Miles 2004). In sensitive areas like the Cascade, for

Oregon Strategy for Greenhouse Gas Reductions – Appendix C | page C-5
example, the date of peak snowpack has shifted by as much as 40 days earlier in the year. These simulations are supported by studies of observed snowpack, along with observations of stream flow from 1950–2003 which show systematic reductions in April 1 snowpack and June flow, and increases in March flow, over much of the West (Water Resources Breakout Group 2004; Stewart et al. in review). Snowpack at low-to-mid elevations is the most sensitive to warming temperatures. Watersheds in the Cascades have shown significant losses of summer water availability due to warming over the last 55 years. The fraction of annual streamflow from May to September in the Cedar River watershed, for example, has declined by 30% in 55 years (Miles 2004). These observed changes in streamflow are not explained by trends in precipitation. Climate Variability at the Scale of Years to Decades The USGCRP Report indicates that the climate of the Pacific Northwest shows significant recurrent patterns of year-to-year variability. Warm years tend to be relatively dry with low streamflow and light snowpack, which lead to summer water shortages, less abundant salmon, and increased probability of forest fires. Conversely, cool years tend to be relatively wet with high streamflow and heavy snowpack. Scientists conclude with high certainty that variations in Pacific Northwest climate show clear correlations with the large-scale ocean-atmosphere patterns associated with the El Nino/Southern Oscillation (ENSO) on scales of a few years (interannual) (Abbott 2004). Because of uncertainty about underlying dynamics and lack of predictability about other large-scale ocean-atmosphere patterns, such as the Pacific Decadal Oscillation (PDO), understanding the effects of such patterns on climate variability in the Pacific Northwest is problematic at present. What are the projections for climate change and its impacts in the Pacific Northwest over
the next 10-50 years?
Temperature
There is intermediate certainty that average temperatures in the Pacific Northwest will continue to increase in response to global climate change. The slope of the trend over the last 20 years should continue in the next few decades. The USGCRP Pacific Northwest assessment predicts that there will be average warming over the region of approximately 2.7° F (1.5° C) by 2030 and 5.4° F (3° C) by the 2050s. This change translates into a 0.18 to 0.9° F (0.1–0.5° C) increase per decade. However, the rate of increase may be even higher in the eastern portion of the region. The exact magnitude and rate of increase are difficult to predict, particularly beyond 50 years. These projected temperature increases are highly likely to result in:
- An increase in elevation of the upper tree line, - Longer growing seasons, - Increased length of fire season, - Earlier breeding by animals and plants, - Longer and more intense allergy season, and - Possible changes in vegetation zones.

page C-6 | Oregon Strategy for Greenhouse Gas Reductions – Appendix C
Other changes, such as prevalence of insect infestations and expansion of woody vegetation, are less certain (Terrestrial Ecosystems Breakout Group 2004), in part because they are affected by additional factors such as precipitation and land use. Precipitation
Changes in precipitation regimes are generally acknowledged to be very uncertain in comparison with the temperature changes described above. Existing models are unable to make consistent projections of precipitation on regional scales. Recent IPCC global climate model scenarios have suggested the likelihood of modest increases in winter precipitation and decreases in summer precipitation for the Pacific Northwest. These effects are broadly consistent with the expected consequences of an intensified hydrologic cycle at the global level. Some current research, however, suggests that these scenarios could be wrong for the Pacific Northwest because other factors may influence the outcome. For example, systematic changes in global sea surface temperature patterns, or in other fundamental drivers of global atmospheric circulation, could create systematic changes in storm-track behavior (Water Resources Breakout Group 2004). Based on this hypothesis, the Pacific Northwest could conceivably become drier, despite an intensification of the hydrologic cycle on a global level. These alternate hypotheses underscore the current uncertainty even about the direction of trends (i.e., increasing or decreasing) in precipitation. Better understanding of the interactions among atmosphere, land, and ocean are critical to predicting changes to and patterns of precipitation. The challenge will be to resolve these scientific uncertainties before significant climate change impacts occur. Regarding specific projections, Oregon now experiences most of its precipitation during winter, with the greatest precipitation occurring in the mountains. The expectation is that this pattern will continue, and that the greatest precipitation (in the form of snow) will remain at high elevations. Changes in cool-season (i.e., October–March) climate are, therefore, likely to have the greatest effect on river flow and water resources. Due to relatively little precipitation in summer and an earlier summer streamflow recession associated with earlier snowmelt, intensified impacts on water resources likely will include:
- Increased summer water demand (because of population growth) coupled with decreased
water availability due to warmer temperatures, systematic reductions in summer streamflow, and limited reservoir storage.
- Changed ability to mitigate flood damage (which could result from increased
unpredictability associated with extreme weather events and streamflow forecasting) that may warrant reconsideration of current management schemes for storage reservoirs and flood protection to account for this altered flow regime.
- Increased winter flows (if precipitation remains the same or increases in winter) that
enhancement hydropower production in winter months and reductions in summer streamflow that diminish hydropower production in summer months may challenge the current approach to hydropower production in the Columbia River (Water Resources Breakout Group 2004).

Oregon Strategy for Greenhouse Gas Reductions – Appendix C | page C-7
- Decreased summer water availability and late-summer flows that may further decrease
the overall ability water of water regulators and users to meet instream flow targets using storage reservoirs, and intensify the conflict between winter hydropower production and summer water supply.
- Exacerbated water-quality issues, including increased water temperatures in lakes and
rivers, increased salinity and pollutant concentration (because water withdrawals decrease water quantity and concentrate pollutants in remaining water), lower dissolved oxygen content with increasing temperature, increases in certain pathogens that thrive at higher temperatures, and changes in the ecosystem and food web—all of which would stress fish including salmon.
Sea Level Sea level is very certain to continue to rise. The impacts of sea-level rise, however, will vary because of differences in tectonic processes throughout the Pacific Northwest. In some areas where tectonic processes exceed sea-level rise, land will rise faster than increased sea level. Where tectonic processes do not exceed sea-level rise, the region’s shoreline will move landward. Maximum wave heights also will likely increase. This increase in wave height, in association with sea-level rise, has the potential to increase erosion in coastal areas. Snowpack It is highly certain that the April 1 snowpack will continue to decline in response to increasing global greenhouse-gas emissions. This decline in snowpack will correspond with an earlier peak runoff of snowmelt, and increased streamflows earlier in the year (see above). Other effects of warmer temperatures on snowmelt hydrology have been well understood for decades, and the effects of global warming on Pacific Northwest rivers has been quantified in a number of published studies. In basins with significant snow accumulation in winter, warmer temperatures systematically reduce peak snow accumulation, producing more runoff in winter, earlier peak flows in spring, and reduced water availability in summer. Snowpack at high elevations is generally less sensitive to temperature changes and more sensitive to precipitation changes. Thus, at high elevations, snowpack could increase if winter precipitation increases over time. However, even if there is an increase in snowfall at high elevations, the area covered by high elevations is small relative to the area of an entire river basin and consequently the total snow pack in a river basin typically declines if temperatures rise (even if precipitation increases by a modest amount). Marine Ecosystems
It is very certain that ocean circulation will continue to change in response to ocean-atmospheric processes occurring at the scale of years to decades (see discussion of ENSO and PDO above). These changes in ocean circulation include the intensity and character of upwelling winds, as well as changes in freshwater input (Water Resources Breakout Group 2004). While the patterns of these variations and their impacts on marine ecosystems (e.g., persistent changes in ecosystem structure, directional changes in productivity, etc.) are unknown, paleological records and quantified physical dynamics help to shed light on potential projections. Paleo-records suggest

page C-8 | Oregon Strategy for Greenhouse Gas Reductions – Appendix C
that over long time scales, warm regimes are associated with strong upwelling. It also is known that a warmer continent results in stronger equator-ward winds that fuel upwelling. In combination, these two trends suggest a likely increase in the magnitude and duration of upwelling along the Pacific Northwest coast (Water Resources Breakout Group 2004). The emergence of a mass of hypoxic (low oxygen) water (a so-called “dead zone”) appearing off the central coast of Oregon in 2002 and 2004 may signal an unanticipated consequence of climate change mediated through changes in ocean circulation. Projections about climate change in the region also indicate the potential for:
- Influx of seawater into estuaries and lower reaches of rivers due to sea-level rise, - An earlier influx of freshwater into estuarine and coastal areas, - Greater seasonal variation, and - Increased stress on estuarine and nearshore species that are physiologically adapted to
particular patterns in physical characteristics of their habitats (e.g., salinity). Terrestrial Ecosystems
Changes in temperature and precipitation patterns are likely, but the manner in which these changes will affect the terrestrial ecosystems of the Pacific Northwest is poorly known. Likely impacts include shifts in species composition and timing of the growing season, but the details are unpredictable. For example, temperature changes and loss of snowpack are expected to affect forests, particularly those in southwest, central, and eastern Oregon that rely on snowpack for water. Given current biomass densities, the anticipated drier summers will increase drought stress and vulnerability of forests to insects and diseases, and may ultimately lead to widespread fires that may systematically alter the hydrologic response in river basins over time. What are the greatest areas of uncertainty affecting our ability to understand and predict
likely climate change in the Pacific Northwest?
Shifts in regional-scale climate forcing, such as precipitation and winds, are the fundamental processes that affect ecosystems. We have little certainty in the projections about these key processes for the Pacific Northwest, and their effects on outcomes such as extreme events (e.g., flooding and large fires). The next level of uncertainty is the response of marine and terrestrial ecosystems to changes in the patterns of variability as well as long-term trends. Lastly, shifts in management practices, urban development, and other human activities will be convolved with changes in the natural environment and will impact ecosystems. What are the most important questions to be answered in the next 5-10 years?
¶ What will be the trend and pattern of precipitation in the Pacific Northwest? ¶ What will be the patterns of coastal ocean winds and associated upwelling events? ¶ What are the dynamics of large, decadal-scale patterns of ocean/atmosphere interactions? ¶ Do thresholds exist for abrupt climate change and system shifts? ¶ How will the aforementioned patterns affect ecosystem patterns and resilience (including
the maintenance of processes and patterns in the face of variability)?

Oregon Strategy for Greenhouse Gas Reductions – Appendix C | page C-9
What are the priorities for future research?
The priorities should be based on answering the four questions listed above. To accomplish this, we need to invest in four areas of research.
1. Improved and sustained observations of critical processes that can resolve interannual/decadal-scale variability. These observing systems should be focused on both physical and biological variables, and should be of sufficient quality to resolve local, small-scale processes relative to climate signals.
2. Focused process experiments and studies of critical processes, such as the impacts of increased CO2 on forest dynamics and the impact of changes in the upwelling regime on coastal marine ecosystems and fisheries.
3. Improved numerical and statistical models focused on coupled atmosphere/ocean/land processes that include ecological as well as geophysical dynamics. Particular emphasis should be on developing regional-scale projections. Close interaction between modeling and analysis and the observing programs should be ensured.
4. Modeling and analysis of the effects of economic and management policies interannual/decadal-scale processes in the Pacific Northwest. This could include forest management, land use changes, fishery management, coastal zone management and water policy.

page C-10 | Oregon Strategy for Greenhouse Gas Reductions – Appendix C
Appendix A – Consensus Process and Participants
On June 15, 2004, a symposium entitled “Impacts of Climate Change on the Pacific Northwest” was held to provide invited Oregon and Washington-based scientists an opportunity to: 1) share knowledge concerning the present status of global climate change research and regional greenhouse gas emission reduction strategies, 2) share findings on scenarios for climate change and possible impacts in the Pacific Northwest, and 3) identify areas of consensus and uncertainty. Sixty-five people attended the meeting. Participants were primarily scientists working in a variety of fields related to climate change in the Pacific Northwest, such as oceanography, forest ecology, forest economics, agriculture and resource economics, hydrology, paleoclimatology, marine ecology, fisheries biology, estuarine ecology, population biology, geography, ornithology, climatology, and meteorology. Attendees also included a diversity of observers, such as members of the Advisory Group and agency staff providing technical support to the Advisory Group, media, and other individuals working on issues related to climate change policy. Pre-meeting questionnaires were distributed to participants. Four experts presented overview of scientific understanding in key areas. Responses to the pre-meeting questionnaires, the slideshow presentations, extended abstracts of the presentations, and summaries of four breakout group sessions (terrestrial ecosystems, marine ecosystems, water resources, and the Pacific Northwest as a system) are available as part of the meeting proceedings online at http://inr.oregonstate.edu/policy/climate-change.html. This Consensus Statement, drafted by a subcommittee of participants and circulated to other participants for review and sign-on, is also part of the proceedings. The statement is signed by 50 Ph.D.-level scientists with expertise on the impacts of climate change in the Pacific Northwest. Names of the signatories appear below.

Oregon Strategy for Greenhouse Gas Reductions – Appendix C | page C-11
Appendix C

page C-12 | Oregon Strategy for Greenhouse Gas Reductions – Appendix C
Appendix C

Oregon Strategy for Greenhouse Gas Reductions – Appendix C | page C-13
Appendix C
page C-14 | Oregon Strategy for Greenhouse Gas Reductions – Appendix C

Oregon Strategy for Greenhouse Gas Reductions – Appendix C | page C-15
Appendix B – Overview of Findings from the
Third Assessment Report of the Intergovernmental Panel on Climate Change
Climate Change 2001: (Excerpted from Climate Change 2001: Synthesis Report – Summary for Policymakers, an Assessment of the Intergovernmental Panel on Climate Change. This summary, approved in detail at IPCC Plenary XVIII (Wembley, United Kingdom, 24-29 September 2001), represents the formally agreed statement of the IPCC concerning key findings and uncertainties contained in the Working Group contributions to the Third Assessment Report.)

page C-16 | Oregon Strategy for Greenhouse Gas Reductions – Appendix C

Oregon Strategy for Greenhouse Gas Reductions – Appendix C | page C-17
Appendix C – References
Abbott, M. 2004. Impacts of Climate Change on the Coastal Ocean. Presentation at the June 14, 2004 Impacts of Climate Change on the Pacific Northwest Meeting, Oregon State University, Corvallis, Oregon. Available at http://inr.oregonstate.edu/policy/climate_abbott_files/frame.htm.
Fazio, J. et al. In review. Potential Impacts of Climate Change in the Pacific Northwest. Draft
assessment report to the Northwest Power and Conservation Council, Portland, Oregon. Intergovernmental Panel on Climate Change, Working Group I. 2001. Climate Change 2001:
Synthesis Report – Summary for Policymakers, an Assessment of the Intergovernmental Panel on Climate Change. Third Assessment Report. World Meteorological Organization, Geneva, Switzerland. 34 pp.
Marine Ecosystems Breakout Group. 2004. Summary of breakout group discussion at the June
14, 2004 Impacts of Climate Change on the Pacific Northwest Meeting, Oregon State University, Corvallis, Oregon. Available at http://inr.oregonstate.edu/policy/climate_marine_breakout_presentation_files/frame.htm.
Miles, E. 2004. Climate Change Impacts in the Pacific Northwest. Presentation at the June 14,
2004 Impacts of Climate Change on the Pacific Northwest Meeting, Oregon State University, Corvallis, Oregon. Available at http://inr.oregonstate.edu/policy/climate_miles_files/frame.htm.
Mote, P. W. 2003. Trends in temperature and precipitation in the Pacific Northwest during the
twentieth century. Northwest Science 77(4): 271-282. Stewart, I. T. et al. In review. Changes toward earlier streamflow timing across western North
America. Journal of Climate. Terrestrial Ecosystems Breakout Group. 2004. Summary of breakout group discussion at the
June 14, 2004 Impacts of Climate Change on the Pacific Northwest Meeting, Oregon State University, Corvallis, Oregon. Available at http://inr.oregonstate.edu/policy/climate_breakout_terrestrial.pdf.
U.S. Global Change Research Program, National Assessment Synthesis Team. 2001. Potential
Consequences of Climate Change Variability and Change for the Pacific Northwest. Chapter 9 in Climate Change Impacts on the United States: The Potential Consequences of Climate Variability and Change. Cambridge University Press, Cambridge, United Kingdom. 612 pp.
Water Resources Breakout Group. 2004. Summary of breakout group discussion at the June 14,
2004 Impacts of Climate Change on the Pacific Northwest Meeting, Oregon State University, Corvallis, Oregon. Available at http://inr.oregonstate.edu/policy/climate_breakout_water.pdf.

page C-18 | Oregon Strategy for Greenhouse Gas Reductions – Appendix C

Oregon Strategy for Greenhouse Gas Reductions – Appendix D | page D-1
Appendix D
Briefing Paper — Materials and Greenhouse GasesPrepared for the Governor’s Advisory Group on Global Warmingby David Allaway, Oregon Department of Environmental Quality (DEQ)
April 27, 2004
This paper provides background information for members of the Governor’s Advisory Group on Global
Warming. Topics covered include:
¶ An overview of materials and waste in Oregon, including key definitions.
¶ An introduction to materials-related greenhouse gas sources and sinks.
¶ The rationale for developing a supplemental accounting of materials-related greenhouse gases.
¶ An overview of this supplemental accounting.
¶ An introduction to the basic methods of reducing materials-related greenhouse gas emissions,
including waste reduction, energy recovery, and landfill controls.
The work of the Technical Subcommittee on Materials Use, Recovery and Disposal will be presented to
the Advisory Group in two parts.
1. At the Advisory Group’s May 12 meeting, the topics listed above will be summarized and time will
be available for discussion.
2. Results of the supplemental materials accounting and the evaluation of specific materials-related
measures (program and policy options) will be summarized at the Advisory Group’s June 13 meeting
for discussion at that time. Written materials will be forwarded in advance of that meeting.
Scope and Background: Materials and Waste in Oregon
The scope of the Technical Subcommittee on Materials Use, Recovery, and Disposal includes emissions
and offsets associated with the production, use, recycling, composting, incineration, and landfilling of
materials. The focus is on materials used by and discarded by Oregonians, as opposed to all materials
made in Oregon. These include the many different types of materials that Oregon households and
businesses discard for recycling, composting, or garbage collection.
The following types of materials are not addressed in this evaluation:
¶ Materials exported for use out of state. The in-state emissions associated with production and
transportation of these materials are addressed by the energy and transportation subcommittees.
¶ Materials used in Oregon that are disposed of in wastewater systems, such as food and tissues. Some
impacts from related wastewater processes (such as methane and nitrous oxide emissions from
wastewater treatment plants) are addressed by the Technical Subcommittee on Other Greenhouse
Gases.
¶ Materials managed as hazardous wastes and industrial and agricultural process wastes, such as slash
from timber operations and crushed rock from mining, and materials exempted from the statutory
definition of “counting” solid wastes, such as junked cars.
Once a material is no longer wanted by an Oregon household or business, it becomes a “waste”. Roughly
35 percent of wastes discarded in Oregon in 2002 were either recycled or composted. The remaining
wastes were either incinerated or sent to solid waste landfills. Most garbage in Oregon is landfilled, and
Oregon is also one of the West’s largest importers of garbage. In 2002, Oregon landfilled approximately

page D-2 | Oregon Strategy for Greenhouse Gas Reductions – Appendix D
2.6 million tons of municipal solid waste from inside Oregon and another 1.4 million tons from other
states, primarily Washington.
Some wastes, such as tires, dimensional lumber and used motor oil, are kept separated from mixed wastes
and are burned as fuels by industry. In addition, Oregon has two mixed waste incinerators. Marion
County’s incinerator recovers energy while Coos County’s does not. Approximately 12 percent of wastes
discarded in Oregon in 2002 were burned for energy.
In addition to these known quantities of waste, which DEQ counts annually, an unknown quantity of
waste is burned on-site or dumped in backyards or public lands.
A few notes regarding terminology: Disposal includes both disposal of waste at landfills and most
disposal at garbage incinerators. Waste recovery includes recycling and composting, and in certain
cases, thermal recovery of energy from waste. Waste generation is defined as the sum of disposal and
recovery. It is largely synonymous with what households and businesses discard. Waste prevention
means making less waste in the first place, such as more efficient use of materials. Waste prevention and
reuse differ from recycling. In reuse, materials are used again in their original form, without the
repulping, melting, grinding, or other mechanical or chemical reformulation associated with recycling.
Finally, the term waste reduction incorporates all activities that reduce disposal, including waste
prevention, reuse, recycling, and composting.
Per-capita waste generation (discards), as counted by DEQ, has risen more than 30 percent between 1992
and 2002. DEQ is currently evaluating this trend in an attempt to determine its causes. Some of the
increase is explained by better reporting. Shifts in waste from on-site management such as backyard
burning (which isn’t counted in generation) to the system of recycling, composting and disposal (which
are counted) also explain some of the rise in per-capita generation. Increases not attributed to better
reporting and waste shifting are most likely attributable to increasing use, recovery, and disposal of
resources.
Oregon statute includes a waste management hierarchy, which states that the preferred order for
managing wastes are prevention, followed by reuse, followed by recycling, then composting, then energy
recovery, and finally landfilling as the least preferred option. Also contained in law are waste generation
goals and waste recovery goals, as follows:
¶ In 2005 and subsequent years, no increase in per-capita waste generation.
¶ In 2005, a waste recovery goal of 45 percent.
¶ In 2009 and subsequent years, no increase in total waste generation.
¶ In 2009, a waste recovery goal of 50 percent.
The state’s waste recovery rate includes recycling and composting, as well as some energy recovery, and
some adjustments for reuse and home composting. In 2002, the state’s recovery rate was 46.6 percent.
DEQ is concerned that the rate for 2003, which is currently being calculated, will fall as energy recovery
from wood waste declined due to poor market conditions.
Materials-Related Greenhouse Gas Sources and Sinks
Greenhouse gas emissions and reductions associated with the production, recovery and disposal of
materials and wastes are numerous and complex. In the United States, the U.S. Environmental Protection
Agency’s (EPA’s) Office of Solid Waste and Emergency Response (OSWER) has funded and published
some of the most comprehensive and definitive research on these topics.

Oregon Strategy for Greenhouse Gas Reductions – Appendix D | page D-3
The categories of emissions (sources) and offsets (reductions and sinks) recognized by OSWER include
the following:
1. Fossil fuel-derived energy in manufacturing and natural resource extraction. This includes direct
combustion of fossil fuels (for example, natural-gas fired boilers at paper mills) and the use of fossil
fuels to generate electricity used by industry.
2. Non-energy emissions from industrial processes, such as carbon dioxide (CO2) emissions from
converting limestone to lime (used in the production of steel and aluminum) and methane emissions
from natural gas processing associated with the manufacture of plastic products.
3. Transportation-related emissions including transporting raw materials to industry, manufactured
products to customers, and discards to recovery and waste disposal facilities.
4. Carbon storage in wood products and indirect carbon storage in forests (related to changes in
demand for timber as a result of recycling and reducing use of paper and wood). Increasing use of
wood products increases the amount of carbon stored in products, while decreasing demand for
timber is projected to indirectly increase carbon storage in forests.
5. Carbon storage in agricultural soils amended with composted wood, yard debris, and/or food
waste. Soils that have been depleted of carbon have the potential to store carbon if treated with
finished compost. (CO2 from the decomposition or combustion of plant-based wastes is typically
considered part of the natural carbon cycle and is not counted in most greenhouse gas inventories.)
6. Methane emissions from landfills. In the oxygen-poor landfill environment, a portion of carbon in
waste is converted to methane. Many large landfills capture a portion of this methane and convert the
carbon back to CO2 through combustion.
7. Carbon storage in landfills. Slow-to-degrade materials, such as wood, may increase carbon
sequestration if disposed of in landfills, thus offsetting methane emissions.
8. Emissions from incineration of wastes. These include nitrous oxide as well as CO2 from the
combustion of fossil carbon-derived materials such as tires, plastics, and synthetic textiles.
9. Offsets from reductions in fossil fuel use resulting from energy recovery of incinerated wastes or
methane collected at landfills. Incinerators that recover energy from waste, and landfills that
recovery energy from methane, offset the combustion of other fossil fuels elsewhere.
For any given material, several of these types of emissions and reductions or sinks may be relevant. For
example, when comparing the recycling vs. disposal of paper, relevant categories of emissions include
industrial energy for production of virgin and post-consumer paper, transportation, carbon storage in
forests, methane emissions from landfills, carbon storage in landfills, and fossil fuel offsets from landfill
gas energy recovery.
The relative importance of each of these types of emissions also varies widely between materials. For
example, grass clippings, when landfilled, can produce significant quantities of methane, a potent
greenhouse gas. In contrast, plastics and glass are relatively inert in landfills and generate little or no
methane. For glass and plastic, their greenhouse gas profiles are dominated by manufacturing and
transportation. Lawn prunings, on the other hand, are not manufactured and thus have no manufacturing-
related greenhouse gas impacts.
One further complication is that some emission and reduction effects occur immediately, while others are
delayed and extended over multiple years. For example, when material is disposed in a dry landfill, it
may slowly generate methane for 100 – 150 years, or more. Depending on the accounting system used,
landfill-related benefits of waste reduction may be assigned either to the year in which the waste
reduction occurs, or in small increments in each of the years in which resulting methane emissions are
reduced. The latter approach is used in this project. Landfill emissions in the year 2015, for example, are
modeled as actual emissions in that year from waste disposed of in all previous years. Emission

page D-4 | Oregon Strategy for Greenhouse Gas Reductions – Appendix D
reductions associated with carbon storage benefits at landfills, compost-amended soils, and forests
(indirect) are also treated as occurring over multiple years. Advisory Group members should be aware
that for some program and policy measures, actual emission reductions, over time, will be greater than
what is estimated for the years 2015 and 2025.
Limitations of EPA’s State Inventory Tool and Oregon’s Inventory – The Need for a Supplemental
Accounting of Materials-Related Greenhouse Gases
The EPA’s State Inventory Tool provides a framework for inventorying a state’s greenhouse gases.
Oregon has chosen to use the State Inventory Tool (SIT) in support of the Advisory Group’s work, with
one major modification. Whereas the SIT assigns emissions from combustion of fossil fuels for
electricity generation to the state where the electricity is generated, Oregon is choosing to assign these
emissions to the state where the electricity is used. Thus, Oregon is assigned the emissions associated
with the electricity we use, as opposed to the emissions from the electricity we produce. In other words,
greenhouse gases associated with electricity generation are assigned to the state that is home to the user of
the electricity, regardless of whether the electricity is generated in or out of state.
In contrast, state greenhouse gases associated with materials production are assigned not to the user of the
material but rather the producer.
A consequence of this approach is that energy conservation and materials conservation are treated
inconsistently. If Oregon is successful at reducing electricity use or shifting electricity purchases to non-
fossil sources, Oregon will be assigned 100 percent of the reduction in emissions under the state’s
inventory. But if Oregon is successful at reducing waste, then reductions in upstream (manufacturing)
emissions, which are often significant, will be assigned to the state where the material is produced (or
where recycled wastes displace virgin feedstocks). Since many materials used in Oregon are not
manufactured here, only a fraction of the benefit of waste reduction would be assigned to Oregon.
Other challenges with the SIT and Oregon’s inventory framework include the following:
¶ Because resource extraction and manufacturing impacts are assigned entirely to the state (or nation)
where the resource extraction and manufacturing occurs, out-of-state (or nation) consumers are
assigned none of these impacts. All responsibility is assigned to the producer; none is shared with the
consumer.
¶ Materials manufactured in state X, and shipped (by truck) through Oregon on their way to state Y for
sale, cause Oregon to be assigned a portion of transportation impacts, even though Oregon neither
produces nor uses the materials.
¶ Under both the SIT and Oregon’s inventory, the shifting of production from Oregon to another state
or country would be counted as an emissions reduction, even if global consumption and associated
CO2 emissions were unchanged. Conversely, if Oregon households and businesses shift consumption
to locally-produced materials, a likely outcome of Oregon’s inventory is that Oregon’s greenhouse
gas profile would appear to rise, even as global emissions probably fall (all other things being equal).
These issues are illustrated graphically in Figure 1.

Oregon Strategy for Greenhouse Gas Reductions – Appendix D | page D-5
Figure 1.
Oregon’s Greenhouse Gas Inventory - How it Accounts for
Material Production and Consumption
Emissions from generating electricity are assigned to the state that uses the electricity but emissions related to producing materials are assigned to the state where the materials are made.
Oregon is assigned 100% of the greenhouse gas reduction from electricity conservation, but only a fraction of the reduction from waste reduction.
Oregon is assigned all emissions related to in-state manufacturing (including out-of-state electricity generation), even for products that are made for use in other states.
Oregon is assigned transportation impacts for materials that merely pass through Oregon in transit from producers in one state to consumers in another.
Oregon's emissions decrease when industrial production shifts from Oregon to other countries. Our emissions increase when we support local companies by purchasing products made in Oregon.
Draft (April 27, 2004) Page 5
Appendix D
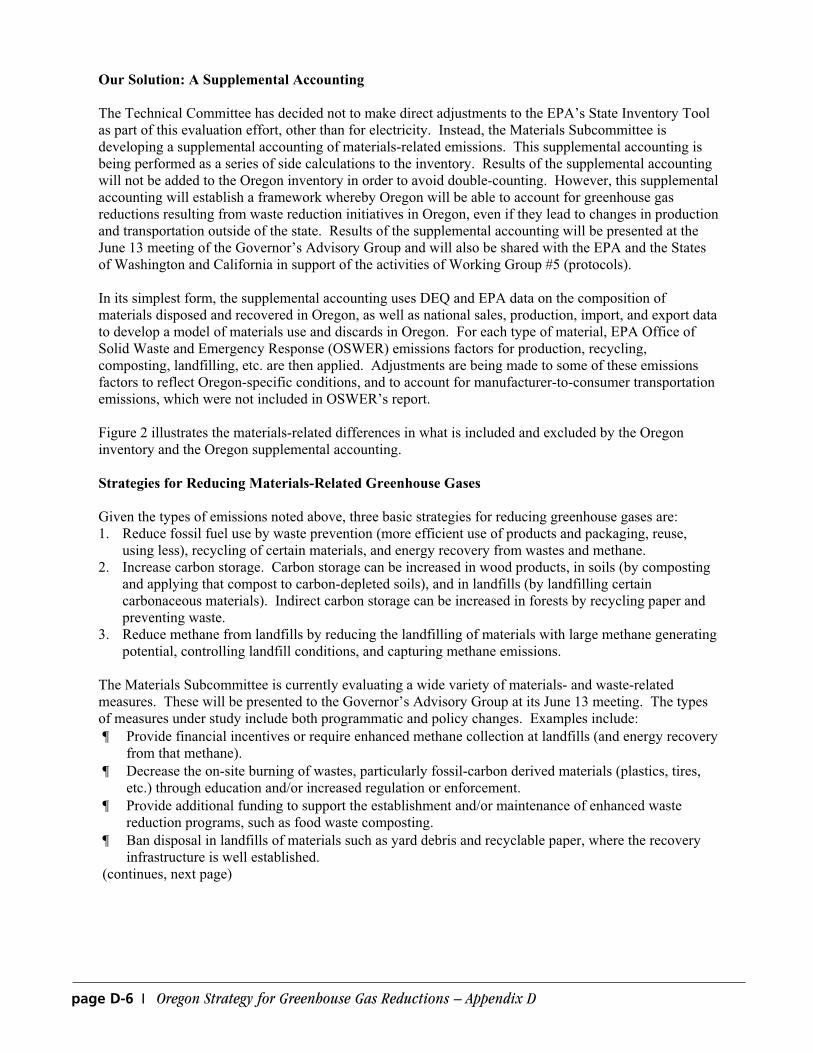
page D-6 | Oregon Strategy for Greenhouse Gas Reductions – Appendix D
Our Solution: A Supplemental Accounting
The Technical Committee has decided not to make direct adjustments to the EPA’s State Inventory Tool
as part of this evaluation effort, other than for electricity. Instead, the Materials Subcommittee is
developing a supplemental accounting of materials-related emissions. This supplemental accounting is
being performed as a series of side calculations to the inventory. Results of the supplemental accounting
will not be added to the Oregon inventory in order to avoid double-counting. However, this supplemental
accounting will establish a framework whereby Oregon will be able to account for greenhouse gas
reductions resulting from waste reduction initiatives in Oregon, even if they lead to changes in production
and transportation outside of the state. Results of the supplemental accounting will be presented at the
June 13 meeting of the Governor’s Advisory Group and will also be shared with the EPA and the States
of Washington and California in support of the activities of Working Group #5 (protocols).
In its simplest form, the supplemental accounting uses DEQ and EPA data on the composition of
materials disposed and recovered in Oregon, as well as national sales, production, import, and export data
to develop a model of materials use and discards in Oregon. For each type of material, EPA Office of
Solid Waste and Emergency Response (OSWER) emissions factors for production, recycling,
composting, landfilling, etc. are then applied. Adjustments are being made to some of these emissions
factors to reflect Oregon-specific conditions, and to account for manufacturer-to-consumer transportation
emissions, which were not included in OSWER’s report.
Figure 2 illustrates the materials-related differences in what is included and excluded by the Oregon
inventory and the Oregon supplemental accounting.
Strategies for Reducing Materials-Related Greenhouse Gases
Given the types of emissions noted above, three basic strategies for reducing greenhouse gases are:
1. Reduce fossil fuel use by waste prevention (more efficient use of products and packaging, reuse,
using less), recycling of certain materials, and energy recovery from wastes and methane.
2. Increase carbon storage. Carbon storage can be increased in wood products, in soils (by composting
and applying that compost to carbon-depleted soils), and in landfills (by landfilling certain
carbonaceous materials). Indirect carbon storage can be increased in forests by recycling paper and
preventing waste.
3. Reduce methane from landfills by reducing the landfilling of materials with large methane generating
potential, controlling landfill conditions, and capturing methane emissions.
The Materials Subcommittee is currently evaluating a wide variety of materials- and waste-related
measures. These will be presented to the Governor’s Advisory Group at its June 13 meeting. The types
of measures under study include both programmatic and policy changes. Examples include:
¶ Provide financial incentives or require enhanced methane collection at landfills (and energy recovery
from that methane).
¶ Decrease the on-site burning of wastes, particularly fossil-carbon derived materials (plastics, tires,
etc.) through education and/or increased regulation or enforcement.
¶ Provide additional funding to support the establishment and/or maintenance of enhanced waste
reduction programs, such as food waste composting.
¶ Ban disposal in landfills of materials such as yard debris and recyclable paper, where the recovery
infrastructure is well established.
(continues, next page)

Oregon Strategy for Greenhouse Gas Reductions – Appendix D | page D-7
Figure 2.
Comparison of Oregon’s Inventory and Materials-Related Supplemental Accounting
Type of Emissions Oregon Inventory
(SIT with adjustment
for electricity
generation)
Oregon
Supplemental
Accounting
(materials-related)
Raw Materials Extraction, Product Manufacturing,
and Transport of Products to Consumer
Products made in Oregon
and used/discarded in Oregon Includeda Included
and used/discarded elsewhere Includeda Excluded
Products made outside Oregon
and used/discarded in Oregon Excluded Included
and used/discarded elsewhere Excluded Excluded
Municipal Solid Waste Disposal in Oregon (methane
emissions)
Waste generated in Oregon Included Included
Waste generated elsewhere and imported to Oregon Includedb Includedb
Waste Combustion in Oregon Included Included
Carbon Sequestration
In landfills: yard debris Included Included
In landfills: other wastes Excluded Included
In compost Excluded Included
In wood products (in use) Excluded Included
In forests (indirect, resulting from waste reduction) Excluded Included aAccounted for in non-waste modules (electricity use, industrial energy use, transportation fuel use). bOnly landfill-related methane emissions are counted for imported waste.
¶ Require loads of mixed waste to be sorted prior to disposal in high-population counties.
¶ Expand the bottle bill to cover more materials and/or increase the deposit value to reverse the decline
in redemption rates.
¶ Encourage the more efficient use of materials (waste prevention) through education and incentives.
Advisory Group members with questions regarding the work of the Technical Subcommittee on
Materials Use, Recovery and Disposal are welcome to contact the Subcommittee Chair directly at the
following:
David Allaway, Oregon DEQ
(503) 229-5479

page D-8 | Oregon Strategy for Greenhouse Gas Reductions – Appendix D

Oregon Strategy for Greenhouse Gas Reductions – Appendix E | page E-1
Appendix E
West Coast Governors’ Global Warming Initiative
Staff Recommendations to the Governors1
November, 2004
Executive Summary Global warming will have serious adverse consequences on the economy, health and environment of the West Coast states. These impacts will grow significantly in coming years if we do nothing to reduce greenhouse gas pollution. Fortunately, addressing global warming carries substantial economic benefits. The West Coast region is rich in renewable energy resources and advanced energy-efficient technologies. We can capitalize on these strengths and invest in the clean energy resources of our region. Recognizing these facts, the Governors of California, Oregon, and Washington launched the West Coast Governors’ Global Warming Initiative in September 2003. They committed the states to acting “individually and regionally to reduce greenhouse gas emissions” through strategies that “provide long-term sustainability for the environment, protect public health, consider social equity, and expand public awareness.” They directed their staffs to develop joint policy recommendations focused on, among other things, ways the West Coast states can:
• Use the states’ combined purchasing power to obtain fuel-efficient vehicles
and low-rolling resistance tires for motor pool fleets. • Reduce emissions from diesel fuel in transportation through reductions in the
use of diesel in ships and trucks. • Remove barriers to and encourage the development of renewable electricity
generation resources and technologies. • Improve efficiency standards with the potential to reduce greenhouse gas
emissions. • Develop consistent and coordinated greenhouse gas emission inventories and
reporting protocols and collaborate on scientific tools to measure the impact of climate change.
1 This report was prepared by the Executive Committee of the West Coast Governors’ Global Warming
Initiative, comprised of Carol Jolly and Ron Shultz from Washington; David Van’t Hof and Stephen
Schneider from Oregon; and Bob Therkelsen and Anne Baker from California.
West Coast Governors’ Global Warming InitiativeStaff Recommendations to the Governors1
November, 2004

page E-2 | Oregon Strategy for Greenhouse Gas Reductions – Appendix E
This initiative was well-received by the public and the media around the world. It is widely considered one of the top two or three state initiatives on climate change in the United States. (See Appendix A for selected press clippings.) Workgroups with representatives from the three states were created to address each of the five areas. An additional sixth group on hydrogen was created later. Draft recommendations from the original five groups were made available for public review and comment in April 2004. The final list of recommendations includes, among other things:
1. Set new targets for improvement in performance in average annual state fleet greenhouse gas emissions.
2. Collaborate on the purchase of hybrid vehicles. 3. Establish a plan for the deployment of electrification technologies at truck stops in
each state on the I-5 corridor, on the outskirts of major urban areas, and on other major interstate routes.
4. Set goals and implement strategies and incentives to increase retail energy sales from renewable resources by one percent or more annually in each state through 2015.
5. Adopt energy efficiency standards for eight to 14 products not regulated by the federal government, establishing a cost-effective efficiency threshold for all products sold on the West Coast.
6. Incorporate aggressive energy efficiency measures into updates of state building energy codes, with a goal of achieving at least 15 percent cumulative savings by 2015 in each state.
7. Organize a West Coast Governors’ conference in 2005 to inform policy-makers and the public of climate change research concerning the West Coast states.
The Executive Committee recommends that the three Governors direct the staffs of their states to implement the recommendations in this report. It also is clear that significant policies beyond the workgroup recommendations will be needed to meet the Governors’ goal of reducing the states’ greenhouse gas emissions below current levels. In addition to working together on the workgroup topic areas, each state has created its own stakeholder process to develop a more comprehensive list of recommendations for state-based climate protection strategies. These processes are in different stages in each state, and many significant new policies and measures are under consideration. Going forward, activities under this regional initiative should be coordinated with what emerges from those stakeholder groups. The Governors should give careful consideration to four actions under consideration in one or more of the stakeholder processes that offer the most promise for achieving greenhouse gas emission reductions:

Oregon Strategy for Greenhouse Gas Reductions – Appendix E | page E-3
• Adopting comprehensive state and regional goals for greenhouse gas emissions reductions;
• Adopting standards to reduce greenhouse gas emissions from vehicles; • Developing a regional market-based carbon allowance program; and, • Expanding the markets for efficiency, renewable energy, and alternative fuels.
The Executive Committee recommends that the Governors continue the efforts of this West Coast Initiative over the coming year and direct the Initiative to focus its efforts on assessing the feasibility of regional greenhouse gas emission reduction strategies that arise out of the state stakeholder processes, with particular emphasis on those listed above. We are confident that by working together, the West Coast States can take a global leadership position in reducing greenhouse gas emissions and combating global warming—while setting the stage for strong, long-term economic growth.

page E-4 | Oregon Strategy for Greenhouse Gas Reductions – Appendix E

Oregon Strategy for Greenhouse Gas Reductions – Appendix F | page F-1
Appendix F
Glossary of Energy and Global Warming TermsAverage Megawatt (aMW)—An average megawatt is 8,760 megawatt hours. This is thecontinuous output of a resource with one megawatt of capacity over a full year. One aMWprovides enough electric energy for about 730 Oregon homes for one year.
Biofuels—Alcohols, ethers, esters, and other chemicals made from raw biological material suchas herbaceous and woody plants, agricultural and forestry residues, and a large portion ofmunicipal solid and industrial waste.
Biological Sequestration—The fixation of atmospheric carbon dioxide in a carbon sink throughphysical or biological processes, such as photosynthesis. Also called bio-sequestration or carbonsequestration.
Biomass—Organic waste that is considered a renewable energy source. It includes organic wastefrom agricultural, livestock and lumber industry products, dead trees, and foliage, etc. Biomasscan be used as fuel and is most often burned to create steam that powers steam turbinegenerators. It also is used to make transportation fuels like ethanol and biodiesel.
Btu—British thermal unit; the amount of heat required to raise the temperature of one pound ofwater one degree Fahrenheit under stated conditions of pressure and temperature (equal to 252calories, 778 foot-pounds, 1,005 joules and 0.293 watthours). It is the U.S. customary unit ofmeasuring the quality of heat, such as the heat content of fuel.
Carbon Dioxide Offset—A mechanism by which the impact of emitting a ton of CO2 can be
negated or diminished by avoiding the release of a ton elsewhere or by absorbing a ton of CO2
from the air that otherwise would have remained in the atmosphere.
Carbon Sequestration—See Biological Sequestration.
Carbon Sink—A reservoir that absorbs or takes up released carbon from another part of thecarbon cycle. Vegetation and soils are common carbon sinks.
CH4—Methane, a greenhouse gas.
CHP—Combined Heat and Power. See Cogeneration.
CO—Carbon Monoxide, a pollutant regulated by the federal Clean Air Act.
CO2—Carbon Dioxide, a greenhouse gas.
Cogeneration—Also called combined heat and power. The generation of electrical and thermalenergy where both forms of energy are put to productive use. The addition of cogenerationcapability to generating facilities and industries that produce large amounts of heat energy helpsensure that waste heat (usually in the form of hot water or steam) is used efficiently for heating,industrial use, agriculture or conversion into electricity.

page F-2 | Oregon Strategy for Greenhouse Gas Reductions – Appendix F
Cooperative Electric Association or Utility—Utility owned and operated by its members.
Consumer-Owned Utilities (COUs) —A term that includes municipal electric utilities, people’sutility districts (PUDs) and rural electric cooperatives.
Demand—The rate at which electric energy is delivered to or by a system or part of a system,generally expressed in kilowatts (kW), megawatts (MW), or gigawatts (GW) at a given instant.
Distillate Fuel Oil—Light fuel oils distilled during the refining process and used primarily forspace heating, on-and-off highway diesel engine fuel (including railroad engine fuel and fuel foragricultural machinery), and electric power generation.
Distribution—The delivery of electricity to the retail customer’s home or business through lowvoltage distribution lines.
DOE—U.S. Department of Energy. Also called USDOE. See Oregon Department of Energy (ODOE).
Electric Energy—The generation or use of electric power by a device over a period of time,expressed in kilowatt-hours (kWh), megawatt-hours (MWh), or gigawatt-hours (GWh).
Energy Conservation—Using less energy, either by greater energy efficiency or by decreasing thetypes of applications requiring electricity or natural gas to operate.
Energy Efficiency—Using less energy (electricity and/or natural gas) to perform the same function atthe same level of quality. Programs designed to use energy more efficiently (doing the same with less).
EPA—U.S. Environmental Protection Agency.
Fossil Fuels—Sources of carbon-based energy from the earth, primarily crude oil, natural gas and coal.
Fuel Switching—The substitution of one type of fuel for another, either temporary or permanent.Permanent might include someone who replaces an electric water heater with a gas-fired water heater.
Geothermal Energy—The energy from the internal heat of the earth; it may be residual heat,friction heat, or a result of radioactive decay. The heat is found in rocks and fluids at variousdepths and can be extracted by drilling or pumping.
Green Tags—Certificates or tags created when a renewable energy facility generates electricity.Each green tag represents all of the environmental attributes or benefits of a specific quantity ofrenewable generation. Those include the benefits that everyone receives when conventional fuels,such as coal, oil or gas are displaced.
Greenhouse Effect—This effect is the result of the mixture of gases in the atmosphere thatsurrounds the earth. This mixture traps, as heat, some of the solar energy that enters theatmosphere, maintaining a temperature range within certain limits that sustains life on the planetas we know it. Without this natural effect, scientists estimate that temperatures would be over 50degrees F. cooler, too cold to be habitable. Conversely, too thick a mixture, or “blanket,” of thesegreenhouse gases can overheat the surface of the earth and affect habitability.
Greenhouse Gases (GHGs)—Molecules in the atmosphere that affect the radiative properties ofthe atmosphere and thereby the global climate. GHGs include water vapor, carbon dioxide,tropospheric ozone, nitrous oxide, methane, and numerous types of halons, such aschlorofluorocarbons (CFCs), hydrofluorocarbos (HFCs), hydroclorofluorcarbons (HCFCs),perfluorocarbons (PFCs) and sulfur hexafluroride (SF
6).

Oregon Strategy for Greenhouse Gas Reductions – Appendix F | page F-3
Grid—A system of interconnected power lines and generators that is managed so that powerfrom generators is dispatched as needed to meet the requirements of the customers connected tothe grid at various points.
Intelligent Transportation Systems (ITS)—To make travel through and around areas safer and moreefficient, ITS uses electronics, computers and communications equipment to collect information,process it, and take appropriate actions. ITS technologies can monitor traffic, manage traffic flow,provide alternate routes to travelers, manage incidents and provide other beneficial uses.
Investor Owned Utility (IOU)—Common term for a privately owned (shareholder owned) gas orelectric utility regulated by the Oregon Public Utility Commission.
Kilowatt (kW)—A measure of power delivered (rate of energy flow). It is used to measure thepeak use for commercial or industrial utility customers, generally billed on the customer’s peakmonthly demand.
Kilowatt-hour (kWh)—This is a measure of electric energy consumption over a specified timeperiod (cumulative energy flow), typically a one-month period for billing purposes. Customersare charged a rate per kWh of electricity used.
Liquefied Natural Gas (LNG)—Natural gas (primarily methane) that has been liquefied byreducing its temperature to minus 260 degrees Fahrenheit at atmospheric pressure.
Load—Amount of power that must be generated at power plants to serve customer electric demands.It must account for the amount of power that customers use and the amount lost in the transmissionand distribution system. The amount generated is measured in kilowatts (kW) or megawatts (MW).
Load-based Greenhouse Gas Allowance Standard—A limitation placed on the greenhouse gasemissions associated with the energy deliverer (e.g., usually by an electric or gas utility, butpotentially any large emitter of greenhouse gases). The standard governs the amount of carbondioxide (or all greenhouse gases) that can be released in connection with an amount of energygenerated to serve customer loads (a residence, business or institution that uses energy).
Methane—CH4. A greenhouse gas formed from decaying organic matter, including animal waste.
It is the primary component of natural gas.
Municipal Utility—Electric utility owned and operated by a city or chartered by a city.
Megawatt (MW)—A megawatt equals 1,000 kilowatts or 1 million watts.
Megawatt-hour (MWh)—A megawatt-hour; the unit of energy equal to that expended in onehour at a rate of one million watts. One MWh equals 3,414,000 Btu.
N2O—Nitrous Oxide, a greenhouse gas.
NOx—Nitrogen Oxides, pollutants regulated by the federal Clean Air Act.
Northwest Power and Conservation Council (NPCC)— Through the Northwest Power Act of 1980,the U.S. Congress authorized Idaho, Montana, Washington and Oregon to create, as an interstatecompact, the Pacific Northwest Electric Power and Conservation Planning Council (now known asthe Northwest Power and Conservation Council). The Council is a planning and policy-making body thatdevelops and maintains a regional power plan and a fish and wildlife program to balance the Northwest’senvironment and energy needs. The Governors of the Northwest states appoint Council members.

page F-4 | Oregon Strategy for Greenhouse Gas Reductions – Appendix F
Offset—See Carbon Dioxide Offset.
Oregon Department of Energy (ODOE)—State agency created in 1975 to ensure Oregon has anadequate supply of reliable and affordable energy and is safe from nuclear contamination. Theagency helps Oregonians save energy, develop clean energy resources, promote renewable energyand clean up nuclear waste. Formerly called the Oregon Office of Energy.
Oregon Public Utility Commission (OPUC or PUC)—The OPUC regulates customer rates and services ofthe state’s investor-owned electric, natural gas and telephone utilities. The Commission does notregulate people’s utility districts, cooperatives or municipal utilities except in matters of safety.
PV—Photovoltaic or solar electricity.
Peak Load or Peak Demand—The electric load that corresponds to a maximum level of electricdemand within a specified time, usually a year.
People’s Utility District—A body of local government that provides utility services, generallyelectricity and water, in a specified community area.
Public Purpose Charge—Portland General Electric and PacifiCorp must collect fees from consumerswithin their service areas that are equal to 3 percent of gross revenue as part of Oregon Senate Bill1149 (1999). This money funds energy conservation, renewable energy, and weatherization andenergy assistance to low-income households and public schools in their service territories.
Reliability—Electric system reliability has two components—adequacy and security. Adequacy isthe ability of the electric system to supply the aggregate electric demand and energy requirementsof the customers at all times, taking into account scheduled and unscheduled outages of systemfacilities. Security is the ability of the electric system to withstand sudden disturbances such aselectric short circuits or unanticipated loss of system facilities. Reliability also refers to thesecurity and availability of natural gas and petroleum supply, transportation and delivery.
Renewable Resources—Renewable energy resources are naturally replenished, but flow-limited.They are virtually inexhaustible in duration, but limited in the amount of energy that is availableper unit of time. Some (such as geothermal and biomass) may be stock-limited in that stocks aredepleted by use, but on a time scale of decades, or perhaps centuries, they can probably bereplenished. Renewable energy resources include biomass, hydro, geothermal, direct solar andphotovolatics, and wind. In the future they could also include the use of ocean thermal, wave,and tidal action technologies.
Telecommute (or Telework)—A program allowing an employee to work part-or full-time in alocation other than the employer’s main office. The program conserves fuel, relieves trafficcongestion and improves air quality. The alternate location is often the teleworker’s home.
Transmission—Transporting bulk power over long distances.
Utility—A regulated or public entity that exhibits the characteristics of a natural monopoly. Inthe electric industry, “utility” generally refers to a regulated, vertically integrated monopolyelectric company or public body that delivers electricity. “Transmission utility” refers to theregulated owner/operator of the transmission system.
Watt—The unit of measure for electric power or rate of doing work. The rate of energy transferequivalent to one ampere flowing under pressure of one volt.

Oregon Strategy for Greenhouse Gas Reductions – Appendix F | page F-5
