oregon school report ard · an example of calculating ratings: high school ... the basis for the...
TRANSCRIPT

OREGON SCHOOL REPORT CARD
2005-2006 TECHNICAL BULLETIN
Rating System and Formulas
REPORT CARD ISSUE DATE: OCTOBER 2006
March 2006
Oregon Department of Education
255 Capitol Street NE Salem, Oregon 97310
(503) 378-3600 ext. 2287 [email protected]
http://www.ode.state.or.us/search/results/?id=273

Table of Contents
Technical Bulletin
I. Preface ...................................................................................................1 II. Introduction ...........................................................................................2
III. Calculating the School Characteristics Rating................................... 3
IV. Calculating the Student Performance Rating ..................................... 6
V. Calculating the Student Behavior Rating.......................................... 11
VI. Calculating the Improvement Rating................................................. 14
VII. Calculating the Overall Rating........................................................... 16
Method I: Rating Scores ....................................................................... 16
Method II: Matrix................................................................................... 17
VIII. An Example of Calculating Ratings: Elementary/Middle School .... 21 Calculating the Student Performance Assessment Index Score ........... 21 Calculating the Student Behavior Index Score...................................... 24 Calculating the Improvement Index Score ............................................ 25 Calculating the School Characteristics Index Score.............................. 29 Calculating the Overall Rating............................................................... 30
IX. An Example of Calculating Ratings: High School ........................... 31 Calculating the Student Performance Index Score................................ 31 Calculating the Student Behavior Index Score...................................... 35
• Attendance Index Score................................................................ 35
• Dropout Index Score ..................................................................... 36
Calculating the Improvement Index Score ............................................ 37 Calculating the School Characteristics Index Score.............................. 37 Calculating the Overall Rating............................................................... 37
X. Resources and Background Material................................................ 44

Page 1
I. Preface
The Technical Bulletin provides detailed information about how the ratings will be calculated for the 2005-2006 Oregon School Report Cards to be released in October 2006. A companion Policy Manual provides background information about the report cards. School report cards were first issued in January 2000 with the rating formulas and rules remaining largely unchanged during the first three years. Extensive revisions in the formula were reflected in the report cards released in January 2003. Additional changes in displays were incorporated for January 2004 to bring the report card into compliance with requirements of the No Child Left Behind Act. The Overall rating combines four components: Student Performance, Student Behavior, Improvement, and School Characteristics. This document describes in detail each of these component ratings. Examples of schools are provided in this document to help readers understand how ratings are calculated for elementary/middle schools and high schools. Oregon Law Oregon law (ORS 329.105) requires that the Oregon Department of Education issue performance reports for public schools. These performance reports shall include school ratings for Overall School Performance, Student Performance, Student Behavior, and School Characteristics. Schools shall be rated as Exceptional, Strong, Satisfactory, Low, and Unacceptable. In December 1999, the State Board of Education passed administrative rule OAR 581-022-1060 that established these criteria as the basis for the Oregon school report card ratings. Senate Bill 811 passed in July 2001 requires specific data elements to be displayed on school and district report cards. The No Child Left Behind Act of 2001 mandates additional data elements and displays for school and district report cards produced by states. The State Superintendent and the Oregon Department of Education are charged with establishing the specific means for calculating the ratings and reporting the results. Working with a national consultant and stakeholders throughout the state, the Department has produced the specific formulas, definitions, and procedures for the school report cards. The school and district report cards have continued to display but not rate other information in addition to the requirements.

Page 2
Rating System and Formulas 2005–2006 Oregon School Report Card
II. Introduction
This document describes the rating system for the 2005-2006 School and District Report Cards to be issued in October 2006. It also provides detailed information about the specific formulas and definitions and examples of how the ratings will be calculated. The Technical Bulletin describes in detail the following four major topics:
• Formula changes for the 2005-2006 Report Card • How the Overall rating will be calculated • How the component ratings will be calculated • Definitions of the data elements
A companion Policy Manual describes the Report Card elements, displays, and other background information.
Formula Changes in the Rating System for the 2005-2006 Report Cards The following changes will be incorporated into the formulas and rules:
• To align with inclusion rules of assessment results, the attendance of students identified in the Spring Membership Collection as enrolled in district special education programs on the first school day in May will be included only in the calculation of district attendance rates.
• Results from 2005-2006 reading and math assessments at grades 4, 6, and 7 will be included in the Statewide Assessments table in the school and district reports cards and will be included in the calculation of testing participation rates for the report card.
• ODE has requested the following amendments to the State’s Accountability Workbook: • Results from 05-06 reading and math assessments at grades 4, 6, and 7 will not
be included in the calculation of student performance in 05-06 AYP reports or report cards rating formulas, but will be included in 06-07 reports and ratings.
• Students will be omitted from the participation rate calculation when such students cannot take the State assessment during the entire testing window, including the make-up dates, because of a significant medical emergency.
Rating Criteria Overall Student Performance, Student Behavior, Improvement, School Characteristics
Student Performance
Elementary/Middle School: Student performance in Grades 3, 5, 8 on Oregon Statewide Assessments in Reading/Literature and Math Knowledge and Skills. High School: Student performance in Grade 10 on Oregon Statewide Assessments in Reading/Literature, Math Knowledge and Skills, and Writing.
Student Behavior
Elementary/Middle School: Attendance rate. High School: Attendance and Dropout rates.
Improvement Improvement in Reading and Math Knowledge and Skills assessment scores combined with improvement in attendance and dropout rates.
School Characteristics
Percentage of eligible students at grades 3-8 and 10 participating in 2005-2006 Oregon Statewide Assessments in English/Language Arts and Mathematics.

Page 3
III. Calculating the School Characteristics Rating Formula Description The School Characteristics rating will be based on one indicator: the percentage of eligible students that participate in Oregon Statewide Assessments. Each school will receive a School Characteristics rating that reflects its participation rate as shown in the table below. A school that receives an Unacceptable or Low rating in School Characteristics will receive no higher than an Overall rating of Unacceptable or Low, respectively. Discussion: The Importance of Participation Rate It is important that schools include all students in the statewide assessment system. As the number of students that participate appropriately increases, the accuracy of the depiction of the school performance increases. If a school were to select only the top 40% of its students to assess, the scores would be higher than if all students were assessed. Valid comparisons of the school to itself over time, or of one school to another, assume that a representative group of students at each school has been assessed. The specifics of how students were included are shown below for both the 2004-2005 and 2005-2006 Report Cards.
School Characteristics Rating Rating Participation Rate
Exceptional 94.5% and higher Low 89.5% - 94.4% Unacceptable Less than 89.5%
Testing Conditions Participation Formula
2004-2005 Report Card
Issued October 2005
2005-2006 Report Card
To be issued October 2006 Standard assessments (with or without accommodations) Included Included
Targeted up Included Included
Targeted down Included Included
Extended assessments Included Included
Juried assessments Included Included
Modified assessments Included Included
Parent Non-consent Not included Not included
Student Non-consent/No attempt Included as non-participant Included as non-participant
Exempted First Year ELL Included Included
Non-completers Included Included
Absent Included as non-participant Included as non-participant Students enrolled on the first school day in May that were enrolled during a test window and not tested
Included as non-participant Included as non-participant

Page 4
Definition of Participation Rate
Definition of Participation Rate for Report Card The participation rate reflects the proportion of students eligible to participate in the reading, writing, and mathematics Oregon Statewide Assessments to those who actually received scores. For the purposes of the school report card system, the participation rate is defined as follows: Number of Participating tests in reading, mathematics, and writing DIVIDED BY Expected Number of Participating tests in reading, mathematics, and writing —Number tests from students that were ineligible for testing This definition reflects the percentage of students who should have participated in assessments but did not participate. Schools receive a Low School Characteristics rating if more than 5.5% of expected tests from students enrolled on the first school day in May are non-participants. Schools receive an Unacceptable School Characteristics rating if more than 10.5% of expected tests from students enrolled on the first school day in May are non-participants. See below for details on non-participating tests and expected number of tests.
Summary Discussion The participation rate for the 2005-2006 report card includes all students enrolled in a school or district on the first school day in May except those students who were exempted due to parent non-consent for religious or disability-related reasons. Students who were exempted due to parent non-consent for religious or disability-related reasons are considered ineligible for testing and are excluded from the calculation of the report card participation rate. For 2005-2006 the expected tests are students that were enrolled during a test window for the following tests:
• Reading/Literature grades 3—8 and 10 • Mathematics Knowledge and Skills grades 3—8 and 10 • Writing grades 4, 7, and 10
Note that registered home schooled students, private school students, tuitioned students and students attending public or private alternative programs that are not claimed by any district for ADM or did not receive instruction from the district in the state content standards during the 2005-2006 school year are excluded from district and school report card calculations when so identified by the district. Non-participants are students enrolled on the first school day in May that were enrolled during a test window and not tested. This includes answer sheets coded as “absent”, students that refuse to participate, parents that refuse to have their students tested for reasons other than religious or disability-related reasons. Students with “special codes” in Writing (e.g. “too long,” “too short,” “off topic”) were included for both participation and school performance calculations.

Page 5
*Limited English Proficient (LEP) students that enroll in a U.S. school for the first time after August 15 of the current school year are not required to take the state assessments in reading and writing. However, these “First year” LEP students are counted as participants in reading or writing tests only if reported as taking a test of English Language Proficiency during the school year. First year LEP students are required to take state assessments in mathematics and science. ^ODE has requested the following amendment to the State’s Accountability Workbook:
• Students will be omitted from the participation rate calculation when such students cannot take the State assessment during the entire testing window, including the make-up dates, because of a significant medical emergency.
Student Inclusion Rules
Type (Assessment Code) Report Card
2004-2005 Policy Report Card
2005-2006 Policy Absent (1) 2 2
Non-attempt (no attempt—includes student non-consent)
2 2
Modified (student with disability) (3) 3 3
Exempt* (Limited English Proficient) 3 3
Modified (Limited English Proficient) (5)
3 3
Refusal (parent) (7) 1 1
Home schooled (home schooled/foreign exchange) (6)
1 1
Not enrolled during test window^ (8) 1 1
Code key: 1— Not included in Participation (denominator) nor in calculation of Student Performance 2— Included as non-participant; not included in calculation of Student Performance 3— Included as participant; not included in calculation of Student Performance
Note: In calculating Student Performance, the average of two years is always used. In calculating Participation, the single most recent year is used.

Page 6
IV. Calculating the Student Performance Rating
Formula Description The Student Performance Rating will be based on student performance on Oregon Statewide Assessments during the two most recent school years, 2004-2005 and 2005-2006. The Calculation of Student Performance Ratings In order to maintain a rating system that is consistent for as many years as possible, the decision was made by the Oregon Department of Education that the
• Elementary and Middle School formula will include only the results of Reading/Literature and Math Knowledge and Skills assessments from grades 3, 5, 8, and 10 in the 2005-2006 report card ratings*.
• High School formula includes Reading/Literature and Math Knowledge and Skills results from students enrolled at grades 3, 5, 8, and 10, and the Writing results for students enrolled at grade 10 in the 2005-2006 report card ratings*.
*ODE has requested the following amendment to the State’s Accountability Workbook:
• Results from 05-06 reading and math assessments at grades 4, 6, and 7 will not be included in the calculation of student performance in 05-06 AYP reports or report card rating formulas, but will be included in 06-07 reports and ratings.
Determining Which Tests to Include in Calculating Student Performance The rules for including tests in the calculation of student performance have changed over time.
• Prior to the 2004-2005 school year, the highest score a student earned in a school or district on a standard administration of a test at or above the student’s enrolled grade was included in calculating the student performance index of a school or district.
• For the 2004-2005 school year and beyond, the highest score earned during the school year that a student taking a standard administration of a test at or above the student’s enrolled grade is included in the school and district where the student was enrolled for a full academic year in the school of enrollment on the first school day in May.
• The scores of students enrolled in grade 10 who took and passed the test the previous school year or who targeted up and passed the test as an 8th grade student and did not test again when enrolled in grade 10 are included using the inclusion rules for the appropriate school year.
Note that registered home schooled students, private school students, tuitioned students and students attending public or private alternative programs that are not claimed by any district for ADM or did not receive instruction from the district in the state content standards during the 2005-2006 school year are excluded from district and school report card calculations when so identified by the district.

Page 7
Weights Elementary and Middle School: In calculations of the Student Performance ratings, results for Reading and Math Knowledge and Skills assessments will each contribute 50% of the total. High School: In calculations of the Student Performance ratings, results for Reading and Math Knowledge and Skills will each contribute 39% and Writing will contribute 22% of the total.
Student Performance Rating Formulas
Elementary and Middle Schools: The Student Performance rating will be calculated as an average of scores on Reading and Math Knowledge and Skills statewide assessments for the two most recent years.
Student Performance Index Score Grades 3,5,8=
[((.50 * Reading 2004-2005) + (.50 * Math Knowledge/Skills 2004-2005)) + ((.50 * Reading 2005-2006) + (.50 * Math Knowledge/Skills 2005-2006))] /2
High School: The Student Performance rating will be calculated as a weighted average of scores on Reading, Math Knowledge and Skills, Writing, and Math Problem Solving statewide assessments for the two most recent years.
Student Performance Index Score Grade 10= [((.39 * Reading 2004-2005) + (.39 * Math Knowledge/Skills 2004-2005) + (.22 * Writing 2004-2005))+ ((.39 * Reading 2005-2006) + (.39 * Math Knowledge/ Skills 2005-2006) + (.22 * Writing 2005-2006))] /2

Calculating Index Points From Performance Levels Based on performance levels, an Assessment Index Score will be calculated for each student assessment used in the rating, with the same general method used for all assessments. The scale score ranges for each performance level are shown below by test and by grade level. Writing at grades 4 and 7 and science are displayed and included in report card detail sheets, but are not included in student performance ratings for the 2005-2006 report card.
Oregon Assessments Performance Levels and Cut Scores by Content Area and Grade
Content Area and Grade
Scale Score Ranges for Each Performance Level Exceed the Standard
Meet the Standard
Nearly Meet the Standard Low Very Low
Reading/Literature Grade 3 215 & above 201 – 214 196 – 200 190 – 195 below 190
Grade 5 231 & above 215 – 230 209 – 214 201 – 208 below 201
Grade 8 239 & above 231 – 238 223 – 230 208 – 222 below 208
Grade 10 249 & above 239 – 248 230 – 238 214 – 229 below 214
Math Knowledge and Skills Grade 3 215 & above 202 – 214 196 – 201 186 – 195 below 186
Grade 5 231 & above 215 – 230 210 – 214 202 – 209 below 202
Grade 8 239 & above 231 – 238 225 – 230 216 – 224 below 216
Grade 10 249 & above 239 – 248 229 – 238 219 – 228 below 219
Writing Grade 4 40—48 32—39 28—31 16 – 27 0 – 15
Grade 7, 10 50 – 60 40 – 49 35 – 39 20 – 34 0 – 19
Science Grade 5 239 & above 223 – 238 210 – 222 202 – 209 below 202
Grade 8 247 & above 233 – 246 227 – 232 216 – 226 below 216
Grade 10 252 & above 239 – 251 233 – 238 222 – 232 below 222
Grade 4 223 & above 208 – 222 203 – 207 196 – 202 below 196
Grade 7 236 & above 226 – 235 218 – 225 206 – 217 below 206
Grade 6 233 & above 219 – 232 214 – 218 203 – 213 below 203
Grade 4 223 & above 208 – 222 203 – 207 194 – 202 below 194
Grade 7 236 & above 226 – 235 220 – 225 211 – 219 below 211
Grade 6 233 & above 219 – 232 215 – 218 207 – 214 below 207
Page 8

Page 9
Index Points Index points will be assigned for each student score with more points being assigned to higher student performance levels. The index points for each performance level are shown in the table below. Assessment Index Score Formula The formula below yields one Assessment Index Score for a school. The index score is rounded to the nearest tenth of a point.
Student Performance Index Scores The Student Performance Index Scores will be calculated and compared to the index score ranges below to determine the Student Performance rating.
Elementary and Middle School High School
Performance Level Index Points Exceed the Standard 133 Meet the Standard 100 Nearly Meet the Standard 67 Low 33 Very Low 0
Assessment Index Score=
[(0 * Number of Very Low Scores) + (33 * Number of Low Scores) + (67 * Number of Nearly Meets Scores) + (100 * Number of Meets Scores) + (133 * Number of Exceeds Scores)] / Total Number of Student Scores
Rating Index Score Range Exceptional 115.0 or higher Strong 100.0 – 114.9 Satisfactory 70.0 – 99.9 Low 60.0 – 69.9 Unacceptable Less than 60.0
Student Performance Index Score Ranges Rating Index Score Range
Exceptional 100.0 or higher Strong 90.0 – 99.9 Satisfactory 70.0 – 89.9 Low 60.0 – 69.9 Unacceptable Less than 60.0
Student Performance Index Score Ranges

Page 10
Method for Calculation An Assessment Index Score for a given year and subject is calculated by counting the number of students that scored at the Exceed, the Meet, the Nearly Meet, the Low, and the Very Low performance levels. Then the points will be applied to the number of students at each performance level. Please note that this method can be used to calculate an index score for each assessment at a particular grade level, or for a particular assessment across multiple grade levels within a school. The Assessment Index Scores for a school include all the students assessed, regardless of the benchmark grade level. For example, a school with Grades 3 and 5 will have the scores combined into a single Reading Assessment Index Score for both grades combined. Discussion The Assessment Index Score represents the average performance of students in the school on that particular assessment. A score of 100 indicates that, on average, the students performed at the level of Meet the Standard. A score of 33 indicates that, on average, the students performed at the Low level. A school could have a maximum Assessment Index Score of 133 if all the students were at the level of Exceed the Standard. The minimum score would be 0 if all the students were at the level of Very Low. Display The percentage of students meeting or exceeding the standards will be displayed for Reading, Math, and Science Knowledge and Skills tests. The percentage of students exceeding, meeting, and conditionally meeting the state standards will be displayed for Writing tests.

Page 11
V. Calculating the Student Behavior Rating
Formula Description
Elementary/Middle Schools: The Student Behavior rating will be based on attendance rates during the two most recent school years, 2004-2005 and 2005-2006. High Schools/Schools With Grade 12: The Student Behavior rating will be based on attendance and dropout rates during the two most recent school years available. Calculation of Student Behavior Ratings
• The Student Behavior rating will be based on attendance and dropout rates for the two most recent years.
• Improvement in Student Behavior will not be included in this category, but improvement in attendance and dropout rates will be part of a separate Improvement rating.
• The index score for attendance will be the percentage of students attending in grades 1-12 and will not be based on a formula index.
• Index score ranges will be the same for elementary, middle, and high schools.
Student Behavior Rating Formulas
Elementary and Middle Schools: The Index Score will be based on an average of the attendance rates for the 2004-2005 and 2005-2006 schools years.
Student Behavior Index Score E/MS = [(Attendance Rate 2004-2005 + Attendance Rate 2005-2006)]/2
High Schools/Schools with Grade 12: The Index Score will be based on an average of the attendance rates for the school years 2004-2005 and 2005-2006 and dropout rates for 2003-2004 and 2004-2005. High schools will not receive separate ratings for attendance and dropout. The two measures will be combined into the Student Behavior rating.
Student Behavior Index Score HS = ([Attendance Index Score + Dropout Index Score]) /2
• Attendance Index Score HS = [(Attendance Rate 2004-2005 + Attendance Rate 2005-2006)]/2 • Dropout Index Score HS = [(100 - Dropout Rate 2003-2004) + (100 - Dropout Rate 2004-2005)]/2

Page 12
Student Behavior Index Score Ranges The ratings and corresponding index score ranges are shown below for all schools. The Student Behavior Index Score will be calculated and compared to the index score ranges in the table below to determine the Student Behavior rating. The same index score ranges apply to all schools. Definition of Attendance Rate The attendance rate is the average percentage of enrolled students attending school each day during the school year. An attendance rate of 100% means that every enrolled student attended school every day. Because there is a normal rate of illness and other incidents, it is reasonable for schools to have attendance rates less than 100%. Attendance rates include absences that are excused and unexcused. When a student is not at school (unless withdrawn), the student is counted as absent. Out-of-school suspensions are included as absences. Attendance is defined using the standard definitions published by the Oregon Department of Education.
Calculation of the Attendance Rate
Attendance is calculated as the ratio between Total Days Present and Total Daily Students Could Have Attended.
• Total Days Present is calculated by summing the number of students present in the school each day, across all the days of the school year.
• Total Days Absent is calculated by summing the number of students absent in the school each day, across all the days of the school year.
• The Attendance Rate is calculated by dividing the Total Days Present by the sum of the Total Days Present and the Total Days Absent and multiplying by 100. Attendance rates are rounded to the nearest tenth of one percent for the school report card.
Total Days Attendance
Attendance Rate = x 100 (Total Days Present + Total Days Absent )
Rating Index Score Range Exceptional 96.0 or higher Strong 94.0 – 95.9 Satisfactory 92.0 – 93.9 Low 89.0 – 91.9 Unacceptable less than 89.0
Student Behavior Ratings

Page 13
Definition of Dropout Rate A dropout is defined by Oregon Revised Statute ORS 339.505. This definition of dropout is consistent with the definition used by the National Center for Education Statistics and is calculated following the regular definitions published by the Oregon Department of Education. The dropout rate is calculated annually. Final dropout figures are not available until after December of each year because schools must confirm that a student has not re-enrolled in school.
For more information which students are considered dropouts and to view annual statewide reports on dropouts, see http://www.ode.state.or.us/data/schoolanddistrict/students/dropout.aspx.
Calculation of the Dropout Index The Dropout Index will be calculated as (100 - Dropout Rate).
A dropout is a student who withdrew from school and did not graduate or transfer to another school that leads to graduation. Dropouts do not include students who: • are deceased, • are being home schooled, • are enrolled in an alternative school or hospital education program, • are enrolled in a juvenile detention facility, • are enrolled in a foreign exchange program, • are temporarily absent because of suspension, a family emergency, or severe health problems
that prevent attendance at school, • received a GED certificate, • received an adult high school diploma from a community college.

Page 14
VI. Calculating the Improvement Rating
Formula Description The Improvement rating will be based on improvement over four years in performance on statewide assessments, attendance, and dropout rates.
Improvement Ratings and Index Score Ranges The Improvement Index Score will be calculated and compared to the index score ranges below to determine the Improvement rating. The same index score ranges apply to all schools. Improvement Rating Formulas
Part 1: Calculating Improvement in Student Performance on Reading and Math Knowledge and Skills assessments.
Part 2: Calculating Improvement in Student Behavior on attendance and dropout rates.
Rating Index Score Range Improved 5.0 and higher Stayed About the Same -4.9 to + 4.9 Declined –5.0 and less
Improvement Ratings
Improvement in Student Performance will be based on an average of the performance on Reading and Math Knowledge and Skills statewide assessments, as shown in the formula below. Please note that the Student Performance Improvement rating formula will be the same for elementary, middle, and high schools.
Student Performance Improvement2002-2003 to 2005-2006= [(Reading Improvement2002-2003 to 2005-2006) + (Math Improvement2002-2003 to 2005-2006)] / 2
Elementary/Middle School: Improvement in Student Behavior will be the change in attendance rates.
Student Behavior Improvement E/MS= (Attendance Improvement2002-2003 to 2005-2006)
High School: If the school includes a 12th grade, Improvement in Student Behavior will be an average of the change in attendance and the change in dropout.
Student Behavior Improvement HS= [(Attendance Improvement2002-2003 to 2005-2006) + (Dropout Improvement2001-2002 to 2004-2005)] / 2

Page 15
Part 3: Calculating the Improvement change over four years.
Please note that in cases where only three years of data are available, the two most recent years of data are compared against the single most prior year for the purposes of calculating Improvement. If three years of dropout data are not available, the elementary school improvement formula will be applied.
Improvement Index= [(.8 * Student Performance Improvement) + (.2 * Student Behavior Improvement)]

Page 16
VII. Calculating The Overall Rating
Formula Description The Overall rating will be based on
• Student Performance: Oregon Statewide Assessment results during the two most recent school years, 2004-2005 and 2005-2006.
• Student Behavior: Attendance and dropout rates during the two most recent school years. • Improvement: Change in performance on statewide assessments, attendance, and
dropout rates during the four most recent school years. • School Characteristics: Participation in Reading, Writing, and Mathematics Oregon
Statewide Assessments during the most recent school year, 2005-2006. Two methods for determining the Overall rating are described below. The two methods yield the same results. Method 1: Calculating the Overall Rating Step 1: If the rating of School Characteristics is Exceptional, then the Overall rating can be determined using the rating scores in the charts below. To calculate the Overall rating, find the numerical rating scores associated with the ratings for each of the component ratings: Student Performance, Student Behavior, and Improvement. Note that if a school has an Unacceptable School Characteristics rating, then it will receive an Overall rating of Unacceptable. If a school has a Low School Characteristics rating, then it will receive a maximum Overall rating of Low.
Rating Score Rating 4 Exceptional 3 Strong 2 Satisfactory
Student Performance
1 Low 0 Unacceptable
Improvement Rating Score Rating
1 Improved 0 Stayed About the Same
-.25 Declined
Rating Score Rating 4 Exceptional 3 Strong 2 Satisfactory
Student Behavior
1 Low 0 Unacceptable

Page 17
Step 2: Apply the following formula
Step 3: Find the rating that corresponds to the Overall Rating Index Score. Please note that for the Overall rating the same index score ranges apply to all schools. Method 2: Calculating the Overall Rating If the rating of School Characteristics is Exceptional, the Overall rating may be determined by using the chart below. Find the row that corresponds with each component rating.
Overall Rating Index Score = (.8* Student Performance Rating Score) + (.2 * Student Behavior Rating Score) + Improvement Rating Score
Rating Index Score Range Exceptional 4.0 or above Strong 3.0 – 3.9 Satisfactory 1.5 – 2.9
Overall Rating
Low 1.0 – 1.4 Unacceptable less than 1.0
Overall Rating
Student Performance
Student Behavior Improvement
Exceptional Exceptional Exceptional Improved Exceptional Exceptional Strong Improved Exceptional Strong Exceptional Improved Exceptional Exceptional Satisfactory Improved Exceptional Exceptional Exceptional Stayed about the same Exceptional Strong Strong Improved Exceptional Exceptional Low Improved Exceptional Exceptional Unacceptable Improved Exceptional* Exceptional Exceptional Declined Strong Satisfactory Exceptional Improved Exceptional* Exceptional Strong Stayed about the same Strong Strong Satisfactory Improved Strong Strong Exceptional Stayed about the same Strong Satisfactory Strong Improved Strong Exceptional Strong Declined Exceptional* Exceptional Satisfactory Stayed about the same

Page 18
Overall Rating
Student Performance
Student Behavior Improvement
Strong Strong Low Improved Strong Exceptional Satisfactory Declined Strong Strong Strong Stayed about the same Strong Satisfactory Satisfactory Improved Strong Exceptional Low Stayed about the same Strong Exceptional Low Declined Strong Strong Unacceptable Improved Strong Exceptional Unacceptable Stayed about the same Strong Strong Exceptional Declined Strong Exceptional Unacceptable Declined Satisfactory Low Exceptional Improved Satisfactory Satisfactory Exceptional Stayed about the same Satisfactory Low Strong Improved Satisfactory Strong Strong Declined Satisfactory Strong Satisfactory Stayed about the same Satisfactory Satisfactory Low Improved Satisfactory Satisfactory Exceptional Declined Satisfactory Satisfactory Strong Stayed about the same Satisfactory Low Satisfactory Improved Satisfactory Strong Satisfactory Declined Satisfactory Strong Low Stayed about the same Satisfactory Satisfactory Strong Declined Satisfactory Low Exceptional Stayed about the same Satisfactory Strong Low Declined Satisfactory Satisfactory Satisfactory Stayed about the same Satisfactory Low Low Improved Satisfactory Satisfactory Unacceptable Improved Satisfactory Unacceptable Exceptional Improved Satisfactory Satisfactory Satisfactory Declined Satisfactory Satisfactory Low Stayed about the same Satisfactory Strong Unacceptable Stayed about the same Satisfactory Unacceptable Strong Improved Satisfactory Satisfactory Low Declined

Page 19
Overall
Rating Student
Performance Student
Behavior Improvement
Satisfactory Low Unacceptable Improved Satisfactory Strong Unacceptable Declined Satisfactory Satisfactory Unacceptable Stayed about the same Low Unacceptable Satisfactory Improved Low Low Exceptional Declined Low Low Strong Declined Low Low Satisfactory Stayed about the same Low Low Low Stayed about the same Low Unacceptable Low Improved Low Satisfactory Unacceptable Declined Low Unacceptable Unacceptable Improved Low Low Strong Stayed about the same Low Low Satisfactory Declined Unacceptable Unacceptable Exceptional Stayed about the same Unacceptable Low Low Declined Unacceptable Unacceptable Exceptional Declined Unacceptable Unacceptable Strong Stayed about the same Unacceptable Low Unacceptable Stayed about the same Unacceptable Unacceptable Strong Declined Unacceptable Unacceptable Satisfactory Stayed about the same Unacceptable Low Unacceptable Declined Unacceptable Unacceptable Satisfactory Declined Unacceptable Unacceptable Low Stayed about the same Unacceptable Unacceptable Low Declined Unacceptable Unacceptable Unacceptable Stayed about the same Unacceptable Unacceptable Unacceptable Declined

Page 20
Exceptions The formula method and the matrix method can be used in most circumstances. However, there are four situations when a formula override will be applied. 1) If the rating of School Characteristics is Unacceptable, the Overall rating is set to Unacceptable.
2) If the rating of School Characteristics is Low, the Overall rating is set to a maximum of Low. 3) If the ratings for Student Performance and Student Behavior are Exceptional, but there is a
decline in the Improvement factor, the Overall rating is set to Exceptional. This adjustment is noted with an asterisk in the Rating Matrix shown above.
4) Elementary/Middle Schools: If the index score for Student Performance is 115.0 or higher, then the rating for Student Performance is set to Exceptional* and the school will receive 4.5 points toward the Overall rating score. When combined with a Student Behavior rating of Strong and an Improvement rating of Stayed About the Same, the Overall rating will be set to Exceptional*. This adjustment is noted with an asterisk in the Rating Matrix shown above.
Special Circumstances An asterisk or a superscripted number by an Overall rating denotes a special circumstance for which additional information in a footnote is needed to allow the reader to interpret the rating appropriately. If requested by the district, schools that have a significant change in population due to changes in boundaries or grade level configurations are noted with an asterisk. In cases where there has been a population change of at least 40%, the institution is considered a new school and the Overall, the Student Performance, and the Student Behavior ratings are not computed until sufficient historical data is again accumulated.

Page 21
VIII. An Example of Calculating Ratings: Elementary/Middle School Introduction The report card rating system is based on the following components: student performance on Oregon Statewide Assessments, attendance and dropout rates, and participation rates on statewide assessments. The rating system provides a method for combining index scores for the component ratings into a single number which is used to calculate the Overall rating. Although there are many numbers, the calculations themselves are quite simple. You will need the score reports returned to the school by the Assessment Office of the Department of Education and the attendance and dropout data reported by the school to the Department. Background: Example for Elementary School For the purpose of this example, we will assume that students in Grades 3 and 5 were included in assessments for Reading and Math Knowledge and Skills. We will also assume that the school has attendance data, and that a dropout rating does not apply to this school. To calculate the Overall rating, we will need to calculate each of the four components. The example will show how this is done for each element:
• Student Performance Index Score • Student Behavior Index Score • Improvement Index Score • School Characteristics Index Score
Calculating the Student Performance Index Score
Elementary/Middle School Student assessment results are used to calculate the Student Performance Index Score. The steps are listed below.
Step 1. Calculate a Reading Assessment Index Score using 2004-2005 data. Step 2. Repeat the procedures for 2005-2006 Reading. Step 3. Calculate a Math Assessment Index Score using 2004-2005 data. Step 4. Repeat the procedures for 2005-2006 Math. Step 5. Using the Reading Assessment Index Scores and the Math Assessment Index Scores, calculate the Total Assessment Index Score for 2004-2005 and 2005-2006. Step 6. Calculate the Student Performance Index Score by averaging the two Total Assessment Index Scores. Step 7. Compare the Student Performance Index Score to the table for a Student Performance Rating.

Page 22
Example: Elementary/Middle School Step 1. Calculating a Reading Assessment Index Score2004-2005 for Grades 3 and 5
• Count the number of tests at each Performance Level. In the example, there were eleven students who scored Exceed the Standard on the Reading test. Note that it is possible to count all students in the school across all grade levels tested; this is mathematically equivalent to counting each grade level, and then adding the sums.
• Multiply the number of tests at each Performance Level by the points assigned for that
Performance Level. In the example, the school receives 133 points for each student at the Exceed Performance Level. Since there were eleven students who scored Exceed, the school calculates 11* 133 = 1463. This is done for each Performance Level.
• Add the total points for all the Performance Levels. In the example, the school had (1463+1500+871+231+0) = 4065 total points. • Add the total number of tests for all the Performance Levels. In the example the school
had (11+15+13+7+4) = 50 total students for the reading test. • Divide the total points by the total number of tests for the Assessment Index Score. In the
example, the school had 4065 total points, divided by 50 total tests = 81.3 (rounded to the nearest tenth of a point).
• After calculating a score for both the Reading and Math Knowledge and Skills assessments
during the 2004-2005 school year, repeat the procedures for Reading and Math during the school year 2005-2006. Then calculate a Total Assessment Index Score by multiplying the score for each assessment by its assigned weight and adding the weighted scores.
Step 2. Calculating a Reading Assessment Index Score2005-2006
Repeat the procedures for Reading during the school year 2005-2006. Step 3. Calculating a Math Assessment Index Score2004-2005
Repeat the procedures for Math during the school year 2004-2005. Step 4. Calculating a Math Assessment Index Score2005-2006
Repeat the procedures for Math during the school year 2005-2006.
Performance Level Number of Tests Points Total
Exceed 11 133 1463 Meet 15 100 1500 Nearly Meet 13 67 871 Low 7 33 231 Very Low 4 0 0
Total 50 4065 Score 81.3

Page 23
Step 5. Calculating a Total Assessment Index Score
After calculating the Total Assessment Index Score for the school year 2004-2005, repeat the procedure using the data for the school year 2005-2006. Step 6. Calculating the Student Performance Index Score Average the Total Assessment Index Score2004-2005 and the Total Assessment Index Score2005-2006.
Student Performance Index Score2004-2005--2005-2006 = [Total Assessment Index Score2004-2005 +Total Assessment Index Score2005-2006] / 2 Student Performance Index Score = [79.0 + 83.0 ] / 2 Student Performance Index Score2004-2005--2005-2006 = 81.0
Step 7. Comparing the Student Performance Index Score Compare the Student Performance Index Score of 81.0 to the table below. For the example, the school earned a Satisfactory Student Performance rating.
Elementary and Middle School
Total Assessment Index Score2005-2006 Test Score Weight Total
Reading Knowledge and Skills 83.3 50% 41.7 Math Knowledge and Skills 82.6 50% 41.3 Total 100% 83.0
83.0 Total Assessment Index Score2005-2006
Total Assessment Index Score2004-2005 Test Score Weight Total
Reading Knowledge and Skills 81.3 50% 40.7 Math Knowledge and Skills 76.6 50% 38.3 Total 100% 79.0
79.0 Total Assessment Index Score2004-2005
Rating Index Score Range Exceptional 115.0 or higher Strong 100.0 – 114.9 Satisfactory 70.0 – 99.9 Low 60.0 – 69.9 Unacceptable Less than 60.0
Student Performance Index Score Ranges

Page 24
Calculating the Student Behavior Index Score: Elementary/Middle School
Step 1. Calculating the Attendance Index Score for Grades 3 and 5 The Attendance rate is calculated by dividing the Number of Days Attendance (days present) by the Total Daily Membership (days present + days absent). The two numbers are reported by the school and district to the Department of Education. First calculate for 2004-2005. Step 2. Repeating the procedure for 2005-2006 Attendance Data. Step 3. Calculating the Student Behavior Index Score
Student Behavior Index Score2004-2005 – 2005-2006 = [ Attendance Index Score2004-2005 + Attendance Index Score2005-2006] / 2 Student Behavior Index Score = [92.6 + 95.3] / 2 Student Behavior Index Score2004-2005 – 2005-2006 = 94.0
Step 4. Comparing the Student Behavior Index Score Compare the Student Behavior Index Score of 94.0 to the table below. For the example, the school earned a Strong Student Behavior Rating.
Student Behavior Index Score Ranges The ratings and corresponding index score ranges are shown below for all schools.
Number of Days Attendance 29160 Total Daily Membership 31500 Attendance Rate 92.6 Attendance Index Score2004-2005 92.6
Number of Days Attendance 30140 Total Daily Membership 31600 Attendance Rate 95.3 Attendance Index Score2005-2006 95.3
Rating Index Score Range Exceptional 96.0 or higher Strong 94.0 – 95.9 Satisfactory 92.0 – 93.9
Student Behavior Ratings
Low 89.0 – 91.9 Unacceptable less than 89.0

Page 25
Calculating the Improvement Index Score: Elementary/Middle School
Improvement in Assessments and Attendance
We will calculate the Improvement Index ScoreE/MS. The steps are listed below.
Step 1. Calculate the Reading Assessment Improvement Index Score Step 2. Calculate the Math Assessment Improvement Index Score Step 3. Calculate the Average Assessment Improvement Index Score Step 4. Calculate an Attendance Improvement Index Score Step 5. Calculate a Total Improvement Index Score Step 6. Compare the Total Improvement Index Score to the table for an Improvement rating.
Step 1. Calculating the Reading Assessment Improvement Index Score The Assessment Improvement Index Score reflects improvement in performance on Reading and Math Knowledge and Skills statewide assessments during the past four school years.
Reading
The Reading Assessment Improvement Index is calculated by following the steps below.
• Calculate a Reading Assessment Index Score for the four school years 2005-2006, 2004-2005, 2003-2004, and 2002-2003 using the same procedures as discussed previously.
• Add the Reading Assessment Index Score2004-2005 and the Reading Assessment Index Score2005-2006.
• Divide the sum by 2 for an average index for those two years. • Add the Reading Assessment Index Score2002-2003 and the Reading Assessment Index
Score2003-2004. • Divide the sum by 2 for an average index for those two years. • Subtract the two average index scores. This is the amount of improvement or difference
during the four years.
The formula for the Improvement Index Score is
Improvement Index Score = (.8 * Assessment Improvement Index Score) + (.2 * Attendance Improvement Index Score)
School Year
Assessment Index Score Averages Difference
2005-2006 83.3 Average of 2004-2005 and 2005-2006
82.3 Between
2004-2005+ 2005-2006
AND
2002-2003 +2003-2004
2004-2005 81.3
2003-2004 78.0
2002-2003 72.0
Reading Assessment Improvement Index Score 7.3
Average of 2002-2003 and 2003-2004
75.0

Page 26
Step 2. Calculating the Math Assessment Improvement Index Score The same procedure is used to calculate the Math Assessment Improvement Index using results from the Math Knowledge and Skills assessments.
Math
Step 3. Calculating the Average Assessment Improvement Index Score The Average Assessment Improvement Index Score is the average of the index scores for Reading and Math Knowledge and Skills. The Average Assessment Improvement Index Score is calculated by following the steps below.
• Add the Reading Assessment Improvement Index Score and the Math Assessment Improvement Index Score.
• Divide by 2. • Round to the nearest tenth of a point.
School Year
Assessment Index Score Averages Difference
2005-2006 82.6 Average of 2004-2005 and 2005-2006
79.6 Between
2004-2005+ 2005-2006
AND
2002-2003 +2003-2004
2004-2005 76.6
2003-2004 78.6
2002-2003 76.2
Math Assessment Improvement Index Score 2.2
Average of 2002-2003 and 2003-2004
77.4
Average Assessment Improvement Index Score Content Area Index Score
Reading Assessment Improvement 2002-2003 to 2005-2006 7.3
Math Assessment Improvement 2002-2003 to 2005-2006 2.2
Average Assessment Improvement Index Score 4.8

Step 4. Calculating the Attendance Improvement Index Score The Attendance Improvement Index Score reflects improvement in attendance over the past four school years. It is calculated by comparing the average of the two most recent years to the average of the previous two years.
Attendance
Step 5. Calculating the Total Improvement Index Score The Total Improvement Index Score combines the assessment improvement and attendance improvement.
School Year
Attendance Index Score Averages Difference
2005-2006 95.3 2004-2005 and 2005-2006
94.0
Between
2004-2005+ 2005-2006
AND
2002-2003 and 2003-2004
2004-2005 92.6
2003-2004 90.2
2002-2003 88.5
Attendance Improvement Index Score 4.6
2002-2003 and 2003-2004
89.4
Calculating the Attendance Improvement Index Score: Elementary/Middle School The Attendance Improvement Index Score is calculated by following the steps below.
• Calculate the Attendance Index for the four years 2005-2006, 2004-2005, 2003-2004, and 2002-2003, using the procedures discussed previously.
• Add the Attendance Index Score2005-2006 and the Attendance Index Score2004-2005. [95.3 + 92.6 = 187.9] • Divide the sum by 2 for an average index for those two years. [187.9 / 2 = 94.0] • Add the Attendance Index2003-2004 and the Attendance Index2002-2003. [90.2 + 88.5 = 178.7] • Divide the sum by 2 for an Average Attendance Index Score for those two years. [178.7 / 2 = 89.4] • Subtract the average index scores. This is the amount of improvement or difference
during the four years. [94.0 – 89.4 = 4.6] • The Attendance Improvement Index Score in this example is 4.6.
Element Index Score Weight Weighted Index Average Assessment Improvement 4.8 x .8 = 3.8 Average Attendance Improvement 4.6 x .2 = 0.9
4.7 Total Improvement Index Score Page 27

Page 28
Step 6. Comparing the Total Improvement Index Score We have calculated the Total Improvement Index Score as 4.7. Compare the Total Improvement Index Score of 4.7 to the table below to determine the rating for Improvement. For the example, the school has earned an Improvement Rating of Stayed About the Same. Improvement Ratings
Rating Improvement Index Score Range
Improved 5.0 and higher Stayed About the Same -4.9 - + 4.9 Declined -5.0 and less

Page 29
Calculating the School Characteristics Index Score: Elementary School The School Characteristics Index Score is based on the percentage of eligible students that participated in the Oregon Statewide Assessments in the most recent year.
Step 1: Calculating the Participation Rate Use the report card definition of participation below. Include participation for each student enrolled on the first school day in May for each assessment included in the rating:
• Grade 3 — 8 and 10: Reading/Literature and Math Knowledge and Skills • Grades 4, 7, and 10: Writing
Number of Participating tests in reading, mathematics, and writing DIVIDED BY Expected Number of Participating tests in reading, mathematics, and writing —Number tests from students that were ineligible for testing
Participation rate = Number of participating tests/(expected number of participating tests - number of ineligible student tests) 193/(201-1) = 96.5% Remember to exclude from the expected number of tests any student that was enrolled on the first school day in May but was not tested and was not enrolled during the school’s test window. Step 2: Comparing the School Characteristics Index Score The Participation Rate in the example is 96.5%. For the example, the school earned an Exceptional School Characteristics rating.
School Year Participation Rate
2005-2006 96.5
School Characteristics Index Score 2005-2006 = Participation Rate
School Characteristics Rating Rating Participation Rate
Exceptional 94.5% and higher Low 89.5% - 94.4% Unacceptable Less than 89.5%

Page 30
Calculating the Overall School Rating: Elementary School
Method 1: Weighted Average Method In the example above, we calculated that the school received a Student Performance rating of Satisfactory and a Student Behavior Rating of Satisfactory. The Improvement rating was Stayed About the Same and the School Characteristics rating was Exceptional. Please refer to page 16 for rating scores that correspond to the ratings earned by the example school.
Compare the Overall Rating Index Score to the table below. The Overall Rating Index Score of 2.2 is converted into an Overall rating of Satisfactory. Method 2: Matrix Method The Overall rating can also be determined by using the Overall Rating Matrix. To use this method, identify the row that matches the school ratings for Student Performance, Student Behavior, and Improvement. The full matrix of possible ratings is given beginning on page 17. In this example, the fourth row of the matrix correctly matches the ratings for the school. The Overall rating associated with that row is Satisfactory. However, if the school had received a rating of Low or Unacceptable in School Characteristics, the Overall rating would have been Low or Unacceptable.
Component Index Score Rating Rating
Score Weight Total
Student Performance 81.0 Satisfactory 2 .8 1.6
Student Behavior 94.0 Strong 3 .2 0.6
Improvement 4.7 Stayed About the Same 0 1 0.0
2.2 Overall Rating Index Score
Rating Index Score Range Exceptional 4.0 and above Strong 3.0 – 3.9 Satisfactory 1.5 – 2.9 Low 1.0 – 1.4 Unacceptable less than 1.0
Overall Rating
Overall Rating
Student Performance
Student Behavior Improvement
Satisfactory Low Exceptional Declined Satisfactory Low Strong Stayed about the Same Satisfactory Satisfactory Satisfactory Declined Satisfactory Satisfactory Strong Stayed about the Same Satisfactory Low Strong Declined

Page 31
IX. An Example of Calculating Ratings: High School Introduction The report card rating system is based on the following components: student performance on Oregon Statewide Assessments, attendance and dropout rates, and participation rates on statewide assessments. The rating system provides a method for combining index scores for the component ratings into a single number which is used to calculate the Overall rating. Although there are many numbers, the calculations themselves are quite simple. You will need the score reports returned to the school by the Assessment Office of the Department of Education and the attendance and dropout data reported by the school to the Department. Background: Example for High School For the purpose of this example, we will assume that students in Grade 10 were included in assessments in Reading and Math Knowledge and Skills, Writing, and Math Problem Solving. We will also assume that the school has attendance and dropout data. Note that these same procedures apply to all schools with a Grade 12. For example, schools with grades K-12 or 7-12 are treated as high schools using the high school index scores for the purposes of issuing school report cards and ratings. The procedures used to generate ratings for elementary, middle, and high schools are identical, except that high schools include results from four assessments and dropout rates and use some different tables to convert index scores to ratings. To calculate the Overall rating, we will need to calculate each of the four components. The example will show how this is done for each element:
• Student Performance Index Score • Student Behavior Index Score • Improvement Index Score • School Characteristics Index Score

Page 32
Calculating the Student Performance Assessment Index Score
Example: High School Step 1. Calculating a Reading Assessment Index Score2004-2005 for Grade 10
• Count the number of tests at each Performance Level. In the example, there were eleven students who scored Exceed the Standard on the Reading test. Note that it is possible to count all tests in the school across all grade levels tested; this is mathematically equivalent to counting each grade level, and then adding the sums together.
• Multiply the number of tests at each Performance Level by the points assigned for that Performance Level. In the example, the school receives 133 points for each student at the Exceed Performance Level. Since there were eleven tests at the Exceed level, the school calculates 11* 133 = 1463. This is done for each Performance Level.
Student assessment results are used to calculate the Student Performance Index Score. The steps are listed below.
Step 1. Calculate a Reading Assessment Index Score using 2004-2005 data. Step 2. Repeat the procedures for 2005-2006 Reading. Step 3. Calculate a Math Assessment Index Score for Math Knowledge and Skills using 2004-2005 data. Step 4. Repeat the procedures for 2005-2006 Math Knowledge and Skills. Step 5. Calculate a Writing Assessment Index Score using 2004-2005 data. Step 6. Repeat the procedures for 2005-2006 Writing. Step 7. Using the Assessment Index Scores for Reading, Math Knowledge and Skills, and Writing, calculate the Total Assessment Index Score. Step 8. Calculate the Student Performance Index Score by averaging the two total Assessment Index Scores. Step 9. Compare the Student Performance Index Score to the table for a Student Performance Rating.
Performance Level Number of Tests Points Total
Exceed 11 133 1463 Meet 15 100 1500 Nearly Meet 13 67 871 Low 7 33 231 Very Low 4 0 0
Total 50 4065 Score 81.3

Page 33
• Add the total points for all the Performance Levels. In the example, the school had (1463+1500+871+231+0) = 4065 total points. • Add the total number of tests for all the Performance Levels. In the example, the school
had (11+15+13+7+4) = 50 total tests for the reading test. • Divide the total points by the total number of tests for the Assessment Index Score. In the
example, the school had 4065 total points, divided by 50 total tests = 81.3 (rounded to the nearest tenth of a point).
• After calculating a score for Reading/Literature, Math Knowledge and Skills, and Writing, assessments during 2004-2005, repeat the procedures for results during school year 2005-2006. Then calculate a Total Assessment Index Score by multiplying the score for each assessment by its assigned weight and adding the weighted scores.
Step 2. Calculating a Reading Assessment Index Score2005-2006 Repeat the procedures for Reading during the school year 2005-2006. Step 3. Calculating a Math Assessment Index Score2004-2005
Repeat the procedures for Math during the school year 2004-2005. Step 4. Calculating a Math Assessment Index Score2005-2006
Repeat the procedures for Math during the school year 2005-2006. Step 5. Calculating a Writing Index Score2004-2005 Repeat the procedures for Writing during the school year 2004-2005. Step 6. Calculating a Writing Index Score2005-2006 Repeat the procedures for Writing during the school year 2005-2006.

Page 34
Step 7. Calculating a Total Assessment Index Score After calculating the Total Assessment Index for the school year 2004-2005, repeat the procedure using the data for the school year 2005-2006. Step 8. Calculating the Student Performance Index Score Average the Total Assessment Index Score2004-2005 and the Total Assessment Index Score2005-2006.
Student Performance Index Score2004-2005-- 2005-2006 = [Total Assessment Index Score2004-2005 +Total Assessment Index Score2005-2006] / 2
Student Performance Index Score = [83.0 + 79.9 ] / 2
Student Performance Index Score2004-2005--2005-2006 = 81.5
Step 9. Comparing the Student Performance Index Score Compare the Student Performance Index Score of 81.5 to the table below. For the example, the school earned a Satisfactory Student Performance rating.
High School
Rating Index Score Range Exceptional 100.0 or higher Strong 90.0 – 99.9 Satisfactory 70.0 – 89.9 Low 60.0 – 69.9 Unacceptable Less than 60.0
Student Performance Index Score Ranges
Total Assessment Index Score2004-2005 Test Score Weight Total
Reading Knowledge and Skills 81.3 39% 31.7 Math Knowledge and Skills 86.9 39% 33.9 Writing 79.0 22% 7.4 Total 100% 83.0
Total Assessment Index Score2004-2005 83.0
Total Assessment Index Score2005-2006 Test Score Weight Total
Reading Knowledge and Skills 75.3 39% 29.4 Math Knowledge and Skills 84.3 39% 32.9 Writing 80.0 22% 17.6 Total 100% 79.9
Total Assessment Index Score2005-2006 79.9

Page 35
Calculating the Student Behavior Index Score: High School Calculating the Attendance Index Score: High School Step 1. Calculating the Attendance Index Score The Attendance rate is calculated by dividing the Number of Days Attendance (days present) by the Total Daily Membership (days present + days absent). The two numbers are reported by the school and district to the Department of Education. First calculate for 2004-2005. Step 2. Repeating the procedure for 2005-2006 Attendance Data. Step 3. Averaging the Attendance Index Scores.
Student Attendance Index Score2004-2005 – 2005-2006 = [ Attendance Index Score2004-2005 + Attendance Index Score2005-2006] / 2 Student Attendance Index Score = [92.6 + 93.4] / 2 Student Attendance Index Score2004-2005 – 2005-2006 = 93.0
Number of Days Attendance 29160 Total Daily Membership 31500 Attendance Rate 92.6 Attendance Index Score2004-2005 92.6
Number of Days Attendance 30140 Total Daily Membership 31600 Attendance Rate 93.4 Attendance Index Score2005-2006 93.4

Page 36
Calculating the Dropout Index Score: High School Step 1. Calculating the Dropout Index Score The Dropout Index Score for one year is calculated by subtracting the dropout rate from 100.
Dropout Index Score HS = 100 – (Dropout Rate)
Step 2. Calculating the Dropout Index Score To calculate the Dropout Index Score, average the two years of Dropout Index Scores.
Dropout Index Score HS = (Dropout Index Score2003-2004 + Dropout Index Score2004-2005) / 2 For the example, assume the school has a dropout rate of 6.2% in 2003-2004 and 7.6% in 2004-2005. The Dropout Index2003-2004 is 93.8. The Dropout Index2004-2005 is 92.4. The average of the two years is 93.1. The Dropout Index Score 2003-2004 - 2004-2005 for the school is 93.1. Step 3. Calculating the Student Behavior Index Score The Attendance and Dropout Index Scores are averaged together to produce the Student Behavior Index Score.
Student Behavior Index Score2004-2005 – 2005-2006 =
[(Attendance 2004-2005 + Attendance 2005-2006) + (Dropout 2003-2004 + Dropout 2004-2005)] / 2
Step 4. Comparing the Student Behavior Index Score of 93.1 to the table below. For the example, the school earned a Satisfactory Student Behavior Rating.
School Year Dropout Rate Index Score Average 2003-2004 6.2 93.8 2004-2005 7.6 92.4
93.1 Dropout Index Score
Element Index Score Attendance (Average of 2004-2005 and 2005-2006) 93.0 Dropout (Average of 2003-2004 and 2004-2005) 93.1
Student Behavior Index Score 93.1
Rating Index Score Range Exceptional 96.0 or higher Strong 94.0 – 95.9 Satisfactory 92.0 – 93.9
Student Behavior Ratings
Low 89.0 – 91.9 Unacceptable less than 89.0

Page 37
Calculating the Improvement Index Score: High School Improvement in Assessments, Attendance, Dropout
Step 1. Calculating the Reading Assessment Improvement Index Score The Assessment Improvement Index Score reflects improvement in performance on Reading and Math Knowledge and Skills statewide assessments during the past four school years.
Reading
The formula for the Improvement Index Score is
Improvement Index Score = (.8 * Assessment Improvement Index Score) + (.2 * Attendance Improvement Index Score)
We will calculate the Improvement Index Score through the following steps:
Step 1. Calculate the Reading Assessment Improvement Index Score Step 2. Calculate the Math Assessment Improvement Index Score Step 3. Calculate the Average Assessment Improvement Index Score Step 4. Calculate an Attendance Improvement Index Score Step 5. Calculate a Dropout Improvement Index Score Step 6. Combining for an Average Attendance/Dropout Improvement Index Score Step 7. Calculate a Total Improvement Index Score Step 8. Compare the Total Improvement Index Score to the table for an Improvement rating
School Year
Assessment Index Score Averages Difference
2005-2006 75.3 2004-2005 and 2005-2006
78.3 Between
2004-2005+ 2005-2006
AND
2002-2003 +2003-2004
2004-2005 81.3
2003-2004 77.0
2002-2003 74.8
Reading Assessment Improvement Index Score 2.4
2002-2003 and 2003-2004
75.9

Page 38
The Reading Assessment Improvement Index is calculated by following the steps below.
• Calculate a Reading Assessment Index Score for the four school years 2005-2006, 2004-2005, 2003-2004, and 2002-2003 using the same procedures as discussed previously.
• Add the Reading Assessment Index Score2005-2006 and the Reading Assessment Index Score2004-2005.
• Divide the sum by 2 for an average index for those two years. Round to one decimal place. • Add the Reading Assessment Index Score2003-2004 and the Reading Assessment Index
Score2002-2003. • Divide the sum by 2 for an average index for those two years. Round to one decimal place. • Subtract the two average index scores. This is the amount of improvement or difference
during the four years. Step 2. Calculating the Math Assessment Improvement Index Score The same procedure is used to calculate the Math Assessment Improvement Index Score using results from the Math Knowledge and Skills assessments.
Math
School Year
Assessment Index Score Averages Difference
2005-2006 84.3 2004-2005 and 2005-2006
85.6 Between
2004-2005 +2005-2006
AND
2002-2003 +2003-2004
2004-2005 86.9
2003-2004 84.0
2002-2003 82.4
Math Assessment Improvement Index Score 2.4
2002-2003 and 2003-2004
83.2

Page 39
Step 3. Calculating the Average Assessment Improvement Index Score The Average Assessment Improvement Index Score is the average of the Improvement Index Scores for Reading and Math Knowledge and Skills. The Average Assessment Improvement Index Score is calculated by following the steps below.
• Add the Reading Assessment Improvement Index Score and the Math Assessment Improvement Index Score.
• Divide by 2. • Round to the nearest tenth of a point.
Step 4. Calculating the Attendance Improvement Index Score The Attendance Improvement Index score reflects improvement in attendance over the past four school years. It is calculated by comparing the average of the two most recent years to the average of the previous two years.
School Year
Attendance Index Score Averages Difference
2005-2006 93.4 2004-2005 and 2005-2006
93.0 Between
2004-2005 +2005-2006
AND
2002-2003 +2003-2004
2004-2005 92.6
2003-2004 90.2
2002-2003 88.5
Attendance Improvement Index Score 3.6
2002-2003 and 2003-2004
89.4
Average Assessment Improvement Index Score Content Area Index Score
Reading Assessment Improvement 2002-2003 to 2005-2006 2.4
Math Assessment Improvement 2002-2003 to 2005-2006 2.4
Average Assessment Improvement Index Score 2.4
Page 40
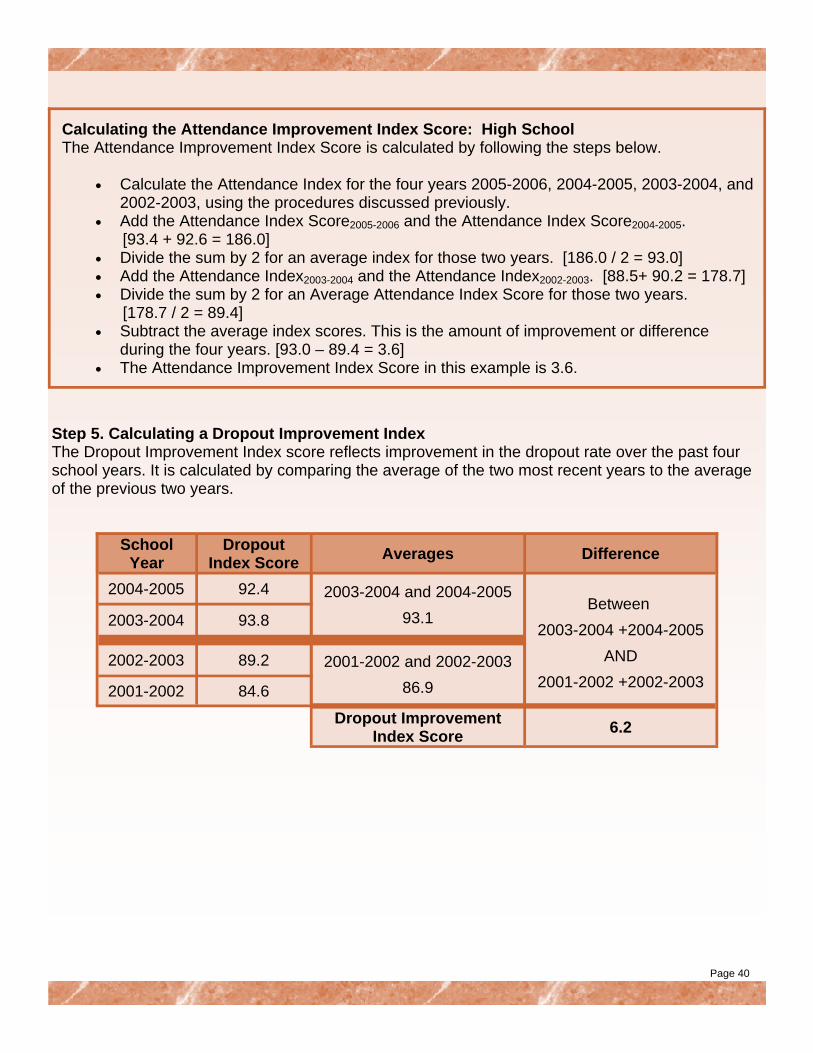
Step 5. Calculating a Dropout Improvement Index The Dropout Improvement Index score reflects improvement in the dropout rate over the past four school years. It is calculated by comparing the average of the two most recent years to the average of the previous two years. School
Year Dropout
Index Score Averages Difference
2004-2005 92.4 2003-2004 and 2004-2005
93.1
Between
2003-2004 +2004-2005
AND
2001-2002 +2002-2003
2003-2004 93.8
2002-2003 89.2
2001-2002 84.6
Dropout Improvement Index Score 6.2
2001-2002 and 2002-2003
86.9
Calculating the Attendance Improvement Index Score: High School The Attendance Improvement Index Score is calculated by following the steps below.
• Calculate the Attendance Index for the four years 2005-2006, 2004-2005, 2003-2004, and
2002-2003, using the procedures discussed previously. • Add the Attendance Index Score2005-2006 and the Attendance Index Score2004-2005. [93.4 + 92.6 = 186.0] • Divide the sum by 2 for an average index for those two years. [186.0 / 2 = 93.0] • Add the Attendance Index2003-2004 and the Attendance Index2002-2003. [88.5+ 90.2 = 178.7] • Divide the sum by 2 for an Average Attendance Index Score for those two years. [178.7 / 2 = 89.4] • Subtract the average index scores. This is the amount of improvement or difference
during the four years. [93.0 – 89.4 = 3.6] • The Attendance Improvement Index Score in this example is 3.6.

Page 41
Step 6. Combining the Attendance Improvement Index Score and the Dropout Improvement Index Score
Attendance/Dropout Improvement Index Score= (Attendance Improvement + Dropout Improvement) / 2 (3.6 + 6.2) / 2 = 4.9
Step 7. Calculating the Total Improvement Index Score The Total Improvement Index combines the assessment improvement and attendance improvement. Step 8. Comparing the Total Improvement Index Score The Total Improvement Index Score as 2.9. Compare the Total Improvement Index Score of 2.9 to the table below to determine the rating for Improvement. For this example, the school has earned an Improvement Rating of Stayed About the Same.
Calculating the Dropout Improvement Index Score: High School The Dropout Improvement Index Score is calculated by following the steps below.
• Calculate the Dropout Index for the four years 2004-2005, 2003-2004, 2002-2003, and
2001-2002 using the procedures discussed previously. • Add the Dropout Index Score2004-2005 and the Dropout Index Score2003-2004. [92.4+ 93.8 = 186.2] • Divide the sum by 2 to get an average index score for those two years. [186.2 / 2 = 93.1] • Add the Dropout Index Score2002-2003 and the Dropout Index Score2001-2002. [89.2 + 84.6 = 173.8] • Divide the sum by 2 to get an average index score for those two years. [173.8 / 2 = 86.9] • Subtract the average index scores. This is the amount of improvement or difference
during the four years. [93.1 – 86.9 = 6.2] • The Dropout Improvement Index Score in this example is 6.2.
Element Index Score Weight Weighted
Index Average Assessment Improvement 2.4 x .8 = 1.9
Average Attendance/Dropout Improvement 4.9 x .2 = 1.0
2.9 Total Improvement Index Score
Improvement Ratings
Rating Improvement Index Score Range
Improved 5.0 and higher Stayed About the Same -4.9 – + 4.9 Declined -5.0 and less

Page 29
Calculating the School Characteristics Index Score: High School The School Characteristics Index Score is based on the percentage of eligible students that participated in the Oregon Statewide Assessments in the most recent year.
Step 1: Calculating the Participation Rate Use the report card definition of participation below. Include participation for each student enrolled on the first school day in May for each assessment included in the rating:
• Grade 3, 5, 8, 10: Reading/Literature and Math Knowledge and Skills • Grades 4, 7, and 10: Writing
Number of Participating tests in reading, mathematics, and writing DIVIDED BY Expected Number of Participating tests in reading, mathematics, and writing —Number tests from students that were ineligible for testing
Participation rate = Number of participating tests/(expected number of participating tests - number of ineligible student tests) 192/(201-1) = 96.0% Remember to exclude from the expected number of tests any student that was enrolled on the first school day in May but was not tested and was not enrolled during the school’s test window. Step 2: Comparing the School Characteristics Index Score The Participation Rate in the example is 96.0%. For the example, the school earned an Exceptional School Characteristics rating.
School Year Participation Rate
2005-2006 96.0
School Characteristics Index Score 2005-2006 = Participation Rate
School Characteristics Rating Rating Participation Rate
Exceptional 94.5% and higher Low 89.5% - 94.4% Unacceptable Less than 89.5%

Page 43
Calculating the Overall School Rating: High School
Method 1: Weighted Average Method In the example above, we calculated that the school received a Student Performance rating of Satisfactory and a Student Behavior rating of Satisfactory. The Improvement rating was Stayed About the Same and the School Characteristics rating was Exceptional. Please refer to page 16 for rating scores that correspond to the ratings earned by the example school.
Compare the Overall Rating Index Score of 2.0 to the table below. The Overall Rating Index Score of 2.0 is converted into an Overall rating of Satisfactory. Method 2: Matrix Method The Overall rating can also be determined by using the Overall Rating Matrix. To use this method, identify the row that matches the school ratings for Student Performance, Student Behavior, and Improvement. The full matrix of possible ratings is given beginning on page 17.
In this example case, the fourth row of the matrix correctly matches the ratings for the school. The Overall rating associated with that row is Satisfactory. However, if the school had received a rating of Low or Unacceptable in School Characteristics, the Overall rating would have been Low or Unacceptable.
Component Index Score Rating Rating
Score Weight Total
Student Performance 81.0 Satisfactory 2 .80 1.6 Student Behavior 93.1 Satisfactory 2 .20 0.4 Improvement 2.9 Stay about the same 0 1 0.0
2.0 Overall Rating Index Score
Rating Index Score Range Exceptional 4.0 and above Strong 3.0 – 3.9 Satisfactory 1.5 – 2.9 Low 1.0 – 1.4 Unacceptable less than 1.0
Overall Rating
Overall Rating
Student Performance
Student Behavior Improvement
Satisfactory Low Exceptional Declined Satisfactory Low Strong Stayed about the Same Satisfactory Satisfactory Satisfactory Declined Satisfactory Satisfactory Satisfactory Stayed about the Same Satisfactory Low Strong Declined

X. Resources and Background Materials
There are many Oregon School Report Card resources available. Most of these can be accessed at http://www.ode.state.or.us/search/results/?id=116. There are also many links to other resources at the ODE website. Please contact (503) 378-3600 if you would like hardcopies of the following items:
1. The ODE report card website contains all past editions of school and district report cards http://www.ode.state.or.us/data/reportcard/reports.aspx 2. The 1999 Legislation that created the Oregon School Report Card http://www.leg.state.or.us/99reg/measures/sb1300.dir/sb1329.en.html 3. The Oregon Administrative Rules that describe the report card ratings http://arcweb.sos.state.or.us/rules/OARS_500/OAR_581/581_022.html 4. National research that summarizes the public expectations for school report cards http://counts.edweek.org/sreports/qc99/opinion/edweekresults.pdf 5. A communications toolkit prepared by OSBA for districts and schools http://www.osba.org/hotopics/rptcard/index.htm 6. How to Read the Oregon School and District Report Cards http://www.ode.state.or.us/search/results/?id=273 7. Information on the Oregon Statewide Assessments http://www.ode.state.or.us/search/results/?id=169 8. NCLB Non-Regulatory Guidance on School, District, and State Report Cards http://www.ed.gov/programs/titleiparta/reportcardsguidance.doc
Page 44