oregon learns d. toran, president and chief executive officer of volunteers of america - oregon and...
TRANSCRIPT

Oregon Learns Report to the Legislature from the Oregon Education Investment Board December 15, 2011

OREGON LEARNS
Report to the Legislature from the Oregon Education Investment Board
Cover Photo Credits: Portland Public Schools: Vestal K-8 School Oregon Department Of Education: Clark Elementary School, Portland Public Schools Oregon Department Of Education: Forest Grove High School, Forest Grove School District Community Colleges and Workforce Development Department

OEIB Report to the Legislature | December 2011 i
Acknowledgements and Outreach
The Oregon Legislature established the Oregon Education Investment Board (OEIB) by passing Senate Bill 909 in June 2011, “for the purpose of ensuring that all public school students in this state reach the education outcomes established for the state. The board shall accomplish this goal by overseeing a unified public education system that begins with early childhood services and continues throughout public education from kindergarten to post-secondary education.”(Full legislation in Appendix 1.)
Members were formally confirmed by the Oregon Senate in November. The short timeline since then understates the many months and the broad participation that went into the creation of this plan and report—starting a year ago with the Governor’s transition teams on early childhood and family investment, K-12, and post-secondary education—and continuing with these additional precursors to the OEIB, including:
• The Oregon Education Investment Team, created by executive order, which met from February to September of 2011,
• The Early Learning Design Team, which met from March through June 2011, • The Education Budget Design Team, which met from April to August 2011, and • The Senate Bill 909 Work Group, including the nominees to the OEIB, which met
from September through November prior to confirmation.
Each of those groups met publicly, solicited feedback from stakeholders and the public and posted their materials and reports on the Governor’s Office website.
Outreach by the Governor, members of the OEIB and Early Learning Council, and the Governor’s Office staff has taken them to communities across Oregon, where they have heard from teachers, professors and educators at every level; visited schools, daycare centers, and colleges; and met with members of statewide organizations. News coverage in dozens of papers has highlighted the issues, and a survey on K-12 student achievement and accountability has attracted 6,000 responses. Public testimony has been taken at regular OEIB meetings, which are streamed live on the web, with video posted later. (See Appendix 2 for a summary of community engagement and communications efforts, and the Early Learning Council report for more detail on the broad stakeholder engagement behind its recommendations.)
Outreach will continue in December and January, with targeted engagement of communities around the waiver application for flexibility under the federal Elementary and Secondary Education Act, and with community meetings around the achievement compacts and education investment strategies.
This engagement has underscored the necessity of staging our work—laying out a thoughtful and deliberate integration of our educational institutions into one coordinated public education system. This report presents the first phase of our plan, with legislative action proposed for the February 2012 session, and outlines the next phase, which will be brought to the Legislature in 2013 for full implementation in the following biennium.

OEIB Report to the Legislature | December 2011 ii
The Oregon Education Investment Board
Under Senate Bill 909, Governor John Kitzhaber chairs the Oregon Education Investment Board. The 12 additional members, nominated by the Governor and confirmed by the Oregon Senate on November 18, are:
Richard C. “Dick” Alexander, Bank Board Chair of Capital Pacific Bank, entrepreneur, Board member of the Children’s Institute, leader in the Ready for School campaign to ensure early childhood success and member of the Early Learning Council
Julia Brim-Edwards, Director for U.S. states/global strategy for NIKE, Inc., Government and Public Affairs, Co-Founder of the NIKE School Innovation Fund, and former Co-Chair of the Portland School Board
Dr. Consuelo Yvonne Curtis, Superintendent of Forest Grove School District and former member of Oregon Quality Education Commission for eight years
Matthew W. Donegan, Co-President of Forest Capital Partners and President of the Oregon State Board of Higher Education
Dr. Samuel D. Henry, professor at Portland State University, former Chair of the Oregon Commission on Children and Families, and member of the Oregon Board of Education
Nichole Maher, Executive Director of the Native American Youth and Family Center in Portland and Co-Chair of the Communities of Color Coalition
Dr. Mark Mulvihill, Superintendent of InterMountain Education Service District in Pendleton and member of the Oregon Quality Education Commission and the Vision and Policy Superintendent Task Force
David Rives, President of the American Federation of Teachers-Oregon and teacher of English to speakers of other languages at Portland Community College
Ron Saxton, Executive Vice President and Chief Administrative Officer of JELD-WEN Inc., and former Chair of the Portland School Board
Dr. Mary Spilde, President of Lane Community College and Co-Chair of the Post-Secondary Quality Education Commission
Kay D. Toran, President and Chief Executive Officer of Volunteers of America - Oregon and Board member of the Oregon Community Foundation, University of Portland, and Chalkboard Project
Johanna "Hanna" Vaandering, Vice President of the Oregon Education Association, Elementary Physical Education teacher, and Chair of the OEA Foundation
Dr. Nancy Golden, Superintendent of Springfield Public Schools, serves as chair in the Governor’s absence.

OEIB Report to the Legislature | December 2011 iii
Contents
Acknowledgements and Outreach .......................................................................... i The Oregon Education Investment Board .............................................................. ii
Executive Summary ....................................................................................................... 1!Key Strategies .......................................................................................................... 2!Work Underway ........................................................................................................ 3!Legislation for 2012 ................................................................................................ 3!Plans for 2013-15 ................................................................................................... 4!
1. The Challenge and Our Goal ..................................................................................... 1!An Urgent Challenge ................................................................................................ 1!The Long-Term Goal ................................................................................................ 4!
What It Will Take ............................................................................................... 6!Outcomes ............................................................................................................... 11!Challenges and Shortcomings .............................................................................. 13!Principles ................................................................................................................ 17!
2. Strategies to Build an Education System Focused on Student Success ............. 19!Strategy 1: Create an Integrated, Aligned System from Pre-K to College and Career Readiness .................................................................................................. 20!Strategy 2: Focus Education Investments on Outcomes .................................... 23!
A New Budgeting Paradigm ............................................................................ 23!Outcomes and Indicators ............................................................................... 27!Early Learning .................................................................................................. 28!Achievement Compacts .................................................................................. 29!Local Control and Mandate Relief ................................................................. 30!Budget Redesign ............................................................................................. 31!
Strategy 3: Build System-wide Standards, Guidance, and Support ................... 32!Standards and Assessment ........................................................................... 32!The Longitudinal Data System ....................................................................... 33!Guidance and Support .................................................................................... 35!
3. Best Next Steps to Student Success ...................................................................... 38!Phase One .............................................................................................................. 39!
Early Learning .................................................................................................. 39!Achievement Compacts .................................................................................. 40!Federal ESEA Flexibility Waiver ...................................................................... 41!K-12 Regulatory Relief .................................................................................... 41!Chief Education Officer ................................................................................... 42!Student Longitudinal Data System Development and Application .............. 42!

OEIB Report to the Legislature | December 2011 iv
2012 Legislation ............................................................................................. 43!Phase Two .............................................................................................................. 44!
Streamlining and Consolidation of Governance Functions .......................... 44!Institutional Boards at Universities ................................................................ 45!Outcomes-based Budgeting for 2013-15 ..................................................... 45!Early Childhood System Implementation ...................................................... 46!An Agenda for Excellence ............................................................................... 46!Toward a Truly Successful Education System – And the Promise It Offers 48!
Appendices: 1) 2011 Legislation
a. Senate Bill 909 b. Senate Bill 253
2) Summary of Outreach and Communications 3) Chief Education Officer Job Description 4) Public Education Budget Data
a. P-20 b. Early Learning
5) Sample Achievement Compacts a. K-12, from Confederation of Oregon School Administrators b. K-12, from SB 909 Work Group’s Outcome-Based Investment Work
Team 1. Narrative 2. Achievement compact
c. Educational Service District submitted by Oregon Association of ESDs 1. Regional achievement compact 2. Regional operations efficiency compact
d. Community colleges, from the Community Colleges and Workforce Development Department
e. Oregon University System, submitted by the Chancellor’s Office 6) Data System Development Memo 7) Education Fact Sheets: PreK, K-12, CC, OUS 8) Glossary 9) Supplemental Notes for Figures and Table
10) Corrections

OEIB Report to the Legislature | December 2011 1
Executive Summary
Never has education been more important to the lives and fortunes of Oregonians and our communities. Yet Oregon is falling behind. Our current generation of young adults—ages 25-34—is less educated than their parents’ generation, with fewer earning a certificate or degree beyond high school. And almost a third of our students are failing to graduate with a regular diploma after four or even five years in high school.
These are troubling trends, made all the more challenging by increasing rates of poverty among households with children and persistent achievement gaps for children of color.
But there are encouraging signs of progress in schools throughout the state. At every level of education in Oregon, leaders and teachers are pioneering new practices that have enabled students to achieve their potential as lifelong learners and contributors to our economic and civic life. We need to connect these examples of excellence to create a culture of excellence across the system.
The 2011 Oregon Legislature addressed these challenges and opportunities head on, marshalling strong bipartisan majorities to enact:
• Senate Bill 253, which established the most aggressive high school and college completion goals of any state in the country; and,
• Senate Bill 909, which called for the creation of a unified, student-centered system of public education from preschool through graduate school (P-20) to achieve the state’s educational outcomes.
SB 253 defines our goal: by 2025, we must ensure that 40 percent of adult Oregonians have earned a bachelor’s degree or higher, that 40 percent have earned an associate’s degree or post-secondary credential, and that the remaining 20 percent or less have earned a high school diploma or its equivalent. We refer to these targets as our “40/40/20” goal.
SB 909 created the Oregon Education Investment Board (OEIB) and charged us, its members, with the responsibility of “ensuring that all public school students in this state reach the education outcomes established for the state.” It directed us to report to the legislature with recommendations for the February 2012 legislative session.
The reference to “all public school students” in SB 909 is central to our mission and essential to the achievement of our 40/40/20 goal. Children of color are the fastest growing demographic group in Oregon. We must address and overcome the barriers that too often deter students of color and those from economically disadvantaged backgrounds from achieving success in our education system. By doing so, we can accelerate progress to our goal. Indeed, we cannot get there otherwise.
This report summarizes where we are today and how much of a stretch it will be to reach the state’s educational goals. It identifies critical elements and strategies, and proposes decisions for the Legislature to consider in 2012. It describes excellent

OEIB Report to the Legislature | December 2011 2
educational practices in place today and proposes new ideas for improving student success in the future. And it outlines the next steps that will allow the state to invest in better outcomes for learners.
The sense of urgency that motivated the passage of Senate Bill 909 animates this report as well. If we are to fulfill the promise of educational opportunity and keep pace with the world around us, we must find ways to improve the teaching and spark the learning of all students, now and every year hereafter.
Key Strategies
Our plan is founded on three key strategies.
1. Create a coordinated public education system, from preschool through college and career readiness, to enable all Oregon students to learn at their best pace and achieve their full potential. At the state level, this will require better integration of our capacities and smarter use of our resources to encourage and support successful teaching and learning across the education continuum.
2. Focus state investment on achieving student outcomes. We define the core educational outcomes that matter for students, their families, and our state:
• All Oregon children enter kindergarten ready for school • All Oregonians move along the learning pathway at their best pace to success • All Oregonians graduate from high school and are college and career ready • All Oregonians who pursue education beyond high school complete their
chosen programs of study, certificates, or degrees and are ready to contribute to Oregon’s economy
These will drive our investment strategies, as we ask ourselves how to achieve the best outcomes for students. In turn, we must provide educators with the flexibility, support, and encouragement they need to deliver results. That mutual partnership—tight on expected outcomes at the state level, loose on how educators get there—will be codified in annual achievement compacts between the state and its educational entities.
3. Bui ld statewide support systems. The state will continue to set standards, provide guidance, and conduct assessments, coordinated along the education pathway. To enhance these efforts, SB 909 commits the state to build a longitudinal data system—tracking important data on student progress and returns on statewide investments from preschool through college and into careers. These data will help guide investment decisions and spotlight programs that are working or failing. As this system is integrated with school-based systems, it will enable teachers to shape their practice and students and families to take charge of their education. Beyond data systems, we envision the state will expand on the successful local model of professional learning communities to increase support for collaboration among educational entities and their educators. And we look forward to new efforts that will bridge the gaps that now exist between classrooms and community service providers,

OEIB Report to the Legislature | December 2011 3
as the state and local governments work to coordinate health and human services with the needs of students and their families.
Work Underway
Our plan to meet Oregon’s new education goals begins today. The remaining 18 months of this biennium will be the foundation-building period for improving teaching and learning across the education continuum.
We have developed a demanding job description for the state’s new Chief Education Officer. We have launched a national search to fill that position. And we will ask the 2012 Legislature to give the Chief Education Officer the authority that leader will need to draw on the resources and capacities of the state’s education agencies to organize a newly integrated state system of education from preschool to college and careers. (See “Legislation for 2012.”)
We will also ask the 2012 Legislature to authorize new initiatives to better organize, connect, and upgrade a diversity of programs now serving infants and early learners, beginning in July 2012.
Every year about 45,000 children are born in Oregon. Roughly 40 percent of these children are exposed to a well-recognized set of socio-economic, physical, or relational risk factors that adversely impact their ability to develop the foundations of school success. These include poverty, unstable family backgrounds, substance abuse, criminal records, and negative peer associations. Moreover, Oregon’s history of delivering results for children of color is particularly disappointing, as exhibited in the well-known “achievement gap.”
SB 909 created the Early Learning Council under the OEIB to improve learning outcomes for children through the age of five. As part of this effort, the Council will inaugurate the use of kindergarten readiness assessments to better align early learning with the goal of having young children enter kindergarten ready for school, beginning with eight to 12 pilot projects in 2012-13.
At the same time, we will start receiving measures of the state’s return on investments in early childhood and K-12 from the implementation of a new longitudinal data system. This system will be built out over time to form the backbone of a coordinated information system to guide state investments and support all learners from preschool to graduate school.
Legislation for 2012
Our Board has approved and describes herein two packages of legislation for the February 2012 session.

OEIB Report to the Legislature | December 2011 4
1. Organize a High-Functioning and Well -Coordinated System of Early Chi ldhood Programs
• Transfer programs operated by the state Commission on Children and Families (Healthy Start, Great Start, Relief Nurseries, and Home Visiting) and the Child Care Commission under the Early Learning Council.
• Establish a Youth Development Council under the OEIB and transfer all functions of the Juvenile Crime Prevention Advisory Committee and Juvenile Justice Advisory Committee.
• Remove all statutory requirements currently imposed on counties related to county Commissions on Children and Families, including requirements for establishment, operation, membership, and planning.
• Establish accountability hubs to serve as administrative agents for coordination of early learning services across Oregon, beginning July 1, 2012.
2. Organize a System of Accountabi l i ty and Support to Ensure Student Success from Pre-K to Col lege and Career Readiness
• Achievement Compacts: Beginning in the 2012-13 school year, we propose to have in place a system of achievement compacts that will engage all educational entities in the state in a coordinated effort to set goals and report results focused on common outcomes and measures of progress in all stages of learning and for all groups of learners. These achievement compacts will become new partnership agreements with our educational institutions, and living documents that will continue to evolve and improve over time. These achievement compacts will enable us to: o Foster communication and two-way accountability between the state and
its educational institutions in setting and achieving educational goals; o Establish a mechanism to foster intentionality in budgeting at the local
level, whereby governing boards would be encouraged to connect their budgets to goals and outcomes; and,
o Provide a basis for comparisons of outcomes and progress within districts and between districts with comparable student populations.
• Chief Education Officer: Give the Chief Education Officer the authority needed to organize the state’s integrated P-20 education system from pre-K to college and careers.
Plans for 2013-15
During 2012 and in preparation for the 2013 Legislative Assembly, we will:
• Work with the Chief Education Officer to reorganize and focus state resources and management systems on the needs and priorities of the P-20 system, streamline governance and administration, arrive at one entity for the direction and coordination of the university system, develop legislation for independent boards for universities that opt to establish them, and free up resources to better support teaching and learning;

OEIB Report to the Legislature | December 2011 5
• Develop budget models for the 2013-15 biennium that provide sustainable baselines of funding for all educational entities and investment models that encourage innovation and reward success;
• Continue to reach more of our neediest children and prepare them to enter kindergarten ready for school; and,
• Develop agendas for student success by promoting the expansion of best practices and pursuing promising new ideas to motivate students and engage communities.
Our hope is that this new direction for Oregon offers to the student, a promise; to the educator, an invitation to lead; to the taxpayers, a return on investment; and to legislators, employers, community leaders, and educational organizations, a new partnership for educational achievement in Oregon.

OEIB Report to the Legislature | December 2011 1
1. The Challenge and Our Goal
An Urgent Challenge
Never has education been more important to the lives and fortunes of Oregonians and our communities. Education cements shared values, enriches our culture, and expands the personal horizons of individuals. It advances family life, civic stability, and democratic ideals. It provides opportunity for all, no matter their race, home language, disability, or family income. And as knowledge and innovation become the prime capital in our global economy, education increasingly determines the fortunes of individuals, communities, and nations. To revitalize our Oregon economy, our workforce needs higher levels of knowledge and skills than ever before.
Yet Oregon is falling behind.
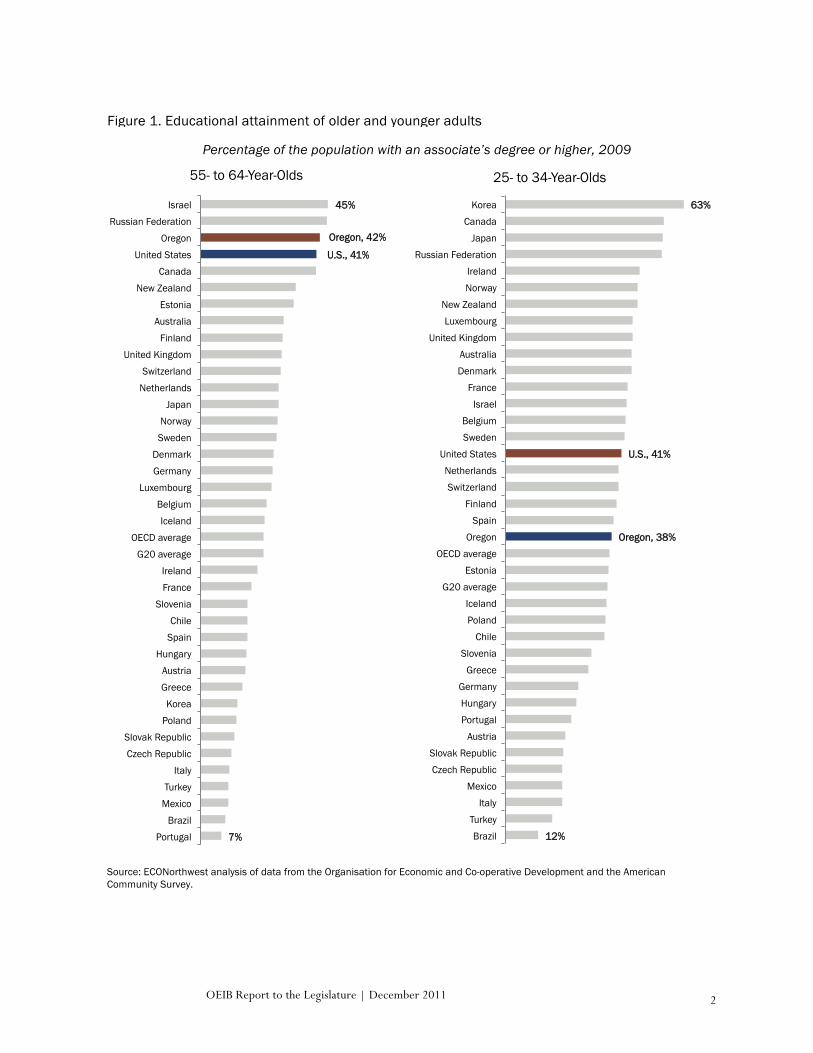
Our current generation of young adults—ages 25-34—is less educated than their parent’s generation, with fewer earning a certificate or degree beyond high school. In addition to being less educated than older Oregonians, they are less educated than the national average and are falling behind compared to other countries (see Figure 1).
And the next generation, those of school and preschool ages, also includes greater proportions of students of color and students from economically disadvantaged households whose current experience of public education results in lower achievement and completion rates. These changing demographics increase the urgency for improvement.
"Oregon has got to do better to keep up with our changing world. We want employers to know they can locate and grow in Oregon, and find highly skilled productive employees right here in our state. We want Oregon graduates to be ready to contribute to our state and to our economy, and we want them to feel confident that they are on the path to those careers that produce family wage jobs. And we envision an Oregon where our per capita income is driven back up above the national average, in every part of our state, urban and rural, and where we have erased the income disparity within our communities of color . . . . We will not get there if we hold tight to the status quo, set our sights low and continue to let school funding be the only statewide education debate that matters. The path forward in this new century requires innovation, requires the willingness to challenge assumptions, requires the courage to change."
— Governor Kitzhaber, State of the Schools speech, September 6, 2011
OEIB Report to the Legislature | December 2011 2
Figure 1. Educational attainment of older and younger adults
Source: ECONorthwest analysis of data from the Organisation for Economic and Co-operative Development and the American Community Survey.
63%
U.S., 41%
Oregon, 38%
12%
Korea Canada
Japan Russian Federation
Ireland Norway
New Zealand Luxembourg
United Kingdom Australia Denmark
France Israel
Belgium Sweden
United States Netherlands Switzerland
Finland Spain
Oregon OECD average
Estonia G20 average
Iceland Poland
Chile Slovenia
Greece Germany Hungary Portugal
Austria Slovak Republic Czech Republic
Mexico Italy
Turkey Brazil
25- to 34-Year-Olds
45%
Oregon, 42%
U.S., 41%
7%
Israel Russian Federation
Oregon United States
Canada New Zealand
Estonia Australia
Finland United Kingdom
Switzerland Netherlands
Japan Norway Sweden
Denmark Germany
Luxembourg Belgium Iceland
OECD average G20 average
Ireland France
Slovenia Chile
Spain Hungary
Austria Greece
Korea Poland
Slovak Republic Czech Republic
Italy Turkey
Mexico Brazil
Portugal
55- to 64-Year-Olds
Percentage of the population with an associate’s degree or higher, 2009
OEIB Report to the Legislature | December 2011 3
The 2011 Oregon Legislature faced this challenge head on, passing the most ambitious package of education reforms in 20 years. In Senate Bill 909, the Legislature called for the development of a coordinated system of public education—from preschool through graduate school—overseen by the Oregon Education Investment Board (OEIB) and a Chief Education Officer (see Appendix 1).
And in Senate Bill 253, the Legislature raised the bar for educational attainment in Oregon. By 2025, we must ensure that 40 percent of adult Oregonians have earned a bachelor’s degree or higher, that 40 percent have earned an associate’s degree or post-secondary credential, and that the remaining 20 percent or less have earned a high school diploma or its equivalent. We refer to these targets as our “40/40/20” goal.
To reach that goal, we must have the courage to change.
The high school graduates of 2025 start kindergarten next September; the college graduates of 2025 are already several years into elementary school. Improving Oregon’s educational achievement starts with them, and there is no time to waste.
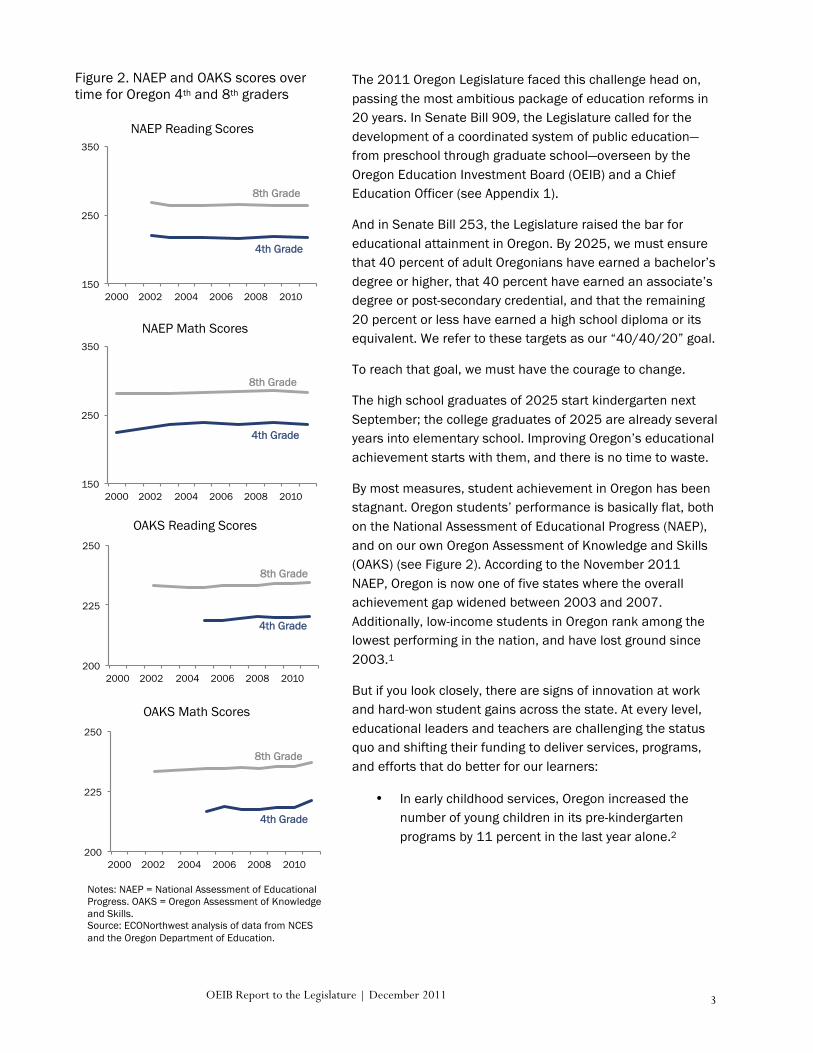
By most measures, student achievement in Oregon has been stagnant. Oregon students’ performance is basically flat, both on the National Assessment of Educational Progress (NAEP), and on our own Oregon Assessment of Knowledge and Skills (OAKS) (see Figure 2). According to the November 2011 NAEP, Oregon is now one of five states where the overall achievement gap widened between 2003 and 2007. Additionally, low-income students in Oregon rank among the lowest performing in the nation, and have lost ground since 2003.1
But if you look closely, there are signs of innovation at work and hard-won student gains across the state. At every level, educational leaders and teachers are challenging the status quo and shifting their funding to deliver services, programs, and efforts that do better for our learners:
• In early childhood services, Oregon increased the number of young children in its pre-kindergarten programs by 11 percent in the last year alone.2
Figure 2. NAEP and OAKS scores over time for Oregon 4th and 8th graders
200
225
250
2000 2002! 2004 2006 2008 2010
OAKS Math Scores
8th Grade
4th Grade
150
250
350
2000 2002! 2004 2006 2008 2010
NAEP Reading Scores
4th Grade
8th Grade
200
225
250
2000 2002! 2004 2006 2008 2010
OAKS Reading Scores
8th Grade
4th Grade
150
250
350
2000 2002! 2004 2006 2008 2010
NAEP Math Scores
4th Grade
8th Grade
Notes: NAEP = National Assessment of Educational Progress. OAKS = Oregon Assessment of Knowledge and Skills. Source: ECONorthwest analysis of data from NCES and the Oregon Department of Education.

OEIB Report to the Legislature | December 2011 4
• In our public schools, many districts have greatly increased their investment in practices such as early intervention, full-day kindergarten, and support for high school students to graduate and go on to college.
• In higher education, our community colleges and universities are increasingly investing in partnerships with high schools to offer dual credit, to provide first-in-their-family students with college opportunities, and to retain students through to graduation.
We have examples of excellence throughout our public education system—now we need to create a culture of excellence across the system.
This report summarizes where we are today and how much of a challenge it will be to reach the state’s educational goals. It identifies critical elements and strategies, and proposes decisions for the Legislature to consider in 2012. It describes excellent educational practices in place today—ones ripe for replication—and proposes new ideas for improving student success in the future. And it outlines the next steps that will allow the state to invest in better outcomes for learners. We
are committed to creating a true system of public education, one that sets Oregon’s students and communities on track to achieve the ambitious, yet critical, goals we have set for ourselves.
The Long-Term Goal
Oregon intends to become one of the best-educated populations in the world. The Oregon Legislature has set an ambitious goal to ensure that by 2025:
• 40 percent of adult Oregonians have earned a bachelor's degree or higher; • 40 percent of adult Oregonians have earned an associate’s degree or post-
secondary credential as their highest level of educational attainment; and • 20 percent of all adult Oregonians have earned at least a high school diploma,
an extended or modified high school diploma, or the equivalent of a high school diploma as their highest level of educational attainment.
Why aim so high? Oregon’s economy is shifting. We see dwindling numbers of well-paid jobs that require only a high school diploma—the millwork or manufacturing jobs of the past—and new jobs in this information age that increasingly demand post-secondary education. The shift in our Oregon economy is happening quickly: over the next decade, 61 percent of all Oregon jobs will require a technical certificate/associate’s degree or higher level of education, a proportion that is only going to accelerate by 2025. Today, Oregonians with associate’s degrees earn at least $5,000 per year more than those with high school diplomas, and those with bachelor’s degrees earn
Academic Advising and Multicultural Academic Success, University of Oregon
University of Oregon (UO) first-year students are all assigned to a faculty advisor and are also encouraged to work with professional advisors in the Offices of Academic Advising (OAA) and Multicultural Academic Success (OMAS), or, if eligible, advisors associated with specialized programs such as Pathway Oregon, McNair Scholars, TRiO, Undergraduate Support, Disability Services, and intercollegiate athletics.
UO has a faculty-mandated advising policy that requires all entering students to meet with an advisor prior to registration. The policy is strictly enforced and advising is part of the orientation program that precedes each term. In addition, advising is offered year-round by academic departments and by the programs listed above.

OEIB Report to the Legislature | December 2011 5
$17,000 per year more. And for Oregonians who strive for “family wage” jobs that pay more than $18 per hour, 89 percent of those jobs will require a technical certificate/associate’s degree or higher level of education.3 Students emerging into this market need skills and education to compete.
Employment rates in this difficult economy shine another light on the need for higher education: the national unemployment rate for adults with a college degree is 4.4 percent—half the 8.8 percent unemployment of those with only a high school diploma, and one third of the 13.2 percent unemployment rate for high school dropouts.4
But education is not just about improving one’s income or job security. Higher levels of education are associated with better health, longer lives, greater family stability, less need for social services, lower likelihood of involvement with the criminal justice system, and increased civic participation. All are benefits not only to the educated individual and his or her family, but also help support healthy, thriving communities across Oregon.
So we have a goal. Now we need to set a course to meet it. Oregon needs to substantially improve student success rates and performance among our own students, and we need to work intentionally and thoughtfully to meet the needs of
those students—whether from low-income families or communities of color—whom our education system has regularly failed. This will require a system transformation that highlights student success and progress from earliest learning to entry into workforce and career. The needed transformation has been set in motion through the creation of the OEIB, which is charged with ensuring that educational dollars are distributed to programs and practices where they have the most impact on student success.
To shrink from the challenge at hand is to accept that Oregonians will continue to fall farther behind and earn less than their fellow Americans. Right now, Oregonians as a whole are not sufficiently well educated: about 30 percent of working-age adults report that they have completed a bachelor’s degree or more, 18 percent have an associate’s degree or post-secondary certificate, 42 percent have only a high school diploma, and 10 percent have not completed a high school level program5 (see Figure 3).
(How do these figures square with the well-reported fact that only about two thirds of Oregon high school students now graduate with a regular diploma? These high school diploma figures above are higher for several reasons. They include other diplomas
Oregon’s 40/40/20 Goal
Notes: Working-age adults are 25-64 years old; young adults are 25-34 years old. Source: ECONorthwest analysis of data from the U.S. Census Bureau (American Community Survey), the Oregon Department of Education, and the National Student Clearinghouse.
10% 13%
42% 41%
20%
18% 17%
40%
30% 29% 40%
All working-age adults (2010)
Young adults (2010)
Goal (2025)
Bachelor's degree or higher
Associate's degree or credential
High school completion (regular, GED, other diplomas)
Less than high school
Figure 3. Current educational attainment of Oregon adults, versus the 40/40/20 goal

OEIB Report to the Legislature | December 2011 6
such as the GED, modified diplomas (for special education students), and adult high school diplomas granted through community colleges. Some adults end up earning their high school diploma well past the usual high school age. And the data include educated adults who have moved into Oregon and boost our population’s education levels.)
There are pockets in our state where far fewer Oregonians have high school degrees, and areas where our lack of progress is masked by better-educated new arrivals from other states. Work with our communities of color will play a key role in meeting our education goals. These communities are the fastest growing in the state—and those that experience the greatest disparities in educational outcomes. Intentional investment around student achievement for these populations is necessary if we are to achieve 40/40/20.
Projecting current rates of enrollment and degree completion into the future, and holding all else equal, attainment rates will likely remain relatively flat between now and 2025. So, absent a significant change in policy and investment, Oregon is likely to continue to have high school dropouts make up at least 10 percent of the adult population—at huge cost to those individuals and to our society. Absent significant change, we are headed for 30/18/42/10 rather than 40/40/20/0.
What It Will Take
According to the language of Senate Bill 253, by 2025 all adult Oregonians should hold degrees, certificates, and diplomas in the proportions stated.
This is going to take significant efforts on several fronts:
• Increasing the educational success of the more than 800,000 students6 now enrolled in Oregon’s public schools, community colleges, and universities.
• Intentionally and specifically addressing the effects of poverty, race, and ethnicity in our education system, where poor students and students of color do not now earn diplomas or degrees at the rates we need to reach 40/40/20.
• Supporting and encouraging additional education among those who wish to progress in their careers and those who need retraining to find work, particularly in these economic times.
• Reaching out to youth and young adults who have given up on education through our traditional educational institutions. Our institutions must continue to embrace those learners and find more flexible ways to meet their needs.
While a rigid interpretation of the legislation would imply a massive effort in adult education, we do not believe it was the law’s intent. We would have to push even older adults, perhaps at the ends of their working careers, into retraining, whether or not that benefited them or the state. We would also have to be concerned with whether newly arrived Oregonians met our goals for educational attainment. That rigid interpretation would apply the letter, but not the spirit, of the law.
Overall, our efforts must address both current students who are moving along the education pathway and those who return to traditional and non-traditional pathways to complete or update their educations. We will further develop our focus and priorities to

OEIB Report to the Legislature | December 2011 7
reach Senate Bill 253’s goals as part of a 40/40/20 plan to be undertaken by the Board in 2012.
Achieving this goal will challenge the will and capacity of all Oregonians. It will require the kind of commitment and investment that Oregon made in the 1950s and 1960s, when it dramatically increased the number of students in our university system and developed the community college system. And while strengthening the pipeline for young learners, we can and should expand adult education initiatives that are closely tied to economic development and workforce needs.
If by 2025 the state can tell the nation and the world that at least 40 percent of the emergent adult population has a university education, another 40 percent has a degree or credential that links to good jobs, and all 100 percent have earned a meaningful high school diploma, Oregon will have made major strides in educational success, with the corresponding benefits to our families, communities, and state economy.
Reaching the goal for high school diplomas
To reach 40/40/20 for young adults by 2025, the state must reduce its high school dropout rate to as close to zero as possible.
Graduation rates are a relatively new and still-muddled statistic, and Oregon, like most states, only adopted a true measurement a few years ago. Our “cohort” graduation rate tells us what percentage of students who entered our high schools—as freshman or as later arrivals—graduated on time, or in a fifth year. From that measure, we know that more than one in five students (21 percent) don’t graduate within five years with a regular diploma, a GED, or a modified diploma (see Figures 4 and 5). Some may well complete high school later in life, in their 20s or beyond. But we also know that staying in high school through to graduation—no matter how long it takes—gives a student far better odds of eventual success than dropping out and trying to catch up later.
To improve our graduation rates, we need to do important work at the district and school level—identifying which schools are beating the odds, which aren’t, and why.
Decades of research widely confirm that early investments are key to later educational success. Investing early and focusing on the basics should go a long way toward improving graduation rates in Oregon.
Middle and high schools also will have to be more rigorous about predicting the likelihood of dropping out on a student-by-student basis and understanding which conditions—inside and outside the school—raise the odds of graduation. Many students signal an intention to drop out well before they formally leave school. Chronic absenteeism (missing more than 10 percent of the school year) is one way they do that.
Figure 4. Five-year high school graduation rates of Oregon students, 2010
Source: ECONorthwest analysis of Oregon Department of Education data.
Regular HS diploma 69.1%
Adult HS diploma
0.5%
Modified diploma
1.8%
GED 7.6%
Non-completers
21.0%
OEIB Report to the Legislature | December 2011 8
Chronic absence rates start to pick up after elementary school and rise gradually into high school. Districts and schools need to monitor this early indicator, pinpoint why some students drop out, and offer them support to achieve learning goals.
Some of these students don’t even get captured in our dropout rates because they leave school before the ninth-grade starting point for those calculations. Oregon has a particular challenge with Native American, Latino, Slavic, and impoverished rural students dropping out of our school system in seventh and eighth grades. These students cannot simply be coaxed or dragged back to public school. They may require alternative strategies that meet them where they are and support them in charting education pathways that lead them to career and community fulfillment.
One size does not fit all. Many of our out-of-school youth—those who have left school temporarily or dropped out with no plans to return—might have been successful students in a different environment. Schools and organizations around the United States have experienced success with these students through culturally specific parent engagement, tailored attendance initiatives developed in community
partnerships, and robust tracking systems that identify challenges and embrace a wraparound mindset in matching public and private services to diverse student needs. To reach 40/40/20, we must offer alternative programs to re-engage these youth, ones that are culturally appropriate, offer relevant curriculum, and provide wrap-around supports to meet their needs.
Fostering post-secondary aspirations
Once students graduate from high school, many more of them need to enroll in college. By one estimate, Oregon ranks 47th among states in the share of high school graduates who head to college.7 If 80 percent of students are going to attain a post-secondary degree, almost all young students will have to aspire to post-secondary education. Today about half of students do. Oregon will have to tackle this “aspiration gap.”
One aspect of this challenge is that many of the new generation of students come from families with no college-going experiences. Oregon must work on this from all fronts. First, the state should work toward a wider definition of what achievement means, getting beyond the minimal standards on reading and math. Those are gateway skills, to be sure. But Oregon should reach beyond the gate to see the wider path to a range of knowledge and skills that line up with differentiated interests and aptitudes of students. College readiness extends well beyond content knowledge. Some students may fare reasonably well on standardized tests but lack academic habits—a mix of skill
Response to Intervention, Tigard-Tualatin School District
The Tigard-Tualatin School District is one of Oregon’s leading districts in the successful implementation of the Response to Intervention (RTT) program. Under RTI, Tigard-Tualatin provides early, effective assistance to children having difficulty learning to ensure that every student has mastered basic reading skills by the end of second grade. Tigard-Tualatin screens all students to identify struggling readers, and then seeks to prevent academic failure through early intervention, frequent progress measurement, and increasingly intensive researched-based instructional interventions for children who continue to struggle.
Since 2006 Tigard-Tualatin has raised student performance on OAKS reading tests at all grade levels, and has reduced its racial achievement gap by 36%.

OEIB Report to the Legislature | December 2011 9
and discipline—that they need to survive in a less supervised college environment. We need to support and encourage the development of more meaningful assessments of such higher-order thinking skills and academic behaviors, so that we may diagnose college readiness and make progress in college enrollment and persistence.
To reach our 40/40/20 goal, the state must be more strategic in instilling a college-going culture. If we expect 80 percent of young adults to move beyond the high school diploma, the post-secondary conversation will have to start early. Savings accounts issued at birth, college pennants in elementary schools, need-based aid agreements that start in middle school, targeted financial aid counseling, and pervasive exposure to college coursework in secondary schools could be powerful ways to increase attainment rates.
Boosting enrollment is a multi-faceted challenge that requires setting tuition within reach of all high school graduates and persuading a much larger share of learners that a post-secondary degree brings returns in the job market. State and local support of institutions is squeezed in lean times, and boards typically respond by raising tuition. Only by linking and integrating tuition flexibility within a clear state policy on affordability can we make sure that increases in tuition get matched by increases in aid to protect those least able to afford higher education. This is especially critical as rates of
poverty are on the rise among households with children and as the state’s per capita income continues to lag national averages.8
Retaining advanced learners
College retention rates must improve. The work of the Post-secondary Quality Education Commission (PSQEC) indicates the first and most important step to boost overall degree production is retention and completion of those who do start college.
To reach 40/40/20, we estimate we need to double the number of students who receive associate’s degrees and post-secondary certificates. It is hard to be precise for several reasons. The Census does not track post-secondary certificates or credentials, and the one Oregon survey that did was discontinued in 2008. Community colleges report that they are awarding about 5,000 certificates per year, but some of those go to learners who already have associate’s or bachelor’s degrees, and some people earn more than one certificate. And other, non-public employment training entities also issue certificates. Should they count? Which ones?
Beyond Lebanon High School
Beyond Lebanon High School (Beyond LHS) is a dual-enrollment partnership between Lebanon High School and Linn-Benton Community College. Now in its seventh year, Beyond LHS enrolls about 170 Lebanon students each year at Linn-Benton, where they earn high school and college credits simultaneously. Many of the students are non-traditional home-school students; a few are returning drop-outs. A coordinating counselor works with students “one at a time” to ensure they have education plans to suit their individual needs.
Lebanon High also offers students the opportunity to earn an “expanded high school diploma.” This program allows students to bypass Oregon’s standard high school graduation requirement of 24 credits and enroll at LBCC. Students earn the expanded diploma after earning 37 credits while simultaneously earning credits toward a college degree. About 80 students take advantage of the program each year. A high school counselor describes them as students ready to “step outside the four-year box.”

OEIB Report to the Legislature | December 2011 10
We must find ways to track our progress better—but even with limited data, it is clear that this 40 percent goal requires a stretch.
Community colleges serve a broad mission, offering opportunity to many students: those who want to complete their high school education as adults; those trying to fit college in around demands of family or work; lifelong learners who want to enrich their lives or improve their professional or technical skills; students looking for specific career training in a certificate or associate’s degree; to those looking to transfer to a four-year college and to many more.
But even among students who enter Oregon’s public community colleges full-time and seeking an associate’s degree, only 15 percent earn a degree within three years (see Figure 6). While statistics are debated at this level, few argue with the fact that far too many students are enrolled with no clear educational goal in mind. A significant share of Oregonians (26 percent by one measure9) has completed some college but did not earn a certificate or degree. Depending on the credits or coursework they have completed, the state might offer those individuals a way to apply for and receive a certificate or degree that matches the work completed, or to earn additional credits to take them the final step toward graduation.
Finally, Oregon needs to generate a third more bachelor’s degrees by 2025. Universities are on their way to achieve this ambitious goal, but they and our community colleges face several common challenges: offering classroom space and teaching staff to keep up with growing enrollment demand, falling behind on costly maintenance of aging campus buildings, improving affordability as state funding shrinks, and serving the rapidly growing population of students from low-income and minority families and families with no college-going experience.
Oregon’s public universities increasingly rely on graduate teaching assistants and part-time non-tenured faculty, and find that Oregon’s compensation rates can make it challenging to recruit and retain faculty in high-demand disciplines. Non-resident students are a growing proportion of the student population on many campuses as their higher tuition covers more than the direct costs of their education, thus helping to underwrite tuition for resident students.10
Now, roughly 60 percent of full-time students at Oregon’s public universities graduate within six years with their bachelor’s degree (see Figure 7). Improving the retention and eventual success of college students would decrease costs to students and the state and make better use of existing investments in facilities. (Students who leave without graduating spend their own money and the state’s resources without yielding a degree.) Expansion of online learning offers great potential in this regard. And success at lower levels of education—so that students are truly prepared for college—will greatly help the universities meet their goals.
Overall, the state will need both more educational capacity and better performance of the capacity it has.

OEIB Report to the Legislature | December 2011 11
Outcomes
Achieving the 40/40/20 goal will require a strong effort by learners, parents, educators, and local communities to improve educational outcomes at every stage of the continuum. This is not just a challenge for our students, our high schools, or our colleges—it is a challenge for the entire community.
Educator and author Linda Darling-Hammond cites “the high level of poverty and the low levels of social supports for low-income children’s health and welfare, including their early learning opportunities” as a major contributor to unequal and inadequate education outcomes in the United States.11
We need to set a course that motivates students to pursue their own education with dedication and persistence, no matter their race, home language, disability, or family income. We need to engage families in their children’s education, and community organizations and employers in supporting educational entities and their students. Our preschools, public schools, community colleges, and universities must reach out and help bridge the gaps for students, helping them along a seamless pathway to their success.
We must work together to support all Oregonians in achieving key state-level outcomes:
• All Oregon children enter kindergarten ready for school • All Oregonians move along the learning pathway at their best pace to success • All Oregonians graduate from high school and are college and career ready • All Oregonians who pursue education beyond high school complete their
chosen programs of study, certificates, or degrees and are ready to contribute to Oregon’s economy
These outcomes will drive necessary changes in policy and investment and will shape the state’s 10-year plan for education. But they also need to work at multiple levels—allowing individual learners to gauge their own progress, helping schools or colleges to judge their own teaching success, galvanizing communities around key outcomes, and challenging school districts or university systems to appraise their own performance and recalibrate their efforts. The boxes on the next page highlight current examples of efforts in Oregon to achieve or measure these outcomes.

OEIB Report to the Legislature | December 2011 12
Project GLAD, North Coast School Districts
Project GLAD is a professional development program for teachers in language acquisition and literacy. Developed by the Orange County, California Department of Education, Guided Language Acquisition Design (GLAD) engages children in listening, speaking, reading, and writing as they learn a variety of subjects like history and science. Under GLAD, students are guided through five sequential components in which they learn background information, participate actively in direct instruction, engage in team tasks, and exercise creative thinking.
With the support of the Oregon Community Foundation’s North Coast Leadership Council, over 85 teachers from Astoria to Tillamook participated in GLAD training, and then put it to work in their classrooms. Teachers called it the “best professional development experience” they have ever had, and testify that literacy skills are up, attendance is up, and behavioral referrals are down. Nationally, Project GLAD is initiating a comprehensive evaluation of program effectiveness. GLAD is a U.S. Department of Education “Project of Academic Excellence” and a California Department of Education “Exemplary Program.”
Clackamas Middle College, North Clackamas School District
Clackamas Middle College (CMC) is a four-year high school-college transition program that opened in 2003. Operating as a public charter school, CMC gives students opportunities to earn both high school and college credits simultaneously with the goal of earning a high school diploma, a transfer degree, or a certificate of completion.
Students begin in the College Prep Program on the CMC campus and transition to college classes through the Cohort and College Extended Options Programs at Clackamas Community College. CMC provides every student personalized teaching, counseling, and academic planning to build individual pathways to learning. Supports are provided to all students through an academic specialist, an in-school tutoring program, and weekly student achievement planning meetings. CMC staff work together using data to drive school improvement. CMC analyzes student demographics; school processes; staff, parent, and student perception data; and student learning data both in and out of the classroom.
To date, CMC has graduated over 400 students, all with college transcripts, college credits, and college transfer degrees or college certificates. Last year, 54% of CMC graduates earned as associate’s degree along with a high school diploma. Every student has graduated with at least 12 college credits. CMC currently enrolls 300 students in grades 9-12.
Youth Transition Program
The Youth Transition Program (YTP) prepares youth with disabilities for employment or career-related post-secondary education and training. A partnership between Oregon Vocational Rehabilitation Services, the Oregon Department of Education, and the University of Oregon, YTP currently serves youth with disabilities in 115 high schools in 55 school districts.
During the 2009-11 biennium, YTP provided transition services for 1,415 youth, and of those, 86% exited the program with a high school completion document, and 78% still were engaged in employment or post-secondary training 12 months after exit. YTP received a Best Practices Award from the Association of Maternal and Child Health Programs in 2010.
“Creating New Taxpayers,” Rogue Community College
Rogue Community College (RCC) President Dr. Peter Angstadt and his board are developing a different metric of institutional success. In addition to retention, transfer, and graduation rates, RCC is compiling data on job placements under a metric titled “Creating New Taxpayers.” According to the metric, RCC graduated 161 students this year into manufacturing, electronics, dentistry, and three other select fields, with a per hour wage range of $13-$24 and a combined annual income of about $6 million.

OEIB Report to the Legislature | December 2011 13
Challenges and Shortcomings
Oregon’s youngest children—the next generation who will be entering our public schools—face greater challenges to their learning than in the past:12
• Almost one in four (23 percent) of Oregonians under six years old live in poverty. Among African-American children, 46 percent live in poverty.
• More than one in four (29 percent) live in households where no English is spoken.
• More than one in three of our youngest Oregonians—37 percent—are students of color.
Poor children. English language learners. Racial and ethnic minorities. These are the groups who are least well-served by Oregon’s current public education system, and the challenge is only going to increase.
An examination of key points along the education continuum shows Oregon can and must do better.
Of the 45,000 children born in the state each year, an estimated 40 percent carry significant risk factors—ranging from family poverty and instability to parents engaged in substance abuse or criminal behavior.
Only two thirds of Oregon students graduate from high school in four years, and only about half of African American, Hispanic, and limited-English-proficient students meet that mark (see Figure 5). Add in those who earn GEDs, modified diplomas, or regular diplomas within a fifth year, and the overall graduation rate still stands at only 79 percent.
Only about half of Oregon’s high school graduates enroll immediately in college, even now with record high enrollments in Oregon’s public universities and community colleges. Low-income high school graduates are roughly one-third less likely to enroll in college immediately after graduation than their more advantaged peers (38 percent of low income students vs. 59 percent of students with higher family incomes).13
And of those who do enroll in college, too few continue on to earn a degree (especially in community colleges). Students of color and English language learners are even less likely to finish (see Figures 6 and 7).
Proficiency-based Teaching and Learning, Forest Grove School District
After Forest Grove High School (FGHS) moved to proficiency-based teaching and learning, with student evaluation based on performance on the recognized essential skills for each course, FGHS reached its highest graduation rate ever in 2008-09, raised students’ average scores on SAT and ACT tests, raised the value of scholarships to FGHS graduates from $1 million to $5 million, and raised the rate of FGHS graduates attending community colleges or universities from 40% to 70%.

OEIB Report to the Legislature | December 2011 14
Figure 5. Five-year high school graduation rates, by student characteristic, 2010
Source: ECONorthwest analysis of Oregon Department of Education data.
69.1%
72.4%
57.6%
80.7%
52.6%
55.4%
66.1%
53.8%
62.6%
74.2%
57.2%
70.3%
46.7%
72.6%
4.2%
3.2%
2.7%
2.9%
12.5%
7.6%
8.1%
5.4%
2.9%
8.8%
9.9%
9.3%
11.2%
8.9%
6.7%
2.6%
8.1%
6.8%
7.8%
79.1%
82.9%
64.6%
85.1%
65.9%
69.2%
78.8%
67.7%
74.9%
82.3%
61.8%
80.8%
66.2%
81.1%
All Students
White
Hispanic
Asian
Black
American Indian
Multi-Ethnic
Declined to State
Economically Disadvantaged
Not Economically Disadvantaged
Limited English Proficiency
English Proficient
Students with Disabilites
Students w/o Disabilities
Regular HS Diploma Adult HS Diploma Modified Diploma GED

OEIB Report to the Legislature | December 2011 15
Figure 6. Full-time students earning an associate’s degree within three years: Oregon community colleges vs. other states’ high and low rates
Source: Complete College America data, based on entry cohort starting fall 2004.
15.0%
15.4%
10.9%
5.8%
15.9%
0% 20% 40% 60% 80% 100%
All
White, Non-Hispanic
Hispanic
African American
Other
Figure 7. Full-time students earning a bachelor’s degree within six years: Oregon public universities vs. other states’ high and low rates
Source: Complete College America data, based on entry cohort starting fall 2002.
59.5%
60.1%
52.3%
45.7%
59.6%
0% 20% 40% 60% 80% 100%
All
White, Non-Hispanic
Hispanic
African American
Other

OEIB Report to the Legislature | December 2011 16
The Task Force on Higher Education Student and Institutional Success, created by House Bill 3418, has identified significant barriers to post-secondary education attainment, including inadequate high school preparation, support services such as advising and tutoring, support for career and technical education programs, data on students, management of transitions between institutions, faculty resources, physical infrastructure, and instructional equipment to meet students’ needs and students’ ability to pay.14
By most measures, Oregonians’ educational achievement is stagnant, the gaps for low-income learners and students of color are significant, and we are not meeting the needs of English language learners. The end results are not what we want, nor what we need to meet our goals.
It will take greater resources to reach our goals, and the constraints of our recovering economy are likely to be felt in the state budget for some time. In the last decade, Oregon’s per-student spending has fluctuated, but overall has dropped slightly compared to the standard inflation index (see Figure 8). However, over the last 20 years, increases in health insurance costs and the state’s PERS expenses have risen far faster than general inflation, hitting local school districts’ budgets. In addition, public schools are serving far greater numbers of low-income students, English language learners, and students with special needs—all of which drive up costs.
Figure 8. Oregon State School Fund per-student spending over time
$4,760
$8,054 in today's dollars
$4,310 in 1990 dollars
$0
$2,000
$4,000
$6,000
$8,000
$10,000
1990-91 1993-94 1996-97 1999-00 2002-03 2005-06 2008-09 2011-12
Actual dollars spent
Dollars spent adjusted for inflation
Note: Early years’ spending is actual and audited; final four years include budgeted figures. Source: Oregon Department of Education, State School Fund spending (state General and Lottery Funds, local property taxes) and student enrollment (full-time, unweighted). Inflation adjustment uses the Portland CPI from the U.S. Bureau of Labor Statistics.

OEIB Report to the Legislature | December 2011 17
But even as we work to improve education funding, we must work to improve education. We cannot afford to wait. Our students have one chance at their education. We must move forward with the resources we have. Only then can we determine how much progress we can make together and how much will require new resources. By investing for outcomes and improving educational practices, we will make the best case for more resources that will help us reach our goals.
Principles
Most states—and for the past decade the nation as a whole—have tried to get substantially better education results by defining the challenge strictly as a performance problem. Strategies have focused on tougher standards and specific consequences for inadequate yearly progress; today there are calls for evaluation systems to push principals and teachers to be more effective.
Simply put, the results have fallen short. Testing, largely for school accountability purposes, has consumed enormous amounts of time and money. Students disengage
from a narrowed curriculum, as relevant and motivating classes, projects, and opportunities disappear from constrained schools. Too many teachers, feeling blamed for broader societal trends, set back by budget reductions, and indicted by high-stakes standardized testing, report they are demoralized and disrespected. The post-secondary picture is not much brighter. Students struggle with higher tuition, often cannot schedule into overbooked courses they need, and are burdened with crushing debt loads. Faculty face steep competition for tenured positions, and must deal with pay freezes and long-term budget uncertainty.
As this next effort to improve educational outcomes begins, we must be clear about some of the core approaches that we believe will lead to greater success for Oregonians:
• Motivating learners and teachers. Performance will never rise enough unless and until the circumstances under which students experience school are designed to arouse their motivation, until funding and investments follow priorities, and until teachers have an environment in which they are supported to do what they do best, to try what they believe will work, and have both the authority and the accountability for getting better results. For performance to be better, the system must support motivation and talent among teachers
Closing the Achievement Gap, State Superintendent of Public Instruction, Susan Castillo
Each year, State Schools Superintendent Susan Castillo recognizes public schools for their significant progress in closing the achievement gap that separates low-income and minority students from their peers. The Department of Education uses a data screen to identify schools where student subpopulations (minority groups, students with limited English, special education students, etc.) make significant progress in relation to comparison groups.
Castillo notes that gains are often attributable to strong leadership, engaging families and communities, high-quality instruction, and high expectations for students. In 2011 Castillo recognized schools in the Tigard-Tualatin, Salem-Keizer, Forest Grove, David Douglas, Klamath County, and Woodburn School Districts for “continuing success” in closing gaps, and schools in the Portland, North Clackamas, Redmond, Grants Pass, Tigard-Tualatin, Salem-Keizer, and Woodburn School Districts for first-time recognition in closing gaps.

OEIB Report to the Legislature | December 2011 18
and students. It must overcome barriers such as fear of costs and uncertainty about the value and route to higher education for many Oregonians who could benefit the most from its opportunities.
• Committing to equity. Oregon must commit to success for all learners, including all racial and ethnic groups, economically disadvantaged students, English language learners, and students with disabilities. To meet our 40/40/20 goal, we need every group of learners to maximize their potential. We simply cannot meet our vision for Oregon if the most educated Oregonians remain disproportionately white, native English speakers, relatively affluent and without disabilities. The very promise of the American Dream, of opportunity available to all who strive for success, demands that we include all Oregonians in our goal, and that we very specifically and intentionally plan for an education system that meets our varied students’ needs equitably and effectively.
• Supporting high-quality teaching. Of all the in-school factors of a student’s
success, effective teaching is the most significant. Our education investment should support teachers, professors and all educators in doing their best work to raise student achievement, at every stage of their careers. These efforts should be aligned, including educator training and licensing or credentialing; recruiting, training and mentoring new teachers; and ongoing, meaningful performance evaluations and professional development opportunities for all educators.
• Promoting individualized learning. We recognize that all students learn at their own pace and that individualized teaching and learning helps students achieve their potential and creates a culture of lifelong learning for all Oregonians. Examples of excellence around the state—identified by graduation rates, statewide assessments, and success at the next level of learning—will provide helpful information about improving educational outcomes for all students.
Oregon Proficiency Project, Beaverton and Woodburn School Districts
With the support of the Center for Educational Leadership at the University of Washington, the Oregon Business Council and Employers for Education Excellence established the Oregon Proficiency Project in 2009. Education leaders conducted extensive field research to develop guiding principles for proficiency-based education, and provided intensive training and technical support in proficiency-based education at two pilot sites: Beaverton’s Health and Science School and Woodburn’s Academy of International Studies.
A by-product of the project is the establishment of a network of proficiency practitioners, both teachers and administrators, across Oregon.
OEIB Report to the Legislature | December 2011 19
2. Strategies to Build an Education System Focused on Student Success
The sense of urgency that motivated the passage of Senate Bill 909 animates this report as well. Every year that passes without further improvement means that one of every three high school students will leave school without a diploma, and another year that Oregon students will finish school with less education than their parents’ generation. If we are to fulfill the promise of educational opportunity and keep pace with the world around us, we must find ways to improve teaching, better meet the needs of students and families, and spark the learning of all students in every grade, now and every year hereafter.
Senate Bill 253 gives us the most ambitious high school and college completion targets of any state in the country and sets a deadline of 2025 to achieve them. But the trajectories needed to meet that deadline must begin at the earliest opportunity, with the 2012-13 school year. We are not hoping to find the end of an aspirational rainbow in 2025, we are determined to plot a path that takes us to new heights of student success.
Senate Bill 909, which charges our Board with the responsibility to meet the state’s educational goals, demands nothing less. That legislation asks us to bring forward action plans for improvements to our educational system that take effect as early as next July.
We have no time to lose. Every year between now and 2025 must be measured for success. But we must also be careful not to pursue hastily-conceived initiatives that distract us from charting the best path forward.
For these reasons, we begin with a focus on state level resources—the $7.4 billion in state dollars that flow to education, pre-K to college, in the current two-year budget—as we consider the state’s capacities to invest in, direct, coordinate, and support the missions of literally hundreds of educational entities from pre-K programs to school districts and colleges. We recognize that these educational entities and their employees are the key to our success. A command and control model will serve us poorly. We will need the engagement of educators and leaders, students and families, communities, and employers to achieve the educational excellence we envision for our students.
We know that excellence is achievable. Many of our schools are making progress despite the very real fiscal and social challenges they face today. If we as a state are able to sharpen our deployment of resources among our educational entities, promote collaboration, encourage innovation, establish clear measures of accountability for results, and lend assistance to their efforts, we believe we can build a system that moves all of our students forward to high school diplomas and to success in the colleges and careers of their choosing.

OEIB Report to the Legislature | December 2011 20
Our plan is founded on three key strategies.
1. Create a coordinated public education system, from preschool through college and career readiness, to enable all Oregon students to move at their best pace and achieve their full potential. At the state level, this will require better integration of our capacities to guide and support the activities of educational entities at the local level and smarter use of our resources to encourage and support teaching and learning across the education continuum.
2. Focus state investment on achieving student outcomes. We must define the core outcomes that matter in education. These will then drive our investment strategies, as we ask ourselves how to achieve the best outcomes for students. In turn, we must provide educators with the flexibility, support and encouragement they need to deliver results. That mutual partnership—tight on expected outcomes at the state level, loose on how educators get there—will be codified in annual achievement compacts between the state and its educational entities.
3. Build statewide support systems. The state will continue to set standards, provide guidance and conduct assessments, coordinated along the education pathway. To enhance these efforts, Senate Bill 909 commits the state to build a longitudinal data system—tracking important data on student progress and returns on statewide investments from preschool through college and into careers. This data will help guide investment decisions and spotlight programs that are working or failing. Then, as the state system is integrated with school-based systems, it will enable teachers to shape their practice, and students and families to take charge of their education. Beyond data systems, we envision the state will expand on the successful local model of professional learning communities to increase support for collaboration among educational entities and their educators. And we look forward to new efforts that will bridge the gaps that now exist between classrooms and community service providers, as the state and local governments work to coordinate health and human services with the needs of students and their families.
Each of these strategies is presented in greater detail below.
Strategy 1: Create an Integrated, Aligned System from Pre-K to College and Career Readiness
From the perspective of the student, Oregon’s education system should look like one system, not a disjointed collection of schools, learning centers, colleges, and universities. For learners to move further toward their potential, and for educational institutions to operate more effectively, we need integration and consistency in our standards, assessments, and data systems.

OEIB Report to the Legislature | December 2011 21
This does not imply centralization or consolidation of the educational organizations—quite the contrary. The state’s role will be one of coordination, holding all parties accountable to the overarching goals for students, but not infringing on local control as long as students are progressing. A strength of Oregon’s many and varied educational organizations is their ability to tailor their education to their local students’ and community’s needs and interests. Along with accountability for outcomes, educational entities under a coordinated system will have increased freedom in how to produce those outcomes.
A new understanding of achievement at every stage of learning—what it takes to move successfully along the education pathway—should apply to all Oregonians, from toddlers to those working toward college degrees and those seeking to acquire the skills they need to succeed in the job market.
Curriculum, assessments, and exit and entry criteria should be built into learning from the beginning and aligned so that learners advance as efficiently as possible.
Oregon is moving in the right direction:
• Common Core Standards—We are one of 45 states to adopt the national Common Core Standards for K-12, English language arts and mathematics, and Oregon is collaborating with other states to define science standards. These evidence-based standards specify what students should know and be able to do when they complete high school. They are designed to help ensure that all students have the essential concepts, knowledge, skills and behaviors they need to succeed in college and careers.
• The Oregon Diploma—The State Board adopted new high school graduation requirements in 2008 to better prepare students for success in college, work and as community members. To earn a diploma, students will need to complete successfully more stringent credit requirements and demonstrate proficiency in essential skills. For example, this year’s seniors must pass an assessment of reading skills in order to earn a diploma and graduate.
• Core Teaching Standards—At the direction of the 2011 Legislature under Senate Bill 290, the State Board of Education this month adopted core teaching standards, administrator standards and rules for teacher and administrator evaluation — all to improve student academic growth and learning. The standards are designed to guide educators’ professional development efforts and, in doing so, strengthen their knowledge, skills and practices.
ASPIRE
Access to Student Assistance Programs In Reach of Everyone (ASPIRE) is a pre-college mentor program that helps students create a “plan of choice” to access education and training beyond high school. Established in 1998, ASPIRE has expanded to 125 sites across Oregon. Under the direction of a site coordinator, volunteer mentors support students in researching careers, schools, and scholarships; and completing financial aid and admissions processes.
At Chiloquin High School, 50% of students are Native American and 85% are on the free and reduced lunch program. Since joining ASPIRE, Chiloquin’s rate of graduating seniors moving on to post-secondary education has increased from 20% in 2004 to 65% in 2011.

OEIB Report to the Legislature | December 2011 22
• Easing post-secondary transfers—Oregon’s community colleges and universities have developed articulation agreements that spell out how credits from one institution can transfer with a student to another campus. This has greatly increased the number of students starting their college studies in the more accessible and more affordable community colleges, then transferring to Oregon’s public universities to earn their bachelor’s degrees.
By passing Senate Bill 909, the Legislature committed to creating and sustaining a coordinated and integrated public education system. That legislation established the Oregon Education Investment Board, chaired by the Governor, to oversee all levels of state education, improve coordination among educators, and to pursue outcomes-based investment in education.
As directed by the legislation, an early task of the board is to recruit and appoint a Chief Education Officer, who will lead the transformation of Oregon’s public education system from preschool through high school and college.
The Chief Education Officer will serve as the board’s chief executive in the creation, implementation and management of an integrated and aligned public education system. This work will require visionary leadership, skillful collaboration with legislators, educators, parents and education stakeholders at the state and local level and the effective engagement of community members to build and implement the education system (see the job description in Appendix 3).
Oregon is also on the right track in its focus on early learners. Decades of research widely confirm that early investments are key to later educational success and are the most cost-effective investments we can make. Investing early and focusing on the basics should go a long way toward improving graduation rates in Oregon.
Early Kindergarten Transition Program, Portland Public Schools
Two years ago, Portland Public Schools (PPS) worked with Multnomah County Library, Multnomah County’s Schools Uniting Neighborhoods program, and Head Start to help children with no preschool experience make a successful transition to kindergarten. In summer 2009 PPS piloted a three-week experience for 40 students at two PPS elementary schools, Woodmere and Whitman. The students attended their neighborhood elementary Monday through Friday for about three hours to begin developing their communication, collaboration, and literacy skills. Students were supported by kindergarten teachers, education assistants, and interpreters. In addition, parents of these students attended parenting classes for about three hours per day twice each week over the three-week period. Parents were immersed in their children’s curriculum and built relationships with school educators and each other.
Program officials say the experience was radically empowering for children and parents. In the first year parents were attending school meetings and volunteering in kindergarten classrooms, while students were leaders in their classrooms, modeling appropriate behaviors. In fall 2009 students who participated in the pilot program performed, on average, 10% higher on literacy assessments than their classmates who did not attend the program, and still averaged 5-8% higher when re-assessed in spring 2010. The program expanded to five schools and 120 students in summer 2011. The program is associated with Multnomah County’s Linkages Project.

OEIB Report to the Legislature | December 2011 23
Strategy 2: Focus Education Investments on Outcomes
A New Budgeting Paradigm
Roughly $7.4 billion in state General Fund and Lottery dollars goes toward education at all levels, preK through college, in every two-year state budget (see Table 1 and Appendix 4). (Local property tax dollars, federal funding, grants, tuition payments, and other sources contribute roughly an equal amount.) How that money is invested becomes one of the chief strategies to drive better outcomes for students—and to achieve Oregon’s 40/40/20 goals.
A sound education investment strategy is especially critical in these difficult economic times. Parents struggle to pay for high-quality childcare and preschool, our public schools face larger class sizes, shorter school years, and fewer enrichment opportunities that help engage and motivate students. As discussed above, children today arrive at school with greater needs than ever due to the impact of poverty—-hunger, homelessness, lack of stability and security in their lives—with schools being expected to make up the difference. And the costs of college and career training have escalated to make access even more difficult.
It is widely accepted that education in Oregon is underfunded at all levels. The Governor shares this view and is working to bend the cost curves of health services and prisons, which are taking up an ever larger percentage of Oregonians’ personal income (see Figure 9). Because of these cost pressures, investment in education has declined over the years—as a share of Oregonians’ personal income, and as a share of the state discretionary budget.
Table 1. Oregon’s public education investment: 2011-13 budgeted (in millions)
General/ Lottery
Local Property
Taxes
State and Local
Subtotal
Tuition, Fees, Other
Federal Total
Early Learning $316 - $316 $55 $456 $827K-12 Education $5,816 $3,151 $8,967 $61 $861 $9,889Post-Secondary $1,286 $284 $1,570 $2,675 $117 $4,363
Total $7,418 $3,435 $10,853 $2,791 $1,435 $15,079
Source: State Budget and Management Division, Oregon Department of Education, community college websites and financial offices, OHSU financial office. See Appendix 4 for additional detail.
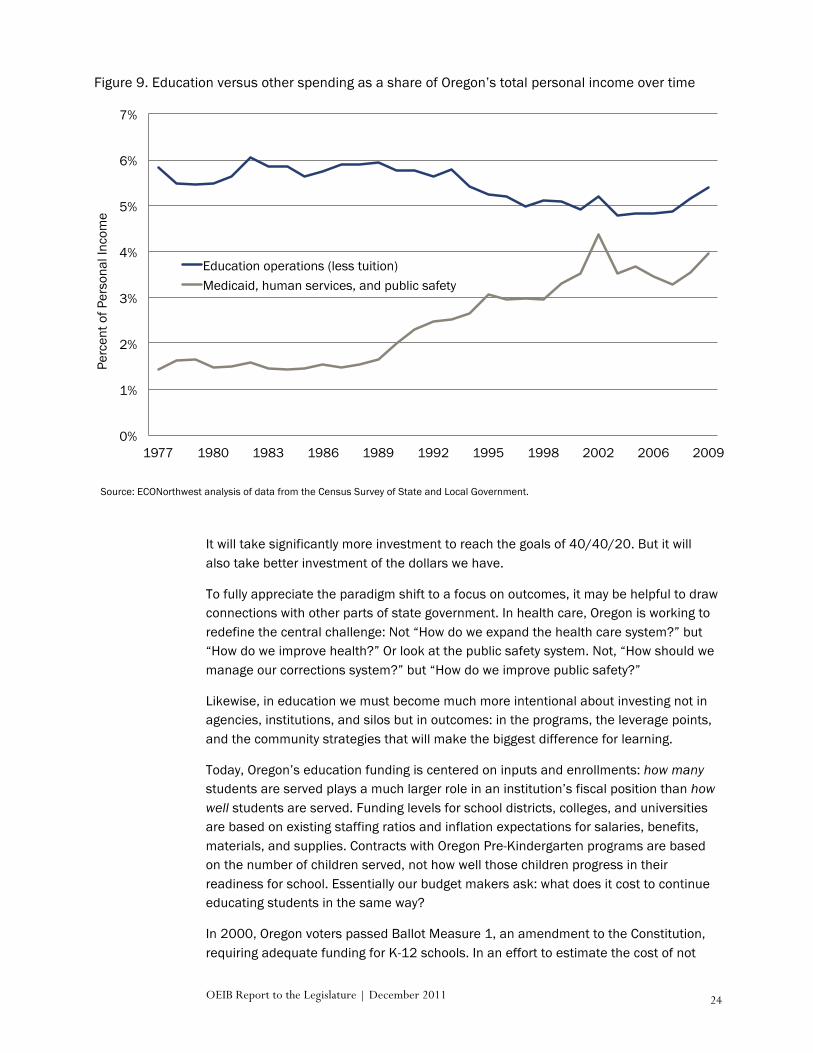
OEIB Report to the Legislature | December 2011 24
It will take significantly more investment to reach the goals of 40/40/20. But it will also take better investment of the dollars we have.
To fully appreciate the paradigm shift to a focus on outcomes, it may be helpful to draw connections with other parts of state government. In health care, Oregon is working to redefine the central challenge: Not “How do we expand the health care system?” but “How do we improve health?” Or look at the public safety system. Not, “How should we manage our corrections system?” but “How do we improve public safety?”
Likewise, in education we must become much more intentional about investing not in agencies, institutions, and silos but in outcomes: in the programs, the leverage points, and the community strategies that will make the biggest difference for learning.
Today, Oregon’s education funding is centered on inputs and enrollments: how many students are served plays a much larger role in an institution’s fiscal position than how well students are served. Funding levels for school districts, colleges, and universities are based on existing staffing ratios and inflation expectations for salaries, benefits, materials, and supplies. Contracts with Oregon Pre-Kindergarten programs are based on the number of children served, not how well those children progress in their readiness for school. Essentially our budget makers ask: what does it cost to continue educating students in the same way?
In 2000, Oregon voters passed Ballot Measure 1, an amendment to the Constitution, requiring adequate funding for K-12 schools. In an effort to estimate the cost of not
0%
1%
2%
3%
4%
5%
6%
7%
1977 1980 1983 1986 1989 1992 1995 1998 2002 2006 2009
Perc
ent o
f Per
sona
l Inc
ome
Education operations (less tuition) Medicaid, human services, and public safety
Source: ECONorthwest analysis of data from the Census Survey of State and Local Government.
Figure 9. Education versus other spending as a share of Oregon’s total personal income over time
OEIB Report to the Legislature | December 2011 25
just meeting the added provisions of the measure, but also helping all students reach Oregon’s academic standards and goals, the Quality Education Model (QEM) was created.
The QEM is built based on prototype schools that reflect the teachers, support staff, and other resources required to run a system of highly effective schools. By “costing out” these resources and taking into account expected cost increases, the state has estimated the level of funding required for Oregon schools to meet the state’s educational goals. Over the last decade, the level of funding has ranged between 75 and 85 percent of that called for by the QEM.
Outcome-based investing reorients the conversation. The question becomes: for a given amount of resources, what outcomes can the system deliver, and are those the outcomes we want? The model assumes that service is constantly innovating and improving. Focusing on outcomes will help eliminate the barriers between educational institutions (including day care centers, schools, colleges, and universities). The more Oregon’s education providers view themselves as jointly serving learners, the more seamless, efficient, and effective the system will be.
It is hoped that this shared ownership of learner success will lead to closer examination of the best use of resources. The longitudinal student data system and the educational return on investment data it produces will help policy makers within each sector and across sectors examine the system attributes that produce the strongest gains for learners with the available funding. The best instructional practices and the most efficient support systems across the state will emerge from these facts, and should lead to even greater system collaboration and streamlining.
This approach was also contemplated for Oregon’s post-secondary education system with the passage of Senate Bill 242. That bill, which also provided greater autonomy for Oregon’s seven public universities, established the understanding that future budgets would be based on performance compacts with our universities. These compacts will include more explicit expectations about progression to degrees and completion.
On some level, our K-12 school districts already offer evidence for an outcomes-based investment strategy.
As the state assumed responsibility for funding schools after Measure 5, overall funding dropped. But it also became far more equal. There are outliers, particularly among the smallest school districts, but total per-student spending, including local property taxes and federal funding, clusters closely around the median of $10,000, with a slight increase in funding for districts serving higher shares of low income students (see Figure 10). Well over 90 percent of Oregon students attend school in districts that spend within $2,000 of the median per-student spending.

OEIB Report to the Legislature | December 2011 26
Yet even with similar funding, school districts choose to invest their money differently. There are examples of excellence around the state that prove that, with equal resources and similar student populations, it is possible to get better results.
• Starting in Tigard-Tualatin and spreading throughout the state, school districts are investing in Response to Intervention efforts, with professional development and a system of interventions that help keep students on track academically and behaviorally. Tigard-Tualatin’s special education identification is significantly below the state average, more than 92 percent of third graders read at grade level, and the district staff are leaders in spreading that best practice to other districts. Again, this is a strategic investment in student success, in a time of tight resources.
• Woodburn, Parkrose, and other school districts are offering full-day kindergarten, because dollars invested in a great start for all students help to close the gap and cut the expenses of remediation later in school. The number of Oregon students in full-day kindergarten has more than tripled in the last seven years.
• Many school districts have carved out time for teachers to collaborate in professional learning communities, even as they struggle to maintain a full school year. Vital planning and professional development time helps our dedicated teachers to do their best for students.
• Language immersion programs—showing positive outcomes by helping English language learners in reading and math—are expanding in Portland, Woodburn, Canby, Bend-La Pine, Salem, North Clackamas, and other communities.
• Many districts have protected and even expanded critical supports to help high school students graduate and go on to college—through dual-credit courses,
Figure 10. Annual spending per K-12 student, by school district’s share of low-income students, 2009-10
$0
$2,000
$4,000
$6,000
$8,000
$10,000
$12,000
$14,000
0% 10% 20% 30% 40% 50% 60% 70% 80% 90% 100%
Percent of students who are low income
Oregon school district with >1,000 students
Notes: Low-income students are those who receive free or reduced-price meals. Spending includes all forms of revenue (state, local, federal, and other). Source: ECONorthwest analysis of Oregon Department of Education data.

OEIB Report to the Legislature | December 2011 27
summer and extended day programs, and programs that help first-in-their-family students head to college.
Each of these is a conscious and deliberate investment by thoughtful school boards considering how they can use the limited dollars they have to deliver the best education possible for their students. All school districts receive about the same dollars per student, but some have distinctly better results—in state assessments, graduation rates and post-secondary success. Our longitudinal student data system will help us identify the districts and institutions that deliver the best student outcomes given the investment made, the “return on investment,” taking into account the demographics of the learners served.
These are examples of the sort of investment and vision the Oregon Education Investment Board needs to take to scale—embracing our youngest learners through our doctoral candidates, across the span of state education funding.
Outcomes and Indicators
As a state, we must define the core outcomes that matter in education and hold them stable over time. We must provide educators with flexibility, supports, and the encouragement to think outside the box about how they use time, technology, and community resources. And we must provide relief from the rules, mandates, and the narrow-minded focus on standardized testing that can straitjacket the profession.
To reach the outcomes we want for students, we must focus on key learning stages along their educational journey:
• Ready for school: Oregonians from birth through kindergarten entry. Oregon’s youngest learners—at home, in childcare, or preschool—should gain the necessary cognitive, social, emotional, and behavioral skills to be ready for kindergarten.
• Ready to apply math and reading skills: By the end of third grade, or about age 9, students should develop fluency in reading and understanding, and should have a solid foundation in numeracy.
• Ready to think strategically: By the early high school years, or roughly age 14, students should be ready to tackle a rigorous and more diversified curriculum.
• Ready for college and career training: High school students should demonstrate career and college readiness through multiple measures. Beyond the academic knowledge or courses taken, they should demonstrate critical thinking, communication, collaboration, and creativity—all skills that prepare them for post-secondary education or employment.
• Ready to contribute in career and community: Graduates of Oregon’s post-secondary institutions should be well prepared to be responsible and productive members of our communities.
For each learning stage, the Oregon Education Investment Board will define indicators of progress toward the desired outcomes. Not every student will move through these stages at the same pace; some will take more or less time. But our educational system—from early childhood through college and career—should ensure that learners

OEIB Report to the Legislature | December 2011 28
keep progressing along the continuum, offering greater support or acceleration based on individual needs. For example, if we hope to achieve our high school and college completion goals by 2025, we may have to plan for scenarios in which 10 percent of high school students take five years to graduate but as many as half of all high school students graduate in four years with a full year of college credits.
A focus on investing in critical leverage points, maintaining an openness to trying different approaches and learning from what does not work will move the state toward the 40/40/20 goal. Across the continuum, Oregon needs to learn more about what works and do more of it.
Early Learning
Decades of research widely confirm that the seeds of adult success are planted early. Young brains are in early critical development and readiness to learn is optimal. A strong start in learning well before formal schooling can pay off long term in educational attainment, job stability, and even less dependence on social services and less involvement in the criminal justice system. Some of the best returns on investment at any level of learning come early.
Oregon has a fractured collection of programs, policies, and structures connected to early learning; it is hardly a coherent system, it is not focused on outcomes, and there is no tracking or accountability to ensure that those young children most in need receive even the limited support that is available. Early childhood has not been a focus of the state’s education investment: less than 5 percent of state and local funding for education funds early learning.
Overall, early childhood programs in Oregon receive more than $800 million in state and federal dollars every year, but little, if any, tracking of results has followed. Dozens of uncoordinated programs exist in at least six state agencies, but the system is neither integrated nor accountable (see Appendix 4).
Oregon is highly unlikely to raise achievement levels without more systematic investment in and monitoring of early learners. Using an outcomes- and data-driven approach, the state can position itself to know where to invest for the largest, most enduring returns, smoothing out what today is an abrupt, even awkward transition for learners moving from prekindergarten to kindergarten and beyond.
To make progress, the state will invest in core infrastructure: standard assessments to measure kindergarten readiness and first-grade reading, professional development for the early childhood workforce, and a longitudinal, learner-level database that tracks the learner experience and outcomes starting from birth. With the new infrastructure in place, a significantly enhanced accountability system will focus the system on kindergarten readiness and first-grade reading.

OEIB Report to the Legislature | December 2011 29
Significant streamlining and consolidation of boards, commissions and functions will start the overdue integration of a coordinated early childhood system. But more important, the Early Learning Council will provide policy direction, planning, and alignment of early learning programs in the Employment Department, the Department of Education and the Department of Human Resources around Readiness for School. Those programs and budgets will remain in the various departments, but for the first time they would all be aligned to achieve an outcome for students.
Achievement Compacts
Outcomes and measures of progress will serve as the cornerstones of achievement compacts that we envision between the state and each of Oregon’s educational entities. These compacts will define the outcomes we expect for students, given our state investment.
Beginning with the 2012-13 school year, we propose to require that all 197 school districts, 19 education service districts, 17 community colleges, the Oregon University System and the Oregon Health & Science University enter into achievement compacts in exchange for receipt of state funds, based on then current state appropriations.
These achievement compacts will define the outcomes that each educational entity will commit to achieve in
categories defined by the Board to track completion (e.g., diplomas and degrees), validation of knowledge and skills (e.g., state test scores) and connections to the workforce and civic society (e.g., career pathways), to be tracked with aggregate data for students in each of the learning stages identified above. Achievement compacts will include outcomes that speak directly to closing achievement gaps. The compacts will also express each educational entity’s role and responsibilities across the educational continuum and attempt to quantify the entity’s completion targets to contribute to achievement of the state’s overall 40/40/20 goals. In many cases, our educational institutions will want to enlist community support in achieving their compact goals, whether from non-profit service providers, health organizations, employers or others. Wraparound support and community opportunities can play a large role in helping every student succeed.
Representatives of Oregon’s educational entities have worked with our Board to develop sample compacts for their districts and systems. Samples of compacts with K-12 schools, Education Service Districts, community colleges, and the university system are contained in Appendix 5.
We hope that these achievement compacts encourage collaboration not only among aligned levels of education, from pre-K through post-secondary, but also among like
Gladstone Center for Children and Families
Three years ago, the Gladstone School District was offered a vacant Thriftway grocery store. District Superintendent Bob Stewart sat down with his board and asked “What if….” Today the Gladstone Center for Children and Families gives meaning to the concept of early childhood “wrap-around” services.
The Center houses 11 agencies under one roof, including a community health clinic, a relief nursery for at-risk children, Healthy Start services for children ages 0-3, classes for youth with autism and other mental and physical disabilities, nutritional services under the federal Women, Infants and Children program, mental health services, evening classes for Latinos seeking GEDs through Clackamas Community College, Head Start classes, and kindergarten classes. The Center is part of an area transition team studying how to effectively transition children from preschool to kindergarten, and is in the early stages of compiling data on transition success.

OEIB Report to the Legislature | December 2011 30
institutions. With so many students moving from one school district to another, or transferring among colleges, we need to integrate support and accountability for even highly mobile students.
The achievement compacts will be living documents, renewed and adjusted annually, that will constitute new partnership agreements between the state and the governing boards of its educational entities. These compacts will reflect a mutual effort to set goals and be accountable for results—the state for its commitment of funds and the educational entity for its use of those funds.
With compacts in place next year, the 2012-13 school year will establish a baseline, in which goals are set, data are collected, and results are compared to investments. Over time, comparisons will be made both within districts and between districts with similar student populations, with particular attention to achievement gaps for racial/ethnic, English language learners, and economically-disadvantaged groups of learners.
School districts and post-secondary institutions that demonstrate success may be rewarded with increased
flexibility in the form of freedom from state mandates and reporting requirements. But for districts that fail to meet reasonable expectations of improvement and success, it is recognized that any reduction of state funding would penalize students and be counterproductive. For such districts, therefore, there will be systems of diagnosis, interventions, and supports to be applied by the state and, potentially, more state direction over a district’s budget. Diagnosis might reveal the need to share services with other districts, to free up more resources for the classroom. Supports could include help implementing best practices, peer-to-peer mentoring, leadership and professional development and capacity building. The role of local boards will be more important than ever with the use of achievement compacts, as those boards will be one-to-one partners with the state in goal setting, planning and problem solving.
As we move forward with Achievement Compacts we must recognize that some students are not subject to them because they no longer are in the education system. These disconnected youth are not in school and they are not working. Some in their late teens and early twenties reach a point where they are unable or unwilling to return to high school, yet are unprepared for community college. Strategies are needed to identify these students and get them in school or provide them viable education alternatives. In communities like Minneapolis, Boston, and Seattle these students are receiving workforce training, earning high school diplomas, and finding success.
Local Control and Mandate Relief
The compacts will embody a “tight-loose” model. We will be tight on outcomes as investors of state dollars. But we will be loose in providing the flexibility our school
Unified Improvement Planning Process, State of Colorado
Colorado’s new Unified Improvement Planning (UIP) process reduced the total number of separate plans required of schools and districts to a single plan combining the improvement planning components of state and federal accountability requirements. For Colorado, the process represents “a shift from planning as an ‘event’ to planning as a critical component of ‘continuous improvement.’” The end goal of the process is to “ensure all students exit the K-12 education system ready for post-secondary education, and/or to be successful in the workforce, earning a living wage immediately upon graduation.” All schools and districts must engage in the UIP process.

OEIB Report to the Legislature | December 2011 31
districts and our institutions need to achieve better outcomes for all students–no matter their race, home language, disability or family income.
The state must resist the temptation to dictate policies and strategies for local districts or educational institutions—holding true to the “loose” aspect of the compacts. The Legislature in 2011 passed Senate Bill 800, eliminating the first round of least compelling mandates on school districts, and this year the Oregon Department of Education suspended the reporting requirements of a host of laws collected in “Division 22” reports. While the school districts still must comply with the underlying laws, eliminating the reporting relieved administrators of the burdensome chore of paperwork, freeing significant time.
We anticipate and hope that a federal ESEA waiver will provide similar relief from federal requirements.
The Educational Enterprise Steering Committee, created by legislation in 2005, and the Oregon Department of Education are working to bring forward the next round of mandate relief, hoping to eliminate further requirements that—however well intentioned—can be a drag on innovation and stifle creativity at the local level.
Budget Redesign
The Governor is directing executive agencies to approach the budget differently for the next biennium. Instead of presenting a current service level and add and cut packages, he is challenging each of the seven areas of state government to focus on outcomes and to create cohesive investment plans with a 10-year horizon. What kind of state do we want to live in? And how can we use the state’s investment to get there?
These are exactly the conversations the Oregon Education Investment Board is embarking on in the area of education. The board will attempt to define and achieve a stable and sustainable baseline of funding to maintain the capacity of our schools and pre-K/early childhood programs in 2013-15 and thereafter. Low performance would not mean that base funding would be removed, but it could well mean greater state direction on how the money is budgeted. Higher performance brings greater flexibility, lower performance, tighter direction.
And as the Board works to develop the Governor’s 2013-15 budget proposal to the Legislature, we will discuss and vet ideas for the best use of funds above the baseline. Additional investments will be considered to provide funding for innovation, encourage the adoption of evidence-based best practices and support higher performance. Investments might take the form of strategic grants to focus on particular learning stages or learner groups. The board might also propose shifting to
Shared Services, Coquille, Bandon, Myrtle Point, and North Bend School Districts
When Coquille School District Superintendent Tim Sweeney began work 18 months ago, Coquille managed all its own services. Today, Coquille, Myrtle Point, and North Bend School Districts share 15 services, including food service, bus transportation, school psychologist services, and information technology services. As a result of these shared services, Coquille is saving over $338,000 per year, more than 4 percent of its annual budget. Coquille has rolled these savings into a new alternative high school, Winter Lakes, that serves students from the Coquille, Bandon, and Myrtle Point School Districts.

OEIB Report to the Legislature | December 2011 32
performance grants, perhaps offering funding based on rates or numbers of students earning certificates or degrees, or the number of students who achieve English proficiency and exit from ESL programs. These are all options to be explored, debated and developed in 2012.
While revamping the overall budget design, the Board does not want to lose sight of the potential for more efficient and effective education service delivery. Board members continue to see opportunities for shared services at the regional level—with school districts sharing central functions such as human resources, information technology, purchasing, or other vital business operations. Educational Service Districts and K-12 school districts are interested in pursuing such opportunities, and the OEIB would like to be a catalyst for continuing improvement.
Strategy 3: Build System-wide Standards, Guidance, and Support
Developing a more effective public education system depends on the ability of the state to develop our own coherent framework to support this goal. We have many different agencies, task forces, committees, boards and executives—all of whom bring valuable expertise and resources to the effort. We must connect our existing resources, streamline our efforts, and become more effective.
More than two dozen early childhood programs, for example, are scattered through a half-dozen agencies. The Early Learning Council proposes legislation for 2012 that will start to bring those programs together for greater coordination—but more important, for easier and expanded access for those families that need help the most.
In the K-12 and post-secondary arena, we must connect existing resources in the Oregon Department of Education, the Chancellor’s Office, the Oregon Student Access Commission and the Department of Community Colleges and Workforce Development.
Through a coordinated effort under the OEIB and Chief Education Officer, the state will establish system-wide standards and assessment, a longitudinal data system, and coherent support and guidance.
Standards and Assessment
Through the work of the Early Learning Council and key education partners, Oregon is aligning statewide early learning and development standards to promote school readiness and to ensure a seamless transition to public schools. The state will promote standard screening practices with referrals to ensure families are connected to community services, and will educate families about how they can support young children in the home and how to access services.
Oregon is in the process of adopting standard early childhood assessment tools and a universal statewide kindergarten readiness assessment to help ensure all children are on track and prepared for school. These assessments will help identify children who need additional support early and will make sure that support is effectively targeted to meet individual needs. The new assessment tool will be piloted in 8 to 12 districts in
OEIB Report to the Legislature | December 2011 33
2012-13 with statewide implementation the following year. The early childhood data system—already called for in Senate Bill 909—will provide service providers and policy makers the information they need to ensure better outcomes for children by sharing key data related to each child’s specific needs and progress. Programs will also gain insights that can help improve overall program delivery through identification of developmental areas that lagged the performance of students served by like programs.
Oregon is one of 45 states to adopt the Common Core Standards—and is a leader in aligning those K-12 standards with post-secondary standards. We are also a leader in the “Smarter, Balanced Coalition” developing next-generation student assessments designed to support proficiency in content and higher level thinking skills, transition skills, and academic behaviors.
The assessment question is critical. A successful outcomes-focused system depends on identifying the right outcomes, but then also having the tools to measure them.
In the short run, the achievement compacts for K-12 may rely on data already available: OAKS scores, graduation rates, indicators of college-level work in high school, student retention and certificate and degree achievement in post-secondary. Over time, Oregon can improve our content-based summative assessments. We expect, in time, to replace OAKS with Smarter Balanced assessments. We will also need to develop local formative assessments to be used in our classrooms to evaluate evidence of a student’s proficiency, and which are normed at the state level using common rubrics and external validation.
When one asks Oregonians—not just educators or researchers—what outcomes matter most to them, they don’t talk about a student’s OAKS score. In fact, when the Board’s staff posted a survey to solicit responses to this question, it attracted more than 6,000 responses from across the state. Overwhelmingly, respondents said the best indicator of student achievement was “Higher-level thinking skills (such as critical reasoning) and habits of success (such as persistence, collaboration, creativity).” Educators in Oregon and in other states already are developing model qualitative assessments that measure critical thinking skills, life and career skills, and the habits of effective learners. Over time, the achievement compacts will need to incorporate new measures to report whether our students are making progress in the ways that matter most.
And as we pursue innovative assessments, there is one additional tool to consider: input and feedback of next-level teachers, professors, and employers. This feedback must help inform the extent to which our students are truly prepared as they move through the educational continuum and on to the world of work.
The Longitudinal Data System
Senate Bill 909 directs our board to provide an integrated, statewide, student-based data system. The first phase is to allow the state to monitor expenditures and outcomes to determine the return on statewide education investments. But the value goes beyond that macro-level accountability and investment function. As the system develops, the second phase should provide powerful new tools and data to support teaching and learning, and to provide information to students and parents.
OEIB Report to the Legislature | December 2011 34
As anticipated by legislators, Project ALDER in the Oregon Department of Education (and funded by the U.S. Department of Education) will help meet the requirements for this new, comprehensive data system.
Project ALDER envisions the creation of a prekindergarten through post-secondary education (PreK-20) data system and research function that will compile longitudinal student data (without student identities attached) from every level of education. This will allow the state to chart the progress of students with varying backgrounds and learning experiences as they enroll and complete programs. Student inputs and funding effects can be measured against student outcomes—delivering the “return on investment” called for in the legislation.
For example, in the initial phase to be launched by July 2012, the return on education investment for K-12 schools will be calculated based on two primary data elements: student’s state assessment score outcomes and district expenditures. The
methodology takes into account differences in students’ family incomes, the local cost of living and the district’s level of enrollment in special education and English Language learning. All of those affect the challenges students face, and the additional support a district may need to offer to help them reach their highest achievement. Variations in student population thus become an important factor in the return on investment calculation. Districts with greater rates of student progress will have higher net return on investment, and the most outstanding districts will have both delivered strong student progress and contained costs. This data will be measured annually allowing school districts to monitor and improve their specific student gains and spending patterns.
Each level of education—from pre-kindergarten through graduate school—will have different measures of student achievement, and different methodologies for calculating return on investment. In each case, Oregon is examining the experience of other states as we embark on this effort.
The goal of the return on investment calculations is to provide a useful diagnostic tool, one that allows educators and the state to better identify the investments that are both cost effective and achievement effective, for replication or expansion: what works for students, and how best to invest limited public dollars.
Data Quality Campaign, State of Kentucky
Kentucky is a national leader in collecting and sharing education data, preschool through graduate school. Five years ago, Kentucky started the Data Quality Campaign, an effort to make the student performance data it had tracked since the 1990s more user-friendly. The resulting college- and career-readiness feedback reports are a tool for superintendents, principals, guidance counselors, school board members, college administrators, parents, and students to make decisions about education.
Education Week notes some of the impacts: University professors and high school teachers are comparing notes about class expectations. Transition courses are being developed to help lagging high school students avoid remediation in college. Advanced Placement restrictions are being lifted to expose more students to college-level courses. The larger impacts: the percentage of college-going students has risen, and the need for remediation in college has fallen.

OEIB Report to the Legislature | December 2011 35
Kentucky is at the forefront of collecting education data and supporting educators in using the data to improve teaching and raise student achievement. As one example, the feedback from Kentucky colleges about students’ preparedness has that state’s high school teachers rethinking their practice, adding rigor and challenging students in new ways. Recent research has also highlighted the need to connect student information across institutions in higher education because of the increasing proportion of non-traditional students, who are more likely to attend part-time and enroll in multiple schools. States, like New York, that have restructured their programs to help students balance jobs and school have seen much higher graduation rates. In California, community colleges are shortening and redesigning developmental English and math courses based on longitudinal data that has found these remediation courses can serve as education dead ends rather than educational preparation for more rigorous degree course requirements.
The longitudinal data system is a critical tool that will help inform educators across each learning stage about the paths that lead to student success and help identify emerging trends, gaps and opportunities that must be addressed by state and local education policy makers and educators to achieve Oregon’s education goals. Future phases of the education data system will add tools that provide key information to classroom and program educators to help identify specific student needs and to spot trends to improve instruction and individual learner outcomes. (See Appendix 6 for further detail on the data system.)
Guidance and Support
Under the new model, the state would shift its focus from compliance to improvement, offering new levels of guidance and support.
The state should become the broker and supporter of successful practices. Teachers need reliable and vetted resources proven to be effective with the learners in their classrooms, particularly those that are at risk for low achievement. This will require support for initiatives that meet students where they are and chart education pathways to address their unique needs. For too long, educators in Oregon have been left without a central way to collaborate with other educators across the state facing common challenges. The state will promote collaboration, innovation, and critical thinking about practices by connecting educators with each other. The collection and
DATA Project, State of Oregon
Oregon’s Direct Access to Achievement (DATA) Project is an Oregon Department of Education initiative to teach educators how to use student achievement data to inform instruction. DATA provides training and coaching on unwrapping learning standards, creating common formative assessments, lesson plan design, and conducting “fidelity checks” on staff implementation of best practices.
In Eastern Oregon’s Canyon City, teachers at Humbolt Elementary analyzed student test results and identified a problem area: writing conventions. They discussed ways to improve students’ skills, implemented a strategy for change, and then evaluated the results, using data to adjust their instruction. Halfway through the 2009-10 school year, teachers had already exceeded their annual goals for student improvement.
The Redmond School District has data teams across all grade levels and subject areas. Between the 2006-07 and 2008-09 school years, OAKS data show a 16% gain in math and a 12% gain in language arts for all students; for students with disabilities, a 47% gain in both math and language arts. “We have teachers now who can’t do their lesson plans without looking at their data,” says Becky Stoughton, an Oregon DATA Project certified trainer. The DATA project is funded through a federal grant and currently is in its fourth and final grant year.

OEIB Report to the Legislature | December 2011 36
distribution of a high-quality, comprehensive body of knowledge, expertise, and research on proven or promising practices would support an education system that continually improves itself.
The Oregon Department of Education could shift resources to support and facilitate regional improvement networks to engage higher and lower performing districts around professional development and continuous improvement. In post-secondary education, the Higher Education Coordinating Commission and the Taskforce on Higher Education Student and Institutional Support—both created by 2011 legislation—should identify and support best practices and guide and support improvements among Oregon campuses.
The state could support greater individualized learning and proficiency-based advancement. Students would earn credit for what they know and are able to do—for their mastery of content and skills—rather than time spent in the classroom. In this vision, a transcript would reflect specific learning outcomes acquired, not merely courses completed.
Successful redesign and implementation will require work in three key areas: making the use of time a flexible variable rather than a controlling element; improving professional development; and developing and using formative assessment tools.
Beginning with policies adopted in 2002, the State Board of Education has supported the move towards permitting schools to grant credit for students who demonstrate defined levels of proficiency or mastery of recognized standards. The Department makes policy and guidance documents available to assist districts with implementation, and has supported the Oregon Proficiency Project, the Business Education Compact, and the ExEL Algebra Project to bring proficiency-focused professional development to thousands of educators around the state.
The state should build partnerships to provide wraparound services to students. Numerous state-provided social and health services serve Oregon children, including DHS, the courts, foster care, food stamps, welfare, child protection, and behavioral health treatment. The support that learners receive—whether they are fed, housed, healthy, or safe—makes an enormous impact on their ability to learn.
Regional Centers of Excellence, State of Minnesota
Minnesota has regional support agencies comparable to Oregon’s Education Service Districts. Beginning in 2012-13, Minnesota wants to reform these “co-ops” into Regional Centers of Excellence that will provide assistance and support on local levels. Minnesota envisions these centers being best-practice clearinghouses that place educators from effective schools and districts in rooms with educators from less effective schools and districts to learn from each other.
School Accountability Framework, State of Massachusetts
In 2010 Massachusetts established a framework for holding school districts accountable and assisting districts when they struggle to meet expectations. The framework focuses state assistance on building district capacity to support and guide improvement efforts in individual schools, establishes a system of assistance and intervention to secure continued strong improvement, matches accountability and assistance to the severity and duration of identified problems, and targets districts for support in proportion to the state’s capacity to assist and intervene. The framework also identifies Conditions for School Effectiveness, which districts must consider when planning school improvement.

OEIB Report to the Legislature | December 2011 37
Sometimes these related services, or their lack, become ready explanations for education failure. They should become bridges that reinforce learning in a seamless way, especially for children and families facing poverty, unstable family backgrounds, substance abuse, criminal records, and negative peer associations. Roughly 40 percent of Oregon’s youngest children face such risk factors, and are far less likely to arrive in school ready to learn, and less likely to continue on to high school graduation and college. Providing the wraparound support should start early. Family resource managers could act as service brokers, in areas organized around elementary school boundaries.
For school-aged children, the challenge continues to find ways to ensure coordination of social and health services, linked to schools, to promote the students’ continued educational success. We know the need is there, and we have some demonstrated successes. For example, Oregon Healthy Kids has partnered with schools across the state to reach out to families to greatly expand health coverage. Programs such as these will challenge us not only to reach across educational silos, but to connect our educational system to larger systems of community supports.
Statewide Childrens’ Wraparound Initiative
Passed by the 2009 Oregon Legislature, the Statewide Children’s Wraparound Initiative (SCWI) integrates and streamlines state youth health care and education services to reduce costs and deliver better outcomes. A partnership between the Oregon Department of Human Services, the Oregon Health Authority, the Oregon Department of Education, and the Oregon Youth Authority, the SCWI is currently focused on reducing the amount of time a child is in foster care with a multi-system approach to meeting the needs and capitalizing on the strengths of the child and family.
SCWI was launched at three demonstration sites in July 2010: Mid-Valley WRAP, serving 180 youth in Linn, Marion, Polk, Tillamook, and Yamhill Counties; Rogue Valley Wraparound Collaborative, serving 100 youth in Jackson and Josephine Counties; and the Washington County Wraparound Demonstration Project, serving 60 youth in Washington County. Early analysis shows significantly improved outcomes within 90 days of a child receiving services and supports. SCWI hopes to eventually serve all Oregon children in the care and custody of the state’s child welfare system.

OEIB Report to the Legislature | December 2011 38
3. Best Next Steps to Student Success
Our plan to meet Oregon’s new education goals begins today. The remaining 18 months of this biennium will be the foundation-building period for improving teaching and learning across the education continuum.
We have developed a demanding job description for the state’s new Chief Education Officer. We have launched a national search to fill that position. And we will ask the legislature to give the Chief Education Officer the authority that leader will need to draw on the resources and capacities of the state’s education agencies to organize a newly-integrated state system of education from preschool to college and careers.
Six months from now, we will launch initiatives to better organize, connect and upgrade a diversity of programs now serving infants and early learners. If the Legislature approves, this will involve transferring duties and responsibilities from existing commissions to the Early Learning Council and the integration of early childhood services. As part of this effort, we will inaugurate the use of kindergarten readiness assessments to better align early learning with the goal of having young children enter kindergarten ready for school.
At the same time, we will start receiving measures of the state’s return on investments in early childhood and K-12 from the implementation of a new longitudinal data system. This system will be built out over time to form the backbone of a coordinated information system to guide state investments and support all learners from preschool to graduate school.
Further, in the 2012-13 school year, we propose to have in place a system of achievement compacts that will engage all educational entities in the state in a coordinated effort to set goals and report results focused on common outcomes and measures of progress in all stages of learning and for all groups of learners.
Finally, as we focus on the 2013-15 biennium, we will:
• Work with the Chief Education Officer to reorganize and focus state resources and management systems on the needs and priorities of the P-20 system, streamlining governance and administration, arriving at one entity for the direction and coordination of the university system, creating the option for independent university boards, and freeing up resources to better support teaching and learning;
• Develop budget models that provide sustainable baselines of funding for all educational entities and investment models that encourage innovation and reward success;
• Continue to reach more of our neediest children and prepare them to enter kindergarten ready for school;

OEIB Report to the Legislature | December 2011 39
• Reach out to disconnected youth with viable initiatives to support them in achieving their education goals and becoming contributing members of our workforce and communities.
• Develop agendas for student success by promoting the expansion of best practices now isolated in islands of excellence across the state, and pursuing promising new ideas to motivate students and engage communities.
Phase One
Early Learning
The Early Learning Council’s plan to improve Oregon’s early childhood system focuses first on these recommendations, many of which are contained in legislation to be considered in the February 2012 session:
Adopt universal screening practices. To identify and support Oregon’s children with high needs, the Early Learning Council recommends streamlining existing processes and assessments into a single,
common screening tool. The ELC would work with the Oregon Health Authority, along with schools, counties, and community organizations, to select and implement the tool. The common screening assessment would then be available for voluntary use when families of young children naturally come in touch with these many providers.
Improve the quality of chi ld care and preschool. If the Legislature agrees, the Child Care Division will implement a quality improvement system for all early learning and development programs. Oregon’s model has five tiered ratings, with strong supports and incentives to encourage programs to improve quality. These ratings will help families making decisions about care and education for their children, and will help direct the state’s investments so children in need have access to high quality early learning programs.
Al ign the learning framework from birth through kindergarten. The federal Head Start Child Development Early Learning Framework lays out clear standards and expectations for learning from age three to five. The Early Learning Council proposes to:
• Revise Oregon’s existing Birth to Three standards to align with the Head Start framework;
• Adopt the Head Start framework for all Head Start and Oregon Pre-K programs; and
• Link early childhood outcomes and learning with the K-12 Common Core State Standards.
Achieving the Dream, Lane Community College
Last year, Lane Community College (LCC) joined Achieving the Dream, a national consortium focused on closing achievement gaps and raising achievement levels for low-income students and students of color using evidence-based interventions that are sustainable and scalable. LCC strives to establish an ongoing campus-wide focus on academic behaviors, with all students and faculty dedicated to the development of study skills.
Achieving the Dream was established in 2004 with support from the Lumina Foundation and seven partner organizations. Today it supports 3.5 million students at 160 community colleges in 30 states.

OEIB Report to the Legislature | December 2011 40
Pilot a “Ready for School” assessment. The Early Learning Council plans to pilot a kindergarten readiness assessment in eight to 12 pilot school districts in 2012, with statewide deployment in 2013. This is a key step to evaluate student outcomes and guide investment in early childhood programs that are most effective in increasing children’s learning.
Bui ld a strong accountabil i ty and investment system. Oregon statute should reflect compliance and alignment with the Federal Head Start Act. This includes re-competition for Oregon Pre-Kindergarten programs in a manner that aligns with new federal processes and expectations for outcomes. Programs will have incentives to improve quality and deliver results for children.
Design a true system of early learning support. Under a new system design, the Early Learning Council will integrate and align services and set outcomes, standards, policies, and requirements consistent across all early childhood programs. “Accountability Hubs” will coordinate the delivery of services locally to families. Those “hubs” will be selected through a request for proposal bid process, and could be service providers, newly created partnerships, or existing entities, provided they meet ELC statewide standards. Family resource managers working for the hubs will work with families to ensure they receive the coordinated support they need.
Streamline government agencies and programs for more effective use of taxpayer dol lars. The ELC proposes to eliminate the state Commission on Childcare and Commission on Children and Families. The ELC would take on the programs and staff of the state Commission on Children and Families, while leaving up to counties the decisions on whether to maintain their local commissions.
Oregon has submitted a federal Race to the Top—Early Learning Challenge Grant application for $40.6 million. That funding would lend strong support to the strategies outlined above, allowing Oregon to move toward a high-quality, aligned, and more effective early childhood system more quickly.
Achievement Compacts
The Oregon Education Investment Board is proposing legislation for the 2012 session to require achievement compacts for receipt of state funding in 2012-13. This would apply to:
• All 197 K-12 districts • 19 Education Service Districts • 17 community colleges • The Oregon University System (which in turn would develop compacts with its
seven universities) • Oregon Health & Science University’s health professions and graduate science
programs
The achievement compacts would not change the allocation of funding for these institutions in 2012-13 from that set by the Legislature and approved by the Governor.

OEIB Report to the Legislature | December 2011 41
As discussed above, these achievement compacts would become new partnership agreements with our educational institutions, and living documents that will continue to evolve and improve over time. These achievement compacts will enable us to:
• Foster communication and two-way accountability between the state and its educational institutions in setting and achieving educational goals;
• Establish a mechanism to foster intentionality in budgeting at the local level, whereby local boards would be encouraged to connect their budgets to goals and outcomes; and
• Provide a basis for comparisons of outcomes and progress within districts and between districts with comparable student populations.
With achievement compacts in place, we will be better able to spotlight the examples of excellence and best practices that have proven to be most effective in our educational institutions and to better diagnose and intervene to overcome obstacles that are impeding progress in others. Educators will be able to use many different strategies, as long as measures of student progress demonstrate strong consistent learning gains.
Federal ESEA Flexibility Waiver
Since October, Oregon has been preparing its application for a waiver from certain provisions of the Elementary and Secondary Education (ESEA)/No Child Left Behind (NCLB) Act. The waiver is not only an opportunity to obtain relief from the rigid Adequate Yearly Progress targets and one-size fits all sanctions that NCLB mandated, but also a fortuitous opportunity to align the state’s system of accountability directly to our work on achievement compacts. The NCLB waiver will propose measures that are consistent with (though likely more detailed than) the Achievement Compact and a state system of support and interventions aimed at supporting the goals of the Achievement Compact.
Concurrent with the waiver process, the 2011 Legislature appointed a Joint Task Force on Accountable Schools (House Bill 2289) to examine Oregon’s school and district report cards, the state’s primary tool to communicate student achievement, and other information to students, families, and the broader school community. The Governor’s office is informing and coordinating with the task force to ensure that the achievement compacts, accountability system, and state report cards are consistent, aligned, and mutually reinforcing.
K-12 Regulatory Relief
As we proceed to establish achievement compacts in 2012-13, it will be reasonable to provide greater flexibility and relief from unnecessary regulatory burdens for our educational institutions. This is consistent with the “tight-loose” model of oversight in which the state will be tight on defining and securing its educational outcomes but loose in how our educational institutions are expected to achieve those outcomes. Senate Bill 800 (2011) made significant progress in reducing outdated and redundant regulations affecting our K-12 school districts. But more can be done to reduce

OEIB Report to the Legislature | December 2011 42
reporting requirements and to continue to review existing regulations for modification, suspension, or repeal.
The Education Enterprise Steering Committee (EESC), comprised of representative school administrators, ESD superintendents, and staff from the Oregon Department of Education and Governor’s Office, has taken up this charge. The EESC developed a list of mandates recommended for repeal or amendment, which formed the basis for a bill that is currently being considered by the House Education Committee.
Superintendent Susan Castillo and the Oregon Department of Education are also reviewing Division 22 reporting and the Continuous Improvement Plan requirements of school districts, with the goal of offering additional, and much anticipated relief. (Federal regulations and the ESEA waiver will impact these discussions.)
These efforts are aligned with the initiation of achievement compacts, so that school districts are given more leeway to focus their efforts on the goals and objectives of those compacts.
Chief Education Officer
On December 7, 2011, the Oregon Education Investment Board formally adopted a job description for the Chief Education Officer, following a public hearing and consultation with a broad spectrum of stakeholders on the characteristics and experience the board should seek in the hire (see Appendix 3 for job description).
A national search is now underway, with the goal of having the Chief Education Officer on board by April 2012.
The OEIB is proposing legislation in the February 2012 session to clarify the Chief Education Officer’s authority in leading the development of an integrated public education system. (See proposed legislation below.)
Student Longitudinal Data System Development and Application
Effective student data systems will help students meet their individual learning goals and will also help the state meet its goals of investing in greater educational outcomes. Senate Bill 909 specifically charged that we determine the education return on investment throughout our education delivery system. To do so, we will use research tools and methods that have been developed to evaluate and compare education institutions in multiple states. At present, these measures focus on the traditional institutional sectors (e.g., preschool programs, K-12 districts, community colleges, and universities). Using these national tools will allow the OEIB to compare student outcomes and system productivity across programs within Oregon and with similar institutions in other states. The Legislature allocated funding for data systems; we will use a portion of that budget to produce the first education return-on-investment reports by the July 1, 2012 deadline set in Senate Bill 909.
As the student longitudinal data system matures with student outcome data spanning multiple learning stages, there will be opportunities for long term evaluation of the

OEIB Report to the Legislature | December 2011 43
broader system’s effectiveness. This will help the state identify patterns of success, detours to avoid, and critical gaps that need to be filled.
To build effective systems that provide constructive input and feedback, educators and technology professionals need to agree on the information that should be collected, shared, compared, and evaluated. In addition to the OAKS examinations that are required for NCLB compliance, more than 100 different student assessment tools are used in K-12 schools in Oregon today. Use of student evaluation tools is essential to provide effective instruction, but overuse or uncoordinated use takes time away from instruction and learning. The lack of coordination also makes systematic collection and evaluation difficult, inhibits program continuity for students who change classrooms or schools, and increases costs for professional development. Future systems development needs to garner input from educators at each level to develop consensus and prioritize the data system expansion and continuing support needs (see Appendix 6).
2012 Legislation
Senate Bill 909 enumerates six policy areas that the Oregon Education Investment Board may choose to address in legislative proposals for the 2012 session. The Governor’s Office is filing two bills that address most of these key policy areas, with additional work underway to address governance issues in legislation for 2013.
Bi l l One: Initiated by the Oregon Education Investment Board
Creating an integrated public education system
I. Institutes achievement compacts as requirement for receipt of state funding (SB909, Section 6(2)a)
II. Establishes that six education executives will serve under the direction and control of the Chief Education Officer for the purpose of organizing the state’s public education system: • Commissioner for Community Colleges and Workforce Development; • Chancellor of the Oregon University System; • Executive Director of the Oregon Student Access Commission; • Early Childhood System Director; • Deputy Superintendent of Public Instruction (upon appointment per
Senate Bill 552); and • Executive Director of the Higher Education Coordinating Commission (upon
appointment per Senate Bill 242). (SB909, Section 6(2)e)
Bi l l Two: Initiated by the Early Learning Council
Coordinating, streamlining, and improving early childhood service
I. Streamlines the administration of state programs related to youth and children: • Eliminates Oregon Commission on Children and Families, and the statutory
requirements related to county Commissions on Children and Families

OEIB Report to the Legislature | December 2011 44
(county commissions may continue under their own county board’s direction). Transfers programs and funding for the OCCF to the Early Learning Council.
• Establishes a Youth Development Council under the OEIB, replacing and consolidating functions of the Juvenile Crime Prevention and Juvenile Justice advisory committees.
• Eliminates the Commission for Child Care, assigning its responsibilities and half-time staffing to the Early Learning Council.
• Grants the Early Learning Council responsibility for policy direction, planning and alignment of several programs toward a common outcome: children’s readiness for school. The ELC does not become a state agency and does not assume budget authority for those programs within other departments.
II. Directs the Early Learning Council to oversee an RFP process to establish accountability hubs as administrative agents coordinating early learning services across Oregon.
III. Directs the Child Care Division of the Employment Department to implement a “Tiered Quality Rating and Improvement System” for child care providers, by January 2013.
IV. Directs the Early Learning Council and the Department of Education to take steps necessary to implement a kindergarten readiness assessment in public schools by November 2013, with earlier pilot programs.
Phase Two
Streamlining and Consolidation of Governance Functions
The Oregon Education Investment Board will develop legislation for the 2013 session to complete the organization of the state’s integrated education system, to consolidate boards and commission and streamline management, and ultimately, to free up resources to better support teaching and learning.
Form must follow function. The board will identify the appropriate roles of the state in the system—largely those of investment, direction and coordination, and support. The board will then determine the top executive and management positions needed to staff the system and the boards and commissions that will provide optimal oversight of the system. In this endeavor, the board will create a work group of its members and other appointees, including legislators, to work with the Chief Education Officer.
That work group shall be guided by the following principles and goals:
• Focus on the functions needed • Streamline and consolidate governance and management to improve decision-
making and maximize resources • Commit to a flat organizational structure that meets the needs of the system
and promotes student success • Emphasize the independence of local boards, their role in the integrated
education system, and their importance as partners in achievement compacts
OEIB Report to the Legislature | December 2011 45
• Arrive at one entity for the direction and coordination of the university system • Work within existing resources and free up resources to support teaching and
learning
With the creation of the OEIB and SB 242’s creation of the Higher Education Coordinating Commission starting in July 2012, Oregon increased the number of education-related boards and commissions and executive leadership positions without identifying reductions elsewhere. The OEIB will identify consolidations in the education governance structure that can reduce the number of boards and executive directors to no more than the number in existence in 2010 and, preferably, to a lesser number.
In particular, the Governor has called on the following boards and commissions, and their chief executives, to collaborate with the Chief Education Officer to align and integrate their post-secondary governance functions:
• The State Board of Higher Education and the Chancellor; • The State Board of Education, the Workforce Investment Board, the
Superintendent of Public Instruction and the Commissioner of Community Colleges and Workforce Development; and
• The Oregon Student Access Commission and its Executive Director.
Those boards, commissions, and executives will also work with the Higher Education Coordinating Commission to arrive at a recommendation for a single entity to carry out those functions.
The Oregon Education Investment Board and Chief Education Officer will report regularly to the appropriate legislative committees, and will propose legislation by December 2012 to carry out the necessary statutory changes in executive positions and boards.
Institutional Boards at Universities
Governor Kitzhaber intends to develop an option by which universities could establish independent boards with clearly demarcated powers for proposal to the 2013 legislation session. The Chief Education Officer shall work with representatives of the OEIB and the Oregon State Board of Higher Education to develop recommendations for terms, conditions, and authorities for independent boards for one or more OUS universities, beginning in the 2013-14 fiscal year. The Chief Education Officer will consult with the administration, faculty, staff, students, and supporters of each university with an interest in an independent board, and will deliver recommendations to the Governor by October 15, 2012. The manner by which institutional boards and universities will meet statewide objectives, such as the 40/40/20 goal, will be addressed in the Chief Education Officer’s recommendations.
Outcomes-based Budgeting for 2013-15
The Oregon Education Investment Team, created by executive order and convened from February to September 2011, provided a framework for advancing outcomes-based budgeting in its August report. As the Oregon Education Investment Board looks forward to the budget process for 2013-15, the board will define outcomes and guide

OEIB Report to the Legislature | December 2011 46
the budget development process for our education continuum in the context of a 10-year planning horizon.
In this work, the Governor and the board will propose to establish a sustainable baseline of funding for the state’s educational institutions going forward, with additional resources to achieve the best possible outcomes across the education continuum. In the latter category, it will be important to find ways to identify and incentivize the adoption of best practices and to direct investments to initiatives with the highest returns.
Early Childhood System Implementation
Much of the early childhood system work proposed in Phase One above continues through 2012, as the Early Learning Council works to align Oregon’s early childhood programs toward common standards and expected outcomes. Two additional 2012 priorities for developing the system are called out in the ELC’s report:
Engage and support parents. Parents are a child’s first teacher. The state intends to empower and support families to make choices about programs and services that will best help their children be ready for school. The Early Learning Council plans to focus on providing resources and coordinating efforts for parent education and support, and to work with the Oregon Community Foundation, the Ford Family Foundation, and other community partners to increase access to parent education resources.
Support special needs chi ldren. The Early Learning Council should engage in a joint planning process with the State Interagency Coordinating Council on Early Intervention/Early Childhood Special Education to consider the unique complexities of these services and make recommendations to the OEIB and legislature related to these services.
An Agenda for Excellence
Throughout this report, we have noted “examples of excellence” within our current education system—areas where Oregon students are achieving and succeeding, thanks to new approaches to education and the dedication and innovation of their educators. We believe that these examples can serve as inspiration and models for replication as we work to create a culture of excellence across our system.
We will also need to pilot new approaches, and look for additional opportunities to reach our 40/40/20 goal. The following are several new programs and initiatives we consider such opportunities—some of which are in their infancy and some not yet in place in Oregon. While they do not yet have sustained records of success, they promise to raise student academic growth and achievement.
The Eastern Promise: A collaboration between the InterMountain Education Service District, Eastern Oregon University, Blue Mountain, and Treasure Valley community colleges, and 20 area public school districts, The Eastern Promise creates opportunities for students to participate in college-level courses and earn college credits while in high school. The goal is to increase the number of students who are

OEIB Report to the Legislature | December 2011 47
prepared for and attend college directly from high school. Current pathways to college education in high school include Advanced Placement testing, dual credit programs, and dual enrollment programs. Starting in the spring of 2012, the Eastern Promise will offer students an alternative pathway in which they demonstrate skill and content proficiency based on curriculums and assessments designed jointly by high school and college educators.
The Promise of Affordable Col lege: The Oregon Opportunity Grant’s shared responsibility model, developed in 2005, was designed to establish the promise of affordability for all Oregon residents enrolled in Oregon colleges. The model defines affordability based on cost of attendance (tuition, fees, books, and living expenses) and a student’s personal and household income and resources. Students are expected to pay “first dollars” toward their educations, but the state commits to achieving affordability for students by covering the “last dollars” needed after student and family contributions and federal financial aid and tax credits. Borrowing in four-year institutions was set at an affordability level not to exceed approximately $3,000 per year. State funding for the Oregon Opportunity Grant program tripled after adoption of the shared responsibility model. It is now at $100 million for the 2011-13 biennium. But this approximates only a third or so of the funding needed to fully implement its affordability promise. Proposals have been discussed to increase funding for the program by targeting students who go straight from high school to college and fully realizing the affordability promise for these students for the first two years of college.
CLASS: The Chalkboard Project’s Creative Leadership Achieves Student Success (CLASS) is an innovative education initiative designed to empower teachers and raise student achievement. It is built around four components linked to effective teaching: expanded career paths, effective performance evaluations, relevant professional development, and new compensation models. CLASS is “tight” in requiring that programs contain all four components and increase student achievement, but “loose” in empowering educators at the local level to design programs that utilize local resources and address local needs. Since 2006, the initial CLASS districts of Tillamook, Sherwood, and Forest Grove have out-performed state averages and comparison districts significantly in terms of gains in math, science, reading, and writing scores, reductions in high school drop-out rates, and increases in four-year cohort graduation rates. Nearly 130,000 students and 7,000 teachers in 17 Oregon school districts have participated in the CLASS project, and additional districts are inquiring about it.
Oregon STEM Education Partnership: This new partnership’s goal is to increase students’ readiness for college and career success in the fields of science, technology, engineering, and mathematics. To achieve this, the partnership will establish common measures for student achievement, teacher effectiveness, and program performance, and engage teacher leaders in designing, developing, implementing, and assessing professional development opportunities.
Western Governors University : Western Governors University is an online university driven by a mission to expand access to higher education through online, competency-based degree programs. It provides a means for individuals to learn independent of time and place and earn degrees and credentials credible to both

OEIB Report to the Legislature | December 2011 48
academic institutions and employers. With credit for proficiency, WGU students earn four-year degrees in 30 months. WGU, a non-profit organization, was founded by the governors of 19 U.S. states, including Oregon, and is supported by more than 20 major corporations and foundations. Today it is a national university serving almost 29,000 students from all 50 states. WGU has established state-based programs in Indiana, Texas, and Washington and is interested in doing the same in Oregon.
School Distr ict Col laboration Grant Program: This program was born out of Senate Bill 252 in June 2011 and seeded with $5 million. It will provide funding to school districts to improve student achievement through the voluntary collaboration of teachers and administrators to design and implement new approaches to teacher leadership, evaluation, professional development, and compensation. This builds on evidence of success in many districts, including the Chalkboard CLASS project participants.
Toward a Truly Successful Education System – And the Promise It Offers
As we continue on the journey toward our 40/40/20 goals, we must realize that 2025 is not that far away—a scant 13 years, or roughly the time it takes for a kindergarten student to achieve a high school diploma.
To reach that goal we must cultivate new ways of thinking about our educational resources, and a new partnership connecting state investments and local education delivery. We must think of the entire education pathway, from preschool through to college and careers. That pathway then becomes the architecture to which districts, campuses, special programs, state policy, teacher organizations, non-profit partners, business interests, and other resources commit and adapt.
This report discusses governance, outcomes, data systems, and structures. Those are critical means, but not the end. We must ensure that all of our efforts are informed by our overriding commitment to the learning process, from early childhood through college and career.
Our hope is that this new direction for Oregon offers to the student, a promise; to the educator, an invitation to lead; to the taxpayers, a return on investment; and to legislators, employers, community leaders, and educational organizations, a new partnership for educational achievement in Oregon.
Together, our students’ success will also be our success.

1 Oregon Stand for Children, Fall 2011 presentation: Building Vibrant Schools: A Closer Look at Oregon’s Achievement Gap.
2 Oregon Department of Education.
3 Based on October 2011 correspondence with Oregon Employment Department staff.
4 Bureau of Labor Statistics, “Employment status of the civilian population 25 years and over by educational attainment,” December 2, 2011. http://www.bls.gov/news.release/empsit.t04.htm
5 ECONorthwest analysis of data from the U.S. Census Bureau, Public-Use Microdata Samples (PUMS), Oregon Department of Education, and the National Student Clearinghouse. High school, associate’s degree, and bachelor’s degree attainment rates are draft results from a partially calibrated model. High school includes GEDs, adult high school diplomas, and those who are accepted into a college degree program without a high school diploma. Depending on the method used, on-time graduation rates in 2009 were between 66 and 75 percent. And yet, self-reported Census figures suggest that 90 percent of working-age adults eventually earn a diploma or the equivalent. Associate’s degrees account for 9 percent of the 18 percent with an associate’s degree or certificate. Reliable post-secondary certificate attainment rates are not available. Community colleges report that they are awarding about 5,000 certificates per year, but some of those go to learners who have associate’s or bachelor’s degrees, and some people earn more than one certificate. Based on data from the 2008 Oregon Population Survey, we estimate that 62 percent of certificates go to people without an associate’s or bachelor’s degree, and that 9 percent of young working-age adults have a certificate as their highest level of attainment. We were not able to estimate the number of certificates or credentials issued by institutions other than community colleges, so 18 percent with an associate’s degree or certificate is probably a conservative estimate.
6 Fall enrollment estimates (rounded to the nearest 10,000): 560,000 in K-12 (Oregon Department of Education, fall 2010); 180,000 in community colleges (communication with Commissioner of Community Colleges and Workforce Development, September 2011); 100,000 in the Oregon University System (see http://www.ous.edu/news/111011).
7 National Center for Education Statistics, Digest of Education Statistics, 2010. As reported by The College Completion Agenda, 2011 Progress Report, Indicator 6.4g, http://completionagenda.collegeboard.org/sites/default/files/reports_pdf/Progress_Report_2011.pdf. Accessed December 12, 2011.
8 ECONorthwest analysis of U.S. Census Bureau, American Community Survey, 2010 3-year estimates; Bureau of Economic Analysis data.
9 Of adults ages 25-34. U.S. average is 22 percent. U.S. Census Bureau, American Community Survey, 2009 5-Year estimates. As reported by The College Completion Agenda, 2011 Progress Report, Indicator 10.1e, http://completionagenda.collegeboard.org/sites/default/files/reports_pdf/Progress_Report_2011.pdf. Accessed December 12, 2011.
10 Oregon University System Fact Book, 2010. See http://www.ous.edu/factreport/factbook/2010.
11 Darling-Hammond, L. (2010). The Flat World and Education, Teachers College Press, p. 30.

12 ECONorthwest analysis of U.S. Census Bureau, American Community Survey, 2010 3-year estimates. Household language statistic is from American Community Survey, 2009 PUMS, 3-year estimates.
13 Oregon Department of Education analysis of ODE and and National Student Clearinghouse data for Oregon’s cohort of high school graduates in 2009. Includes those enrolled in 2-year or 4-year college the fall following high school graduation. Low-income status is that reported for NCLB purposes. See also: The College Completion Agenda, 2011 Progress Report, Indicator 6.4f. Data from the National Center for Education Statistics, Digest of Education Statistics, 2010. http://completionagenda.collegeboard.org/sites/default/files/reports_pdf/Progress_Report_2011.pdf. Accessed December 12, 2011.
14 See http://www.ous.edu/state_board/jointb/sis for the task force’s forthcoming report.

Appendices
1) 2011 Legislation a. Senate Bill 909 b. Senate Bill 253
2) Summary of Outreach and Communications 3) Chief Education Officer Job Description 4) Public Education Budget Data
a. P-20 b. Early Learning
5) Sample Achievement Compacts a. K-12, from Confederation of Oregon School Administrators b. K-12, from SB 909 Work Group’s Outcome-Based Investment Work Team
1. Narrative 2. Achievement compact
c. Educational Service District submitted by Oregon Association of ESDs 1. Regional achievement compact 2. Regional operations efficiency compact
d. Community colleges, from the Community Colleges and Workforce Development Department
e. Oregon University System, submitted by the Chancellor’s Office 6) Data System Development Memo 7) Education Fact Sheets: PreK, K-12, CC, OUS 8) Glossary 9) Supplemental Notes for Figures and Table

Appendix 1: 2011 Legislation
a. Senate Bill 909 b. Senate Bill 253

76th OREGON LEGISLATIVE ASSEMBLY--2011 Regular Session
Enrolled
Senate Bill 909Sponsored by COMMITTEE ON RULES (at the request of Governor John A. Kitzhaber)
CHAPTER .................................................
AN ACT
Relating to education; appropriating money; and declaring an emergency.
Be It Enacted by the People of the State of Oregon:
SECTION 1. (1) The Oregon Education Investment Board is established for the purpose
of ensuring that all public school students in this state reach the education outcomes es-
tablished for the state. The board shall accomplish this goal by overseeing a unified public
education system that begins with early childhood services and continues throughout public
education from kindergarten to post-secondary education.
(2)(a) The board consists of 13 members as follows:
(A) The Governor, or the designee of the Governor; and
(B) Twelve members who are appointed by the Governor, subject to confirmation by the
Senate in the manner provided in ORS 171.562 and 171.565, and who serve at the pleasure of
the Governor.
(b) When determining who to appoint to the board, the Governor shall:
(A) Ensure that each congressional district of this state is represented by at least one
member of the board; and
(B) Solicit recommendations from the Speaker of the House of Representatives for at
least two members and from the President of the Senate for at least two members.
(3) The Governor, or the Governor’s designee, shall serve as chairperson of the Oregon
Education Investment Board.
(4) The duties of the board include:
(a) Ensuring that early childhood services are streamlined and connected to public edu-
cation from kindergarten through grade 12 and that public education from kindergarten
through grade 12 is streamlined and connected to post-secondary education. To assist the
board in fulfilling this duty, the board shall oversee the Early Learning Council established
by section 4 of this 2011 Act.
(b) Recommending strategic investments in order to ensure that the public education
budget is integrated and is targeted to achieve the education outcomes established for the
state.
(c) Providing an integrated, statewide, student-based data system that monitors expend-
itures and outcomes to determine the return on statewide education investments. The board
shall provide the data system described in this paragraph by:
(A) Developing the data system or identifying or modifying an existing data system that
accomplishes the goals of the data system; and
(B) Ensuring that the data system is maintained.
Enrolled Senate Bill 909 (SB 909-B) Page 1
(5) An appointed member of the board is entitled to compensation and expenses as pro-
vided in ORS 292.495.
(6) A majority of the members of the board constitutes a quorum for the transaction of
business.
(7) The board shall meet at such times and places specified by the call of the chairperson
or of a majority of the members of the board.
(8) In accordance with applicable provisions of ORS chapter 183, the board may adopt
rules necessary for the administration of the laws that the board is charged with adminis-
tering.
SECTION 2. (1) The Oregon Education Investment Board established by section 1 of this
2011 Act shall appoint a Chief Education Officer who shall serve at the pleasure of the board.
(2) The Chief Education Officer shall be a person who, by training and experience, is well
qualified to:
(a) Perform the duties of the office, as determined by the board; and
(b) Assist in carrying out the functions of the board, as described in section 1 of this 2011
Act.
SECTION 3. (1) The Oregon Education Investment Fund is established in the State
Treasury, separate and distinct from the General Fund. Moneys in the Oregon Education
Investment Fund may be invested and reinvested. Interest earned by the Oregon Education
Investment Fund shall be credited to the fund.
(2) Moneys in the Oregon Education Investment Fund are continuously appropriated to
the Oregon Education Investment Board established by section 1 of this 2011 Act for the
purpose of funding the duties of the board related to early childhood services and public ed-
ucation from kindergarten through post-secondary education.
SECTION 4. (1) The Early Learning Council is established. The council shall function
under the direction and control of the Oregon Education Investment Board established by
section 1 of this 2011 Act.
(2) The council is established for the purpose of assisting the board in overseeing a uni-
fied system of early childhood services, including the funding and administration of those
services.
(3)(a) The council consists of nine members who are appointed by the Governor and serve
at the pleasure of the Governor.
(b) When determining who to appoint to the council, the Governor shall:
(A) Ensure that at least one of the members is an appointed member of the Oregon Ed-
ucation Investment Board;
(B) Ensure that each congressional district of this state is represented by at least one
member of the council;
(C) For a member who is not an appointed member of the Oregon Education Investment
Board, ensure that the member meets the following qualifications:
(i) Demonstrates leadership skills in civics or the member’s profession;
(ii) To the greatest extent practicable, contributes to the council’s representation of the
geographic, ethnic, gender, racial and economic diversity of this state; and
(iii) Contributes to the council’s expertise, knowledge and experience in early childhood
development, early childhood care, early childhood education, family financial stability, pop-
ulations disproportionately burdened by poor education outcomes and outcome-based best
practices; and
(D) Solicit recommendations from the Speaker of the House of Representatives for at
least two members and from the President of the Senate for at least two members.
(4) The activities of the council shall be directed and supervised by the Early Childhood
System Director, who is appointed by the Governor and serves at the pleasure of the Gov-
ernor.
Enrolled Senate Bill 909 (SB 909-B) Page 2

SECTION 5. (1) The Early Learning Council established by section 4 of this 2011 Act shall
prepare and submit to the Oregon Education Investment Board the information described in
this section for inclusion in the report required under section 6 of this 2011 Act.
(2) The council shall conduct an analysis of plans to merge, redesign or improve the co-
ordination of early childhood services and to align early childhood services with child-
centered outcomes. The early childhood services to be considered in the analysis include:
(a) Certain programs or services funded or administered by the State Commission on
Children and Families, including:
(A) Healthy Start Family Support Services programs described in ORS 417.795.
(B) Relief nurseries described in ORS 417.788.
(C) Community schools described in ORS 336.505 to 336.525.
(D) Great Start.
(E) Family preservation programs.
(F) Any other services identified by the board that are funded by grants or other moneys
awarded to the commission for the purpose of serving children, youth and families.
(b) Certain programs or services funded or administered by the Department of Educa-
tion, including:
(A) Early intervention services.
(B) Early childhood special education.
(C) Head Start programs.
(D) Oregon prekindergarten programs, as defined in ORS 329.170.
(E) The federal Even Start Statewide Family Literacy Initiative.
(F) Special education and related services, to the extent that the special education and
related services affect early learning goals.
(c) Certain programs funded or administered by the State Library, including Ready to
Read.
(d) Certain programs or services funded or administered by the Oregon Health Authority,
including:
(A) Maternal and child health services.
(B) The Women, Infants and Children Program established by ORS 409.600.
(e) Certain programs funded or administered by the Employment Department, including:
(A) The Child Care Division established under ORS 657A.010.
(B) The Commission for Child Care created by ORS 657A.600.
(f) Certain programs funded or administered by the Department of Human Services, in-
cluding:
(A) The Employment Related Day Care program.
(B) The Wraparound initiative described in ORS 418.977.
(3) The council shall establish a plan to implement early childhood services that could
be implemented by June 30, 2012, to accomplish the following goals:
(a) Ensure the early identification of children and families who are at risk based upon
identified, critical indicators.
(b) Establish and maintain family support managers who:
(A) Coordinate support services provided to children and families;
(B) Act as an intermediary between providers of support services and children and fam-
ilies receiving support services; and
(C) Serve a geographic area that represents the service area of one or more elementary
schools.
(c) Ensure that contracts with early childhood services providers require measured
progress, establish goals and provide payment based on the success of the provider in
achieving the goals.
(d) Establish kindergarten readiness assessments and early learning benchmarks.
Enrolled Senate Bill 909 (SB 909-B) Page 3

(e) Collect and evaluate data related to early childhood services to ensure that stated
goals are being achieved.
(4) The council shall submit the information described in this section to the board by a
date identified by the board. The board shall determine what information to present in the
report described in section 6 of this 2011 Act and how the information shall be presented.
SECTION 6. (1) The Oregon Education Investment Board established by section 1 of this
2011 Act shall submit a report to the interim legislative committees on education on or be-
fore December 15, 2011, and may file proposed legislative measures with the Legislative
Counsel in the manner allowed by both houses of the Legislative Assembly.
(2) The report required by this section shall describe the proposed legislative measures,
which may provide for any of the following:
(a) Allowing the Oregon Education Investment Board to carry out the duties of the board
described in section 1 of this 2011 Act.
(b) Merging, redesigning or improving the coordination of early childhood services and
aligning early childhood services with child-centered outcomes, as described in section 5 (2)
of this 2011 Act.
(c) Implementing early childhood services that meet the goals described in section 5 (3)
of this 2011 Act.
(d) Merging the State Board of Education and the State Board of Higher Education and
transferring the duties of those boards and the State Commission on Children and Families
to the Oregon Education Investment Board by June 30, 2012.
(e) Requiring the Commissioner for Community College Services, the Chancellor of the
Oregon University System and the executive director of the Oregon Student Assistance
Commission to function under the direction and control of the Chief Education Officer of the
Oregon Education Investment Board by June 30, 2012.
(f) Consolidating, aligning and coordinating governance, programs and funding for youth
development and training, including the Oregon Youth Investment Foundation, juvenile
crime prevention programs and services, the Oregon Youth Conservation Corps and the
Youth Standing Committee of the Oregon Workforce Investment Board.
SECTION 7. The Oregon Education Investment Board established by section 1 of this 2011
Act shall ensure that the statewide data system described in section 1 (4)(c) of this 2011 Act
is operating on or before June 30, 2012.
SECTION 8. If Senate Bill 242 becomes law, section 1 of this 2011 Act is amended to read:
Sec. 1. (1) The Oregon Education Investment Board is established for the purpose of ensuring
that all public school students in this state reach the education outcomes established for the state.
The board shall accomplish this goal by overseeing a unified public education system that begins
with early childhood services and continues throughout public education from kindergarten to
post-secondary education.
(2)(a) The board consists of 13 members as follows:
(A) The Governor, or the designee of the Governor; and
(B) Twelve members who are appointed by the Governor, subject to confirmation by the Senate
in the manner provided in ORS 171.562 and 171.565, and who serve at the pleasure of the Governor.
(b) When determining who to appoint to the board, the Governor shall:
(A) Ensure that each congressional district of this state is represented by at least one member
of the board; and
(B) Solicit recommendations from the Speaker of the House of Representatives for at least two
members and from the President of the Senate for at least two members.
(3) The Governor, or the Governor’s designee, shall serve as chairperson of the Oregon Educa-
tion Investment Board.
(4) The duties of the board include:
(a) Ensuring that early childhood services are streamlined and connected to public education
from kindergarten through grade 12 and that public education from kindergarten through grade 12
Enrolled Senate Bill 909 (SB 909-B) Page 4

is streamlined and connected to post-secondary education. To assist the board in fulfilling this duty,
the board shall oversee:
(A) The Early Learning Council established by section 4 of this 2011 Act.
(B) The Higher Education Coordinating Commission established by section 1, chapter ___,
Oregon Laws 2011 (Enrolled Senate Bill 242).
(b) Recommending strategic investments in order to ensure that the public education budget is
integrated and is targeted to achieve the education outcomes established for the state.
(c) Providing an integrated, statewide, student-based data system that monitors expenditures and
outcomes to determine the return on statewide education investments. The board shall provide the
data system described in this paragraph by:
(A) Developing the data system or identifying or modifying an existing data system that ac-
complishes the goals of the data system; and
(B) Ensuring that the data system is maintained.
(5) An appointed member of the board is entitled to compensation and expenses as provided in
ORS 292.495.
(6) A majority of the members of the board constitutes a quorum for the transaction of business.
(7) The board shall meet at such times and places specified by the call of the chairperson or of
a majority of the members of the board.
(8) In accordance with applicable provisions of ORS chapter 183, the board may adopt rules
necessary for the administration of the laws that the board is charged with administering, including
any rules necessary for the oversight of the direction and control of the Higher Education
Coordinating Commission.
SECTION 9. The amendments to section 1 of this 2011 Act by section 8 of this 2011 Act
become operative on January 1, 2012.
SECTION 10. Sections 1 to 7 of this 2011 Act are repealed on March 15, 2016.
SECTION 11. (1) On March 15, 2016, the Chief Education Officer of the Oregon Education
Investment Board shall deliver to the Chancellor of the Oregon University System all records
and property within the jurisdiction of the Chief Education Officer that relate to the duties,
functions and powers of the Oregon Education Investment Board. The Chancellor of the
Oregon University System shall take possession of the records and property.
(2) On March 15, 2016, the Early Childhood System Director shall deliver to the Super-
intendent of Public Instruction all records and property within the jurisdiction of the Early
Childhood System Director that relate to the duties, functions and powers of the Early
Learning Council. The Superintendent of Public Instruction shall take possession of the re-
cords and property.
(3) The Governor shall resolve any dispute between the Chief Education Officer and the
Chancellor of the Oregon University System, or the Early Childhood System Director and the
Superintendent of Public Instruction, relating to transfers of records and property under this
section, and the Governor’s decision is final.
SECTION 12. On March 15, 2016, the unexpended balances of amounts authorized to be
expended by the Oregon Education Investment Board for the biennium beginning July 1, 2015,
from revenues dedicated, continuously appropriated, appropriated or otherwise made avail-
able to the board for the purpose of administering and enforcing the duties, functions and
powers of the board under sections 1 to 7 of this 2011 Act are transferred to the General
Fund to be available for general governmental expenses.
SECTION 13. This 2011 Act being necessary for the immediate preservation of the public
peace, health and safety, an emergency is declared to exist, and this 2011 Act takes effect
on its passage.
Enrolled Senate Bill 909 (SB 909-B) Page 5

Passed by Senate June 20, 2011
..................................................................................
Robert Taylor, Secretary of Senate
..................................................................................
Peter Courtney, President of Senate
Passed by House June 21, 2011
..................................................................................
Bruce Hanna, Speaker of House
..................................................................................
Arnie Roblan, Speaker of House
Received by Governor:
........................M.,........................................................., 2011
Approved:
........................M.,........................................................., 2011
..................................................................................
John Kitzhaber, Governor
Filed in Office of Secretary of State:
........................M.,........................................................., 2011
..................................................................................
Kate Brown, Secretary of State
Enrolled Senate Bill 909 (SB 909-B) Page 6

76th OREGON LEGISLATIVE ASSEMBLY--2011 Regular Session
Enrolled
Senate Bill 253Printed pursuant to Senate Interim Rule 213.28 by order of the President of the Senate in conform-
ance with presession filing rules, indicating neither advocacy nor opposition on the part of thePresident (at the request of Senate Interim Committee on Education and General Governmentfor Higher Education Workgroup)
CHAPTER .................................................
AN ACT
Relating to higher education; amending ORS 351.003 and 351.009; and repealing ORS 351.005 and
351.007.
Be It Enacted by the People of the State of Oregon:
SECTION 1. ORS 351.005 and 351.007 are repealed.
SECTION 2. ORS 351.003 is amended to read:
351.003. In addition to making the findings under ORS 351.001, the Legislative Assembly finds
that:
(1) Oregonians need access to [post-secondary education opportunities] educational opportu-
nities beyond high school and throughout life [in a variety of forms].
(2) To meet the societal and individual needs described under ORS 351.001, Oregonians have
created and [sustained, from territorial days to the present, many and] should sustain diverse insti-
tutions of higher education, both independent and state-assisted.
(3) These institutions have developed the intellectual capacity of Oregonians and have prepared
thousands of them for productive and fulfilling careers.
(4) These institutions should provide educational access to all segments of Oregon’s diverse
population[, including many students for whom higher education creates the first opportunity for their
entry into the mainstream of society].
(5) These institutions provide research[, both basic and applied,] that generates [new] knowledge
value [and applies it to the development of new products and processes] essential for Oregon’s eco-
nomic growth.
(6) These institutions [provide public service activities that] engage the professional expertise of
their faculties to solve social problems.
(7) These institutions [share with our communities many] provide important cultural activities
and services [of immense importance to the quality of life enjoyed by Oregonians] that add to
Oregon’s quality of life.
[(8) These institutions are expanding the times, places and formats of course offerings.]
[(9) Oregonians’ diverse educational needs will be best met in an environment in which public and
independent schools are recognized as critical for meeting those needs.]
SECTION 3. ORS 351.009 is amended to read:
351.009. The Legislative Assembly declares that the mission of all [higher] education beyond
high school in Oregon [is to] includes achievement of the following by 2025:
Enrolled Senate Bill 253 (SB 253-A) Page 1

[(1) Enable students to extend prior educational experiences in order to reach their full potential
as participating and contributing citizens by helping them develop scientific, professional and techno-
logical expertise, together with heightened intellectual, cultural and humane sensitivities and a sense
of purpose.]
[(2) Create, collect, evaluate, store and pass on the body of knowledge necessary to educate future
generations.]
[(3) Provide appropriate instructional, research and public service programs to enrich the cultural
life of Oregon and to support and maintain a healthy state economy.]
(1) Ensure that at least 40 percent of adult Oregonians have earned a bachelor’s degree
or higher;
(2) Ensure that at least 40 percent of adult Oregonians have earned an associate’s degree
or post-secondary credential as their highest level of educational attainment; and
(3) Ensure that the remaining 20 percent or less of all adult Oregonians have earned a
high school diploma, an extended or modified high school diploma or the equivalent of a high
school diploma as their highest level of educational attainment.
Passed by Senate February 10, 2011
..................................................................................
Robert Taylor, Secretary of Senate
..................................................................................
Peter Courtney, President of Senate
Passed by House June 21, 2011
..................................................................................
Bruce Hanna, Speaker of House
..................................................................................
Arnie Roblan, Speaker of House
Received by Governor:
........................M.,........................................................., 2011
Approved:
........................M.,........................................................., 2011
..................................................................................
John Kitzhaber, Governor
Filed in Office of Secretary of State:
........................M.,........................................................., 2011
..................................................................................
Kate Brown, Secretary of State
Enrolled Senate Bill 253 (SB 253-A) Page 2

Appendix 2: Summary of Outreach and Communications
Since the summer, Governor John Kitzhaber and members of his staff – notably Tim Nesbitt, Oregon Education Investment Project Manager, and Education Policy Advisor Ben Cannon – have engaged educators, students, families and members of the broader public in discussions around the new direction for Oregon’s public education system. This is a summary of the public engagement and communication strategies to date. Convening stakeholders around the issues Organizations have sponsored intensive sessions where stakeholders have grappled with some of the key issues included in Senate Bill 909 and the design of a seamless public education system and achieving the 40-‐40-‐20 goals.
• The Oregon Board of Education invited roughly 60 educators to a day-‐long retreat in August to develop ideas to help reach the 40-‐40-‐20 vision, identifying their hopes for the education system and barriers to success.
• For a month in August, 33 individuals – just over half teachers and administrators in public schools and colleges -‐-‐ met three days a week to brainstorm about the architecture for the new system. Participants in Learnworks, which was sponsored by the Oregon Business Council, have presented their ideas to legislators, the Oregon Education Investment Team and the Senate Bill 909 Work Group.
• The Oregon University System convened almost 300 educators and stakeholders in Corvallis November 1 for a full-‐day symposium on meeting the 40-‐40-‐20 goal.
• The Oregon Department of Education has nearly 100 people helping to develop Oregon’s ESEA Flexibility Waiver application. The teams’ work on next-‐generation accountability measures and interventions will dovetail with the Oregon Education Investment Board’s work to establish outcome measures and investments to boost student achievement.
Participating in statewide organizations’ events The Governor and education advisors have offered workshops, given talks, answered questions and heard valuable input as they participated in organizations’ events:
• Oregon School Boards Association annual convention • Community and Parents for Public Schools parent conference • Confederation of Oregon School Administrators, superintendents and principals • Oregon Education Association community colleges council • Statewide Chambers of Commerce convention • Superintendent of Public Instructions’ Youth Advisory Team meeting • Oregon Community College Association annual conference • Tribal Summit • American Federation of Teachers state council • Oregon Community Foundation regional leadership council meetings • Cradle-‐to-‐Career Council, Portland Schools Foundation/All Hands Raised
Visits to communities Gov. Kitzhaber, Tim Nesbitt, Ben Cannon and policy staffer Todd Jones have visited communities across Oregon to meet with community leaders, superintendents, teachers, college presidents, students and others.

They have toured schools and colleges, learned about promising practices and areas of concern. Among the communities in the last four months:
• Albany • Astoria • Bandon • Bend • Corvallis • Cottage Grove • Eugene • Happy Valley
• Hillsboro • Hood River • LaGrande • Lincoln City • Medford • Oregon City • Pendleton • Portland
• Roseburg • Salem • Seaside • Springfield • Tillamook • Umatilla • Woodburn
Website The Governor’s website has been regularly updated, with speeches, news releases, meeting materials, minutes and other items posted. Contact information for the OEIB is provided, and almost 100 people are now on the public meeting notification list (the upcoming schedule and meeting information are also posted online). We will also soon launch a new URL, www.education.oregon.gov, making it easier to share a quick link to this information. Broader public involvement Most of the engagement to date has focused on educators and stakeholder organizations. With the Oregon Education Investment Board now confirmed, we have the opportunity to engage more broadly. Every meeting will have scheduled time for public testimony, and meetings will be streamed live. In preparation for Oregon’s application for a federal ESEA Flexibility Waiver, 6,000 respondents from across the state – teachers, students, parents, school administrators and board members and many others – responded to an online survey focused on measures of student achievement, accountability measures. The board has taken public testimony at four meetings, and will plan to hold community forums regionally in January 2012. News coverage The education agenda has been covered in many Oregon media outlets, as the Governor’s speeches, his and his staff’s visits around Oregon and other activities have generated coverage and commentary this fall:
• Albany Democrat-‐Herald • Astoria, Daily Astorian • Corvallis Gazette-‐Times • Enterprise, The Wallowa Chieftain • Eugene, KEZI TV • Eugene Register-‐Guard • Florence, the Siuslaw News • Forest Grove News-‐Times • Grants Pass Daily Courier • Gresham Outlook • Hermiston Herald • Hillsboro Argus • LaGrande Observer
• OPB Radio • Pendleton, The East Oregonian • Portland, The Oregonian • The Portland Tribune • Roseburg News-‐Review • Roseburg, KPIC TV • Salem Statesman Journal • Seaside Signal • Springfield Times • Tillamook Headlight Herald • Waldport South Lincoln County News • West Linn Tidings
Links to the articles, along with other local, state and national coverage of education issues, can be found on the OEIB website.

Appendix 3: Chief Education Officer Job Description

1 Adopted by the Oregon Education Investment Board, 12-07-2011
Chief Education Officer State of Oregon
JOHN KITZHABER Governor of Oregon OEIB Chair NANCY GOLDEN Chair Designee RICHARD ALEXANDER JULIA BRIM-EDWARDS YVONNE CURTIS MATTHEW DONEGAN SAMUEL HENRY NICHOLE MAHER MARK MULVIHILL DAVID RIVES RON SAXTON MARY SPILDE KAY TORAN JOHANNA VAANDERING Advisors Susan Castillo Supt. of Public Instruction Camille Preus Commissioner of Community Colleges and Workforce Development George Pernsteiner Chancellor of the Oregon University System Josette Green Oregon Student Access Commission Staff Tim Nesbitt
The Oregon Education Investment Board (Board) seeks a Chief Education Officer to lead the transformation of Oregon’s public education system from early childhood through high school and college in order to enable the successful participation of all Oregonians in the economic and civic life of their state. The Chief Education Officer will serve as the Board’s chief executive officer in the creation, implementation and management of an integrated and aligned public education system from pre-school through post-secondary education, as directed by legislation (Senate Bill 909) enacted with broad bipartisan support in the 2011 legislative session. Pursuant to this legislation, the Board appoints the Chief Education Officer, who serves at the pleasure of the Board. The Governor serves as chair of the Board. The initial phase of the Chief Education Officer’s tenure will require visionary leadership, skillful collaboration with legislators, educators, parents and education stakeholders at the state and local level and the effective engagement of community leaders and citizens to build and implement an integrated and aligned education system. Also, the Chief Education officer will assume a lead role in the Governor’s budget redesign team to align state funding and policies with the organization and delivery of a seamless “P-20” educational system, beginning with the 2012-13 school year. Pursuant to Senate Bill 909, the Board appoints the Chief Education Officer. Consistent with this legislation and subject to approval by the Legislature in February 2012, the Board intends that the Chief Education Officer shall have direction-and-control authority for the following positions:
• Commissioner of Community Colleges and Workforce Development;
• Chancellor of the Oregon University System;
• Executive Director of the Oregon Student Access Commission;
• Early Childhood System Director;
• Deputy Superintendent of Public Instruction (upon appointment per Senate Bill 552)
• Executive Director of the Higher Education Coordinating Commission (upon appointment per Senate Bill 242)
Oregon’s public education system consists of numerous early childhood service providers and early learning programs, 197 school districts, 19 education service districts, 17 community college districts, a university system of seven public universities and the health professions and graduate programs of Oregon Health and Science University.

2 Adopted by the Oregon Education Investment Board, 12-07-2011
The Board’s immediate priority is to transform the system of state funding for these institutions to promote high levels of educational achievement across the education continuum for the state’s children, students, and adults. To this end, the Chief Education Officer shall advise and assist the Board in the development and implementation of investment strategies to achieve specified learning outcomes and methods of encouraging innovation and the adoption of proven best practices across the educational continuum. In separate legislation (Senate Bill 253), the state has established goals for high school and college completion to be attained by 2025, namely that forty percent of Oregon’s adults have four-year post-secondary degrees or better, forty percent have two-year degrees or other post-secondary certifications, and the remaining twenty percent have a high school diploma (40/40/20). The Board and the Chief Education Officer shall be guided by the following goals and principles in establishing and maintaining a long-term vision for Oregon’s education system:
• The high school and post-secondary completion goals of 40/40/20; • A commitment to a seamless public education system from early childhood
through college and career readiness; and, • A commitment to equity for all students, with particular attention to
race/ethnicity, English language learners, economically disadvantaged students and students with disabilities.
Desired Experience and Qualifications The Board seeks candidates who meet most of the following criteria.
1. Leadership with Results. Proven leadership ability with demonstrated results in large and complex organizations and with diverse constituencies. Track record of identification and implementation of best practices across an organizational structure.
2. Change Agent. Demonstrated ability to advance, achieve, and sustain major
system change through personal leadership abilities, team-building skills, and innovative use of resources.
3. Systems Experience. Practical knowledge of system-wide approaches to
achieve institutional change. Integrative thinker. Ability to design, direct, streamline, align, and navigate complex organizational systems to achieve desired outcomes.
4. Education Expertise/Experience. Experience as an educator or in a
leadership position in public education. Understands and values a strong public education system, and has the ability to work across the early learning, K-12, and higher ed continuum.
5. Strong Communicator. Excellent communication skills demonstrated with
multiple audiences. Ability to integrate collaboration, communication and feedback in the education community. Ability to articulate and inspire commitment to a shared vision for educational accomplishment at all levels.

Appendix 4: Public Education Budget Data
a. P-20 b. Early Learning

Early LearningK-12 School Fund Formula All Other Grant-In-Aid All Other K-12 SubtotalTeacher Standards and PracticesCommunity Colleges & Workforce Dev.Oregon University SystemOregon Health & Sciences UniversityStudent Assistance Commission
Oregon's Public Education Investment2011-13 Budgeted
General/ Lottery*Local Property
TaxesState and Local
SubtotalTuition, Fees,
Other Federal
315,758,148 315,758,148 54,604,222 456,386,288
5,712,250,268 3,151,167,084 8,863,417,352 340,252 61,000,000109,085,134 109,085,134 19,782,103 739,635,40947,206,585 47,206,585 35,022,527 60,578,523
5,816,230,357 5,816,230,357 55,144,882 861,213,932100,000 3,151,167,084 3,151,267,084 5,444,612
425,273,158 284,200,000 709,473,158 567,616,639 117,309,583692,128,139 692,128,139 1,946,480,230 ***66,059,636 66,059,636 139,764,760
102,551,498 102,551,498 21,457,4267,418,100,936 3,435,367,084 10,853,468,020 2,790,512,771 1,434,909,803
Oregon's Public Education Investment2011-13 Budgeted
Total
826,748,658 **
8,924,757,604868,502,646142,807,635
6,732,589,1713,156,711,6961,394,399,3802,638,608,369
205,824,396124,008,924
15,078,890,594
Oregon's Public Education Investment2011-13 Budgeted
*General Fund budgets exclude the 3.5% Set-Aside for the Ending Fund Balance for all programs except the School Fund Formula. **Includes programs in Education, Employment, Human Services, the Health Authority, Commission on Children and Families, State Library, and Governor's Office. Also includes $130 million in Federal Head Start Funds that pass directly to local programs.
Source: State Budget and Management Division and Oregon Department of Education *General Fund budgets exclude the 3.5% Set-Aside for the Ending Fund Balance for all programs except the School Fund Formula. **Includes programs in Education, Employment, Human Services, the Health Authority, Commission on Children and Families, State Library, and Governor's Office. Also includes $130 million in Federal Head Start Funds that pass directly to local programs.
Source: State Budget and Management Division and Oregon Department of Education
**Includes programs in Education, Employment, Human Services, the Health Authority, Commission on Children and Families, State Library, and Governor's Office. Also includes $130 million in Federal Head Start Funds that pass directly to local programs.
Source: State Budget and Management Division and Oregon Department of Education
***Does not include Non-Limited Gifts, Grants and Contracts funds.***Does not include Non-Limited Gifts, Grants and Contracts funds.

2011-13 LAB - State Early Learning Programs
Agency/Program General Fund Federal Fund Other Fund Total Funds (Less 3.5% Set-Aside)
Governor's Office
State ECE Council & Coordinator $ 750,183 $ 750,183
Employment Department
Childcare Division/Commission $ 3,670,948 $ 128,161,683 $ 3,066,420 $ 134,899,051
Oregon State Library
Ready to Read Grant Program $ 1,215,466 $ 8,517 $ 1,223,983
Oregon Health Authority
Babies First $ 1,286,904 $ 1,286,904
Maternal and Child Health Block Grant $ 11,832,058 $ 11,832,058
Women Infants and Children $ 154,442,796 $ 40,000,000 $ 194,442,796
Department of Human Services
Employment Related Daycare $ 14,228,844 $ 14,228,844
Children's Wraparound Initiative $ 581,493 $ 1,490,217 $ 2,071,710
Department of Education
Early Intervention $ 24,204,956 $ 9,640,266 $ 33,845,222
Early Childhood Special Education $ 91,056,740 $ 20,768,312 $ 111,825,052
Oregon Pre-kindergarten $ 122,253,886 $ 122,253,886
Early Headstart $ 916,997 $ 916,997
Head Start Collaboration $ 22,617 $ 250,000 $ 272,617
Early Childhood Program Unit $ 537,462 $ 482,013 $ 1,019,475
Even Start $ -
Commission on Children & Families
Healthy Start (OCCF) $ 14,096,139 $ 4,383,695 $ 18,479,834
Relief Nurseries $ 3,610,859 $ 2,048,336 $ 5,659,195
System Development $ 10,014,325 $ - $ 10,014,325
OCCF State Staff $ 1,434,602 $ 15,073 $ 1,449,675
Community Schools $ 87,818 $ - $ 87,818
Children Youth and Families $ 1,595,987 $ - $ 1,595,987
Great Start $ 1,579,355 $ - $ 1,579,355
Family Preservation and Support $ 3,600,481 $ 3,600,481
Total Early Learning Programs $ 292,395,398 $ 326,335,828 $ 54,604,222 $ 673,335,448
Special Purpose Appropriation - Early Learning
Early Learning Programs & Services $ 17,649,000 $ 17,649,000
Employment Related Daycare and Other $ 5,713,750 $ 5,713,750
Total Early Learning Funding $ 315,758,148 $ 326,335,828 $ 54,604,222 $ 696,698,198

Appendix 5: Sample Achievement Compacts
The Oregon Education Investment Board has reviewed sample achievement compacts drafted by several organizations. These are a work in progress, and provide a prototype for further development and adoption by the OEIB in 2012.
a. K-12, from Confederation of Oregon School Administrators b. K-12, from SB 909 Work Group’s Outcome-Based Investment Work Team
1. Narrative 2. Achievement compact
c. Educational Service District submitted by Oregon Association of ESDs 1. Regional achievement compact 2. Regional operations efficiency compact
d. Community colleges, from the Community Colleges and Workforce Development Department
e. Oregon University System, submitted by the Chancellor’s Office

COSA/OASE Superintendents Vision & Policy Task Force | DRAFT Achievement Compact 1
K-‐12 Achievement Compact: A Promise for Oregon’s Future
Across multiple measures, Oregon students today perform better than ever before. Student performance on statewide reading and math assessments at all grade levels has increased significantly over the past decade. Oregon students rank second in the nation on the SAT, one of the measures predictive of college preparedness. Graduation rates are historically high. And Oregon students today complete rigorous courses – such as Advanced Placement, International Baccalaureate, or dual (college) credit – much more frequently than in the past. By other measures – Oregon student performance on the NAEP, and achievement gaps in graduation and student achievement, for example – Oregon schools and students have not fared as well.
To the credit of Oregon educators and students, progress has been achieved during a time of declining investment of state resources in education. As signers of this compact, we acknowledge the advancements our students and schools have made – and we take responsibility for where we have fallen short. We recognize the hard work and accomplishments of our students, our teachers and our school leaders. And, as educators and policymakers, we understand this simple, yet challenging truth: we can, and must, do better.
With this compact:
• We choose to compare our performance, not with the schools of the past, but with the schools we envision for the future;
• We commit to the aspiration of “40-‐40-‐20,” in which 40 percent of Oregon students will earn a bachelor’s degree or higher, 40 percent will earn an associate’s degree or post-‐secondary credential, and 20 percent will earn a high school diploma or equivalent;
• We dedicate ourselves to evolving schools in ways that will prepare students for college and career success in our rapidly-‐changing world – graduating students who are well-‐rounded, globally-‐competitive, culturally-‐competent, creative, critical-‐thinking, locally-‐engaged citizens; and
• We pledge to invest the resources necessary to achieve the outcomes listed in this compact.

COSA/OASE Superintendents Vision & Policy Task Force | DRAFT Achievement Compact 2
Outlined on the following pages are suggested components, including outcomes and responsibilities, for achievement compacts between not only the Oregon Education Investment Board (OEIB) and individual school district boards of directors, but also between and among the OEIB and many of the various agencies and organizations serving Oregon students and educators.
These compacts – as agreements, or promises, between two or more parties – provide a platform for reinventing our education system, 0-‐to-‐20, and engaging all stakeholders. The recommended outcomes and targets in this document are offered through the “lens” of K-‐12. Where we suggest responsibilities for others, we do so in the spirit of partnership. We understand that others may have different views, and we look forward to working collaboratively to achieve our shared “40-‐40-‐20” goal.

COSA/OASE Superintendents Vision & Policy Task Force | DRAFT Achievement Compact 3
I. Oregon Achievement Compact: K-‐12 Learning Levels
We believe that there should be just one overall outcome expected of Oregon K-‐12 school districts: achieve the high school graduation outcome envisioned by “40-‐40-‐20” and described in the “Ready for College and Career” Learning Level recommendations (page 4). Along with one overall outcome for K-‐12 districts, we believe that a number of required and optional “on-‐track” indicators should be considered, from kindergarten through graduation. These “on-‐track” indicators are intended to measure student progress toward meeting the outcome at various points along the K-‐12 continuum, and may be viewed as key leverage points for investment or intervention.
We recommend that districts set annual targets for the overall outcome and a handful of “on-‐track” indicators; some of these indicators could be required by the OEIB, while others could be measured at the discretion of local districts. We also recommend that districts have the option of piloting “on-‐track” indicators, and that “on-‐track” indicators be adjusted over time as research and experience dictate.
For small districts, the outcome and some indicators may be difficult to achieve. We recommend making it possible for small districts to group regionally or partner with larger districts in order to create the capacity required to meet compact outcome and indicators.
Achievement Gap, Equity and Academic Growth We believe that the outcomes, indicators, goals and targets in this compact must be addressed by sub-‐group, with specific and unique objectives identified for closing achievement gaps for each sub-‐group, and with goals, targets, data and results disaggregated by sub-‐group. We also believe that assessment of student academic growth, combined with assessment of student proficiency (percentage of students meeting standards) on state assessments, provides a more fair and accurate picture of school effectiveness than our current accountability system, which relies primarily on proficiency. By including growth, we take into account the reality that student populations in our schools come from a wide variety of circumstances, and we can begin to better determine school effectiveness. We recommend a growth-‐and-‐proficiency reporting model like Colorado’s, which plots school performance along a continuum from “Lower Growth, Lower Achievement” to “Higher Growth, Higher Achievement,” and allows comparison and collaboration among “demographically-‐alike” districts.
The Four C’s: Creativity, Critical Thinking, Communication and Collaboration The “Four C’s” of creativity, critical thinking, communication and collaboration are essential 21st Century skills, and schools need support in developing measures in these areas. We recommend that, as they are developed, some of these measures should be added as outcomes and/or indicators in the Achievement Compact.

COSA/OASE Superintendents Vision & Policy Task Force | DRAFT Achievement Compact 4
A. Recommended ‘Ready for College & Career’ Outcome/Indicators (Grades 8-‐14)
Outcome (required)
Standard/ Goal
Current Status
2012-‐13 Target
Required: High School Graduation 40% of students graduate with 28 college credits1 or more; 40% of students graduate with one or more college credits; 20% of students earn a high school diploma, an extended or modified high school diploma, or the equivalent of the high school diploma. (Most students will achieve this outcome in four years, but many may do so in less or more than four years.)
40% 40% 20%
XX% XX% XX%
XX% XX% XX%
‘On-‐Track’ Indicators (some required, others optional)
Standard/ Goal
Current Status
2012-‐13 Target
Percent of students demonstrating proficiency, and percent of students meeting academic growth targets, on statewide reading and math assessments.
XX%
Proficient XX% Growth
XX%
Proficient XX% Growth
XX%
Proficient XX% Growth
Percent of students scoring at “college ready” on ACT or SAT, COMPASS, Acuplacer or other district-‐adopted tool.
XX%
XX%
XX%
Percent of students not retained and on track for graduation at the end of their freshman year.
XX%
XX%
XX%
Percent of students successfully exiting ELL services.
XX%
XX%
XX%
Percent of students enrolled in, and percent of students earning credit, in advanced, AP or IB courses
XX% Enrolled XX% Credit
XX% Enrolled XX% Credit
XX% Enrolled XX% Credit
Percent of students demonstrating proficiency and growth via work samples in reading, writing, math, speaking, social studies and science.
XX% XX%
XX% XX%
XX% XX%
Percent of students participating in extra-‐curricular and co-‐curricular activities.
XX%
XX%
XX%
1According to OUS, students entering college with 28 college credits are “nearly guaranteed a bachelor’s degree.”

COSA/OASE Superintendents Vision & Policy Task Force | DRAFT Achievement Compact 5
B. Recommended ‘Critical Thinking’ Indicators (Grades 4-‐8)
‘On-‐Track’ Indicators (some required, others optional)
Standard/ Goal
Current Status
2012-‐13 Target
Percent of students demonstrating proficiency, and percent of students meeting academic growth targets, on statewide reading and math assessments, in grades 4-‐8.
XX%
Proficient XX%
Growth
XX%
Proficient XX%
Growth
XX%
Proficient XX%
Growth
Percent of students demonstrating proficiency and growth via work samples in reading, writing, math, speaking, social studies and science.
XX% XX%
XX% XX%
XX% XX%
Percent of students completing Algebra I.
XX%
XX%
XX%
Percent of students successfully exiting ELL services.
XX%
XX%
XX%
School attendance rate
XX%
XX%
XX%
C. Recommended ‘Numeracy & Literacy’ Indicators (Grades K-‐4)
‘On-‐Track’ Indicators (some required, others optional)
Standard/ Goal
Current Status
2012-‐13 Target
Percent of students demonstrating proficiency, and percent of students meeting academic growth targets, on state reading and math assessments, in grades 3-‐4.
XX%
Proficient XX% Growth
XX%
Proficient XX% Growth
XX%
Proficient XX% Growth
Percent of students demonstrating proficiency, and percent of students meeting growth targets, on curriculum-‐based measures, in grades 1-‐2.
XX% XX%
XX% XX%
XX% XX%
Percent of students ready to learn by the start of kindergarten.
XX%
XX%
XX%
School attendance rate.
XX%
XX%
XX%

COSA/OASE Superintendents Vision & Policy Task Force | DRAFT Achievement Compact 6
II. Oregon Achievement Compact: Pre-‐K, Higher Education
Listed here are some suggested outcomes that OUS, community colleges and Pre-‐K programs might achieve in partnership with K-‐12 districts, as well as ESDs and ODE.
A. Recommended ‘Lifelong Learning & Success’ Outcomes (Grades 13-‐20)
Outcome
Standard/ Goal
Current Status
2012-‐13 Target
Work collaboratively (K-‐12, OUS and Community Colleges) to improve and/or develop effective tools for measuring college-‐and career-‐readiness, post-‐high-‐school success, creativity and critical thinking, and other desired outcomes.
XX
XX
XX
Work collaboratively (K-‐12, OUS and Community Colleges) to increase the capacity of high schools to award college credit by growing the number of teachers eligible to award credit, while assuring appropriate rigor in college-‐credit courses.
XX% of high
school teachers awarding
college credit
XX%
XX%
Work with K-‐12 districts to develop teacher preparation programs that are aligned with newly-‐adopted standards and performance measures, and address current and future district and statewide needs (e.g., ELL, achievement gap)
XX
XX
XX
B. Recommended ‘Ready to Learn’ Outcomes (Pre-‐K)
Outcome
Standard/ Goal
Current Status
2012-‐13 Target
In collaboration with K-‐12, develop effective assessments for school readiness.
XX
XX
XX

COSA/OASE Superintendents Vision & Policy Task Force | DRAFT Achievement Compact 7
III. Oregon Achievement Compact: State Education System
A compact is, of course, an agreement between two or more parties, each with responsibility for achieving the shared goal and outcomes. Outlined on the following pages are suggested outcomes and responsibilities for the Oregon Education Investment Board (OEIB) and other partners in our education system.
C. Recommended OEIB Outcomes
Outcome
Standard/ Goal
Current Status
2012-‐13 Target
Make the level of state investment necessary to achieve the outcomes listed in this compact.
100%
XX%
XX%
In partnership with school districts, the Oregon Department of Education (ODE) and regional service providers, develop statewide accountability and data systems that provide educators with the information they need to maximize student achievement, while reporting accurately to the public about the performance of Oregon’s education system; this system must measure and report on student growth and proficiency, and be useful to educators in advancing student learning.
XX
XX
XX
Provide dedicated state funding for standards-‐based, best-‐practices professional development of teachers and administrators.
$XX per educator
$0 per
educator
$XX per educator
Provide dedicated state funding for the induction and support of teachers and administrators during their first three years on the job.
$XX per new educator
$XX per new educator
$XX per new educator
In partnership with successful schools and districts, as well as ODE and regional service providers, provide “turnaround assistance” for schools and districts identified as “in need of improvement.”
XX
XX
XX
Align K-‐12 mandates, requirements and expectations of OEIB, State Board, other governing/oversight bodies.
XX
XX
XX

COSA/OASE Superintendents Vision & Policy Task Force | DRAFT Achievement Compact 8
In addition to OEIB, we recommend consideration of achievement compacts and outcomes for other entities in our education system, focusing on how ODE and ESDs and K-‐12 districts might partner to support schools and the work of the OEIB. These outcomes should include:
• Development of resources (such as access to evidence-‐based, best-‐practices research) to support schools and districts in achieving Achievement Compact outcomes.
• Development of statewide accountability and data systems that provide educators with the information they need to maximize student achievement, while reporting accurately to the public about the performance of Oregon’s education system; this system must measure and report on student growth and proficiency, and be useful to educators in advancing student learning.
• Development and implementation of data analysis systems that provide educators with the diagnostic information necessary to track and assess individual student growth in specific skill and sub-‐skill areas through item analysis, trend analysis, and analysis of authentic performance tasks.
• Facilitation and support of standards-‐based, best-‐practices professional development of teachers and administrators, in partnership with school districts and educator professional associations.
• Facilitation of induction and support programs for teachers and administrators during their first three years on the job.
• Development and implementation of “turnaround assistance” for schools and districts identified as “in need of improvement,” in partnership with successful schools and districts, as well as regional service providers.
• Development and implementation of qualitative measures of districts and schools, such as student/parent/staff surveys, organizational assessment rubrics, etc.
• In collaboration with OUS and community colleges, improvement and/or development of effective tools for measuring college-‐and career-‐readiness, post-‐high-‐school success, creativity and critical thinking, and other desired outcomes.
• In collaboration with OUS and community colleges, expansion of the capacity of high schools to award college credit – growing the number of teachers eligible to award credit, while assuring appropriate rigor in college-‐credit courses.
• In collaboration with OUS, evolution of teacher preparation programs that are aligned with newly-‐adopted standards and performance measures, and address current and future district needs.
• In collaboration with Pre-‐K, development of effective assessments for school readiness. • Alignment of requirements and expectations of the OEIB, State Board and other bodies
and agencies, and reduction of state mandates for K-‐12 schools and districts.

EDUCATION ACHIEVEMENT COMPACT: SAMPLE NARRATIVE Outcomes-‐Based Investment Work Team Senate Bill 909 Work Group, October 2011 This Achievement Compact is entered into between the State of Oregon, acting through the Oregon Educational Investment Board, and ____________________, a provider of educational services, for school year 2012-‐13. Part 1: The Vision and Role of Compacts 1. Oregon intends to develop one of the best-‐educated citizenries in the world. The State of Oregon, has established an educational policy that by 2025, 100% of Oregon students will have successfully earned an education degree, which represents achievement of a quality education. Specifically, the state will achieve the following (known as 40/40/20) for Oregonians aged 25-‐34 in 2025:
• 40 percent of adult Oregonians will have earned a bachelor's degree or higher; • 40 percent of adult Oregonians will have earned an associate’s degree or postsecondary credential as
their highest level of educational attainment; and • 20 percent of all adult Oregonians will have earned at least a high school diploma, an extended or
modified high school diploma, or the equivalent of a high school diploma as their highest level of educational attainment.
2. Absent a significant change in policy and investment, Oregon is headed for 30/18/42 (and 10 percent dropouts) rather than 40/40/20. To achieve 40-‐40-‐20 by 2025, it is essential to create a trajectory for all learning organizations that is consistent with that goal. 3. Education resources are currently not aligned with the 40-‐40-‐20 vision. To achieve the goal, it is necessary to (1) Build a learning continuum, rather than a collection of disconnected institutional silos, (2) Invest in learners and learning outcomes instead of head counts and grade levels, and (3) ensure that students are learning at their best pace and achieving their full potential. 4. The State will use Achievement Compacts as partnership agreements to define the roles and commitments of the State and the educational service providers. 5. All providers of educational services that receive state funds are required to enter into Achievement Compacts as a requirement for receipt of state funds in 2012-‐13, and subsequent years. The purpose of the Compact is to specify the desired outcomes and measures of progress to be quantified by the educational entity, and the State’s commitment to provide funding, support and accountability measures. The results measured and data collected from districts will enable the comparison of outcomes and progress within each district and between like districts (those with similar student populations by demographic and socio-‐economic criteria) over time, as well as progress toward the 2025 goal. 6. Toward the goal of 40/40/20 by 2025, the OEIB has set outcome benchmarks: -‐Outcome: Early Learning
By about age 5, learners have the cognitive, social, emotional and behavioral skills necessary for kindergarten.

-‐Outcome: Literacy and Numeracy
By about age 9, learners are proficient in literacy and numeracy and can apply those skills in a variety of context
-‐ Outcome: Ready for Rigor
By their mid-‐teens all learners are establishing academic behaviors; acquiring reading, writing, math, thinking skills; and developing core knowledge that allow them to explore new challenging learning experiences across varied content areas.
-‐ Outcome: Ready for College or Career Entry
By their late teens, learners earn a full option diploma and have the skills necessary to enter college or a career.
-‐Outcome: Locally and Globally Competitive
The majority of learners will obtain a post-‐secondary degree or certificate that attests to their ability to think and learn, and provides them with a durable competitive advantage in the local and global economy.
7. It is the parties’ goal to maximize the flexibility of the education service provider in achieving the desired outcomes, so long as acceptable progress is demonstrated. 8. Each party acknowledges that the 40/40/20 goal is a statewide goal, requiring all to succeed. This Compact, together with all other such compacts, represents the State’s commitment to learners, and the commitment of each learner organization to help achieve that commitment and the commitment of the educational service provider to achieve the goals specified below and to work with the State and OEIB. Part 2: State Investment The State intends to provide a predictable baseline of funding to sustain capacity over time and to use an outcomes focus for its investments, organized around learner and learning outcomes. In addition to the baseline funding, the State will provide funds to achieve targeted outcomes and grants to support strategic innovation initiatives. For school year 2012-‐13, all funding will be allocated to sustain capacity. Funding for targeted outcomes and innovation initiatives will commence in subsequent school years. Part 3: Provider Commitment _______________(the district) commitments are set forth in Attachment 1. (DOCUMENTS WE HAVE BEEN CALLING THE COMPACTS) Part 4: State Commitment Parties to Compacts in 2012-‐13 will not be required to file the state’s Division 22 reports for that school year. If the state is forced to reduce its capacity funding during the school year, the district shall have the option to amend its Compact.

Part 5: Accountability for Results Future funding and flexibility will be tied to three levels of accountability: (1) “Performing” (on pace for 40/40/20 by 2025), (2) “Underperforming” in relation to by 2025, and (3) “Behind/no progress or falling” in relation to by 2025. Parties to Compacts deemed Performing, will receive maximum flexibility for the delivery of education services________ with possible “targeted outcomes grants” to develop/demonstrate what got them there. Parties deemed Underperforming will receive capacity funding with diagnostics tied to areas where they are below the 2025 trajectory. Funding shall be conditioned on an acceptable plan to get on trajectory in three years. Parties deemed persistently underachieving will receive capacity funding, but the use of such funding may be subject to approval by the OEIB until acceptable progress can be demonstrated. The respective community must approve/own the plan. Part 5: Additional Goals Part 3 of this Compact sets forth the specific commitments to be measured. In addition to these measurable outcomes, the parties agree that there will be a good faith effort to pursue policies that are supportive of such goals. These include: 1. Recognition that educators have the most significant impact on student learning and educators need to be the drivers of change. Systems must support educators to do their best work. 2. Continuous innovation and improvement of education delivery. 3. Recognition that for budget years 2013-‐15 there will be a significant redesign in the way Oregon budgets and invests in education and other services, with the budget process organized around the outcomes defined by the board. [To be discussed further] 4. Commitment to work to maximize the percent of spending on direct delivery of education and minimize administrative and facility costs. Part 6: Supplemental Information [More discussion needed] Attached is information setting forth: The last 3 years of actual results for each category on Attachment 1 A 13-‐year projection of results needed to achieve 40/40/20 by 2025 Other

ACHIEVEMENT COMPACT (K12)
1. Investment: In the 2012-13 fiscal year, the State will invest $XX million with SCHOOL DISTRICT through the State School Fund.
2. Outcomes: In exchange for that investment, the Board of Directors of SCHOOL DISTRICT agrees to pursue continuous improvement on measures of the following outcomes:
2011-12 2012-13 TargetReady to Learn
% students ready to learn at kindergarten enrollment
% students ready to learn by age 7
Achievement gap placeholder
Numeracy/Literacy Fluency
% of students proficient at age 9
% of students proficient at age 11
Achievement gap placeholder
Ready for Rigor in Reading and Math
% of students proficient at age 13
% of students proficient at age 14
% of student proficient at age 17
Achievement gap placeholder
Ready for College/Career Entry
# of students who graduate with diploma
# of students who graduate with diploma and proficient
# of dropouts
Locally/Globally Competitive
# First-time postsecondary enrollees
3. Flexibility: For the 2012-13 fiscal year, SCHOOL DISTRICT is granted the following flexibilities:
ODE developing list
4. Consequence: Those districts that show consistent progress on these measuring the next school year will be given the opportunity to petition for further flexibilities in the next Achievement Compact. Those districts that fail to show progress may be subject to tighter oversight and more prescriptive intervention by the State.
5. Conditions: This is a public agreement and can be amended by mutual consent.

REGIONAL ACHIEVEMENT COMPACT
Note: All school district and RSP partners signed on to Regional Achievement Compact agree that:
• An agreed upon school improvement plan has been adopted by the district and the RSP. • The district has created a 3 Year Plan with the RSP. • The district is implementing the school improvement trainings provided by the RSP with fidelity. • The district has a means of holding administrators and teachers accountable for implementation of RSP trainings. • The district has and is using a CIP process in partnership with the RSP. • The Compact will report annually on each measurement using intact groups of students.
We agree as members of the Compact to work together to accomplish the targets of the Compact:
_________________________________ ______________________________________ ______________________________________
School District Superintendent Regional Service Provider CEO For The State of Oregon
List partners in the Compact:
• Reg. Service provider___________________________ • School District ________________________________ • State of Oregon________________________________
All Students
Achievement Gap Subgroups
2011-12 Current
2014-15 Target
2011-12 Current
2014-15 Target
Ready for School: Pre-K
• % students that have been enrolled in an Oregon pre-school and are ready for Kindergarten
Numeracy and Literacy: K-4
• Progress in Curriculum based measures grades 1-2 • % proficient by grade 3 • % proficient by grade 4
Critical Thinking: Numeracy, Literacy, Science and Technology 4-8
• % proficient by grade5 • % proficient by grade 6 • % proficient by grade 7 • % proficient by grade 8 • % successfully completing algebra by grade 8
Ready for College/Career Entry: 8-13
• % freshmen on track to graduate • % completed a CTE program of study • % completed internships and/or apprenticeships • % successfully exiting ELL • % graduating
*in less than 4 years *on time *in five years
• % enrolled in advanced, AP, or IB courses • % who score a 3 on AP or 4 on IB test or higher • % scoring at “college ready”, 24 on ACT or 1650 on SAT
Lifelong Learning and Success: 13-20
• % HS graduates enrolled w/in 12 months in postsecondary • % HS graduates enrolled w/in 12 months in programs of study
leading to professional certification • % of HS graduates exiting with at least 12 college credits • % of HS grads by school enrollment in remedial classes • College/University GPA by high school of origin • % enlisted in military

REGIONAL OPERATIONS EFFICIENCY COMPACT
Note: School District agrees that all savings from this Compact will be transferred directly to Instruction as a Return on Investment.*
List partners in the Compact:
• Regional Service Provider_______________________
• School District (or other agency)__________________
• State of Oregon________________________________
2011-‐12 Current
2012-‐13 Target
2013-‐14 Target
Financial Services
• % of services in the Regional Compact** • Cost per ADMr of Financial services*** • Will you participate in a regional collaborative?
Human Resources
• % of services in the Regional Compact • Cost per ADMr of Human Resources • Will you participate in a regional collaborative?
Technology Services
• % of services in the Regional Compact • Cost per ADMr of Technology Services • Will you participate in a regional collaborative?
Special Education Administration
• % of Special Education Administration in the Regional Compact
• Cost per ADMr of Special Education Administration • Will you participate in a regional collaborative?
Other Areas Specific To This Collaborative Such as:
• Legal Services • Nursing Services • Other potential cost saving services
Future Cost Savings Areas Under Consideration
• • • •
[Type a quote from the document or the summary of an interesting point. You can position the text box anywhere in the document. Use the Drawing Tools tab to change the formatting of the pull quote text box.]
*As the Return on Investment data base is further developed, this could be a future performance indicator of this Compact.
**Percent of all funds cost within the identified category that is included within the Compact.
***Total all funds cost of the identified area per ADMr.
________________________________ _______________________________ _______________________________
School District Superintendent RSP Administrator For the State of Oregon

SAMPLE COMPACT -‐-‐-‐-‐-‐-‐-‐-‐-‐-‐-‐-‐-‐-‐-‐-‐-‐-‐-‐-‐-‐-‐NOT APPROVED The _____________ Community College Board of Education and the Oregon Investment Board enter into this mutual Achievement Compact and agree to work together as partners to support the State identified goal of 40/40/20; to create economic, social, and community vitality; to support individuals in achieving their highest potential; and to return public benefit to the state as a whole from its investment in community colleges. The purpose of this Compact is to create a framework for measuring outcomes for the students who attend community colleges in Oregon, while at the same time recognizing and valuing the mission of __________ Community College and the students, businesses, and community members it serves.
The Compact focuses on three areas: completion, quality and community connections. ____________ Community College agrees to set appropriate targets in the areas identified in the compact. The Oregon Education Investment Board agrees to develop and revise policies and to advocate for providing the level of state funding required to ensure these target can be met.
Completion 2010 2011 2012 1. Number of adult HS diploma’s/ GED’s awarded 2. Number of certificates/OTMs awarded 3. Number of associate degrees awarded 4. Number of students who transfer to a 4 year 5. Student success in specific sub population
Quality 1. Percentage of dually enrolled high school students who
matriculate to any college or university
2. Percentage of GED completers who continue on to credit work 3. Percentage of students who complete “gatekeeper” courses in
math and English
4. Percentage of students that persist term to term and year to year
5. Percentage CTE students passing national licensure tests 6. Percentage of CTE students employed 12 months after graduation 7. Percentage of transfer students whose OUS GPA is at or above the
average of native OUS students – refine to match data we get from OUS
Connections 1. Number of dual enrolled high school students 2. Percentage of local high school spring graduates enrolled in post-‐
secondary education within one year following high school graduation (Should be measured in K-‐12, CC, and OUS)
3. Percentage of local high school graduates who graduate with some college credit
4. Percentage of employers satisfied from employer satisfaction survey (Will not be available first year – methodology needs to be developed) – move down to connections
5. Extent to which CTE programs that meet local industry needs by industry cluster (this may not be ready the first year)
6. Number of dual enrolled OUS students
Future Community Needs & Opportunities (Local board will provide information in this section )

SAMPLE COMPACT -‐-‐-‐-‐-‐-‐-‐-‐-‐-‐-‐-‐-‐-‐-‐-‐-‐-‐-‐-‐-‐-‐NOT APPROVED
= 20% High School Diploma = 40% Certificate/Associate’s Degree = 40% Bachelor’s Degree

November 15, 2011 Draft
ACHIEVEMENT COMPACT (OUS) 1. Investment: In the 2012-‐13 fiscal year, the State will invest $XX million in OUS.
2. Assumptions and Outcomes: In exchange for that investment, the State Board of Higher
Education agrees to pursue continuous improvement on measures with the following assumptions and the following outcome:
Assumptions: In addition to the Achievement Compact with the State, OUS will internally develop achievement compacts with each of its institutions based on institutional mission, capacity, array of programs, etc. OUS shares in the responsibility for all segments of 40-‐40-‐20. Not only will OUS place a primary focus on bachelor’s and advanced degrees, but will also develop joint strategies to assist the community colleges in achieving their goal of 40; as well as placing a focus on teacher preparation, engagement with K-‐12, and enhancing the K-‐12 pipeline. Outcomes:
2011-‐12 2012-‐13 Target Completion
# of bachelor’s degrees awarded to Oregonians # of bachelor’s degrees awarded to underrepresented minority Oregonians
# of bachelor’s degrees awarded to rural Oregonians # of advanced degrees awarded to Oregonians
Quality % of graduates unemployed in Oregon compared with the % of workforce unemployed in Oregon
Employer satisfaction 1 Alumni satisfaction on value of degree1
Connections Degrees awarded in targeted workforce areas and meet state needs
Research 1 Number of students who complete internships/service learning or are engaged in some form of community based learning
# of bachelor’s degrees awarded to transfer students from community colleges2
1 Quantitative and qualitative detail of measures work in progress 2 Contributions to Community College and K-‐12 attainment goals 3. Flexibility: For the 2012-‐13 fiscal year, OUS is granted the following flexibilities: 4. Consequence:
5. Conditions: This is a public agreement and can be amended by mutual consent.

Appendix 6: Data System Development Memo
Data Base Work Team Report A. Our Assignment The OEIB, in Senate Bill 909, is to provide an integrated, statewide, student-‐based data system that monitors expenditures and outcomes to determine the return on statewide education investments (ROI). Other states’ work and nationally published research was reviewed to identify the most appropriate methodology for measuring the return on investment or the cost effectiveness of the services provided by Oregon’s education system. At present, the recommended measures focus on the traditional education institution “silos”, e.g. preschool programs, K-‐12 districts, and postsecondary programs. As the student longitudinal data system matures with student outcome data spanning multiple learning stages, there will be opportunities for long term evaluation of the broader systems’ effectiveness. B. Early Learning Programs:
1. ROI – Measure student growth between early learning program entry and exit and also at each learning stage via OAKS/Smarter-‐Balanced assessments.
2. Current Status a. Pre-‐Kindergarten and Early Intervention/Early Childhood Special Education (EI/ECSE)
expenditures are tracked by provider. b. Providers are required to conduct student entry and exit reviews. c. Two assessment tools are used predominantly by Pre-‐K programs and another is used
by EI/ECSE programs. d. Providers currently may modify the assessment tools to fit local needs, but this impairs
the ability to conduct cross-‐program comparisons. 3. Recommendations
a. Short term – As a research project, evaluate student growth/funding levels among the provider groups that use the same assessment methodology to gain knowledge of program performance variation and the future means of developing a systematic method of program ROI assessment.
b. Long term – Using the knowledge gained from the initial research evaluation and the adoption of a common assessment tool, build the ROI methodology into the early learning program segment of Project ALDER and build systems that can share key student data with each child’s early elementary instructors/schools.
4. Next steps a. Coordinate systems work with the Early Learning Council and Department of Education
program staff to select an assessment tool that assesses student growth from program entry to program exit, to Kindergarten entry, and at subsequent K-‐12 learning stages.

b. Develop the initial short term research project and identity additional funding required to complete the project by June 30, 2012.
c. Determine supplemental funding requirements to (a) build an ROI component to Project ALDER Pre-‐K systems development and (b) develop student record transfer module to allow student records to be transmitted to each child’s elementary school as an extension of the common identification system in Project ALDER.
C. K-‐12:
1. ROI – Adopt the methodology developed by the Center for American Progress that evaluates the level of student attainment of state standards given the challenges of the student population served and the available resources.
2. Current Status a. Key data are presently gathered in the Data Base Initiative (DBI) and the Department of
Education systems that gather key data on student learning progress and demographics (school lunch aid, English Language Learners, special education designations).
b. Districts are currently providing the data needed for analysis. 3. Recommendations
a. Short term – Provide funding support to systematically link school district DBI financial data and student progress data including adjustments for district demographic factors with completion by June 30, 2012.
b. Long term – Building from the student file linkages in Project ALDER, develop tools that provide key student data to instructional staff, parents, and students as students move through the K-‐12 learning stages to improve instruction and awareness of student progress and needs. The transition to the Smarter/Balanced national student evaluation and expanded use of formative assessment will provide important data elements that need to be shared between learning system partners.
4. Next steps a. Convene an advisory group of district data and evaluation staff to gain input on specific
design and use of ROI tool. b. Determine additional resources needed to build systematic K-‐12 ROI capacity into ODE
report functions. c. Validate records currently retained by ODE to assure accuracy of all district demographic
data. Postsecondary Education
1. ROI – Measure performance of community colleges and universities within Oregon’s postsecondary education system by using tools that link degree and certificate completion to the resources used by program area.
2. Current Status a. All Oregon public postsecondary schools currently participate in the Delta Project which
calculates a ROI by institution, but the programs of each school vary, which cannot be reflected in the measure.

b. Two studies conducted annually at the University of Delaware and by the Office of Institution Research at Johnson County (Kansas) Community College calculates ROI for each degree program based on the direct program costs. All but one of Oregon’s public universities and one community college have participated in these studies in the past decade.
c. Although the Work Group reviewed a study that examined ROI based on student costs and earnings after graduation, that evaluation was done using a proprietary compensation database populated voluntarily by users seeking individual compensation information. The mechanism for data collection limits our ability to determine if the data is representative of each school’s graduate population. For purposes of the OEIB, all costs should be included in the ROI, rather than student costs alone. Work force return on investments may be more accurately determined by surveying a sample of former students at a certain period of years after graduation.
3. Recommendations a. Short term – Share the institution-‐wide data provided by the Delta Project and replicate
the University of Delaware and Kansas studies using direct cost methodology to gauge program specific ROI data.
b. Long term – Develop a system for annual collection of direct program costs by program/degree from each of the universities and community colleges along with the currently collected completion data to allow for yearly calculation and reporting of ROI by program and institution.
4. Next steps a. Convene an advisory group of institution business and evaluation staff to gain input on
specific design and use of University of Delaware/Kansas ROI tools. b. Select a contractor to conduct the program ROI study for Oregon public postsecondary
schools. c. Determine additional resources needed to build systematic ROI data collection capacity
into OUS and CCWD report functions.

Appendix 7: Education Fact Sheets
Data on Oregon’s Early Learning Programs Student Enrollment
Key population estimates of children age birth to kindergarten entry with high needs
• 9,869 (4.2%) have disabilities or developmental delays • 34,446 (14.5%) are English language learners • 4,520 (1.9%) are migrant • 1,697 (0.7%) are homeless • 5,168 (2.2%) are in foster care • 112,757 (47.5%) are from families with income below 200% of the federal
poverty level In addition, 64% of children under age 6 have all parents in the labor force. Early Learning Public Providers
• State funded Oregon Prekindergarten (OPK) and Head Start Programs: 28
OPK and Head Start programs strive to provide children with the skills necessary to be successful in school and life, assist families in understanding the needs of their children, and encourage families to be involved in their child’s education.
• Early Intervention/Early Childhood Special Education Services (EI/ECSE): 35
0
2000
4000
6000
8000
10000
12000
14000
2001 2002 2003 2004 2005 2006 2007 2008 2009 2010
Public Pre-‐K
EI/ECSE

EI/ECSE programs seek to assist families in understanding their child’s disability and the impact on learning, intervene as early as possible to lessen the impact of the disability for future growth and development, and determine what specialized services and support are needed once the child enters formal schooling.
Program Eligibility
• For OPK, children must be between 3 and 5 years of age from families living at or below the federal poverty level, or be placed in foster care or homeless, or from families with identified risk factors (e.g. domestic violence, substance abuse, or incarceration), or have a disability (children with disabilities must represent at least 10% of enrollment)
• For EI/ECSE, children, from birth to school age, are eligible once assessed and determined to have a disability; services are to occur as early as possible to lessen the impact of the disability on development
Staffing
• 454 credentialed early childhood educators hold associates degrees (6%) • 945 credentialed early childhood educators hold bachelor’s degrees (12%) • Staff:child ratio of 1:10, with the lead classroom teacher having a bachelor’s degree • Class size maximum of 20 • Oregon early childhood educators’ median salaries: Preschool $24,710; Kindergarten
$45,220 Funding
• Expenditures per student, 2009-11: Oregon Pre-Kindergarten $8,376. Federal Head Start $9,569; EI/ECSE $4,155.
• 2011-13 Pre-Kindergarten annual funding: State $52.5 million, federal $61.1 million. • 2011-13 EI/ECSE annual funding: State $44.6 million, federal XX.X million.
How Oregon Compares Oregon’s prekindergarten program meets national quality standards including learning standards domains, group size, and staff:child ratios. The quality standards for teacher degree qualifications (national standards are for all teachers to have bachelor’s degrees) and ongoing teacher training (national standards are 15 hours annually, Oregon does not have a ongoing training requirement) are below the national standards.

Data on Oregon’s K-12 Public Education System Students
• Fall membership: 561,300 students (2010-11). 566,000 (2007-08). 545,680 (2000-01). • By race: White 66.3%; Hispanic/Latino 20.5%; Asian/Pacific Islander 4.6%; Multi-Racial
4.1%; African American/Black 2.6%; American Indian/Alaskan Native 1.9%. o 12th Grade, Latino: 6% (1999) à 14% (2009) à 22% (2019, projected)
• Minority Populations, 2009-10: 31.6% students, 5.6% teachers. • Special Education: 13.1% (2009-10). 71% integrated fully in regular classes. • English Language Learners: 11.6% (2009-10), 387% increase from 1997-98. • Free/Reduced Lunch Qualified: 50.3% (2009-10), 58% increase from 1997-98. • Children eligible for Head Start/pre-kindergarten programs not served: 33.3% (2009-10)
Institutions
• School districts: 197 o 107 small (1-1000 students). 6.4% total enrollment. o 72 medium (1000-7000 students). 40.3% total enrollment. o 17 large (7000+ students). 53.3% total enrollment. o Top 5, by size: Portland, Salem-Keizer, Beaverton, Hillsboro, North Clackamas.
• Charter Schools: 101 (2009-10). 89 (2008-09) o Students in charter schools: 0.1% (1997-98), 3.3% (2009-10).
• Education Service Districts: 20 Staffing
• Teachers FTE: 28,130 (2010-11). Forecast 27,567 in 2011-12, 7.7% fall from 2008-09. • Oregon School Employees, 2009-10: 45.8% teachers, 16.3% educational assistants,
0.7% district administrators, 2.5% school administrators, 1.7% counselors, 1.6% media, 2.3% special education, 29.1% support staff.
• Teacher averages, 2009-10: 12.7 years teaching experience, 42.8 years age, 69.9% female, 63.7% with graduate degrees.
• Core academic classes taught by “highly qualified teachers,” 2009-10: 96%. • Student/Teacher ratios, 2009-10: 19.2. U.S. average 15.8.
o Oregon has fourth largest class sizes in U.S. Funding
• Total expenditures per student, 2007-08: Oregon $9,558. U.S. $10,297. • Operating revenue by source, 2009-10: 52% state, 34% local, 14% federal. • Average annual high school teacher salary, 2009: Oregon $50,400. U.S. $55,150 • Adjusted for inflation, Oregon teacher salaries were flat from 1992-93 to 2009-10.

Completion and Achievement • Schools meeting Adequate Yearly Progress, 2009-10: 80% primary/middle, 47% high. • School ratings in Oregon Report Card, 2009-10: Outstanding 37%, Satisfactory 59%,
In Need of Improvement 4%. • High school students meeting or exceeding standards on Oregon Assessment of
Knowledge and Skills, 2009-10 to 2010-11: o Reading: 71% to 83%. (In 2012, students must pass this test to earn a diploma.) o Math: 56% to 68%. o Science: 60% to 70%. o Writing: 53% to 68%.
• High school graduates with regular diploma in four years, 2010: 66%. o Race: Asian 76%, Black 50%, Hispanic 55%, Native American 50%, White 70% o Gender: Female 71%, Male 62% o Students with Disabilities 42%, English Language Learners 50%, Economically-
Disadvantaged 60%. o U.S. 69% (2007).
• High school graduates entering college following fall, 2009: 52%; graduates entering college within 16 months of graduation, 2009: 56%.
Career and College Readiness
• High schools offering AP or IB courses in core subjects, 2009: 24%. (U.S. average 35%) • High schools offering Expanded Options Programs through colleges, 2008: 24% • High schools offering Dual Credit courses, 2008: 20% • States aligning standards with college/workplace expectations, 2009: 45% (Oregon no)
Teaching Quality
• States financing professional development in all districts, 2008: 47% (Oregon no) • States requiring schools provide professional development time, 2008: 31% (Oregon no) • States with “P-20” longitudinal data systems, 2009: 24% (Oregon no)
How Oregon Compares (State of States in Education Report, September 2011) National Assessment of Educational Progress % of Students At or Above Proficient
• 4th-Grade Reading: OR 31%, U.S. 32%, High MA 47% • 8th-Grade Reading: OR 33%, U.S. 30%, High CT 43% • 4th-Grade Math: OR 37%, U.S. 38%, High MA 57% • 8th-Grade Math: OR 37%, U.S. 33%, High MA 52%
Other Measures in State of States in Education Report: • 4-year High School Graduation Rate, 2008-09: OR 76%, U.S. 75%, High WI 91% • College-Going Rate of High School Graduates, 2008: OR 46%, U.S. 64%, High MS 77% • 3-year College Graduation Rates for Associate and Certificate Students, 2009: OR 29%,
U.S. 29%, High SD 61% • 6-Year College Graduation Rates for Bachelor Students, 2009: OR 57%, U.S. 57%, High
WA 69%

How Oregon Compares (State of States in Education Report, September 2011)
Measure OR %
US %
High % Measure
OR %
US %
High %
4th Reading, All 31 32 47 MA 4th Math, All 37 38 57 MA 4th Reading, White 35 41 56 MA 4th Math, White 43 50 67 MA 4th Reading, Black 17 15 29 VT 4th Math, Black 18 15 33 HI
4th Reading, Hispanic 13 16 31 FL 4th Math, Hispanic 16 21 41 MT
4th Reading, Disabled 13 12 21 MD
4th Math, Disabled 17 19 32 MN
8th Reading, All 33 30 43 CT 8th Math, All 37 33 52 MA 8th Reading, White 37 39 51 CT 8th Math, White 41 43 59 MA 8th Reading, Black NA 13 22 ME 8th Math, Black 12 12 23 AZ
8th Reading, Hispanic 14 16 30 KY 8th Math, Hispanic 15 17 37 MO
8th Reading, Disabled 9 8 19 NJ
8th Math, Disabled 6 9 21 MA

Data on Oregon’s Community College Education System General Population
• Adult population with some college but no degree, 2008: 570,000 (27%) • Levels of Education for Oregonians ages 25-64, 2010:
o Less than ninth grade: 3.7% o Ninth to 12th grade, no diploma: 6.4% o High school graduate or equivalency: 24% o Some college, no degree: 27% o Associate Degree: 9% o Bachelor’s Degree: 19% o Graduate or professional degree: 10%
• Range of adults ages 25-64 with two or four-year degrees, 2010: 59% (Benton County) to 22% (Tillamook County.) Oregon county median was 30%.
Student Population
• Students enrolled in community colleges, 2009-10: 384,200 All students by race:
o Asian, 2.9% o Black, 2.0% o Hispanic, 7.12% (Corrected January 4, 2012) o Native American, 7.1% o White, 48.6% o Other, 1.9% o Unknown, 37.0%
All students by gender: 51% female, 44% male, 5% unknown • Full-Time Equivalent students enrolled in community colleges, 2009-10: 121,800
Of these FTE students: o 48% in courses to fulfill requirements for a four-year baccalaureate degree. o 28% in Career and Technical Education certificate or degree programs. o 20% in developmental education courses. o 3% were in Adult Continuing Education and other types of courses.
Institutions Full-Time Equivalent students in 2009-10: Blue Mtn 3,001 Central Oregon 6,387 Chemeketa 13,983 Clackamas 9,127 Clatsop 1,523 Columbia Gorge 1,270 Klamath 1,806 Lane 15,356 Linn-Benton 8,255 Mt. Hood 10,841 Oregon Coast 572 Portland 31,594 Rogue 6,004 Southwestern Oregon 3,327 Tillamook Bay 436 Treasure Val. 3,522 Umpqua 4,812

Staffing • Total Staffing, 2009-10: Administrators – 575. Faculty – 6463. • FTE Students to Faculty Ratio, 2009-10: 18.8
Revenues, Expenditures and Financial Aid
• Sources of support for Oregon’s community colleges: o 1990-91: 29% state general fund, 50% property taxes, 21% tuition. o 1996-97: 55% state general fund, 22% property taxes, 22% tuition. o 2008-09: 41% state general fund, 23% property taxes, 36% tuition.
• Ratio state support/tuition: $29 million/$13 million (1999). $24 million/$34 million (2011) • Average tuition and fees, 2009: $3569 (U.S. average $2982) • From 2000 to 2010, average annual tuition increased 103%. From 1990 to 2010, 363%. • Tuition increase, 2008 to 2009: 7.6% (U.S. average 7.3%) • In 2009-10, Oregon community colleges fourth highest tuition among 15 western states. • Education and related costs per FTE student, 2009: $13,526. (U.S. average $10,242)
Oregon public research universities average $12,191. • Education and related costs covered by tuition, 2009: 30% (U.S. average 32%)
Oregon public research universities average 69%. • Instructions share of education and related costs, 2009: 47% (U.S. average 50%)
Oregon public research universities average 68%. • Recipients of Oregon Opportunity Grants, 2009-11: 56,504. (2007-09: 66,423)
Grants to community college students, 2009-11: 56% • Oregon recipients of Pell Grants: 55,474 (2009-10). 27,696 (2007-08)
Value of Pell Grants to Oregon recipients: $180 million (2009-10). $61 million (2007-08) Completion and Achievement
• Full-time freshmen-to-sophomore retention rate, 2009: 50%. (U.S. average 59%) • Three-year graduation rate associate degree students, 2009: 28% (U.S. average 28%)
Oregon and U.S. average by race: o American Indian 17%, 21% African American: 27%, 26% o Hispanic 13%, 18% White 40%, 44%
• Completion rate per 100 FTE students: 19. (U.S. average 26). • Oregonians with an associate degree or post-high school certificate, 2010: 27% • Rate of students transferring to OUS institutions: 14% (2004), 16% (2009) • Adults ages 25-64 with at least a two-year degree, 2008: 39% (U.S. average 38%) • “If Oregon continues to increase attainment at the rate it did over the last decade (2000-
2008), the state will have a college-attainment rate of 47% in 2025 – far short of the Big Goal of 60%.” – Lumina Foundation, 2011

Data on the Oregon University System Student Population
• Students enrolled in the Oregon University System, 2009-10: 80,944 All students by race:
o Asian, 5.8% o Black/Non-Hispanic , 2.1% o Hispanic, 5.6% o Native American, 1.2% o White/Non-Hispanic, 68.7% o Non-resident Alien, 5.9% o Other, 2.8% o Unknown, 7.9%
All students by gender: 53% female, 47% male Course enrollment by student level (3.5 million course credits in 2009-10)
• Undergraduate 85% • Master’s 10% • Doctoral 3% • Professional 2%
Students enrolled in distance learning courses 1990-2000, 12,277; 2009-10, 72,584
Institutions Total Oregon University System Student Enrollment, Fall 2010: 96,960 Total OUS In-state Student Enrollment, Fall 2010: 69,292
University In-state
Headcount Students by Age Headcount Percent Eastern Oregon University 3,006 Under 18 2,631 3 Oregon Institute of Technology 2,990 18-24 57,390 71 Oregon State University 16,891 25-29 9,327 12 OSU – Cascades 644 30-35 5,073 6 Portland State University 22,341 Over 35 5,937 7 Southern Oregon University 4,868 University of Oregon 13,260 Western Oregon University 5,292 Staffing
• 2009-10: full-time instructional faculty – 2,763; part-time instructional faculty – 1,331; and graduate assistants – 2,346.
• Students to full-time faculty ratio, 2009-10: 35.1:1 Revenues, Expenditures and Financial Aid

• Ratio state support/tuition: $700 million/$1,450 million (2011) • Average tuition and fees, 2010: $7,210 (U.S. average $6,729) • From 2000 to 2010, average OUS tuition increased 102%. From 1990 to 2010, 281%. • Tuition increase, 2008 to 2009: 8% (U.S. average 7.3%) • Education and related costs per FTE student, 2009:
o Public research universities $12,191. (U.S. average $15,919) o Public master’s universities $$10,375 (U.S. average $12,364)
• Education and related costs covered by tuition, 2009: o Public research universities 69% (U.S. average 52%) o Public master’s universities 52% (U.S. average 49%)
• Recipients of Oregon Opportunity Grants, 2009-11: 56,504. (2007-09: 66,423) Grants to Oregon University System students, 2009-11: 14,154 ($30 million)
• Oregon University System recipients of Pell Grants: 26,784 (2010-11). 16,297 (2007-08) Value of Pell Grants to Oregon recipients: $120 million (2010-11). $50 million (2007-08)
Completion and Achievement
• Full-time freshmen-to-sophomore retention rate, 2009: 78%. (U.S. average 78%) • Six-year graduation rate bachelor’s degree students, 2009: 57% (U.S. average 56%)
Oregon and U.S. average by race: o American Indian 49%, 39% African American: 41%, 41% o Hispanic 52%, 47% White 58%, 59%
• Oregonians with a bachelor’s degree or higher, 2010: 29% (U.S. average 28%)

1
Appendix 8: Glossary
40-40-20 – Senate Bill 253, passed by the 2011 Oregon legislature, determines that the mission of Oregon education is to ensure that, by 2025, at least 40 percent of adult Oregonians have a bachelor’s degree or higher, at least 40 percent of adult Oregonians have an associate’s degree or post-secondary credential, and the remaining 20 percent of adult Oregonians have earned a high school diploma or its equivalent. Achievement Compact – An agreement between the OEIB and educational entities. In compacts, the OEIB will articulate the outcomes educational entities are expected to address, and educational entities will communicate to the OEIB targets they intend to reach under all outcome indicators. Authorizing legislation for achievement compacts is proposed for consideration by the 2012 Oregon Legislature for use beginning in the 2012-2013 school year. Achievement Gap – Refers to the disparity on a number of educational measures between the performance of groups of students, particularly groups defined by gender, race/ethnicity, disability and socioeconomic status. The gap can be observed on a variety of measures, including standardized test scores, grade point averages, high school graduation rates, and college enrollment and completion rates. Chief Education Off icer (CEdO) – A position established under Senate Bill 909 by the 2011 Oregon Legislature. The CEdO will serve as the OEIB’s chief executive officer, and will direct the organization of Oregon’s coordinated public education system under the direction of the OEIB. Early Intervention/Early Chi ldhood Special Education (EI/ECSE) – EI/ECSE offers services to families and children who are identified as having a documented disability and needing specially designed services. EI serves eligible children birth to age 3 years and their families and ECSE offers services to eligible children from age 3 to kindergarten. The intent of these programs is to prepare children for schooling, inform parents of how the disability could impact educational progress, and inform the school of the services and supports needed for the child to be successful. Early Learning Counci l – Established under Senate Bill 909 by the 2011 Oregon Legislature. Created to assist the OEIB in overseeing a coordinated system of early childhood services. Economical ly Disadvantaged Students – Students who meet the income eligibility guidelines for free or reduced meals under the National School Lunch Program. Education Service Distr ict (ESD) – Districts that provide regional educational services to component school districts. Oregon has 19 ESDs that assist school districts in meeting state and federal law, improving student learning, enhancing instruction, providing professional development to district employees, enabling districts and their students to have equitable access to resources, and maximizing school district operational and fiscal efficiencies.

2
Educational Entit ies – As used in this report and in reference to the first iteration of Achievement Compacts, educational entities are Oregon’s 197 K-12 public school districts, 19 Education Service Districts, 17 community college districts, the Oregon University System, and the Oregon Health & Science University (For its health professions and graduate science programs.) Elementary and Secondary Education Act (ESEA) – Federal law first enacted in 1965 to help fund primary and secondary education. ESEA aimed to improve access to education for economically disadvantaged communities and established standards and accountability requirements for districts that receive ESEA funds. The current reauthorization of ESEA is the No Child Left Behind Act (NCLB) of 2001. ESEA Flexibi l i ty Waiver – The U.S. Department of Education has invited states to apply for waivers to the NCLB Act in exchange for rigorous and comprehensive plans to improve educational outcomes for all students, close achievement gaps, increase equity, and improve the quality of instruction. Oregon will submit a waiver application in January 2012. General Educational Development (GED) – A group of five subject tests which, when passed, certify that the taker has high school level academic skills. High School Diploma – The Oregon Department of Education gives high school students options to demonstrate completion of secondary education:
• Oregon Diploma – This diploma is available to all students who demonstrate the ability to meet the full set of academic content standards, which include completing 24 credits in prescribed courses, demonstrating proficiency in essential skills, and developing personal education plans and profiles. These standards were adopted by the State Board of Education in 2007 and phase in from 2012 to 2014.
• Modif ied Diplomas and Extended Diplomas – These diplomas are available to students unable to meet the full set of academic content standards even with reasonable modifications and accommodations. Inability to meet standards stems from a documented history of an inability to maintain grade level achievement due to significant learning and instructional barriers inherent in the student, or of a medical condition that creates a barrier to achievement.
Higher Education Coordinating Commission – Established under Senate Bill 242 by the 2011 Oregon Legislature. Beginning in July 2012, the Commission is charged with developing goals and associated accountability measures for Oregon’s post-secondary education system, including community colleges, public universities, and the Oregon Student Access Commission, and a strategic plan to achieve the goals.

3
Learning Stages – Key stages in learner development. Sometimes referred to as momentum points or leverage points. In Achievement Compacts, educational entities will address outcomes related to each of these significant junctures in learner development. The learning stages outlined in this report are:
• Ready for School – Do learners enter the K-12 school system with the skills and dispositions to succeed?
• Ready to Apply Reading and Math Skills – Do learners have a sufficient grasp of basic literacy and numeracy skills so they can use these skills to extend their knowledge?
• Ready to Think Strategically – Are learners prepared to habitually make conscious choices about how to solve problems and establish plans to obtain specific goals?
• Ready for College and Career Training – Do learners have the knowledge and skills needed to succeed in college and/or career training without remediation services?
• Ready to Contribute in Career and Community – Will the educations achieved by Oregon learners empower them to be contributing members of Oregon’s workforce and communities?
Longitudinal Data System – A data system capable of tracking student information over multiple years in multiple schools. Senate Bill 909 directs the OEIB to develop a statewide integrated data system to track student growth and achievement over time, and to measure growth and achievement against education expenditures. This data system will be designed to report a return on statewide education investments (ROI). National Assessment of Educational Progress (NAEP) – The largest continuing and nationally representative assessment of what U.S. students know and can do in core subjects. Assessments are conducted periodically in mathematics, reading, science, writing, the arts, civics, economics, geography, and U.S. history. Standard administration practices are implemented to provide a common measure of student achievement for all states and selected urban districts. NAEP results serve as a common metric and provide a measure of student academic progress over time. No Child Left Behind Act of 2001 (NCLB) – Federal law that reauthorized the ESEA. NCLB requires states to assess basic learning skills in all students in certain grades as a condition for receipt of federal funding for schools. Billed as standards-based education reform, NCLB states that all U.S. public school students will meet state-adopted academic standards by 2014, and that schools that do not make “Adequate Yearly Progress” toward achieving that goal must make prescribed changes in service delivery, including offering expanded options for students and parents in low-performing schools. The rigor of each state’s standards is gauged through the NAEP exam taken by a cross-section of students each year. Oregon Assessment of Knowledge and Ski l ls (OAKS) – Oregon’s statewide assessment system that assesses primary and secondary students’ proficiency with skills and knowledge according to set academic content standards. OAKS tests students in mathematics, reading/literature, science, and social sciences. Summary test score data is used to document

4
school and district progress in closing achievement to comply with ESEA. It is reported in school and district report cards. Oregon Education Investment Board (OEIB) – Established under Senate Bill 909 by the 2011 Oregon Legislature. The Board is charged with overseeing a coordinated public education system that coordinates learning across early childhood services, K-12 public education, and post-secondary education. Pre-K to Col lege and Career – The “education continuum.” The OEIB is charged with overseeing a coordinated public education system from early childhood services (Sometimes known as Pre-K, or pre-kindergarten) through post-secondary education (Otherwise known as college and career). Sometimes referred to as P-20, as in pre-kindergarten through graduate school, a potential 20th year of formal education. Prof ic iency-Based Teaching and Learning – A process of teaching and learning in which students progress through the education system based not on classes attended and credits earned, but on demonstration of mastery of skills and knowledge. Senate Bi l l 909 – Passed by the 2011 Oregon Legislature. Establishes the Oregon Education Investment Board to oversee a coordinated public education system that integrates early childhood services, K-12 public education, and post-secondary education. Also establishes the Early Learning Council. Task Force on Higher Education Student and Institut ional Success – Established under House Bill 3418 by the 2011 Oregon Legislature. This task force must report to the legislature on December 1, 2011 and again on October 15, 2012 regarding barriers to post-secondary education student success, best practices and models for accomplishing student success, and alternative funding options for improving student success. “Tight-Loose” – The OEIB’s management and direction of Oregon’s education system is described as “tight-loose.” The OEIB will be “tight” in expecting educational entities to meet established outcomes, but “loose” in allowing educational entities to set their own targets for outcomes and plans for achieving those targets. Outcomes and targets will be articulated in Achievement Compacts. Wraparound Services – An intensive, individualized care planning and management process, typically utilized for individuals with complex needs. The process provides structured and creative team planning to address the needs of individuals and their families holistically, with an aim of community integration and strong family social support networks.

Appendix 9: Supplemental Notes
Figure 1. Educational attainment of older and younger adults, 2009 Data from the Organisation for Economic and Co-operative Development (2011); U.S. Census Bureau, American Community Survey (PUMS 2009, 1-year estimates).
Figure 2. NAEP and OAKS scores over time for 4th and 8th graders in Oregon
Scores are average scale scores for NAEP and RIT scores for OAKS. Data from U.S. Department of Education, Institute of Education Sciences, National Center for Education Statistics, National Assessment of Educational Progress (NAEP). See NAEP Data Explorer: http://nces.ed.gov/nationsreportcard/naepdata/
Figure 3. Current educational attainment of Oregon adults, versus the 40/40/20 goal
High school, associate’s degree, and bachelor’s degree attainment rates are draft results from a partially calibrated model using data from the U.S. Census (American Community Survey, Public Use Microdata Sample), Oregon Department of Education, and the National Student Clearinghouse. High school includes GED, adult diplomas, and those accepted into a college degree program without a high school diploma. Associate’s degrees account for 9 percent of the 18 percent (17 percent for young adults) with an associate’s degree or certificate. Reliable postsecondary certificate attainment rates are not available. Based on data from the 2008 Oregon Population Survey, we estimate that 62 percent of certificates go to people without an associate’s or bachelor’s degree, and that 9 percent of young working-age adults have a certificate as their highest level of attainment. We were not able to estimate the number of certificates or credentials issued by institutions other than community colleges, so 18 percent with an associate’s degree or certificate is probably a conservative estimate.
Figure 5. Five-year high school completion rates in Oregon, by student characteristic, 2009-10
Oregon Department of Education Cohort Graduation Rate http://www.ode.state.or.us/search/page/?id=2644 Accessed December 10, 2011. Uses adjusted cohort of 50,734 students (the cohort of first-time ninth graders in a school or district, adjusted for students who transfer in, transfer out, emigrate, or are deceased). See definitions of diploma types and student characteristics in ODE’s Cohort Graduation Rate Policy and Technical Manual (http://www.ode.state.or.us/search/page/?id=2644).
Figure 6. Full-time students earning an associate’s degree within three years: Oregon community colleges vs. other states’ high and low rates
Complete College America (September 2011). Time is the Enemy. Part 2: Results from the States. http://www.completecollege.org/docs/Time_Is_the_Enemy_Tables.pdf Data from 2007 NCES IPEDS, based on entry cohort started fall 2004. Includes data for 33 states. Highs and lows represented by error bars are:
High State Low StateAll 32.3% WY 4.2% LA
White, Non-Hispanic 33.2% WY 2.4% LAHispanic 26.0% WY 5.5% NM/OH
African American 14.9% WA 2.4% LAOther 27.2% WY 1.9% LA

Figure 7. Full-time students earning a bachelor’s degree within six years: Oregon public universities vs. other states’ high and low rates
Complete College America (September 2011). Time is the Enemy. Part 2: Results from the States. http://www.completecollege.org/docs/Time_Is_the_Enemy_Tables.pdf Data from 2007 NCES IPEDS, based on entry cohort started fall 2002. Includes data for 33 states. Highs and lows represented by error bars are:
Figure 8. Oregon State School Fund per-student spending over time
Data from Oregon Department of Education, State School Fund spending (state General and Lottery Funds, local property taxes) and student enrollment (full-time, unweighted). Inflation adjustment uses the Portland CPI from the U.S. Bureau of Labor Statistics.
Illustrates inflation-adjusted formula revenue per Average Daily Membership (ADMr). School districts only--excludes ESD formula revenue. Data from the Oregon Department of Education; Portland CPI from the US Bureau of Labor Statistics.
Figure 9. Education versus other spending as a share of Oregon’s total personal income, 1977-2009 Tuition includes tuition, charges, and fees for all education levels. Data from The Urban Institute-Brookings Institution Tax Policy Center (U.S. Census Bureau, Annual Survey of State and Local Government Finances, Government Finances, Volume 4, and Census of Governments). State & Local Finance Data Query System: http://slfdqs.taxpolicycenter.org/ Data series: E025, R39, E022, E091. Accessed December 2, 2011.
Figure 10. Annual spending per K-12 student, by school district’s share of low-income students
Includes K-12 school districts in Oregon with at least 1,000 students. Table 1. Oregon’s public education investment: 2011-13 budgeted (in millions)
General Fund budgets exclude the 3.5% Set-Aside for the Ending Fund Balance for all programs except the School Fund Formula. Table includes programs in Education, Employment, Human Services, the Health Authority, Commission on Children and Families, State Library, and Governor's Office. Also includes $130 million in Federal Head Start Funds that pass directly to local programs. Post-secondary includes tuition and fees for Oregon’s state universities, community colleges, and OHSU. Does not include OUS Non-Limited Gifts, Grants and Contracts funds. Data from the State Budget and Management Division, Oregon Department of Education, community college websites and financial offices, and OHSU financial office.
High State Low StateAll 72.0% VA 23.9% NM
White, Non-Hispanic 76.1% VA 29.4% NMHispanic 69.1% VA 21.7% NM
African American 53.5% FL 17.7% NMOther 74.6% VA 15.8% NM

Appendix 10: Corrections Appendix 7, Education Fact Sheet on Community Colleges and Workforce Development.
The share of Oregon community college students who are Hispanic is 7.12 percent. The OEIB report incorrectly showed Hispanic community college enrollment in 2009-10 as 0.5 percent, based on a mistaken figure in the Community College and Workforce Development 2009-10 Profile posted online. Both documents have now been corrected. (Corrected Jan. 4, 2012)