orange h1 2015 results presentation · pdf file2014 2015 * full time equivalent ** comparable...
TRANSCRIPT

#FY2015 Orange financial results
Stéphane Richard
Chairman and CEO
Ramon Fernandez Deputy CEO, Chief Financial and Strategy Officer
16th February 2016

disclaimer
This presentation contains forward-looking statements about Orange. Although we believe these statements are based on reasonable assumptions, they are subject to numerous risks and uncertainties, including matters not yet known to us or not currently considered material by us, and there can be no assurance that anticipated events will occur or that the objectives set out will actually be achieved. Important factors that could cause actual results to differ from the results anticipated in the forward-looking statements include, among others: the success of Orange’s strategy, particularly with respect to customer relations when facing competition with OTT players, Orange’s ability to withstand intense competition in mature markets and business activities, its ability to capture growth opportunities in emerging markets and the risks specific to those markets, the poor economic conditions prevailing in particular in France and in Europe and in certain other markets in which Orange operates, the effectiveness of Orange’s action plans for human resources, and the success of Orange’s other strategic, operational and financial initiatives, risks related to information and communications technology systems resulting in particular from cyber-attacks, technical failures of or damage caused to networks, loss or theft of data and fraud, health concerns surrounding telecommunications equipment and devices, fiscal and regulatory constraints and changes, and the results of litigation regarding regulations, competition and other matters, the success of Orange's French and international investments, joint ventures and strategic partnerships in situations in which it may not have control of the enterprise, and in countries presenting additional risk, Orange's credit ratings, its ability to access capital markets and the state of capital markets in general, exchange rate or interest rate fluctuations, and changes in assumptions underlying the carrying amount value of certain assets and resulting in their impairment. More detailed information on the potential risks that could affect our financial results will be found in the Registration Document filed with the French Autorité des Marchés Financiers (AMF) on April 7, 2015 and in the annual report on Form 20-F filed with the U.S. Securities and Exchange Commission on April 14, 2015. Forward-looking statements speak only as of the date they are made. Other than as required by law (in particular pursuant to sections 223-1 and seq. of the General Regulations of the AMF), Orange does not undertake any obligation to update them in light of new information or future developments.
FY 2015 results, 16th February 2016 2 2

Section one 2015 highlights

2015 achievements
Revenue € 40.2 bn
FY 2015 results, 16th February 2016
Restated EBITDA*
Customers
Capex
€ 12.4 bn
€ 6.5 bn
263 m
-0.1% yoy +0.3% excl. reg.
+0.1% yoy 30.9% of rev.
+9.3% yoy 16.1% of rev.
o/w 72m mobile contract and 18m fixed broadband
2015 includes the consolidation of Jazztel and Meditel and the sale of Orange Armenia yoy : comparison with the same period of the previous year, on a comparable basis qoq : comparison with the previous quarter, on a comparable basis * see slide 31 for EBITDA restatements. Historical and actual figures reflect change in IFRIC 21 interpretation
4

2015 guidance
5
€ 12.4 bn
30.9% as % of revenues
+0.1 pt yoy
FY 2015 results, 16th February 2016
2015 restated EBITDA of at least €12.3bn

2015 guidance
6
2.01x
FY 2015 results, 16th February 2016
Net debt / Restated EBITDA* around 2x in the medium term
2.37x 2.09x
2013 2015
2.01x
2014
* calculated by dividing (A) net financial debt, including 50% of the net financial debt of the EE JV in the U.K., by (B) restated EBITDA including 50% of the EBITDA of EE JV (adjusted in 2014 from the administration of Phones 4u impact of £336m for 100%) and including Jazztel and Meditel EBITDA over 12 months in 2015

2015 guidance
7 FY 2015 results, 16th February 2016
2015 dividend of €0.60 € 0.60
€0.20 interim paid in December 2015, balance of €0.40* to be paid in June
* subject to shareholders’ approval

2015 guidance
8 FY 2015 results, 16th February 2016
selective M&A policy, focus on existing footprint
Disposal of Telkom Kenya** and Orange Armenia
Acquisition of Jazztel in Spain
Acquisition of Airtel’s subsidiaries in Burkina Faso and Sierra Leone*
Acquisition of Cellcom Liberia*
Acquisition of Tigo in DRC*
Disposal of EE
Consolidation of Meditel
*announced in Q1 2016, subject to relevant approvals **announced in 2015, subject to relevant approvals

#Essentials2020
A digital, efficient and responsible company
FY 2015 results, 16th February 2016 9

Focus on 2015 investments x2.6
FY 2015 results, 16th February 2016 10
FY 2015 Capex yoy
FTTH homes connectable (France, Spain,
Poland, Slovakia)
+5 4G countries
in 2015
Orange Digital
Investment
+9.3%
Morocco Jordan Botswana Cameroon Guinea Bissau
France Moldova Jordan Cameroon Ivory Coast Romania Poland
Spectrum acquisition

Solid commercial performance across the Group driven by VHBB
+1.4m
Spain
+2.8m
France
+4.3m
Belgium Romania
+0.5m +0.7m
Poland
+142k
+601k
+398k
Poland (VHBB)
Spain France
4G customer base
18m FTTH customer
base
1.9m Africa & Middle East
110m mobile customer
base Orange Money
+3.9m
Mobile customers
+4.4m
Cloud Security
+24%
+10%
FY 2015 results, 16th February 2016 11
x2 yoy
Enterprise
2015 net adds
2015 net adds
2015 net adds
2015 revenue growth
x3 yoy

Section two Financial results overview

Positive revenue growth sustained by improved trend in Europe and steady growth in Africa and the Middle-East
13
Group revenue growth yoy
yoy ex. reg.
yoy
FY15
-1.7%
FY14
-5.6%
FY13
-4.0%
FY15
+5.1%
FY14
+7.1%
FY13
+4.1%
FY15
-0.9%
FY14
-2.3%
FY13
-5.3%
Q4 13
-5.1%
Q3 13
-4.0%
Q2 13
-4.8%
Q1 13
-4.1%
Q1 15
-0.2%
Q2 15
-0.6%
Q4 14
-0.9%
-3.8%
Q1 14
-3.4%
Q2 14
-2.3%
Q3 14 Q4 15
+0.1%
Q3 15
+0.5%
France Europe
-0.8%
FY15 FY14 FY13
-3.5%
-6.6%
Africa & the Middle-East
FY 2015 results, 16th February 2016
+0.3% ex. reg.
Q4 2015
2015 revenue
€40.2bn
+0.1%
+€11m
+0.3% ex. reg.
FY 2015
-0.1%
-€47m
Enterprise

Restated EBITDA growing for the second quarter in a row
14
Restated EBITDA evolution (in €m)
FY 2015 results, 16th February 2016
+2.0% ex. reg.
Q4 2015
2015 Restated EBITDA
€12.4bn 30.9% of rev.
+1.4%
+€43m
+0.8% ex. reg.
FY 2015
+0.1%
+€10m
118
FY’15
12,426
indirect costs direct costs
-62
revenues
-47
FY’14 cb
12,417
Group average FTE* down -3.9%** yoy
France international
87.7k -4,5%
56.7k -3%
FY’14 FY’15
2015
-12.0%
2014
Customer service inbound calls per customer in
Europe (yoy evolution)
-7.0%
2014 2015
* Full Time Equivalent ** Comparable basis restated from Jazztel, Meditel and Orange Armenia
xDSL signalisation rate for retail market in
France (yoy evolution)

Consistent with Essentials2020, increased CAPEX in FTTH to support future growth
15 FY 2015 results, 16th February 2016
FY 2015
2015 CAPEX
€6.5bn 16.1% of rev.
+9.3%
+€552m
FTTH homes connectable
4G coverage in % of pop.
80% 85% 84%
France
+6pts yoy
Spain
+15pts yoy
Poland
+23pts yoy
72% 65% 84%
Romania
+10pts yoy
Slovakia
+35pts yoy
Moldova
+51pts yoy
France Spain Poland
5.1m 6.8m 0.7m +1.4m yoy
+0.6m yoy
+117
+65+72
+298
France Europe Africa & the Middle-East
other
CAPEX evolution by segment (in €m)
99%
Belgium
+11pts yoy
following Jazztel acquisition

in €m
FY 2014 historical
FY 2014 cb
FY 2015 actual
restated EBITDA 12,190 12,417 12,426
restatements* -1,078 -1,403 -1,149
reported EBITDA 11,112 11,014 11,277
depreciation & amortization -6,038 -6,219 -6,465
impairment of goodwill & assets -288 -242 -32
share of profit (losses) of associates -215 -222 -38
operating income 4,571 4,331 4742
financial result -1,638 -1,583
tax -1,573 -649
net income from continuing activities 1,360 2,510
net income from discontinued activities
-135 448
net income from consolidated Group 1,225 2,958
minority interests 300 306
net income Group share 925 2,652
mostly related to the dividends received from EE, as EE is accounted for discontinued activities since December 2014
in 2014, higher tax paid related to Orange Dominicana disposal and impairment of deferred tax assets in Spain
3
3
4
4
impairment of Belgium and Irak in 2014
2
2
* see details on slide 31 16
mainly reflects the change of perimeter with consolidation of Jazztel and Meditel and the acceleration of copper depreciation in France
1
1
FY 2015 results, 16th February 2016
Net income Group share multiplied by close to 3

FY 2015 results, 16th February 2016 17
4.2
0.4
1.2
0.1 0.3
0.7
Rest. EBITDA - CAPEX
& change in working cap.
26.1
Net debt end 2014
-5.9
-0.3
Net acquisitions (including Jazztel)
Unwinding of the escrow account
for Jazztel
1.6
-2.9
26.6
Net debt end 2015
€0.5bn
0.3
0.8
25.2
Net debt end 2015 before acquisitions
-€0.9bn
2.09x 2.01x net debt / EBITDA* ratio
* calculated by dividing (A) net financial debt, including 50% of the net financial debt of the EE JV in the U.K., by (B) restated EBITDA including 50% of the EBITDA of EE JV (adjusted in 2014 from the administration of Phones 4u impact of £336m for 100%) and including Jazztel and Meditel EBITDA over 12 months in 2015
litigation & restructuring
net financial interests paid
dividends paid to ORA shareholders
income taxes paid
coupons on subordinated notes
spectrum & licences paid
dividends paid to minority interests
other financial items
Net debt evolution in €bn
Net debt evolution in 2015

Section three Business review
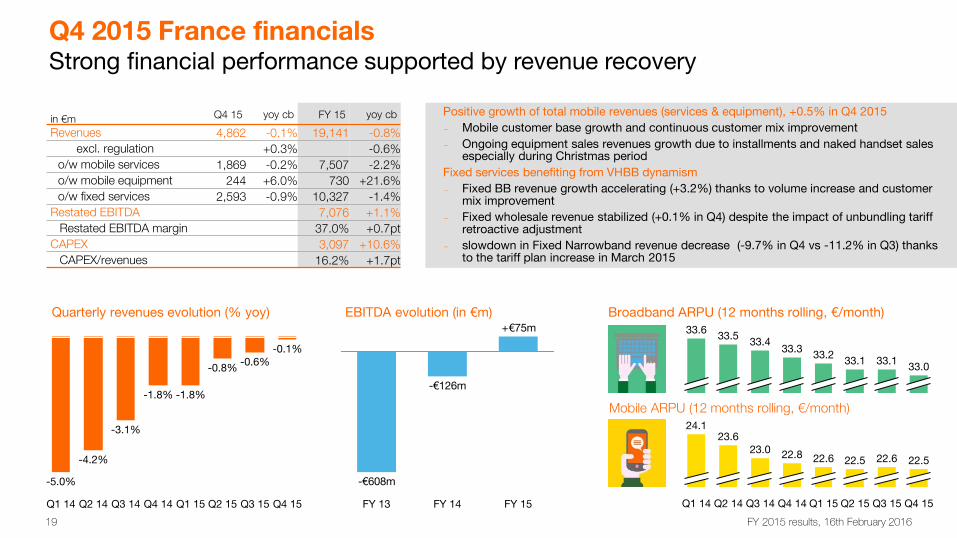
Q4 2015 France financials Strong financial performance supported by revenue recovery
19
Q4 15
-0.1%
Q3 15
-0.6%
Q2 15
-0.8%
Q1 15
-1.8%
Q4 14
-1.8%
Q3 14
-3.1%
Q2 14
-4.2%
Q1 14
-5.0%
Quarterly revenues evolution (% yoy)
33.0 33.1
33.3 33.5
33.1
33.4 33.2
33.6
22.5
Q4 15
22.5
Q1 15 Q3 15
22.6
Q2 15
22.6
Q4 14
22.8
Q3 14
23.0
Q2 14
23.6
Q1 14
24.1
Broadband ARPU (12 months rolling, €/month)
Mobile ARPU (12 months rolling, €/month)
Positive growth of total mobile revenues (services & equipment), +0.5% in Q4 2015
– Mobile customer base growth and continuous customer mix improvement
– Ongoing equipment sales revenues growth due to installments and naked handset sales especially during Christmas period
Fixed services benefiting from VHBB dynamism
– Fixed BB revenue growth accelerating (+3.2%) thanks to volume increase and customer mix improvement
– Fixed wholesale revenue stabilized (+0.1% in Q4) despite the impact of unbundling tariff retroactive adjustment
– slowdown in Fixed Narrowband revenue decrease (-9.7% in Q4 vs -11.2% in Q3) thanks to the tariff plan increase in March 2015
+€75m
-€126m
-€608m
FY 13 FY 14 FY 15
EBITDA evolution (in €m)
in €m Q4 15 yoy cb FY 15 yoy cb
Revenues 4,862 -0.1% 19,141 -0.8%
excl. regulation +0.3% -0.6%
o/w mobile services 1,869 -0.2% 7,507 -2.2%
o/w mobile equipment 244 +6.0% 730 +21.6%
o/w fixed services 2,593 -0.9% 10,327 -1.4%
Restated EBITDA 7,076 +1.1%
Restated EBITDA margin 37.0% +0.7pt
CAPEX 3,097 +10.6%
CAPEX/revenues 16.2% +1.7pt
FY 2015 results, 16th February 2016

contract churn rate contract net adds excl. M2M (in ‘000s)
+179
+234
+76
+164
+256
+219
+59+85
+240
+298
+166
-83
19.4%
Q4 15
13.4%
Q3’15
13.5%
Q2’15
14.4%
Q1’15
14.2%
Q4’14
14.8%
Q3’14
15.2%
Q2’14
15.5%
Q1’14
16.3%
Q4’13
17.6%
Q3’13
18.5%
Q2’13
19.0%
Q1’13
95% of customers repriced on post April 2013 tariff plan
+6 pts
46% of consumer voice contract are on Open offers
+5 pts
52% of consumer voice contract are on SIM-only offers
+17 pts
yoy
8.0m 4G customers
8,348 4G activated sites
80% coverage in % of pop.
H1 2015 results, 28th July 2015 20
39% of contract customer base excl. M2M (+20 pts yoy)
FY 2015 results, 16th February 2016
Q4 2015 France mobile KPIs Ongoing mobile contract momentum and continued strong customer retention

+3 6
+17
-16 -15
+20
+3 0 +3 3
+3 4
+45
+47 +50
+65 +8 2
+75 +8 2
+13
-12
+8-7-8
+8+11
Q3’15
+116
+108
Q2’15
+75
Q1’15
+67
Q4’14
+95
Q3’14
+85
Q2’14
+35
Q1’14
+31
Q4’13
+62
Q3’13
+71
Q2’13
+41
Q1’13
+41
Q4’15
+121
+133
21
ADSL* net adds (in ‘000s) FTTH net adds (in ‘000s)
53% of FTTH net adds are new customers
10.7m broadband customers
+3.7% yoy
* and others (satellite…) ** Orange estimates *** Play and Jet
49% of BB customers have a 4P offer
+4 pts yoy
39% of consumer BB customers are on premium*** offers
+4 pts yoy
960k FTTH customers
5.1m FTTH
connectable homes
19%
FTTH adoption rate
9% of BB customer base
41%**
30%
22%
BB conquest share
FY 2015 results, 16th February 2016
Q4 2015 France fixed KPIs FTTH accelerating BB customer base growth

81% of fixed broadband customers on convergent offers (+4pts yoy)
5.1m 4G customers
84.6% coverage of pop.
809k FTTH customers
3.8m BB customers
306k TV customers
+7% yoy
Q415
-7.1%
+11.9%
-6.6%
Q1 15
+6.6%
+0.7%
Q2 15 Q4 14
+7.8%
-9.6%
-2.7%
+6.6% +9.4%
Q3 15
fixed broadband mobile services
22
Quarterly revenues evolution (% yoy)
including Jazztel from the 1st of July 2015
x3.9 yoy
x2.8 yoy
in €m Q4 15 yoy cb FY 15 yoy cb
Revenues 1,189 -0.7% 4,253 -2.3%
excl. regulation -0.6% -1.5%
o/w mobile services 626 +0.7% 2,403 -4.5%
o/w mobile equipment 104 -31.4% 470 -11.3%
o/w fixed services 461 +7.8% 1,375 +5.7%
Restated EBITDA 1,068 -0.4%
Restated EBITDA margin 25.1% +0.5pt
CAPEX 864 +5.3%
CAPEX/revenues 20.3% +1.5pt
Strong VHBB penetration
FY 2015 results, 16th February 2016
Q4 2015 Spain +6.2% restated EBITDA growth in H2 driven by improving service revenue and synergies
3%
+19pt
Q4 14 Q4 15
22%
34%
18%
Q4 14
+16pt
Q4 15
FTTH / BB base
4G / mobile base

23
Mobile services revenues improving at -1.9% yoy in Q4 (-5.2% in Q2, -2.8% in Q3)
– customer base up +1.8% yoy, with contract share improving at 53% of total (+3.4pts yoy)
– very strong +274k contract net adds in Q4, well-balanced between B2C and B2B
Continuing pressure in fixed revenues at -8.5% yoy in Q4 (-7.9% in Q3)
– broadband base continued to erode, despite stronger VHBB customer acquisitions (+45k VDSL and FTTH net adds in Q4), and because of migrations to LTE (into mobile base)
– broadband B2C gross adds improving sequentially for a second quarter in a row
– 17k FTTH customers end of Q4, with 58% of gross adds being new customers
Other revenues evolution reflecting phasing of infrastructure projects
– no infrastructure project revenue billed in 4Q
Steady growth in fixed VHBB customers in ‘000s and in % of ADSL + VHBB base
Improving momentum in mobile contract net adds in ‘000s
Continuous momentum in convergent customers in ‘000s and in % of BB base
539 591 667 728627
Q4 15
35%
Q3 15
31%
Q2 15
29%
Q1 15
27%
Q4 14
24%
174 207 232 271 316
Q4 15
15%
Q3 15
13%
Q2 15
11%
Q1 15
10%
Q4 14
8%
+146
+48
+170 +190
+274
+88%
Q4 15 Q3 15 Q2 15 Q1 15 Q4 14
in €m Q4 15 yoy cb FY 15 yoy cb
Revenues 686 -5.1% 2,831 -2.9%
excl. regulation -5.0% -2.5%
mobile services 320 -1.9% 1,314 -3.8%
mobile equipment 44 +27.1% 154 +50.9%
fixed services 287 -8.5% 1,215 -7.9%
other revenues 35 -27.8% 147 +15.2%
Restated EBITDA 841 -8.6%
restated EBITDA margin 29.7% -1.9pt
CAPEX 463 +10.8%
CAPEX/revenues 16.4% +2.0pt
FY 2015 results, 16th February 2016
Q4 2015 Poland A 2nd quarter of improving mobile trends; momentum building up in very high broadband

24
Consolidated revenue growth ramping up at +2.3% this quarter, vs. +0.6% last quarter
Strong mobile contract net adds in Belgium, driven by B2C performance
– +28k contract net adds ex-M2M, vs. +8k in Q3 15 and +7k in Q4 14
– annual contract ARPU up 3.6% yoy
– annual contract churn sequentially down in B2B and B2C
Steady progress on strategy to create levers for future growth
– Belgium’s leader in 4G coverage with 99% outdoor and 88% indoor
– Belgium’s 4G contract base increased 99% yoy, reaching approx. 44% of contract subs
Strong contract net-adds in Belgium (ex. M2M) in 000s
+28
+8+9
-5
+7
Q4 14 Q3 15 Q2 15 Q1 15 Q4 15
Steady improvement in Belgium contract ARPU in % yoy evolution
Rapid growth in Belgium 4G base 4G subs as a % of total subs
Q4 15
+3.6%
Q3 15
+3.6%
Q2 15
+0.6%
Q1 15
-1.1%
Q4 14
-1.8%
Q4 14
26%
Q4 15
32%
Q3 15
16%
Q2 15
23%
Q1 15
19%
in €m Q4 15 yoy cb FY 15 yoy cb
Revenues 323 +2.3% 1,235 -1.1%
excl. regulation +2.3% -0.0%
o/w mobile services 253 -0.6% 1,006 -1.3%
o/w mobile equipment 40 +5.4% 128 -2.5%
o/w fixed services 19 -17.6% 80 -13.8%
Restated EBITDA 276 +0.4%
restated EBITDA margin 22.3% +0.3pt
CAPEX 193 -10,3%
CAPEX/revenues 15.6% -1.6pt
FY 2015 results, 16th February 2016
Q4 2015 Belgium & Luxembourg Revenue growth ramping up in Q4; full year restated EBITDA now stabilized

25
3rd quarter of revenue growth in a row, at +2.9% yoy in Q4, after +3.2% in Q3 and +1.8% in Q2
– Romania improving at +7.4% yoy (59% of sub-segment), vs. +7.0% in Q3
– Slovakia down -3.6% yoy (34% of sub-segment), after -2.2% in Q3
– Moldova down -5.0% yoy (8% of sub-segment), after -2.6% in Q3
Strong contract net-adds in overall sub-segment at +115k in Q4, vs. +72k in Q3
4G subscriber leadership in all three countries
– 1,029 k in Romania, 511k in Slovakia and 59k in Moldova
…driven by Romania sustained performance in overall revenues YoY change
Solid revenue growth… YoY change
Q3 15
+3.2%
Q2 15
+1.8%
Q1 15
-2.2%
Q4 14
-2.4%
Q4 15
+2.9%
Q3 15 Q2 15
+7.0% +6.4%
Q1 15
-3.7%
Q4 14
-4.6%
+7.4%
Q4 15
in €m Q4 15 yoy cb FY 15 yoy cb
Revenues 422 +2.9% 1,648 +1.4%
excl. regulation +3.1% +3.5%
o/w mobile services 337 +1.4% 1,358 -0.7%
o/w mobile equipment 37 +16.5% 115 +23.1%
o/w fixed services 34 -2.9% 130 +4.4%
Restated EBITDA 546 -7.2%
restated EBITDA margin 33.2% -3.1pt
CAPEX 263 -0.5%
CAPEX/revenues 16.0% -0.3pt
Strong mobile contract net-adds in overall sub-segment (ex. M2M) in 000s
+115
+76+64
+46
+137
Q4 15 Q3 15 Q2 15 Q1 15 Q4 14
FY 2015 results, 16th February 2016
Q4 2015 Central European countries Solid revenue growth in Q4, driven by Romania’s performance at +7.4% yoy

FY15 revenues growth sustained and EBITDA margin nearly stabilised
– revenue growth at 5.1% yoy, driven by Ivory Coast (+11.8%), Egypt (+4%), Mali, DRC (+42%)
– Meditel consolidated starting from 1st of July: H2 revenues of €257m
– EBITDA margin maintained at 34.1% despite higher taxes
Commercial performance
– 110.2m mobile customers, a growth of 4.1% yoy
– 16.4m Orange Money customers (+31% yoy) generating +64% revenues yoy
Key contributors to revenue growth Q4 2015 yoy revenue growth in % and €m
+17
+10
+6
+35
Other +2
DRC
Egypt
Ivory Coast
Africa & Middle East
Solid growth of data consumption
in €m Q4 15 yoy cb FY 15 yoy cb
Revenues 1,312 +2.8% 4,899 +5.1%
excl. regulation +3.0% +5.4%
o/w mobile services 1,065 +4.3% 3,953 +7.0%
o/w mobile equipment 24 +11.1% 78 +4.7%
o/w fixed services 197 -3.2% 770 -2.7%
EBITDA 1,668 +4.9%
EBITDA margin 34.1% -0.1pt
CAPEX 922 +8.5%
CAPEX/revenues 18.8% +0.6pt
4G
+2,923
3G
+3,776
3G and 4G deployment Number of mobile sites activated in 2015
+55%
FY15 FY14
Data revenue growth Smartphone penetration
Q4 2015 Africa & Middle East Solid revenue growth driven by data usage, EBITDA margin nearly flat despite tax hurdles
FY 2015 results, 16th February 2016 26
5%
9%
5%
8%
Mali
DRC
Cameroon
Ivory Coast
Senegal 15% +6pts
+3pts
+5pts
+2pts
+2pts
yoy +2.8%
+9%
+3%
+19%

27
Security
+14%
Cloud
+7%
IT services (cloud and security) 4Q15 yoy revenue growth in %
Revenue per segment yoy revenue growth in %
voice revenues in line with overall 2015 trend as migration towards VoIP solutions maintained pressure on the topline
data continuous improvement of trends, thanks to lighter price pressure and volume increase especially outside France
IT & integration services growth remaining above Market still supported by IT drivers such as Security services and Cloud solutions
EBITDA stabilising with a margin at 14.9%, +0.1pt above 2014, with revenue decline more than offset by cost adaptation and dynamic portfolio management
data services IPVPN accesses and yoy growth
+0.9% +1.2%
in €m Q4 15 yoy cb FY 15 yoy cb
Revenues 1,657 -0.4% 6,405 -0.9%
voice 377 -6.0% 1,528 -5.4%
data 750 -0.2% 2,959 -1.6%
IT & integration services 530 +3.6% 1,918 +4.1%
EBITDA 954 -0.3%
EBITDA margin 14.9% +0.1pt
CAPEX 325 -3.3%
CAPEX/revenues 5.1% -0.1pt
Q4 2015 Enterprise Enterprise revenue in Q4 is above yearly trend, supported by favourable macroeconomics, resilience of legacy business and continuous growth of IT Services, allowing EBITDA stabilisation
Q4 15
-0.4%
Q3 15
0.5%
Q2 15
-0.5%
Q1 15
-3.4%
Q4 14
-2.3%
Q3 14
-1.7%
Q2 14
-3.0%
Q1 14
-2.3%
Total Voice Data IT
France
349k
International
FY 15 FY 14
345k
FY 2016 results, 16th February 2016

Section four 2016 guidance

2016 guidance
29
Restated EBITDA
FY 2015 results, 16th February 2016
Net debt / Restated EBITDA
M&A policy
Dividend
* subject to shareholders’ approval
2016 > 2015
around 2x
in the medium term
€0.60* interim payment €0.20 in December 2016
selective with focus on existing footprint
comparable basis

Appendices

31
in €m Q4’14
cb Q4’15 actual
FY’14 cb
FY’15 actual
EBITDA restated 3,020 3,063 12,417 12,426
restructuring -352 -89 -439 -172
portfolio review 0 -15 0 45
litigations -99 -37 -399 -450
labour related -343 -425 -565 -572
o\w Senior Part Time -343 -434 -493 -547
o\w Cap Orange -72
o\w Holiday pay -35
EBITDA reported 2,226 2,497 11,014 11,277
350m€ fine on the B2B market in France
Revised assumptions for Senior Part Time and one year extension of existing plans
3
2
FY 2015 results, 16th February 2016
EBITDA restatements
rationalization of distribution networks and real estate optimization
1

Revenues yoy evolution
France Group
Spain Poland Central European countries
Africa & the Middle-East
Enterprise
Q4 15
+0.3%
+0.1%
Q3 15
+0.5%
Q2 15
-0.2%
Q1 15
-0.9%
Q4 14
-0.6%
Q3 14
-2.3%
Q2 14
-3.4%
Q1 14
-3.8%
Q4 13
-5.1%
Q3 13
-4.0%
Q2 13
-4.8%
Q1 13
-4.1%
Q4
0.3%
-0.1%
Q3 Q2 Q1 Q4 Q3 Q2 Q1 Q4 Q3 Q2 Q1
Q1 Q4
-0.6%
-0.7%
Q3 Q2 Q1 Q4 Q3 Q2 Q1 Q4 Q3 Q2 Q4
-5.0%
-5.1%
Q3 Q2 Q1 Q4 Q3 Q2 Q1 Q4 Q3 Q2 Q1 Q4
+3.1%
+2.9%
Q3 Q2 Q1 Q4 Q3 Q2 Q1 Q4 Q3 Q2 Q1
Q4
+3.0%
+2.8%
Q3 Q2 Q1 Q4 Q3 Q2 Q1 Q4 Q3 Q2 Q1
Q4
-0.4%
Q3 Q2 Q1 Q4 Q3 Q2 Q1 Q4 Q3 Q2 Q1
yoy ex. reg. yoy
Europe
Q4
-0.9%
-1.0%
Q3 Q2 Q1 Q4 Q3 Q2 Q1 Q4 Q3 Q2 Q1
Belgium & Luxemburg
Q2 Q3 Q4 Q1 Q1 Q2
+2.3%
Q4 Q1 Q4 Q3 Q2 Q3 32

High liquidity at the end of 2015 combined with a smooth repayment profile
Bonds*/bank loans/leases repayments end of 2015 (in €bn)
** source Bloomberg
13.4
3.7
3.2
>2020
1.3
2018
12.9
3.6
2019 2020
2.0
2017 2016
2.4
3.1
1.8 2.4
2.8
bonds bank loans & others
* after derivatives Weighted average fixed bond coupon ** End of period
Gross debt structure
Current rating of long term debt
High liquidity position of €12.0bn as of December 31 2015, including €5.5bn in net cash
Proactive and opportunistic asset and liability management:
– termination of trade receivables securitization programs for €0.5bn in February 2015
– early repayment of bonds maturing up to 2025 for £0.6bn (equivalent to €0.9bn) executed in April 2015
– repurchase of TDIRA for a €0.2bn nominal value in May 2015
33 FY 2015 results, 16th February 2016
Moody’s Baa1 stable
S&P BBB+ stable
Fitch ratings BBB+ stable
91% with fixed rate
82% in bonds
4.82%
2014
4.88%
2013
4.83%
2015