oracle java cloud service: how to estimate production system performance
TRANSCRIPT

1
Oracle JCS – How To Estimate
Production System Performance
Andrejus Baranovskis, Red Samurai Consulting
Oracle ACE Director, Oracle Developer Champion

2About Us
Oracle Experts Team
• Oracle PaaS Partner Community Award for Outstanding Java Cloud Service Contribution 2017
• Oracle Fusion Middleware Partner Community Award for Outstanding ACM/BPM Contribution 2015
• Oracle Fusion Middleware Innovation Award Winner 2010
• SOA Partner Community Award for Outstanding Contribution Across the World 2010
ADF, JET, MAF, Oracle Cloud (JCS, MCS, PCS, ACC), Oracle Fusion Middleware

3
3 Membership Tiers
• Oracle ACE Director
• Oracle ACE
• Oracle ACE Associate
bit.ly/OracleACEProgram
500+ Technical Experts
Helping Peers Globally
Connect:
Nominate yourself or someone you know: acenomination.oracle.com
@oracleace
Facebook.com/oracleaces

4Agenda
JCS Performance Estimation
Overview 01
Test Cases 02
Results 03
Methodology 04

5Summit ADF
Sample Application for Performance Test

6
• Login
• Wait 15-25 seconds
• Browse/select customers tree
• Wait 15-25 seconds
• Browse customers orders
• Wait 15-25 seconds
• Browse inventory control
• Wait 15-25 seconds
• Logout
Scenario
Performance Test

7ADF BC Scalability Settings
Application Module Pool Tuning

8Red Samurai ADF Performance Audit
Performance Monitor

9
• OC3: 1 CPU, 7.5 GB RAM (1 Cloud Node, No Cluster)• -Xms256m –Xmx2048m –XX:PermSize=256m –XX:MaxPermSize=512m
• OC4: 2 CPU, 15 GB RAM (1 Cloud Node, No Cluster)• -Xms256m –Xmx4096m –XX:PermSize=256m –XX:MaxPermSize=1024m
• OC4: 2 CPU, 15 GB RAM (1 Cloud Node, Cluster)• -Xms256m –Xmx4096m –XX:PermSize=256m –XX:MaxPermSize=1024m
• OC3: 1 CPU, 7.5 GB RAM (2 Cloud Nodes, Cluster)• -Xms256m –Xmx2048m –XX:PermSize=256m –XX:MaxPermSize=512m
JCS Compute Shapes
Performance Test – Managed Server Memory

10
• Test case:• 100 threads
• 30 mins ramp-up
• 3 loops
• 15 to 25 seconds waits
• Output:• Avg. request time: 60 ms. Avg. requests per minute: 1200
• Top active threads: 10
• DB connections peak: 3
• Garbage collection time avg.: 70 ms., Calls per minute: 13
• Processor: 40%, Heap avg.: 900 MB
• AM instances top: 15, Activations: 0
Test A
OC3 – 1 Cloud Node, No Cluster. AM Pool: 150. Status: OK

11
• Test case:• 200 threads
• 30 mins ramp-up
• 3 loops
• 15 to 25 seconds waits
• Output:• Avg. request time: 188 ms. Avg. requests per minute: 2150
• Top active threads: 75
• DB connections peak: 20
• Garbage collection time avg.: 3500 ms., Calls per minute: 21
• Processor: 60%, Heap avg.: 1200 MB
• AM instances top: 146, Activations: 0
Test B
OC3 – 1 Cloud Node, No Cluster. AM Pool: 150. Status: OK

12
• Test case:• 400 threads
• 30 mins ramp-up
• 3 loops
• 15 to 25 seconds waits
• Output:• Avg. request time: 900 (2500+ after activation) ms. Avg. requests per minute: 2600
• Top active threads: 320 (growing after activation)
• DB connections peak: 59
• Garbage collection time avg.: 2300 (2700 after activation) ms., Calls per minute: 25
• Processor: 90%, Heap avg.: 1400 MB
• AM instances top: 150, Activations: 1621 per minute
Test C
OC3 – 1 Cloud Node, No Cluster. AM Pool: 150. Status: FAIL

13
• Test case:• 400 threads
• 30 mins ramp-up
• 3 loops
• 15 to 25 seconds waits
• Output:• Avg. request time: 600 ms. Avg. requests per minute: 2400
• Top active threads: 330
• DB connections peak: 65
• Garbage collection time avg.: 4000 ms., Calls per minute: 30
• Processor: 80%, Heap avg.: 1400 MB
• AM instances top: 365, Activations: 0
Test D
OC3 – 1 Cloud Node, No Cluster. AM Pool: 500. Status: OK

14
• Test case:• 400 threads
• 30 mins ramp-up
• 3 loops
• 15 to 25 seconds waits
• Output:• Avg. request time: 180 ms. Avg. requests per minute: 4800
• Top active threads: 157
• DB connections peak: 60
• Garbage collection time avg.: 1800 ms., Calls per minute: 25
• Processor: 65%, Heap avg.: 1850 MB
• AM instances top: 176, Activations: 0
Test E
OC4 – 1 Cloud Node, No Cluster. AM Pool: 500. Status: OK

15
• Test case:• 400 threads
• 30 mins ramp-up
• 3 loops
• 15 to 25 seconds waits
• Output:• Avg. request time: 282/225 ms. Avg. requests per minute: 2000/1251
• Top active threads: 320/320
• DB connections peak: 40/40
• Garbage collection time avg.: 2100/3000 ms., Calls per minute: 8/9
• Processor: 35% / 30%, Heap avg.: 1700/1414 MB
• AM instances top: 314/322, Activations: 0
Test F
OC4 – 1 Cloud Node, Cluster. AM Pool: 500. Status: OK

16
• Test case:• 400 threads
• 30 mins ramp-up
• 3 loops
• 15 to 25 seconds waits
• Output:• Avg. request time: 100/121 ms. Avg. requests per minute: 1200/1300
• Top active threads: 211/211
• DB connections peak: 16/17
• Garbage collection time avg.: 1500/1800ms., Calls per minute: 18/18
• Processor: 53% / 60%, Heap avg.: 1180/1200 MB
• AM instances top: 120/119, Activations: 0
Test G
OC3 – 2 Cloud Nodes, Cluster. AM Pool: 500. Status: OK

17Request Time/Garbage Collection Time
0
500
1000
1500
2000
2500
3000
3500
4000
4500
C D E F G
Avg. request time
Avg. garbage collection time

18Top Active Threads
0
50
100
150
200
250
300
350
C D E F G
Top Active Threads

19DB Connections Peak/AM Instances
0
50
100
150
200
250
300
350
400
C D E F G
DB Connections peak
AM Instances
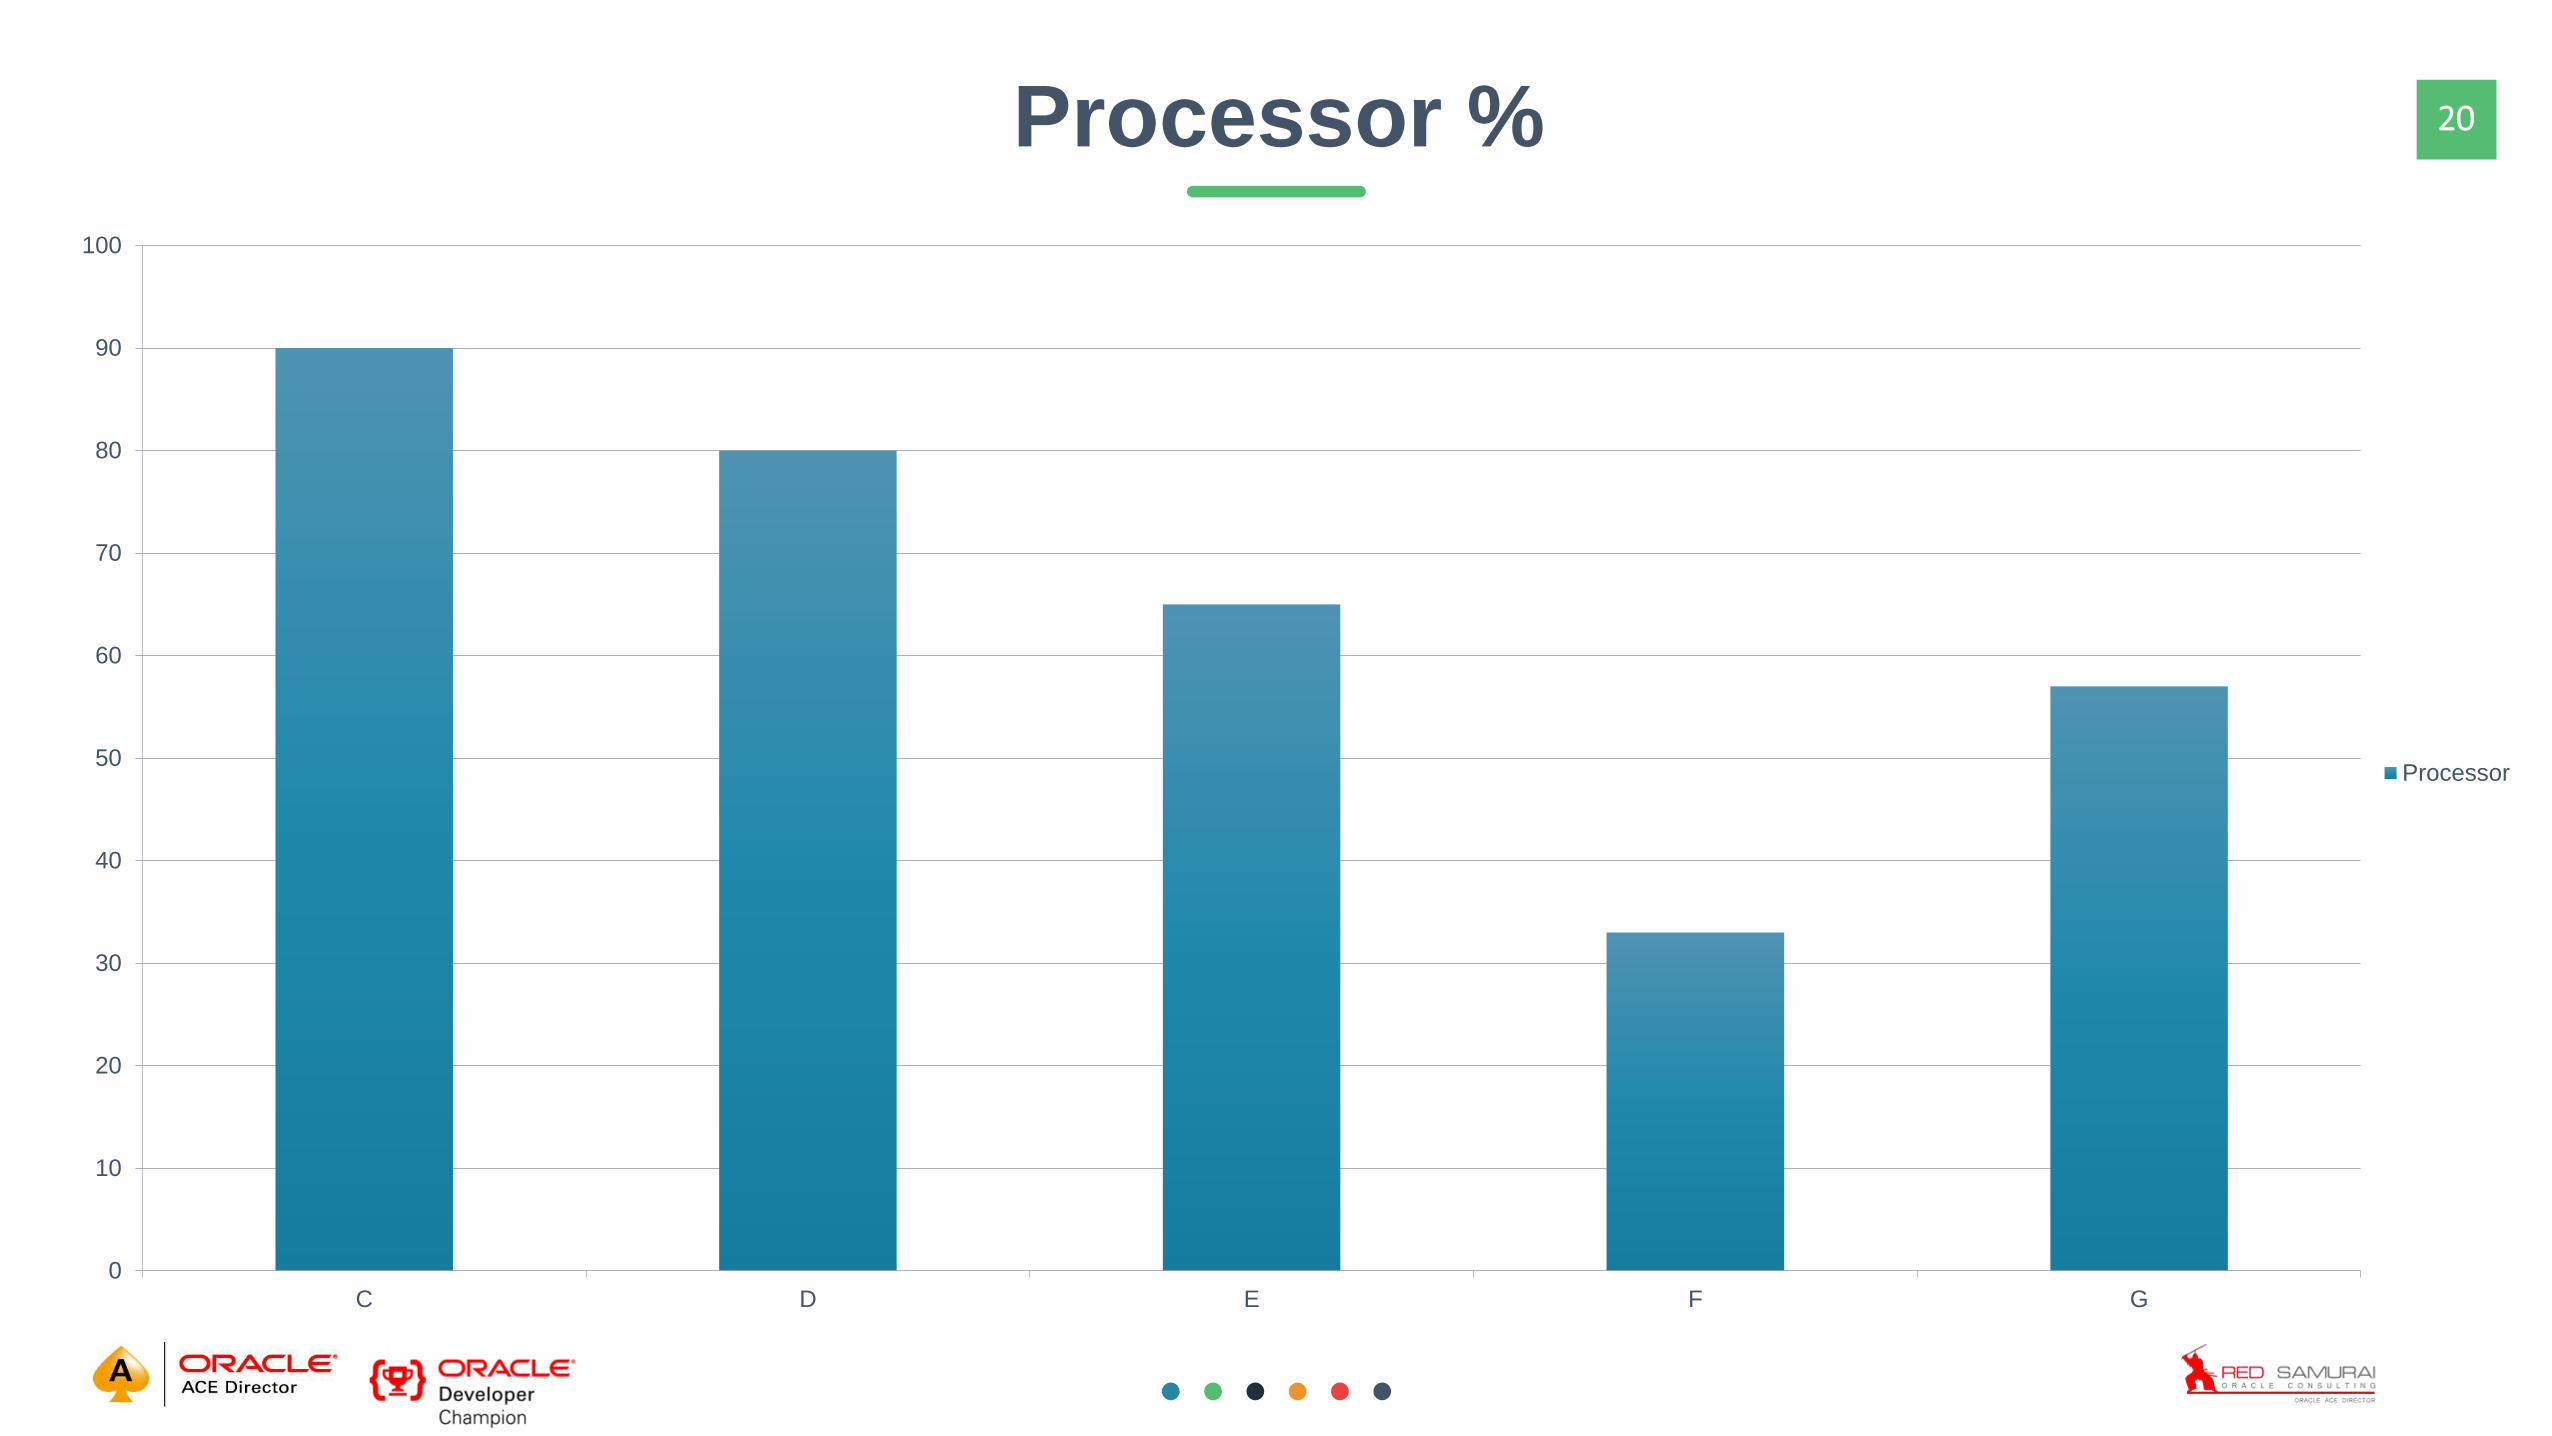
20Processor %
0
10
20
30
40
50
60
70
80
90
100
C D E F G
Processor

21Heap Size
0
200
400
600
800
1000
1200
1400
1600
1800
2000
C D E F G
Heap Size

22
• Use ADF sample as baseline
• Select key use cases from your system for performance test
• Start with minimum JCS Compute Shape
• Grow performance test to expected number of threads gradually
• Scale up single Cloud Node and increase heap, if need to support more threads
• Setup cluster with X Cloud Nodes, when increasing single Cloud Node heap is not enough
Methodology
How to select JCS Compute Shape

23JCS – Scale Up

24JCS – Scale Up

25JCS – Scale Up

26JCS – Cluster

27JCS – Cluster

28JCS – Load Balancer

29
QUESTIONSLearn More.

30
THANKS FOR WATCHINGSee You Next Time
@RedSamurai @RedSamurai @RedSamurai