oracle financial services software limited
TRANSCRIPT

Oracle Financial Services Software LimitedAnnual Report
2011 - 2012


From the Chairman’s desk
I have assumed the Chairmanship of the Board of directors of your Company recently. I am elated to receive this mantle from none other than Mr. William Comfort, Jr., the earlier Chairman. Bill, as we know him, leaves a fine legacy of his leadership and vision. I thank him for his contributions to the success of the Company over the past several years.
It is my pleasure to report the results for the financial year ended March 31, 2012. In the year under review, on a consolidated basis, our total income increased by 13 percent to ` 35,684 million. Our focus on innovation and operational excellence has reinforced our leadership in the marketplace and a growing number of financial services organizations worldwide are selecting Oracle FLEXCUBE and Oracle Financial Services Analytical Applications to achieve competitive differentiation, ensure regulatory compliance and deliver personalized service to their customers. This has resulted in us winning significant deals with the tier-1 banks in North America, Europe and Asia. In the year, we won 66 customers across 36 countries for our products and services.
We launched Oracle FLEXCUBE Multi-Channel Solution, together with new versions of Oracle FLEXCUBE Direct Banking and Oracle FLEXCUBE Private Banking that enable banks to offer portfolio view-based products and services on a number of direct channels including mobile devices. We also recently launched version 12.0 of Oracle FLEXCUBE with a harmonized release across core banking, wealth management and online banking solutions. Oracle FLEXCUBE 12.0 delivers a consistent and personalized customer experience through a combination of enhanced self-service and assisted support across channels.
New releases of Oracle Financial Services Analytical Applications that address enterprise risk and enterprise performance management have helped us gain new customers and momentum. Oracle Financial Services Enterprise Case Management provides financial institutions a 360-degree-view of their financial crime and compliance management initiatives. Oracle Financial Services Pricing Management, Capital Charge Component enables banks to actively manage their credit portfolios based on risk-adjusted returns and optimize utilization of capital. To help insurers effectively achieve compliance with Solvency II requirements and realize greater financial performance through better management of their capital, we launched Oracle Insurance Applications for Risk and Solvency II Compliance. We also launched Oracle Financial Services Loan Loss Forecasting & Provisioning that supports enterprise-wide visibility into an institution’s credit risk position via a consistent risk management platform.
Our products and services continue to win industry accolades and recognition. Leading publication and advisory firm, IBS, has named Oracle a leader in core banking sales for the calendar year 2011 in its annual sales league table. Chartis Research’s “Risk & Finance Integration 2011” report ranks Oracle as a market leader for integrated risk and finance management solutions based on solution completeness and market potential. Oracle has been awarded the Anti Fraud/Crime Prevention Solution Provider of the Year for 2012 by The Banker, a respected banking and finance industry magazine. Oracle Financial Services Analytical Applications was selected as having the biggest impact in the area of anti fraud & crime prevention within the past twelve months. In addition, Oracle Financial Services Analytical Applications was commended in the Best Risk Management Technology Category.
The global economy is going through a prolonged process of healing after the turmoil of 2008 and 2009, though the situation, especially in Europe, is far from stable. What the recent past has reminded financial institutions is that they need far greater insight into all aspects of their operations; the need to align the management of finance and risk has become all too obvious. Yet financial institutions recognize that their long term interest lie in building durable ties with their customers and that comes with greater visibility into all aspects of their customer’s interaction with their organizations. Regulatory authorities continue to demand that banks address these shortcomings. Yet what stands in the way of many financial institutions confronting these issues is their peculiarly fragmented IT infrastructure. We remain uniquely placed to help banks confront these challenges and we believe that opportunities ahead are both large and potentially rewarding.
On behalf of the Oracle Financial Services Software, I want to thank you for your support. Your support and good wishes has made the Oracle Financial Services Software a formidable player in our marketplace and I look forward to your continued patronage to make us one of the most valuable companies in the country.
Regards,
S Venkatachalam Chairman Oracle Financial Services Software Limited

Oracle Financial Services Software – Annual Report 2011-2012
This page has been intentionally left blank.

3
Contents
Financials at a Glance 4
Corporate Information 6
Directors’ Report 9
Corporate Governance Report 18
Management’s Discussion and Analysis 35
Consolidated Financials 49
Unconsolidated Financials 81
Notice of Annual General Meeting 121
Attendance Slip & Proxy Form 127
Annual General Meeting
Day and Date : Friday, August 17, 2012Time : 3.00 p.m.Venue : The Leela Kempinski
Sahar, Andheri (East)Mumbai 400059

Oracle Financial Services Software – Annual Report 2011-2012
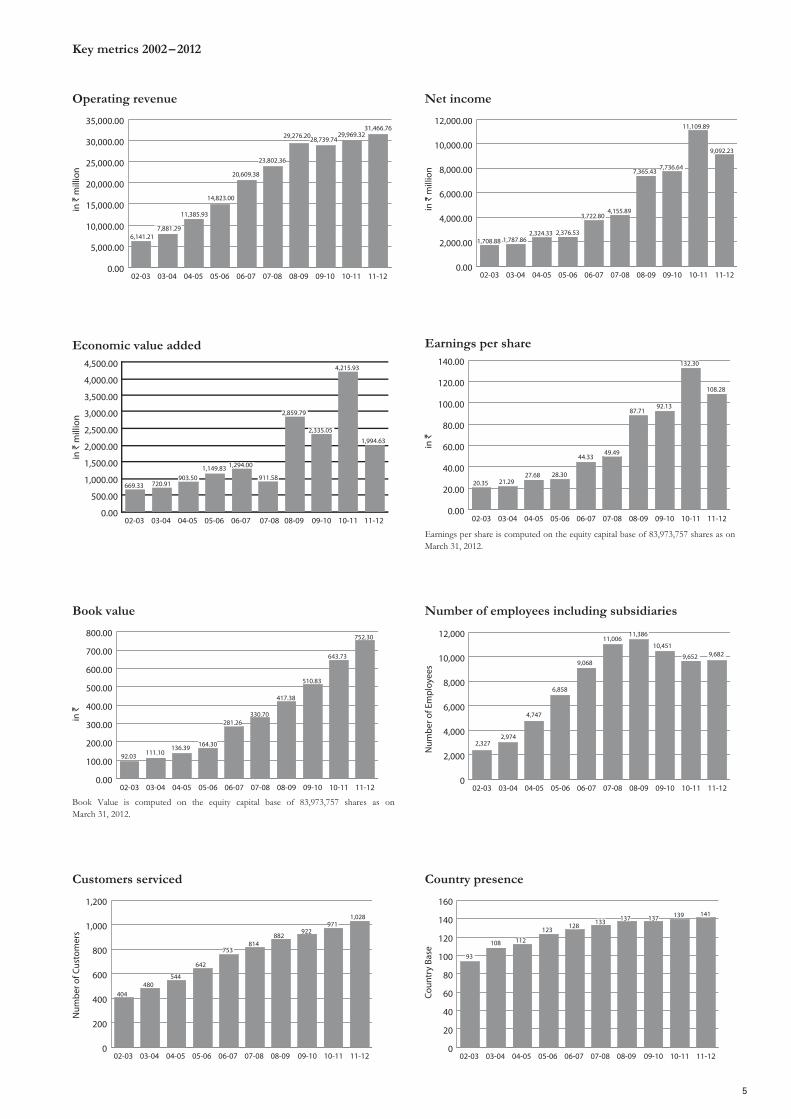
(All figures in ` million except EPS & Book Value)
Our 10 years in the industry
2002-03 2003-04 2004-05 2005-06 2006-07 2007-08 2008-09 2009-10 2010-11 2011-12 Operating Revenue 6,141.21 7,881.29 11,385.93 14,823.00 20,609.38 23,802.36 29,276.20 28,739.74 29,969.32 31,466.76 Interest and Other Income (expense) 97.93 136.58 259.28 290.54 367.28 631.16 1,763.89 (858.03) 1,668.26 4,217.49 Total Revenue 6,239.14 8,017.87 11,645.21 15,113.54 20,976.66 24,433.52 31,040.09 27,881.71 31,637.58 35,684.25 Total Expenses 4,277.53 5,703.26 8,693.82 12,176.60 16,837.91 19,835.95 22,839.30 18,947.38 19,157.57 21,515.23 EBT 1,961.61 2,314.61 2,951.39 2,936.94 4,138.75 4,597.57 8,200.79 8,934.33 12,480.01 14,169.02 Tax 252.73 526.75 627.06 560.41 415.95 441.68 835.36 1,197.69 1,370.12 5,076.29 EAT 1,708.88 1,787.86 2,324.33 2,376.53 3,722.80 4,155.89 7,365.43 7,736.64 11,109.89 9,092.73 EPS 20.35 21.29 27.68 28.30 44.33 49.49 87.71 92.13 132.30 108.28 Book Value 92.03 111.10 136.39 164.30 281.26 330.70 417.38 510.83 643.73 752.30
Note: All EPS and Book Values are computed based on the current equity capital base of 83,973,757 shares as on March 31, 2012.
Key performance indicators 2011 – 2012
Fiscal year 2011 – 2012 break up in terms of operating revenue by region, operating revenue by portfolio and expense by category
Financials at a glance
As per Indian GAAP Consolidated results
Operating revenue by portfolio
Expense by category
Operating revenue by region
5
Key metrics 2002 – 2012
Operating revenue Net income
Economic value added Earnings per share
Earnings per share is computed on the equity capital base of 83,973,757 shares as on March 31, 2012.
Book value
Book Value is computed on the equity capital base of 83,973,757 shares as on March 31, 2012.
Number of employees including subsidiaries
Country presenceCustomers serviced

Oracle Financial Services Software – Annual Report 2011-2012
Corporate informationOracle Financial Services Software
Board of Directors
S Venkatachalam, ChairmanChaitanya Kamat, Managing Director & CEODerek H WilliamsFrank BrienziRobert K WeilerWilliam Corey WestY M Kale
Management Team
Abhik Ray Anand Pitre Arvind Gulhati Atul Kumar Gupta Bhaskar Jayaraman Christopher James Curtis Dinesh V Shetty Don Ganguly Edwin Niranjan Moses George Thomas Girish Chhatpar H S Teji Jambu NatarajanK K Davis Karthick R PrasadKishore KapoorLaura BalachandranLoganathan Damodaran Mahesh Kandavar Rao
Manmath KulkarniManoj Narayan Kulkarni Meenakshy Iyer Mini Muralidhar Mustafa Moonim Naveen Grover Nikos Goutsoulas Parmeet Soin Patrick T O’Laughlin Peter Martin Hill Rajaram N Vadapandeshwara Rajendra Potdar Rajesh Makhija Ravikumar MRavikumar V S BhargavaSanjay BajajSanjay V Deshpande Sanjeet Prakash Rao Sivaramakrishnan GSridhar Ramachandran Surendra Shukla Suresh Kumar PinglayVenkata Subramanian Venkatesh Srinivasan Vijay AlexanderVikram Gupta Vinayak L Hampihallikar
Company Secretary
Hoshi D Bhagwagar
Chief Financial Officer
Makarand Padalkar
Chief Accounting Officer
Avadhut (Vinay) Ketkar
Auditors
S. R. Batliboi & Associates
Bankers
Bank of IndiaCanara BankCentral Bank of LibyaCitibank, N.A.HDFC Bank Ltd.Kotak Mahindra Bank Ltd.Syndicate BankYes Bank Ltd.
Registrars & Transfer Agents
Link Intime India Private LimitedC-13 Pannalal Silk Mills CompoundL.B.S. Marg, Bhandup (West)Mumbai 400078

7
Registered OfficeOracle Financial Services Software LimitedOracle ParkOff Western Express HighwayGoregaon (East)Mumbai 400063 Maharashtra, India
OfficesNirlon CompoundOff Western Express HighwayGoregaon (East)Mumbai 400063 Maharashtra, India
Oracle ParkAmbrosiaPune 411021 Maharashtra, India
Embassy Business ParkC.V. Raman NagarBangalore 560093 Karnataka, India
Gopalan Enterprises (I) Pvt. Ltd., (SEZ)Global Axis, Unit 1 & 2Plot # 152, EPIP ZoneWhitefieldBangalore 560066 Karnataka, India
Green I-Tech, # 5Muthiah Mudali StreetOff Cathedral RoadChennai 600086 Tamil Nadu, India
4th Floor, Logix Techno Park Sector 127Noida 201301 Uttar Pradesh, India
18 Krasnopresnenskaya nab.Block C, 9th floorMoscow 123317, Russia
Building No. 03128, 1st floor205, 207, 2nd floorDubai Internet CityP.O. Box: 500053, Dubai, UAE
Subsidiary Offices – IndiaOracle (OFSS) ASP Private LimitedOracle ParkOff Western Express HighwayGoregaon (East)Mumbai 400063 Maharashtra, India
Oracle (OFSS) Processing Services LimitedOracle ParkOff Western Express HighwayGoregaon (East)Mumbai 400063 Maharashtra, India
SDF-1, Unit 10, 11 & 12SEEPZ - SEZAndheri (East)Mumbai 400096 Maharashtra, India
Block A, NR Enclave, 4th FloorPlot No. 1, EPIP Industrial AreaVillage limits of HoodiKrishnarajapuram HobliWhitefieldBangalore 560066 Karnataka, India
Subsidiary Offices – Asia PacificOracle Financial Services Software (Shanghai) LimitedUnit 806 in Henderson Metropolitan155 Tianjin RoadShanghai, PRC, China 200001
Oracle Financial Services Software Pte. Ltd.27, International Business Park#02-01 iQUEST@IBP BuildingSingapore 609924
Offices21st Floor, Office Park Tower CNo-5, Jing Hua Nan JieChaoyang DistrictBeijing 100020, China
Oracle Aoyama Center 3F2-5-8 Kita AoyamaMinato-kuTokyo 107-0061, Japan
35F, No.66, Sec. 1Chung Hsiao W. Rd.Taipei 10018, Taiwan, R.O.C
39/F The Lee Gardens33 Hysan AvenueCauseway Bay, Hong Kong
Level 23, The Gardens North TowerMid Valley CityLingkaran Syed PutraKuala Lumpur 59200, Malaysia
6 Temasek Boulevard#18-01 Suntec Tower FourSingapore 038986
Level 4, 4 Julius AvenueNorth RydeSydney, NSW 2113, Australia
Level 4, 417 St Kilda Road Melbourne, VIC 3004 Australia

Oracle Financial Services Software – Annual Report 2011-2012
Oracle Financial Services Consulting Pte. Ltd.(subsidiary of Oracle Financial Services Software Pte. Ltd.)27, International Business Park#04-05 iQUEST@IBP BuildingSingapore 609924
Subsidiary Office – EuropeOracle Financial Services Software B.V.Claude Debussylaan 3214th floor, Vinoly Building1082 MD Amsterdam, The Netherlands
OfficesMainzer Landstrasse 49a60329 Frankfurt am Main, Germany
Level 2940 Bank Street, Canary WharfLondon E14 5NR, UK
Suite 22Portes de la Defense15, boulevard Charles de Gaulle92700 Colombes, France
Molyneux HouseBride Street, Dublin 8Ireland
Oracle Financial Services Software SA14nr Paradeisou Str. & 1nr Patroklou Str.Marousi, Athens, Greece
Subsidiary Offices – North AmericaOracle Financial Services Software America, Inc.Oracle Financial Services Software, Inc. & Mantas Inc.399 Thornall Street, 6th FloorEdison, NJ 08837 USA
Offices8000 Norman Center Drive, Suite 700Bloomington, MN 55437 USA
1910 Oracle Way, 3rd FloorReston, VA 20190 USA
6505 Blue Lagoon Drive, Suite #400Miami, FL 33126 USA
Oracle Financial Services Software, Inc. 17901 Von KarmanSuite 800Irvine, CA 92614
Burlington, 2nd floor 45 Network Drive, BurlingtonMassachusetts (MA), 01803
500 Oracle Parkway Redwood Shores, CA 94065
500 South Front St, Suite 1100Columbus, Ohio 43215
Subsidiary Offices – South AmericaOracle Financial Services Software Chile Limitada Avenida del Valle 537 - 3rd FloorCiudad EmpresarialHuechurabaSantiago, Chile, CP 8580678
Subsidiary Office – MauritiusISP Internet (Mauritius) Company LimitedC/o Cim Global BusinessRogers House5 President John Kennedy StreetPort Louis, Mauritius
OfficesOracle (OFSS) BPO Services Inc.17682, Mitchell North, Suite 201Irvine, CA 92614 USA
Oracle (OFSS) BPO Services LimitedDLF Infinity Tower A, 3rd FloorDLF Cyber City, Phase IIGurgaon 122002 Haryana, India

9
Directors’ report Financial year 2011 – 2012
Dear Members,
The Directors present their report on the business and operations of your Company along with the annual report and audited financial statements for the financial year 2011 – 2012.
Financial highlights
As per Indian GAAP Consolidated financial statements:(Amounts in ` million)
Particulars Year ended March 31, 2012
Year ended March 31, 2011
Revenue from operations 31,466.76 29,969.32Other income, net 4,217.49 1,668.26Total income 35,684.25 31,637.58Depreciation and amortization (466.17) (408.17)Profit before exceptional item and tax 14,862.34 12,602.08Exceptional item (693.32) (122.07)Profit before tax 14,169.02 12,480.01Tax expenses (5,076.29) (1,370.12)Profit for the year 9,092.73 11,109.89
As per Indian GAAP Unconsolidated financial statements: (Amounts in ` million)
Particulars Year ended March 31, 2012
Year ended March 31, 2011
Revenue from operations 26,058.54 23,605.06Other income, net 3,750.34 1,403.02Total income 29,808.88 25,008.08Depreciation and amortization (401.19) (336.49)Profit before exceptional items and tax 13,243.95 10,465.95Exceptional items, net 2,414.98 (122.07)Profit before tax 15,658.93 10,343.88Tax expenses (4,766.60) (664.09)Profit for the year 10,892.33 9,679.79
PerformanceOn consolidated basis, your Company’s revenue, stood at ` 31,467 million this year, an increase of 5% from ` 29,969 million as compared to the previous financial year. The net income decreased to ` 9,093 million this year, a decrease of 18.15% primarily on account of increase in tax expenses due to non availability of exemption u/s 10A of the Income Tax Act, 1961 from the financial year 2011 – 2012 onwards.
On an unconsolidated basis, your Company’s revenue grew to ` 26,058 million during the financial year 2011 – 2012 from` 23,605 million last year. This represents a growth of 10.39%. The Company’s profit for the financial year 2011 – 2012 has increased to ` 10,892 million, an increase of 12.53% over the previous financial year.
A detailed analysis of the financials is given in the Management’s discussion and analysis report that forms a part of this Directors’ report.
Dividend Your Company has plans to capitalize from the opportunities emerging from current market conditions and needs to invest in business growth. Keeping this in view, the Board has decided not to declare a dividend for the financial year 2011 – 2012. The funds will be used to further invest in new product development, infrastructure expansion and other growth opportunities. This will enhance our solution offerings, market reach and delivery capabilities and sustain the leadership position of your Company.

Oracle Financial Services Software – Annual Report 2011-2012
Transfer to reserves
The Company does not propose to transfer any amount to the General Reserve out of the amount available for appropriation. An amount of ` 42,256.04 million is proposed to be retained in the Profit & Loss Account.
Share capital
During the year, the Company allotted 78,955 equity shares of face value of ` 5/- each to its eligible employees, who exercised their options under the Employee Stock Option Scheme, 2002 and Employee Stock Option Scheme, 2010. As a result, as on March 31, 2012, the paid-up equity share capital of the Company was ` 419,868,785/- divided into 83,973,757 equity shares of face value of ` 5/- each.
Oracle’s holding in the Company
As on March 31, 2012, Oracle Global (Mauritius) Limited held 67,481,698 equity shares (80.36% of the equity capital) of the Company.
Directors
Mr. Y M Kale, Mr. Frank Brienzi and Mr. William Corey West, Directors of the Company, retire by rotation at the ensuing Annual General Meeting and being eligible, offer themselves for re-appointment.
As stipulated under Clause 49 of the Listing Agreement entered into with the stock exchanges, brief resumes of the Directors proposed to be re-appointed, the nature of their expertise in specific functional areas and the names of companies in which they hold directorships and membership/chairmanship of Board Committees, are provided in the Notice and/or Report on Corporate Governance forming a part of the Annual Report.
The Board recommends to the members the resolutions for re-appointment of Mr. Y M Kale, Mr. Frank Brienzi and Mr. William Corey West as Directors of the Company.
Ms. Dorian Daley and Mr. William T Comfort, Jr., ceased to be Directors of the Company with effect from August 18, 2011 and May 11, 2012, respectively. Accordingly, Mr. William T Comfort, Jr. also ceased to be the Chairman of the Board effective May 11, 2012. The Board appointed Mr. S Venkatachalam as the Chairman of the Board effective May 12, 2012.
The Board placed on record its appreciation of the services rendered by Ms. Dorian Daley and Mr. William T Comfort, Jr., during their tenure as Directors of the Company.
Infrastructure
The Board has adopted a facilities consolidation plan to use its premises more efficiently. Accordingly, the Company de-leased following offices. The staff located at such premises was relocated to other premises:
Mumbai: Vile Parle premises and a portion of the Goregaon Annexe office
Pune: Leased offices located at Pride, Ambrosia II & Kothrud
Bangalore: Leased offices at Diamond District, SJR Park & Millennium Towers
Chennai: Leased premises at T Nagar.
Global alliances
Your Company attaches great importance to building and expanding its partner network with organizations which can promote, sell, implement and support its offerings around the world.
Leading System Integration (SI) partners play an active role in delivering solutions to customers of your Company. The SI partners deliver projects in most countries around the world in which we are active.
This past year we have made great progress in terms of broadening the awareness of our products in the global partner community to implement and sell our product suite – including Oracle FLEXCUBE and Oracle Financial Services Analytical Applications. Your Company is taking advantage of the larger Oracle Partner Network (OPN) to broaden its reach. Your Company’s partners have been migrated to the Oracle Partner Network program. Partners are now offered online certifications for several of our products. In addition, your Company conducted its first ever FLEXCUBE Developers’ Conclave in Bangalore in March 2012, attracting over 160 partners and clients from around the world to a five day event.
Subsidiaries
Your Company has subsidiaries in India, USA, Singapore, The Netherlands, Republic of Mauritius, Greece, Republic of China and Chile to handle operations, strengthen marketing and sales efforts, ensure deeper sales penetration and provide post-sales support in these regions.
Mantas Singapore Pte Ltd. and Mantas Ltd., subsidiaries of the Company were dissolved with effect from March 1, 2012 and April 10, 2012, respectively.

11
Pursuant to Section 212 of the Companies Act, 1956 (“the Act”), the Company is required to attach to its Annual Report, the Balance Sheet, Profit and Loss Account, Directors’ Report and the Report of the Auditors (collectively referred to as ‘the accounts and reports’), of its subsidiaries for the year ended March 31, 2012.
The Ministry of Corporate Affairs has issued a General Circular No.: 2/2011 dated February 8, 2011 granting a general exemption to the companies stating that the provisions of Section 212 of the Act shall not apply in relation to subsidiaries of companies subject to the company fulfilling certain conditions stated in the said circular.
The Company is in compliance with the conditions stipulated by the Ministry of Corporate Affairs. Therefore, the accounts and related reports of the subsidiary companies are not attached to the Annual Report of the Company for the year ended March 31, 2012.
The Company will make available the accounts and related information of the subsidiary companies upon request by any member/investor of the Company or its subsidiaries. Further, the accounts and related information of the subsidiary companies will be kept open for inspection by any member, at the registered office of the Company and at the registered office of the subsidiaries during office hours of the Company/subsidiaries and the same will also be available on the website of the Company www.oracle.com/financialservices.
Fixed deposits
During the financial year 2011 – 2012, the Company has not accepted any fixed deposit within the meaning of Section 58A of the Companies Act, 1956 and as such, no amount of principal or interest was outstanding as of the date of the Balance Sheet.
Corporate governance
The Company has taken appropriate steps and measures to comply with all the corporate governance and related requirements as envisaged under Clause 49 of the Listing Agreement entered with stock exchanges and Section 292A of the Companies Act, 1956.
Your Company has constituted five committees consisting of Board members and other senior officials of the Company, namely, an Audit Committee, Compensation Committee, ESOP Allotment Committee, Transfer Committee and Shareholders’ Grievances Committee. There is a separate report on Corporate Governance which forms part of this annual report. A certificate of Statutory Auditors, M/s. S. R. Batliboi & Associates, Chartered Accountants, with regard to compliance of conditions of Corporate Governance as stipulated in Clause 49 of the Listing Agreement is annexed herewith. The Company is also supporting the Go Green initiative announced by the Ministry of Corporate Affairs allowing paperless compliance.
A certificate from the Managing Director and Chief Financial Officer of the Company confirming internal controls and checks pertaining to financial statements, as also declaring that all Board members and senior managerial personnel have affirmed compliance with the Code of Ethics and Business Conduct for the financial year ended March 31, 2012, was placed before the Board of Directors and the Board has noted the same. The said certificate is annexed to the Directors’ report.
A list of the committees of the Board, names of their members, scope and other related information are detailed in the Corporate Governance Report.
Employee Stock Option Plan (‘ESOP’)
The shareholders at their Annual General Meeting held on August 14, 2001 approved grant of ESOPs to the employees/directors of the Company and its subsidiaries up to 7.5% of the issued and paid-up capital of the Company from time to time. This said limit was enhanced and approved up to 12.5% of the issued and paid-up capital of the Company from time to time, by the Shareholders at their Annual General Meeting held on August 18, 2011. This extended limit is an all inclusive limit applicable for stock options granted in the past and in force and those that will be granted by the Company under this authorization.
Pursuant to ESOP resolutions approved by the shareholders of the Company on August 14, 2001, the Board of Directors, on March 4, 2002 approved the Employees Stock Option Scheme (“Scheme 2002”) for issue of 4,753,600 options to the employees and directors of the Company and its subsidiaries. According to the Scheme 2002, the Company has granted 4,548,920 options prior to the IPO and 619,000 options at various dates after IPO (including the grants of options out of options forfeited earlier).
On August 25, 2010, the Board of Directors approved the Employees Stock Option Plan 2010 Scheme (“Scheme 2010”) for issue of 618,000 options to the employees and directors of the Company and its subsidiaries. According to the Scheme 2010, the Company has granted 638,000 options (including the grants of options out of options forfeited earlier).
Pursuant to ESOP resolutions approved by the shareholders of the Company in their meeting held on August 18, 2011, the Board of Directors approved the Employees Stock Option Plan 2011 Scheme (“Scheme 2011”) for issue of 5,100,000 options to the employees and directors of the Company and its subsidiaries. According to the Scheme 2011, the Company has granted 640,500 options till March 31, 2012.
As per the above schemes, each of 20% of the total options granted will vest to the eligible employees and directors on completion of 12, 24, 36, 48 and 60 months from the date of grant and is subject to continued employment of the employee or directorship of the director with the Company or its subsidiaries. Options have an exercise period of 10 years from the date of grant. The employee pays the exercise price upon exercise of option.

Oracle Financial Services Software – Annual Report 2011-2012
The details of the options granted under the ESOP 2002, ESOP 2010 and ESOP 2011 Schemes to eligible employees/directors from time to time are given below:
Financial year Total number of Options granted
Under ESOP 2002 Scheme2001 – 2002 4,548,9202002 – 2003 80,0002003 – 2004 36,0002004 – 2005 60,0002005 – 2006 10,0002006 – 2007 373,0002007 – 2008 Nil2008 – 2009 Nil2009 – 2010 Nil2010 – 2011 60,0002011 – 2012 NilUnder ESOP 2010 Scheme2010 – 2011 618,0002011 – 2012 20,000Under ESOP 2011 Scheme2011 – 2012 640,500Total 6,446,420
Pricing formula At the market price as on the date of grant
Options vested at the end of the financial year 2011 – 2012 178,808Options exercised during 2011 – 2012 78,955Total number of shares arising as a result of exercise of options during 2011 – 2012 78,955
Financial year Options lapsed*
2002 – 2003 129,5202003 – 2004 112,5002004 – 2005 82,2002005 – 2006 87,6002006 – 2007 46,6002007 – 2008 35,9002008 – 2009 60,4552009 – 2010 21,0002010 – 2011 72,7352011 – 2012 198,191Total 846,701Variation of terms of options NoneMoney realized by exercise of options during the financial year 2011 – 2012 ` 74,326,994Total number of options in force as on March 31, 2012 1,191,056
* Includes number of options forfeited.
The details of options granted to Directors and Senior Managerial Personnel under ESOP 2011 Scheme during the financial year ended March 31, 2012 are as follows:Particulars Number of Optionsi. Directors:
Mr. Chaitanya Kamat 30,000 Mr. S Venkatachalam 10,000
Senior Managerial Personnel: Mr. Kishore Kapoor 10,000 Mr. Makarand Padalkar 15,000 Mr. Atul Kumar Gupta 4,000 Mr. Vikram Gupta 10,000 Mr. Manmath Kulkarni 10,000 Mr. Edwin N Moses 40,000 Mr. Avadhut Ketkar 5,000 Mr. Hoshi D Bhagwagar 2,000

13
ii. Any other employee, who receives grant in any one year of option amounting to 5% or more of option granted during the yearMr. Edwin N Moses 40,000
iii. Identified employees who were granted option, during any one year, equal to or exceeding 1% of the issued capital (excluding outstanding warrants and conversions) of the Company at the time of grant
Nil
iv. Diluted Earnings Per Share (EPS) pursuant to the issue of shares on exercise of option calculated in accordance with Accounting Standard 20 ‘Earnings Per Share’ issued by the Institute of Chartered Accountants of India
` 129.65
Had compensation cost for the Company’s ESOP been determined based on fair value at the grant dates, Company’s net profit and earnings per share would have been reduced to proforma amounts indicated below:
(Amounts in ` million, except per share data)Particulars Year ended March 31, 2012
Profit as reported 10,892.33Less: Employee stock compensation under fair value method (190.48)Proforma profit 10,701.85Earnings Per ShareBasicAs reported 129.78Proforma 127.51DilutedAs reported 129.65Proforma 127.44
All stock options under the Employee Stock Option Plans were granted at market price on the date of grant. Accordingly, we have calculated the compensation cost arising on account of stock options granted using the intrinsic value method. Hence, the disclosure in terms of Clause 12.1(n) of the Securities and Exchange Board of India (Employee Stock Option Scheme and Employee Stock Purchase Scheme) Guidelines, 1999, is not applicable.
A summary of activities in the Company’s ESOP Scheme 2002 is as follows:
Particulars Year ended March 31, 2012Shares arising from options Weighted average exercise price (`)
Outstanding at beginning of year 245,837 1,414Granted – –Exercised (78,275) 932Forfeited (22,350) 1,107Outstanding at end of the year 145,212 1,721
Vested options 97,212Unvested options 48,000
A summary of activities in the Company’s ESOP Scheme 2010 is as follows:
Particulars Year ended March 31, 2012Shares arising from options Weighted average exercise price (`)
Outstanding at beginning of year 561,865 2,050Granted 20,000 2,342Exercised (680) 2,050Forfeited (152,841) 2,050Outstanding at end of the year 428,344 2,064
Vested options 81,596Unvested options 346,748
Oracle Financial Services Software – Annual Report 2011-2012
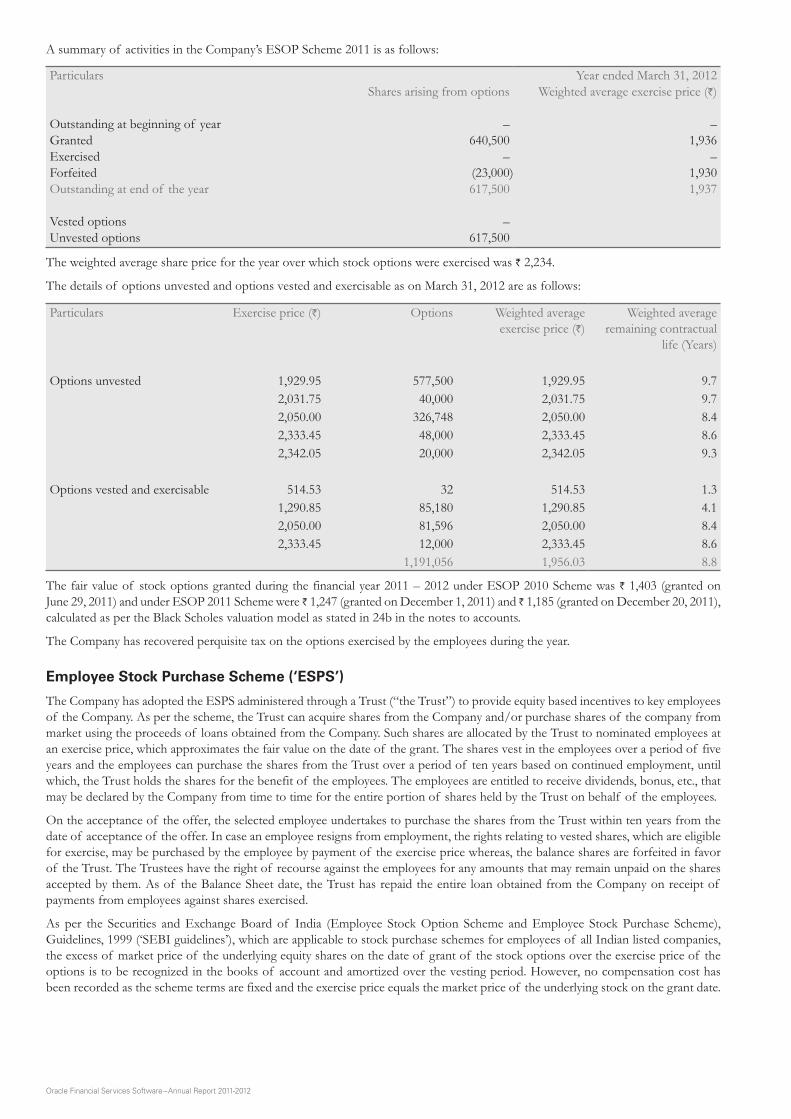
A summary of activities in the Company’s ESOP Scheme 2011 is as follows:
Particulars Year ended March 31, 2012Shares arising from options Weighted average exercise price (`)
Outstanding at beginning of year – –Granted 640,500 1,936Exercised – –Forfeited (23,000) 1,930Outstanding at end of the year 617,500 1,937
Vested options –Unvested options 617,500
The weighted average share price for the year over which stock options were exercised was ` 2,234.
The details of options unvested and options vested and exercisable as on March 31, 2012 are as follows:
Particulars Exercise price (`) Options Weighted average exercise price (`)
Weighted average remaining contractual
life (Years)
Options unvested 1,929.95 577,500 1,929.95 9.72,031.75 40,000 2,031.75 9.72,050.00 326,748 2,050.00 8.42,333.45 48,000 2,333.45 8.62,342.05 20,000 2,342.05 9.3
Options vested and exercisable 514.53 32 514.53 1.31,290.85 85,180 1,290.85 4.12,050.00 81,596 2,050.00 8.42,333.45 12,000 2,333.45 8.6
1,191,056 1,956.03 8.8
The fair value of stock options granted during the financial year 2011 – 2012 under ESOP 2010 Scheme was ` 1,403 (granted on June 29, 2011) and under ESOP 2011 Scheme were ̀ 1,247 (granted on December 1, 2011) and ̀ 1,185 (granted on December 20, 2011), calculated as per the Black Scholes valuation model as stated in 24b in the notes to accounts.
The Company has recovered perquisite tax on the options exercised by the employees during the year.
Employee Stock Purchase Scheme (‘ESPS’)
The Company has adopted the ESPS administered through a Trust (“the Trust”) to provide equity based incentives to key employees of the Company. As per the scheme, the Trust can acquire shares from the Company and/or purchase shares of the company from market using the proceeds of loans obtained from the Company. Such shares are allocated by the Trust to nominated employees at an exercise price, which approximates the fair value on the date of the grant. The shares vest in the employees over a period of five years and the employees can purchase the shares from the Trust over a period of ten years based on continued employment, until which, the Trust holds the shares for the benefit of the employees. The employees are entitled to receive dividends, bonus, etc., that may be declared by the Company from time to time for the entire portion of shares held by the Trust on behalf of the employees.
On the acceptance of the offer, the selected employee undertakes to purchase the shares from the Trust within ten years from the date of acceptance of the offer. In case an employee resigns from employment, the rights relating to vested shares, which are eligible for exercise, may be purchased by the employee by payment of the exercise price whereas, the balance shares are forfeited in favor of the Trust. The Trustees have the right of recourse against the employees for any amounts that may remain unpaid on the shares accepted by them. As of the Balance Sheet date, the Trust has repaid the entire loan obtained from the Company on receipt of payments from employees against shares exercised.
As per the Securities and Exchange Board of India (Employee Stock Option Scheme and Employee Stock Purchase Scheme), Guidelines, 1999 (‘SEBI guidelines’), which are applicable to stock purchase schemes for employees of all Indian listed companies, the excess of market price of the underlying equity shares on the date of grant of the stock options over the exercise price of the options is to be recognized in the books of account and amortized over the vesting period. However, no compensation cost has been recorded as the scheme terms are fixed and the exercise price equals the market price of the underlying stock on the grant date.

15
A summary of activities in the Company’s ESPS is as follows:Particulars Year ended Year ended
March 31, 2012 March 31, 2011
Number of shares Number of sharesOpening balance of unallocated shares 166,142 165,150Shares forfeited during the year – 992Closing balance of unallocated shares 166,142 166,142
Opening balance of allocated shares 29,081 54,548Shares exercised during the year (10,264) (24,475)Shares forfeited during the year – (992)Closing balance of allocated shares 18,817 29,081
Shares eligible for exercise 18,817 29,081Shares not eligible for exercise – –Total allocated shares 18,817 29,081
Human resources
We believe that people are our only non replaceable resource in our endeavor to search new horizons of performance and corporate excellence. We continuously invest in them to maintain our competitive advantage in the market place. We have created a meritocratic culture and organizational environment along with a differentiated performance management and reward system to foster performance excellence. Our HR practices are innovative, unique and can be counted one among the best in the industry. Our people development initiative offers the best and latest in the technology and finance domains and develops contemporary leadership attitudes and practices in our employees.
Your Company continued to focus on domain expertise coupled with technology expertise. Our total manpower at the end of March 2012 was 9,682 as compared to 9,652 as on March 2011.
Corporate social responsibility
An initiative to support children, originally rolled out as “i-flex for children”, is in its tenth successful year. Our Corporate Social Responsibilities are managed by a committee of senior company officials and volunteers from divisions and locations in India. Our endeavor is to support activities which do not have any religious or political affiliation. Your Company encourages employees to actively participate in and lead, where possible, such programs. We actively fund educational institutions in rural India which are non-profit oriented and secular and all inclusive in approach. The initiative is funded each year to support activities proposed to the committee by employees.
Continuing support was given to a wide range of activities during fiscal year 2011 – 2012, including construction of additional facilities at schools and hospitals, scholarships for children with special needs and making transportation arrangements for special need schools. For the past 6 years your Company has supported an annual athletic event for children.
Directors’ responsibility statement
As required under Section 217(2AA) of the Companies Act, 1956, for the financial year ended on March 31, 2012, the Directors hereby confirm that:
i. In preparation of the annual accounts, the applicable accounting standards have been followed along with proper explanation relating to material departures;
ii. The Directors have selected such accounting policies and applied them consistently and made judgments and estimates that are reasonable and prudent so as to give a true and fair view of the state of affairs of the Company at the end of the financial year and of the profit of the Company for that period;
iii. The Directors have taken proper and sufficient care for the maintenance of adequate accounting records in accordance with the provisions of this Act for safeguarding the assets of the Company and for preventing and detecting fraud and other irregularities; and
iv. The Directors have prepared the annual accounts on a ‘going concern’ basis.
Auditors
M/s. S. R. Batliboi & Associates, Chartered Accountants (Registration no. 101049W), the present Statutory Auditors of the Company, hold office till the ensuing Annual General Meeting and have confirmed their eligibility and willingness to accept the office, if re-appointed.

Oracle Financial Services Software – Annual Report 2011-2012
Auditors’ Report
With regard to the Auditors’ comment in the CARO report concerning delays in payment of a few tax payments, e.g., Service Tax, Foreign Taxes, Income Tax, Value Added Tax (VAT), Foreign Withholding Tax, the Company would like to state the following:
i. The Company has engaged international tax experts in the interpretation of laws and regulations relating to corporate taxes and VAT in foreign countries. The Company has accrued the liabilities in the books taking a conservative approach, however the payments shall be made to the authorities in due course based on the final advice your Company receives from tax experts.
ii. The Company continually assesses Payroll Tax implications in various jurisdictions outside India on salaries and travel related reimbursements paid to its employees posted therein and accordingly makes accruals in the books. The Company is in the process of filing the returns for Payroll Tax in such jurisdiction for which the provision is already made in the books. As per the local laws of most host countries, the tax is payable by the employee, however in a few countries tax payment is a responsibility of the employer, which amounts to ` 10.71 crore. The Company and the employees ensure tax compliance in such countries as advised by the tax consultants.
Conservation of energy, technology absorption and foreign exchange earnings and outgo
The particulars as prescribed under sub-section (1)(e) of Section 217 of the Companies Act, 1956 read with Companies (Disclosure of Particulars in the Report of Board of Directors) Rules, 1988, the relevant data pertaining to conservation of energy, technology absorption and foreign exchange earnings and outgo are furnished hereunder:
i. Conservation of energy and technology absorption:
The Company seeks, through various technology initiatives, to enhance computing standards to make its information technology infrastructure virtual, secure, cost effective and environment friendly. It seeks to provide its users with enhanced computing systems and also fulfill its obligation to the society and the environment.
Virtualization: Virtualization, implemented a year ago for IT was extended to the other business units as well. The Lines of Business have adopted virtualization in operations and this has resulted in significant reduction in direct costs associated with procurement of additional infrastructure as well as indirect costs associated with reduction in power utilization and space.
Virtualization has also helped remove and replace a lot of End of Life (EOL) infrastructure, which otherwise was cost intensive due to AMC charges, operational overheads, power and space utilization. The number of physical servers in the Data Center post virtualization has significantly undergone a reduction.
Adding to the consolidation through virtualization, the Datacenters at various locations were consolidated to minimize duplication of efforts, significant saving on power, lease charges and infrastructure investments. This substantially brought down operating expenses and built in a more concentrated operating model, in turn benefitting the business users.
In addition to the existing technology reaping benefits, there has been new technology deployment in the organization, providing the users with advanced computing facilities, and building operational efficiencies, key being defining an optimal balance between the two. A few significant initiatives are as below:
Year ended March 31, 2012 has been the year of standardization. The network/telephony refresh was initiated at the Company and an advanced and standardized solution was deployed across the organization. This has resulted in uniform technology, resulting in considerable cost benefits through operational efficiencies.
Another major move towards standardization was a focus on customer connectivity. The Oracle standard connectivity model is being adopted and deployed for client connectivity. This connectivity model provides employees working on customer projects with reliable and secure connections to our customers.
Further, to enhance communication across the globe in a cost effective manner, Next Gen Video conferencing facility is being implemented. This technology has transformed communication between users, by making possible better long distance communication. This has resulted in substantial cost saving as well.
Finally, as a move to secure Confidential data residing on user machines, end point encryption of the local hard disks has been implemented ensuring safety of data in the event of theft or loss of machine in the prevention of unauthorized access to the machine. This initiative augments the overall mandate of protection and appropriate usage of confidential information in the organization.
ii. Foreign exchange earnings and outgo:(Amounts in ` million)
Foreign Exchange Earnings (excluding reimbursement of travelling expenses)
28,148.60
Foreign Exchange Outgo (including capital goods & other expenditure)
8,576.86

17
Prospects
Due to continuing economic uncertainty around the globe, growth slowed in 2011. Demand from developing countries did support higher output in high-income economies. However, financial institutions in many western economies are under pressure and a series of regulatory changes related to capital and liquidity provisioning have been proposed.
Your Company recognized the opportunity to deliver integrated solutions for risk management and finance functions to banks. The investments over the past 36 months to integrate risk applications with Oracle Financial Application Suite have given your Company a significant advantage in its ability to execute very large transformation projects at Tier 1 banks. This integrated solution now enables banks to take advantage of the common ground that already exists between risk and finance data. Financial Insights/IDC in its annual predictions* suggested that risk management spending will top US$ 60 billion and consume 15% of IT Spend worldwide.
Chartis, a leading provider of research and analysis covering the global market for risk management technology, recognized Oracle to be a leading vendor in the risk and finance integration technology market in the report published in December 2011.
Your Company announced the availability of solutions for multi-channel banking at the Oracle Financial Services & Insurance Forum, New York. This release of the solution helps banks leverage trends in mobility and personalization of financial services. Oracle FLEXCUBE was ranked the #1 selling core banking solution by IBS Consulting in the Sales League Table 2011.
Your Company now has expanded its presence in commercial banks in China in addition to its existing implementations at international banks in the greater China region. Your Company completed the core banking transformation project at Ping An Bank in China. The implementation was completed in a record timeframe of 18 months. The Ping An Bank team won the “Best Core Banking Award for Commercial Banks in China” by The Asian Banker.
Your Company hosted the first global Oracle FLEXCUBE Developers Conclave, at Bangalore, India. At this event FLEXCUBE users from banks and partners participated to gain in-depth knowledge and hands-on development experience that will enable banks to easily customize, extend and localize solutions to meet their unique needs.
Oracle has long had a vision for moving customers to a complete, consolidated, and optimized computing environment that provides maximum flexibility, scalability, and agility. Today, Oracle refers to this vision in its corporate tag line “Hardware and Software Engineered to Work Together”. Modern enterprises understand and embrace the concept like never before—and Oracle is the only vendor that can deliver it. Your Company by leveraging this vision has delivered extreme performance for banks on an integrated stack and simplifying the effort required by banks to integrate the various components during implementation.
Consulting Services continue to play a key and vital role for your Company and performs a very strategic role in engagements with the leading banks. Your Company has renewed multi-year consulting engagements with existing customers. Support services for our applications continue to grow and banks see this service as vital for operations at their banks.
* report entitled Worldwide Financial Services 2012 Top 10 Predictions: Thriving or Just Surviving?
Employee particulars
Information as per Section 217(2A) of the Companies Act, 1956 (“the Act”), read with the Companies (Particulars of Employees) Rules, 1975, for the financial year ended on March 31, 2012, forms part of this Report. As per the provisions of Section 219(1)(b)(iv) of the Act, the Directors’ Report and the Accounts are being sent to the members excluding the statement giving particulars of employees under Section 217(2A) of the Act.
Members who wish to obtain a copy of the statement, may write to the Company Secretary at the Registered Office of the Company.
Acknowledgements
Your Directors take this opportunity to thank the Company’s customers, members, vendors and bankers for their continued support during the year. Your Directors also wish to thank the Government of India and its various agencies, Department of Electronics, the Software Technology Parks – Bangalore, Mumbai, Chennai and Pune, Special Economic Zone authorities at SEEPZ and Cochin, the Customs and Excise Department, Ministry of Commerce, Ministry of Finance, Ministry of External Affairs, Ministry of Corporate Affairs, Department of Telecommunication, the Reserve Bank of India, the State Governments of Maharashtra, Karnataka, Haryana and Tamil Nadu and other local Government Bodies, for their support and look forward to their continued support in the future.
Your Directors also place on record their appreciation for the excellent contribution made by employees of the Company through their commitment, competence, co-operation and diligence with a view to achieving consistent growth for the Company.
For and on behalf of the Board
S VenkatachalamChairman
July 10, 2012

Oracle Financial Services Software – Annual Report 2011-2012
Corporate governance report
The detailed report on Corporate Governance of Oracle Financial Services Software Limited (“the Company”) for the financial year ended 2011 – 2012 as per Clause 49 of the Listing Agreement entered with Stock Exchanges is set out below.
1. Company’s philosophy on code of governance
The Company believes in adopting and adhering to globally recognized corporate governance practices and continuously benchmarking itself against such practices. The Company understands and respects its fiduciary role and responsibility to its Members and strives to meet their expectations.
2. Board of Directors
2.1 Composition and category
The composition of the Board of Directors of the Company (“the Board”) as on March 31, 2012, was as under:
Name of the Director Designation Category Directorships in other
Companies
Chairmanship of Committees
of Boards of other Companies
Membership of Committees
of Boards of other Companies
Mr. William T Comfort, Jr. # Chairman Non-Executive, Independent Director 4 Nil Nil
Mr. Chaitanya Kamat Managing Director & CEO
Executive, Non-Independent Director 1 Nil Nil
Mr. Derek H Williams Director Non-Executive, Non-Independent Director 1 1 Nil
Mr. Frank Brienzi Director Non-Executive, Non-Independent Director 2 Nil Nil
Mr. Robert K Weiler@ Director Non-Executive, Non-Independent Director Nil Nil Nil
Mr. S Venkatachalam* Director Non-Executive, Independent Director 3 Nil 1
Mr. William Corey West Director Non-Executive, Non-Independent Director 19 Nil Nil
Mr. Y M Kale$ Director Non-Executive, Independent Director 6 Nil Nil
@ Mr. Robert K Weiler was appointed as a Director in the Annual General Meeting held on August 18, 2011.# Mr. William T Comfort, Jr., ceased to be a Director with effect from May 11, 2012.* Mr. S Venkatachalam was appointed as the Chairman of the Board effective May 12, 2012.$ Directorships include being an Alternate Director in four companies.
Notes: (1) Only the Audit Committee and the Shareholders’ Grievances Committee are considered.(2) All Directorships of Mr. Frank Brienzi, Mr. William Corey West and Mr. Derek H Williams are in foreign companies.(3) None of the directors are related inter se.
2.2 Other changes in the Board during the financial year 2011 – 2012
Ms. Dorian Daley ceased to be a Director with effect from August 18, 2011.
2.3 Attendance of each Director at the Board Meetings and the last Annual General Meeting
The Company holds Board Meetings at regular intervals. The detailed agenda along with the explanatory notes are circulated in advance. The Directors can suggest the inclusion of any item to the agenda at the Board Meeting. The Independent Directors actively participate in the Board Meetings and contribute to the decision making process by expressing their opinions, views and suggestions.

19
During the Financial Year 2011 – 2012, six Board Meetings were held on the following dates:
May 10, 2011, August 2, 2011, August 18, 2011 (at 12.00 noon), August 18, 2011 (at 6.00 p.m.), October 25, 2011 and January 25, 2012.
The attendance of the Directors at the Board Meetings and the Annual General Meeting held during the financial year 2011 – 2012 is as given below:
Name of the Director Number of Board Meetings attended
Number of Board Meetings attended Last AGM AttendedIn person On phone
Mr. William T Comfort, Jr. 6 5 1 YesMr. Chaitanya Kamat 6 6 – Yes Mr. Derek H Williams 6 2 4 YesMs. Dorian Daley – – – NoMr. Frank Brienzi 4 1 3 NoMr. Robert K Weiler 3 2 1 YesMr. S Venkatachalam 6 6 – YesMr. William Corey West 3 1 2 NoMr. Y M Kale 6 6 – Yes
2.4 Details of other directorships
Details of the directorships of the Company’s Directors in other companies as on March 31, 2012 are given below:
Name of the Director Other directorships
Mr. William T Comfort, Jr. Citigroup Venture CapitalDeutsche Annington (DAIG)Nabors IndustriesAmerican India Foundation (AIF)
Mr. Chaitanya Kamat Oracle Financial Services Software S.A.
Mr. Frank Brienzi NPower, TexasAidmatrix
Mr. Derek H Williams Nihon Oracle Kabushiki Kaisha
Mr. Robert K Weiler –
Mr. S Venkatachalam State Bank of India Equifax Credit Information Services Private LimitedCanara Robecco Asset Management Company Limited
Mr. William Corey West BEA Crossgain InternationalBEA Systems Ireland Holding LimitedEontec LimitedJ.D. Edwards Europe LimitedNetsure Telecom LimitedOCAPAC Distributor PartnerOCAPAC Hardware PartnerOCAPAC Holding CompanyOCAPAC Research CompanyOCAPAC Research PartnerOracle Australia Holdings Pty. Ltd.Oracle Consolidation Australia Pty. Ltd.Oracle Corporation Malaysia Holdings Sdn Bhd.Oracle Global (Mauritius) LimitedOracle Hong Kong Holdings Ltd.

Oracle Financial Services Software – Annual Report 2011-2012
Oracle Singapore Holdings Pte Ltd.Oracle Technology CompanySiebel Systems Ireland Holding Ltd.Sun Microsystems Technology Limited
Mr. Y M Kale Ashok Leyland Limited (Alternate Director)Gulf Oil Marine Limited Hinduja Foundries Limited (Alternate Director)IndusInd Bank Limited (Alternate Director)Hinduja National Power Corporation Limited (Alternate Director)Hinduja Leyland Finance Limited
2.5 Details of memberships of Board Committees
None of the Directors of the Company hold Memberships in more than ten Committees, nor is any Director a Chairman in more than five Committees of the Boards of the companies where he holds directorship. For this purpose, “Committees” include Audit Committee and Shareholders’ Grievances Committee of a company.
The details of the Memberships of the Company’s Directors in the above mentioned committees of all the Indian Public Limited Companies (including the Company) of which they are Members as on March 31, 2012 are given below:
Name of the Director Audit Committee Shareholders’ Grievances CommitteeChairman Member Chairman Member
Mr. William T Comfort, Jr. – – – –Mr. Chaitanya Kamat – – – –Mr. Frank Brienzi – – – –Mr. Derek H Williams – – – –Mr. Robert K Weiler – – – –Mr. S Venkatachalam – 1 1 1Mr. William Corey West – 1 – –Mr. Y M Kale 1 – – –
2.6 Brief resume of Directors who will be retiring by rotation at the ensuing Annual General Meeting of the Company and, being eligible, offer themselves for re-appointment
Mr. Y M Kale
Mr. Y M Kale, born on November 4, 1947, was President of the Institute of Chartered Accountants of India (1995 – 1996) and is also a fellow member of the Institute of Chartered Accountants of England and Wales. He has contributed to various governmental and regulatory bodies such as the Securities & Exchange Board of India, the Committee of Offer Documents, the Committee of Takeovers and the Committee on Accounting for Corporates. He has participated as a member of the group for the Introduction of Concurrent Audit of Banks, which was organized by the Reserve Bank of India. He was a member of the National Drugs and Pharmaceutical Development Council of the Government of India. He was also on the Board of the International Accounting Standards Committee from 1995 to 1998 as India’s representative.
Mr. Kale does not hold any equity shares of the Company as on date.
Mr. Frank Brienzi
Mr. Frank Brienzi, born on February 25, 1962, is Senior Vice President and General Manager of Oracle’s Financial Services Global Business Unit. He is a member of board of directors of Oracle Financial Services Software Limited and he oversees the business operations of the Company. He brings more than 25 years of financial services experience and expertise to his role at Oracle. He began his career with EDS in 1984, as part of the financial services strategic business unit responsible for large-scale banking and insurance development, sales and account management. For the past 15 years, he was a managing partner at Accenture, helping to grow their global financial services business and leading Accenture’s Application Outsourcing practice in North America, Asia Pacific, Europe, Africa and Latin America. He has written several articles for major magazines including Forbes and InformationWeek. He currently serves on the board of Aidmatrix and is Vice-Chairman for NPower, Texas. He is an active member in United Way programs and Stonebriar Community Church. He holds double majors in mathematics and management information systems from the University of Northern Colorado.
Mr. Brienzi does not hold any equity shares of the Company as on date.

21
Mr. William Corey West
Mr. William Corey West, born on May 4, 1962, is Senior Vice President, Corporate Controller and Chief Accounting Officer of Oracle Corporation. He brings more than 25 years of finance, accounting and executive management experience and expertise to his role at Oracle. He began his career with Arthur Andersen in 1984, as part of the accounting and audit practice. He served clients in a variety of industries for 14 years and left Arthur Andersen in 1998 as a partner. After leaving Arthur Andersen, he worked in finance, accounting and executive management positions at RPC, Adecco, Cadence Design Systems, The Gap and Intuit. He joined Oracle Corporation on April 2, 2007. He graduated from the University of Washington in December 1984 with a bachelor’s degree in business, accounting and finance concentration.
Mr. West does not hold any equity shares of the Company as on date.
3. Audit committee
3.1 Primary objectives and powers of the Audit Committee
The primary objective of Audit Committee is to monitor and provide effective supervision of the management’s financial reporting process and to ensure accurate, timely and proper disclosures and transparency, integrity and quality of the financial reporting.
The powers of the Audit Committee include the following:
1. To investigate any activity within its terms of reference.
2. To seek information from any employee.
3. To obtain outside legal or other professional advice.
4. To secure attendance of outsiders with relevant expertise, if it considers necessary.
3.2 Broad terms of reference
The terms of reference of the Audit Committee are as follows:
1. Oversight of the Company’s financial reporting process and the disclosure of its financial information to ensure that the financial statement is correct, sufficient and credible.
2. Recommending to the Board, the appointment, re-appointment and, if required, the replacement or removal of the statutory auditor and the fixation of audit fees.
3. Approval of payment to statutory auditors for any other services rendered by the statutory auditors.
4. Reviewing, with the management, the annual financial statements before submission to the Board for approval, with particular reference to:
a. Matters required to be included in the Director’s Responsibility Statement to be included in the Board’s report in terms of Section 217(2AA) of the Companies Act, 1956
b. Changes, if any, in accounting policies and practices and reasons for the same
c. Major accounting entries involving estimates based on the exercise of judgment by management
d. Significant adjustments made in the financial statements arising out of audit findings
e. Compliance with listing and other legal requirements relating to financial statements
f. Disclosure of any related party transactions
g. Qualifications in the draft audit report
5. Reviewing, with management, the quarterly financial statements before submission to the Board for approval.
6. Reviewing, with management, the performance of statutory and internal auditors and the adequacy of the internal control systems.
7. Reviewing the adequacy of the internal audit function including the structure of the internal audit department, staffing and seniority of the official heading the department, reporting structure coverage and frequency of internal audit.
8. Discussion with internal auditors regarding any significant findings and any follow-up required.
9. Reviewing the findings of any internal investigations by the internal auditors into matters where there is suspected fraud or irregularity or a failure of internal control systems of a material nature and reporting the matter to the Board.
10. Discussion with statutory auditors, before the audit commences, about the nature and scope of the audit as well as post-audit discussion to determine any area of concern.
11. To determine the reasons for any substantial defaults in the payment to depositors, debenture holders, shareholders (in case of non payment of declared dividends) and creditors.

Oracle Financial Services Software – Annual Report 2011-2012
12. To review the functioning of the Whistle Blower policy.
13. Carrying out any other function as is mentioned in the terms of reference of the Audit Committee.
3.3 Composition of the committee
The Composition of Audit Committee as on March 31, 2012 was as follows:
Name of the Member
Mr. Y M Kale Chairman, Non-Executive, Independent Director Mr. S Venkatachalam Member, Non-Executive, Independent DirectorMr. William Corey West Member, Non-Executive, Non - Independent Director
3.4 Meetings and attendance
During the Financial Year 2011 – 2012, six meetings of the Committee were held on April 19, 2011, May 10, 2011, August 2, 2011, October 25, 2011, January 12, 2012 and January 25, 2012.
The Member’s attendance at the Committee Meetings is given below:
Name of the Member Number of meetings attendedIn person On phone
Mr. Y M Kale 6 –Mr. S Venkatachalam 6 –Mr. William Corey West 1 4
The auditors of the Company were invited for the above meetings.
3.5 Audit committee’s recommendations
The Committee reviewed the financial results of the Company prepared in accordance with the Indian GAAP (including consolidated results) as at and for the quarters ended June 30, 2011, September 30, 2011 and December 31, 2011 as also for the year ended March 31, 2012 and recommended the same to the Board for adoption.
The Committee recommended to the Board the re-appointment of M/s. S. R. Batliboi & Associates, Chartered Accountants (Registration no. 101049W), as statutory auditors of the Company for the financial year 2012 – 2013.
The Internal Audit Group of the Company headed by Mr. Atul Kumar Gupta, Business Planning Vice President – Operations, is the Internal Auditor of the Company.
The Committee also reviewed Internal Auditors’ reports and related reports on actions taken, risk management policies, compliance with the clause 49 of the Listing Agreement, compliance and ethics tracker, etc. from time to time.
4. Compensation committee
4.1 Brief description of terms of reference
The scope of Compensation Committee is to determine the compensation of the Directors and any profit linked bonus policies of the Company. The Compensation Committee also approves, allocates and administers the Employee Stock Option Plans – ESOP 2002 Scheme, ESOP 2010 Scheme and ESOP 2011 Scheme, reviews performance appraisal criteria and sets norms for ESOP allocations.
4.2 The Composition of the Committee
The Composition of Compensation Committee as on March 31, 2012 was as follows:
Name of the Member
Mr. William T Comfort, Jr. Chairman, Non-Executive, Independent DirectorMr. Frank Brienzi Member, Non-Executive, Non-Independent DirectorMr. Y M Kale Member, Non-Executive, Independent Director

23
4.3 Meeting and attendance
During the year, two meetings of the Committee were held on August 18, 2011 and January 25, 2012.
Name of the Member Number of meetings attendedIn person
Mr. William T Comfort, Jr. 2Mr. Frank Brienzi 1Mr. Y M Kale 2
4.4 Compensation policy
The Compensation Committee determines and recommends to the Board the compensation payable to the Directors. The limit for the commission to be paid to the Board members and the remuneration payable to the Managing Director and CEO of the Company are approved by the Members of the Company. The annual compensation of the Non-Executive Directors is approved by the Compensation Committee, within the parameters set by the Members of the Company.
The criteria for payment of commission to the non-executive directors include a base commission plus incremental commission depending on the number and type of committees where they are Members or Chairpersons.
The Committee also has the mandate to review and recommend compensation payable to the Senior Executives of the Company. It also sets norms for ESOP allocation.
4.5 Details of remuneration paid to the Directors during the financial year 2011 – 2012 are as follows:
(Amounts in ` thousands, except number of ESOPs)Name of the Director Options granted
under ESOPs during the year
Commission paid
Salary Contribution to Provident Fund and other funds
Total Amount paid
Mr. William T Comfort Jr. – – – – –Mr. Chaitanya Kamat 30,000 – 27,795 1,617 29,412Mr. Derek H Williams – – – – –Ms. Dorian Daley – – – – –Mr. Frank Brienzi – – – – –Mr. Robert K Weiler – – – – –Mr. S Venkatachalam 10,000 1,600 – – 1,600Mr. William Corey West – – – – –Mr. Y M Kale – 1,800 – – 1,800TOTAL 40,000 3,400 27,795 1,617 32,812
The Company accrues for gratuity benefit, compensated absences and bonus for all employees as a whole. It is not possible to ascertain the provision for individual director and hence the same has not been disclosed above. The Company discloses such benefits on cash basis.
During the year, the Compensation Committee granted 30,000 options to Mr. Chaitanya Kamat, Managing Director & CEO and 10,000 options to Mr. S Venkatachalam, Director under the ESOP 2011 Scheme at an exercise price of ` 1,929.95.
The managerial remuneration paid to Mr. Chaitanya Kamat was within the limits envisaged in the Companies Act, 1956. Mr. Y M Kale and Mr. S Venkatachalam, Non-Executive, Independent Directors of the Company were paid remuneration by way of commission as approved by the Members of the Company, not exceeding 1% of the net profits of the Company in any one financial year.
There was no other remuneration paid to the Directors during the financial year 2011 – 2012 except as stated above.
The Board adopted a new “ESOP 2011 Scheme”, which covered 5,100,000 options under it. Under this Scheme, the Compensation Committee granted 640,500 options to the eligible employees including Directors of the Company and its subsidiaries as under:
Date of Grant No. of Options granted Exercise price (`)
December 1, 2011 40,000 2,031.75December 20, 2011 600,500 1,929.95

Oracle Financial Services Software – Annual Report 2011-2012
The terms of Employee Stock Options granted to the Directors are given below:
Name of the Director Scheme Options outstanding
as at April 1, 2011
Options exercised
during the year
Options outstanding as at March
31, 2012
Exercise price (`)
Expiry Date
Mr. William T Comfort Jr. – – – – – –Mr. Chaitanya Kamat ESOP 2002 60,000 Nil 60,000 2,333.45 October 24, 2020
ESOP 2011 – Nil 30,000 1,929.95 December 19, 2021Mr. Derek H Williams – – – – – –Ms. Dorian Daley – – – – – –Mr. Frank Brienzi – – – – – –Mr. Robert K Weiler – – – – – –Mr. S Venkatachalam ESOP 2011 – Nil 10,000 1,929.95 December 19, 2021Mr. William Corey West – – – – – –Mr. Y M Kale* – – – – – –
* all the options granted under the ESOP 2002 Scheme at an exercise price of ` 418.92 have been exercised before March 31, 2011.
The above options were issued at prevailing market price of shares on the respective dates of grant. The options vest over a period of 5 years from the date of grant and are subject to continued employment/directorship with the Company.
As on March 31, 2012, none of the Directors of the Company hold any equity shares, except Mr. S Venkatachalam, who holds 1,000 equity shares of the Company.
5. Shareholders’ Grievances Committee
5.1 Composition of the Committee
The composition of Shareholders’ Grievances Committee as on March 31, 2012 was as follows:
Name of the Member
Mr. S Venkatachalam Chairman, Non-Executive, Independent DirectorMr. Makarand Padalkar Member, Chief Financial Officer
5.2 Scope of Shareholders’ Grievances Committee’s activities
The scope of the Shareholders’ Grievances Committee is to review and address the grievances of the Members in respect of share transfers, transmission, dematerialization and rematerialization of shares and other share related activities.
During the year, two meetings of the Committee were held on August 2, 2011 and October 25, 2011.
The Member’s attendance at the Committee Meetings was as given below:
Name of the Member Number of meetings attendedIn person
Mr. S Venkatachalam 2Mr. Makarand Padalkar 2
6. Transfer Committee
6.1 Composition of the Committee
The composition of Transfer Committee as on March 31, 2012 was as follows:
Name of the Member
Mr. S Venkatachalam Chairman, Non-Executive, Independent DirectorMr. Makarand Padalkar Member, Chief Financial Officer

25
6.2 Scope of Transfer Committee
The scope of Transfer Committee is to consider and approve requests for transfer, transmission, rematerialization of shares and other investor related matters.
During the year, three meetings of the Committee were held on May 23, 2011, October 25, 2011 and January 25, 2012.
The Member’s attendance at the Committee Meetings was as given below:
Name of the Member Number of meetings attendedIn person
Mr. S Venkatachalam 3Mr. Makarand Padalkar 3
7. ESOP Allotment Committee
7.1 Composition of the Committee
The composition of ESOP Allotment Committee as on March 31, 2012 was as follows:
Name of the Member
Mr. Y M Kale Chairman, Non-Executive, Independent DirectorMr. Chaitanya Kamat Member, Managing Director & Chief Executive OfficerMr. S Venkatachalam Member, Non-Executive, Independent DirectorMr. Makarand Padalkar Member, Chief Financial Officer
7.2 Scope of ESOP Allotment Committee
The scope of ESOP Allotment Committee is to consider and approve requests for allotment of shares on exercise of stock options by eligible employees.
During the year, nine meetings of the Committee were held on the following dates:
April 19, 2011, May 10, 2011, June 27, 2011, July 26, 2011, October 11, 2011, December 14, 2011, January 12, 2012, February 15, 2012 and March 28, 2012.
The Member’s attendance at the Committee Meetings was as given below:
Name of the Member Number of meetings attendedIn person On Phone
Mr. Y M Kale 9 –Mr. Chaitanya Kamat 1 2 3Mr. S Venkatachalam 1 9 –Mr. Makarand Padalkar 9 –
1 The Board vide Circular Resolution dated April 6, 2011, appointed Mr. Chaitanya Kamat and Mr. S Venkatachalam as Members of the Committee.
8. Company Secretary and Compliance Officer
Company Secretary and Compliance Officer Mr. Hoshi D. BhagwagarAddress Oracle Financial Services Software Limited
Oracle ParkOff Western Express HighwayGoregaon (East), Mumbai 400063
Tel + 91-22-6718 4493Fax + 91-22-6718 4604e-mail [email protected]

Oracle Financial Services Software – Annual Report 2011-2012
9. Details of shareholders’ complaints received, resolved and outstanding during the financial year 2011 – 2012
Particulars No. of Complaints
Complaints outstanding on April 1, 2011 2Complaints received during the financial year ended March 31, 2012 39Complaints resolved during the financial year ended March 31, 2012 40Complaints outstanding on March 31, 2012 1
Number of pending share transfers as on March 31, 2012 – Nil.
10. General body meetings
10.1 Location, date and time where last three Annual General Meetings were held:
Financial Year Venue Day Date Time
2010 – 2011 The Leela Kempinski Thursday August 18, 2011 3.00 p.m.Sahar, Andheri (East), Mumbai 400059
2009 – 2010 The Leela Kempinski Wednesday August 25, 2010 3.00 p.m.Sahar, Andheri (East), Mumbai 400059
2008 – 2009 The Leela Kempinski Tuesday August 25, 2009 3.00 p.m.Sahar, Andheri (East), Mumbai 400059
10.2 The details of Special Resolutions passed in AGMs during the last three years are given below:
Financial Year Day, Date & Time Venue Gist of Special Resolution Passed
2010 – 2011 Thursday, August 18, 2011 at 3.00 p.m.
The Leela Kempinski Sahar, Andheri (East) Mumbai 400059
Payment of Commission to Directors of the Company (excluding the Managing Director and Whole-time Directors), not exceeding in the aggregate one per cent per annum of the net profits of the Company, which shall be calculated in accordance with the provisions of Sections 198, 349 and 350 of the Companies Act, 1956; for a further period of five years from April 1, 2012 to March 31, 2017.
Authority to grant stock option to the present and future employees and Directors (whole-time or otherwise) of the Company, such number of options as the Board may decide which could give rise to equity shares of face value of ` 5/- each of the Company, not exceeding 12.5% of the issued and paid-up share capital of the Company at any given time.
Authority to grant stock option to the present and future employees and Directors (whole-time or otherwise) of the Company’s present and future subsidiaries, such number of options as the Board may decide which could give rise to equity shares of face value of ` 5/- each of the Company, not exceeding the aforesaid limit of 12.5% of the issued and paid-up share capital of the Company at any given time.
2009 – 2010 Wednesday, August 25, 2010 at 3.00 p.m.
The Leela Kempinski Sahar, Andheri (East) Mumbai 400059
No special resolution was passed.
2008 – 2009 Tuesday, August 25, 2009 at 3.00 p.m.
The Leela Kempinski Sahar, Andheri (East) Mumbai 400059
No special resolution was passed.
27
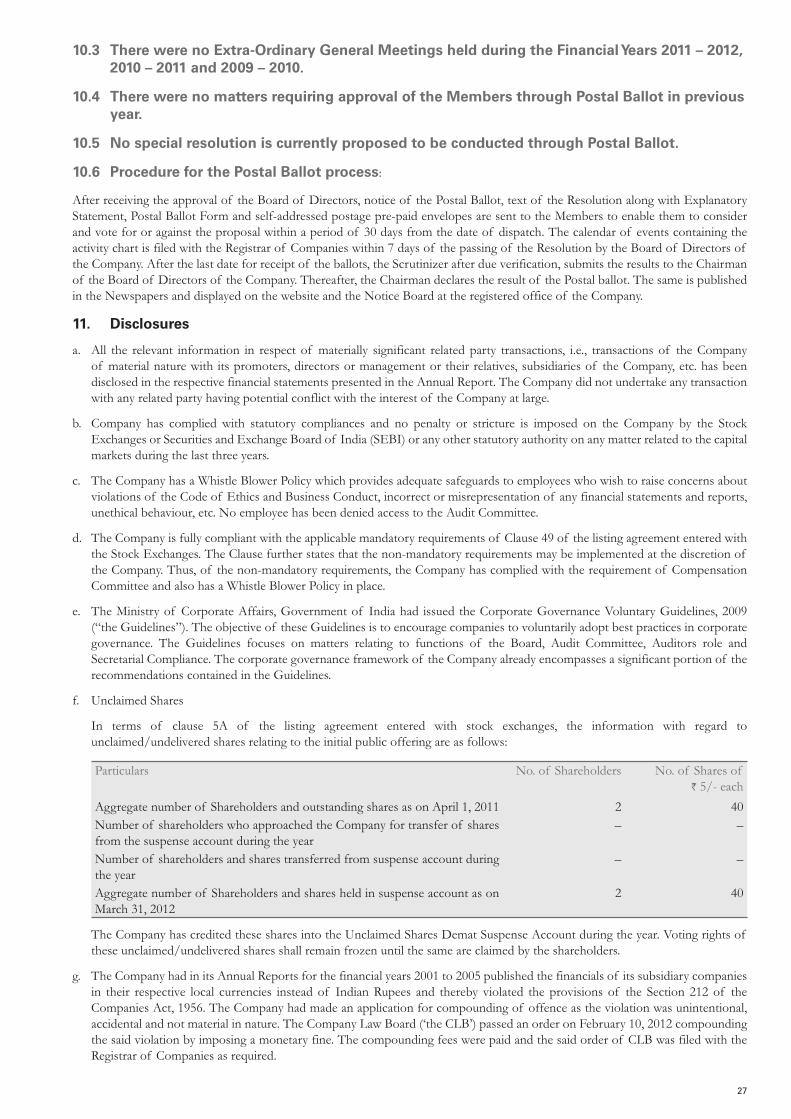
10.3 There were no Extra-Ordinary General Meetings held during the Financial Years 2011 – 2012, 2010 – 2011 and 2009 – 2010.
10.4 There were no matters requiring approval of the Members through Postal Ballot in previous year.
10.5 No special resolution is currently proposed to be conducted through Postal Ballot.
10.6 Procedure for the Postal Ballot process:
After receiving the approval of the Board of Directors, notice of the Postal Ballot, text of the Resolution along with Explanatory Statement, Postal Ballot Form and self-addressed postage pre-paid envelopes are sent to the Members to enable them to consider and vote for or against the proposal within a period of 30 days from the date of dispatch. The calendar of events containing the activity chart is filed with the Registrar of Companies within 7 days of the passing of the Resolution by the Board of Directors of the Company. After the last date for receipt of the ballots, the Scrutinizer after due verification, submits the results to the Chairman of the Board of Directors of the Company. Thereafter, the Chairman declares the result of the Postal ballot. The same is published in the Newspapers and displayed on the website and the Notice Board at the registered office of the Company.
11. Disclosures
a. All the relevant information in respect of materially significant related party transactions, i.e., transactions of the Company of material nature with its promoters, directors or management or their relatives, subsidiaries of the Company, etc. has been disclosed in the respective financial statements presented in the Annual Report. The Company did not undertake any transaction with any related party having potential conflict with the interest of the Company at large.
b. Company has complied with statutory compliances and no penalty or stricture is imposed on the Company by the Stock Exchanges or Securities and Exchange Board of India (SEBI) or any other statutory authority on any matter related to the capital markets during the last three years.
c. The Company has a Whistle Blower Policy which provides adequate safeguards to employees who wish to raise concerns about violations of the Code of Ethics and Business Conduct, incorrect or misrepresentation of any financial statements and reports, unethical behaviour, etc. No employee has been denied access to the Audit Committee.
d. The Company is fully compliant with the applicable mandatory requirements of Clause 49 of the listing agreement entered with the Stock Exchanges. The Clause further states that the non-mandatory requirements may be implemented at the discretion of the Company. Thus, of the non-mandatory requirements, the Company has complied with the requirement of Compensation Committee and also has a Whistle Blower Policy in place.
e. The Ministry of Corporate Affairs, Government of India had issued the Corporate Governance Voluntary Guidelines, 2009 (“the Guidelines”). The objective of these Guidelines is to encourage companies to voluntarily adopt best practices in corporate governance. The Guidelines focuses on matters relating to functions of the Board, Audit Committee, Auditors role and Secretarial Compliance. The corporate governance framework of the Company already encompasses a significant portion of the recommendations contained in the Guidelines.
f. Unclaimed Shares
In terms of clause 5A of the listing agreement entered with stock exchanges, the information with regard to unclaimed/undelivered shares relating to the initial public offering are as follows:
Particulars No. of Shareholders No. of Shares of ` 5/- each
Aggregate number of Shareholders and outstanding shares as on April 1, 2011 2 40Number of shareholders who approached the Company for transfer of shares from the suspense account during the year
– –
Number of shareholders and shares transferred from suspense account during the year
– –
Aggregate number of Shareholders and shares held in suspense account as on March 31, 2012
2 40
The Company has credited these shares into the Unclaimed Shares Demat Suspense Account during the year. Voting rights of these unclaimed/undelivered shares shall remain frozen until the same are claimed by the shareholders.
g. The Company had in its Annual Reports for the financial years 2001 to 2005 published the financials of its subsidiary companies in their respective local currencies instead of Indian Rupees and thereby violated the provisions of the Section 212 of the Companies Act, 1956. The Company had made an application for compounding of offence as the violation was unintentional, accidental and not material in nature. The Company Law Board (‘the CLB’) passed an order on February 10, 2012 compounding the said violation by imposing a monetary fine. The compounding fees were paid and the said order of CLB was filed with the Registrar of Companies as required.

Oracle Financial Services Software – Annual Report 2011-2012
h. The shareholders at their Annual General Meeting held on August 14, 2001 approved grant of ESOPs to the Employees/directors of the Company and its subsidiaries up to 7.5% of the issued and paid-up capital from time to time. The said limit was enhanced and approved up to 12.5% of the issued and paid-up capital from time to time, by the shareholders at their Annual General Meeting held on August 18, 2011. This extended limit is an all inclusive limit applicable for stock options granted in the past and in force and those that will be granted by the Company under this authorization.
12. Means of communication
During the Financial Year 2011 – 2012:
The quarterly, half yearly and annual results of the Company were published in widely circulated English and Marathi newspapers, such as The Economic Times, Business Standard, Maharashtra Times, Sakal and Navshakti as required.
Company’s quarterly financial results, press releases, annual reports and other relevant corporate documents are posted on the Company’s website www.oracle.com/financialservices.
Detailed Management’s discussion and analysis Reports covering Indian GAAP consolidated and unconsolidated financials have been included in this Annual Report.
The Company has uploaded the information relating to its financial results, shareholding pattern and report on corporate governance on website – www.corpfiling.co.in.
As per National Stock Exchange’s letter dated September 29, 2011, introducing Electronic filing of Corporate Governance and Shareholding pattern, through NSE Electronic Application Processing System (NEAPS), the Company has been uploading the information relating to its Shareholding pattern, Report on corporate governance, listing and trading applications on website – https://www.connect2nse.com/LISTING
The details of directors are also updated on Directors Database - www.directorsdatabase.com, a Corporate Governance initiative of the BSE Ltd.
As per the Circular issued by Ministry of Corporate Affairs, the Company has filed its Balance Sheet and Profit and Loss Account in eXtensible Business Reporting Language (XBRL), for the financial year ended March 31, 2011.
As a part of Green Initiative in Corporate Governance, the Ministry of Corporate Affairs vide its Circular No. 17/2011 dated
of the Companies Act, 1956, if the service of a document has been made through electronic mode, provided the company has obtained e-mail address for sending the notice/documents through e-mail by giving an advance opportunity to the members to register their e-mail address and changes therein from time to time with the Company. The Company has since been annually sending communications to the members of the Company seeking their preference for receiving corporate documents and has issued/dispatched Annual Reports accordingly.
13. General shareholder information
Annual General Meeting
Day and Date Friday, August 17, 2012Time 3.00 p.m.Venue The Leela Kempinski
Sahar, Andheri (East)Mumbai 400059
Financial Year April 1, 2011 to March 31, 2012
Dividend Payment Date Not Applicable
Date of Book Closure Saturday, August 11, 2012 to Friday, August 17, 2012(both days inclusive) for Annual General Meeting
Listing on Stock Exchanges at BSE Ltd. (BSE); andNational Stock Exchange of India Limited (NSE)
Stock CodeBSE Ltd. (BSE) 532466National Stock Exchange of India Limited (NSE) OFSS

29
Listing
The annual listing fees for the year 2012 – 2013 have been paid to BSE and NSE.
The Company has also paid Annual Custodial fees for the year 2012 – 2013 to National Securities Depository Limited and Central Depository Services (India) Limited on the basis of average number of beneficial accounts maintained by them during the previous financial year ended March 31, 2012.
Unclaimed dividend
Pursuant to Sections 205A, 205C and other applicable provisions, if any, of the Companies Act, 1956, any money transferred to the unpaid dividend account which remains unpaid or unclaimed for a period of 7 years from the date they become due for payment, is required to be transferred to the ‘Investor Education and Protection Fund’ set up by the Central Government. Accordingly, the amount of unclaimed dividend for the financial year ended March 31, 2005 will be transferred to the ‘Investor Education and Protection Fund’ in due course. Once the amount is so transferred, no claims shall lie against the aforesaid fund or the Company in respect of such dividend amount thereafter. The Members are requested to send to the Company their claims, if any, for the dividend for financial year 2004 – 2005 onwards immediately.
14. Market price data
Monthly high, low and volume of the shares of the Company traded on the stock exchanges from April 1, 2011 to March 31, 2012 are given below:
Month and Year BSE NSE
High (`) Low (`) Volume of Shares
High (`) Low (`) Volume of Shares
April 2011 2,165.00 1,962.00 129,849 2,168.50 1,843.70 831,234
May 2011 2,264.50 1,927.20 429,681 2,267.80 1,926.00 1,784,497
June 2011 2,375.00 2,066.65 210,783 2,376.00 2,067.10 1,219,753
July 2011 2,374.00 2,100.00 91,800 2,375.00 2,090.00 875,344
August 2011 2,188.00 1,699.00 145,549 2,195.00 1,699.00 1,078,432
September 2011 1,974.00 1,741.00 108,109 1,956.60 1,754.30 1,079,090
October 2011 2,209.90 1,850.00 92,122 2,213.00 1,850.00 1,105,524
November 2011 2,125.00 1,945.00 30,547 2,128.50 1,953.25 318,457
December 2011 2,100.00 1,738.40 59,266 2,125.30 1,781.80 425,936
January 2012 2,048.50 1,830.00 57,698 2,050.05 1,840.00 640,383
February 2012 2,715.00 1,980.40 879,846 2,714.00 1,981.00 4,166,142
March 2012 2,728.60 2,420.00 331,895 2,728.00 2,325.55 1,692,557

Oracle Financial Services Software – Annual Report 2011-2012
Relative movement chart
The chart below gives the comparison of your Company’s share price movement on NSE vis-à-vis the movement of S&P CNX NIFTY for the year 2011 – 2012.
The chart below gives the comparison of your Company’s share price movement on NSE vis-à-vis the movement of S&P CNX NIFTY since the listing of the share on NSE.

31
15. Registrars and Transfer Agents
Link Intime India Private Limited (formerly Intime Spectrum Registry Limited) is the Registrars and Transfer Agents of the Company (“the Registrars”) and their contact details are:
Name Link Intime India Private Limited
Address C-13, Pannalal Silk Mills Compound, L.B.S. Marg, Bhandup (West)Mumbai 400078
Tel +91-22-2594 6970
Fax +91-22-2594 6969
Contact person Mr. Dnyanesh Gharote, Asst. Vice President - Corporate Registry
E-mail [email protected]
16. Physical share certificate transfer system
The Registrars, on receipt of transfer deed along with share certificate(s) scrutinizes the same and verifies signature(s) of transferor(s) on the transfer deed with specimen signature(s) registered with the Company. A list of such transfers is prepared and checked thoroughly and a transfer register is prepared accordingly. The transfer register is placed before the Transfer Committee Meeting for approval, which meets as and when required.
During the last financial year, there were 3 requests received for transfer of 4,800 shares in physical mode.
Reconciliation of Share Capital Audit
A qualified Practicing Chartered Accountant has carried out reconciliation of Share Capital Audit for every quarter to reconcile the share capital held with depositories and in physical form with the issued/listed capital. The audit confirms that the total issued/paid-up/listed share capital is in agreement with the aggregate total number of shares in physical form and the total number of dematerialized shares held with NSDL and CDSL.
17. Distribution of shareholding as on March 31, 2012
Paid-up share capital (in `)
Number of Shareholders
% to total shareholders
No. of shares Paid-up value (Face value ` 5/- each)
% to Total no. of shares
Up to 2,500 15,923 90.77 697,124 3,485,620 0.83
2,501 – 5,000 417 2.38 323,208 1,616,040 0.39
5,001 – 10,000 344 1.96 520,745 2,603,725 0.62
10,001 – 20,000 314 1.79 941,306 4,706,530 1.12
20,001 – 30,000 125 0.71 620,145 3,100,725 0.74
30,001 – 40,000 97 0.55 675,384 3,376,920 0.80
40,001 – 50,000 52 0.30 481,182 2,405,910 0.57
50,001 – 100,000 130 0.74 1,813,222 9,066,110 2.16
100,001 & Above 141 0.80 77,901,441 389,507,205 92.77
Total 17,543 100.00 83,973,757 419,868,785 100.00

Oracle Financial Services Software – Annual Report 2011-2012
18. Shareholding pattern as on March 31, 2012
Category of shareholders Number of shares %
Promoters: Oracle Global (Mauritius) Limited 67,481,698 80.36Mutual Funds/UTI 3,417,568 4.07Financial Institutions/Banks 176,214 0.21Insurance Companies – –Foreign Institutional Investors 3,132,497 3.73Bodies Corporate 544,343 0.65Individuals- i. Holding nominal share capital up to ` 1 lakh 4,211,737 5.01ii. Holding nominal share capital in excess of ` 1 lakh 1,858,219 2.21Clearing Member 32,684 0.04Market Maker 6,043 0.01Foreign Nationals – –NRI (Repatriate) 797,014 0.95NRI (Non-Repatriate) 982,059 1.17Overseas Corporate Bodies 800 0.00Directors 1,000 0.00Trust 185,492 0.22HUF 14,405 0.02Foreign Mutual Fund 1,131,984 1.35Total 83,973,757 100.00
During the financial year 2011 – 2012:
1. The Company issued and allotted 78,955 equity shares to eligible employees who exercised their ESOPs during the year.2. The Company has not issued any ADR/GDR/Warrants/other convertible instruments except ESOPs.3. The promoters have not pledged any of the shares held in the Company.
19. Dematerialization of shares and liquidity
The shares of the Company are tradable under compulsory demat mode. Under the Depository System, the International Securities Identification Number (ISIN) allotted to the Company’s shares is INE881D01027.
As on March 31, 2012, 98.96% of the shares of the Company were in electronic form and 99.32% of the shareholders held shares in electronic form.
20. Address for correspondence
The Company SecretaryOracle Financial Services Software LimitedOracle Park, Off Western Express HighwayGoregaon (East)Mumbai 400063 Maharashtra, IndiaTel +91-22-6718 2822 Fax +91-22-6718 4604e-mail: [email protected] website: www.oracle.com/financialservices
The details of other office addresses have been mentioned in the corporate information section of the annual report.

33
Annexure to Directors’ report
ToThe Board of DirectorsOracle Financial Services Software LimitedMumbai
This is to certify that:
(a) We have reviewed financial statements and the cash flow statement of Oracle Financial Services Software Limited (“the Company”) for the financial year ended March 31, 2012 and that to the best of our knowledge and belief:
(i) These statements do not contain any materially untrue statement/figures or omit any material fact or contain statements/figures that might be misleading;
(ii) These statements together present a true and fair view of the Company’s affairs and are in compliance with existing accounting standards, applicable laws and regulations.
(b) There are, to the best of our knowledge and belief, no transactions entered into by the Company during the financial year ended March 31, 2012 which are fraudulent, illegal or violative of the Company’s code of conduct.
(c) We accept responsibility for establishing and maintaining internal controls for financial reporting and that we have evaluated the effectiveness of the internal control systems of the Company pertaining to financial reporting and we have disclosed to the auditors and the Audit Committee, deficiencies in the design or operation of such internal controls, if any, of which we are aware and the steps we have taken or propose to take to rectify these deficiencies.
(d) We have indicated to the auditors and the Audit Committee:
(i) Significant changes in internal control over financial reporting during the financial year ended March 31, 2012, if any;
(ii) Significant changes in accounting policies during the financial year ended March 31, 2012, if any; and that the same have been disclosed in the notes to the financial statements; and
(iii) Instances of significant fraud of which we have become aware and the involvement therein, if any, of the management or an employee having a significant role in the Company’s internal control system over financial reporting.
(e) We further declare that all Board members and Senior Management Personnel have affirmed compliance with Code of Ethics and Business Conduct for the financial year ended March 31, 2012.
For Oracle Financial Services Software Limited
Chaitanya Kamat Makarand Padalkar Managing Director and CEO Chief Financial Officer
May 11, 2012

Oracle Financial Services Software – Annual Report 2011-2012
To The Members of Oracle Financial Services Software Limited
We have examined the compliance of conditions of corporate governance by Oracle Financial Services Software Limited (the ‘Company’), for the year ended on March 31, 2012, as stipulated in clause 49 of the Listing Agreement of the said Company with stock exchanges.
The compliance of conditions of corporate governance is the responsibility of the management. Our examination was limited to procedures and implementation thereof, adopted by the Company for ensuring the compliance of the conditions of the Corporate Governance. It is neither an audit nor an expression of opinion on the financial statements of the Company.
In our opinion and to the best of our information and according to the explanations given to us, we certify that the Company has complied with the conditions of Corporate Governance as stipulated in the above mentioned Listing Agreement.
We further state that such compliance is neither an assurance as to the future viability of the Company nor the efficiency or effectiveness with which the management has conducted the affairs of the Company.
For S. R. Batliboi & Associates Firm registration number: 101049WChartered Accountants
per Amit MajmudarPartner Membership No.: 36656
Mumbai, IndiaJuly 10, 2012
Auditors’ certificate

35
Management’s discussion and analysis of financial condition and results of operations
Information technology in the financial services industry
Over the last few years, changes in the landscape in which financial institutions operate have been far more dramatic in comparison with those that occurred over the last fifty years. While evolving technology has played a role, rapid changes in the customer expectations has in fact been the chief catalyst in this evolution. The global financial crisis and associated economic slowdown has directly affected customers’ perception of these institutions. Bank customers after the crisis want their service providers to provide value for money, enhance quality of service and also expect the backing of a strong brand. Financial institutions face two major challenges. They must meet increased regulatory and compliance demands. If financial institutions want to appeal to new customers and build loyalty with existing customers, their offering also must be more customer focused and innovative.
Also, to deal with cost and margin pressures, commercial banks continue to focus on transformation of their business models to help identify cost saving opportunities, such as eliminating redundancies and streamlining business processes. Financial institutions must strive to break down silos to make it easier for employees to efficiently collaborate and increase productivity across the enterprise. Besides reducing costs, financial institutions strive to gain competitive advantage by enhancing their reputation and “owning” the customer thus creating greater institutional equity.
The profile of customers has changed significantly and where they are always looking for more, whether it’s a new payment mechanism, a new contact and channel, such as mobile banking and social media, or something else. The current generation of customers are demanding, and are more inclined towards self-serviced options. They are willing to be provider agnostic if their service requirements are met at the right price points. In fact, increased penetration of flexible electronic payments together with newer business models have emerged where financial institutions need to play a smaller but very important role. To meet the relentless demand for new products and services to fill customers’ shifting needs, commercial banks must focus on innovation, increasing speed-to-market for new product and service introductions, as well as improve delivery to ensure customer convenience and expand access to funds.
In the wake of the financial crisis, over the last few years central banks and regulatory bodies have been actively reviewed their frameworks for financial regulation and supervision, including that of liquidity risk. Banks are looking for solutions in this space to increase their agility and flexibility so as to adapt themselves to this dynamic framework and the changing reporting requirements of regulators. In addition, not only are the demands for regulatory reporting and compliance getting more stringent, it is affecting the way the banks do business. This regulatory and government intervention is changing the market structure and driving banks to seek new avenues for revenue.
Tools banks have used in the past to differentiate themselves – physical presence, low prices and cosmetic innovation – are quickly losing their ability to provide an edge. Banks can no longer reduce prices in a competitive manner due to increased competition, new regulations, and heightened capital standards, all of which are putting banking margins under enormous pressure. Banks thus need to deliver more efficient, customer-focused and innovative offerings than ever before to reconnect with their customers. Therefore, besides reducing costs, financial institutions strive to gain competitive advantage by enhancing their reputation and “owning” the customer thus creating greater institutional resilience.
Business overview
Oracle Financial Services Software Limited, majority owned by Oracle, is a world leader in providing IT solutions to the financial services industry. With its experience of delivering value based IT solutions to global financial institutions, Oracle Financial Services Software understands the specific challenges that financial institutions face: the need for building customer intimacy and competitive advantage through cost-effective solutions while, simultaneously, adhering to the stringent demands of a dynamic regulatory environment.
Our mission is to enable financial institutions to excel through the effective use of information technology. We offer financial institutions the world’s most comprehensive and contemporary banking applications and a technology footprint that addresses their complex IT and business requirements.
Together with Oracle, we offer a comprehensive suite of offerings encompassing retail, corporate, and investment banking, funds, cash management, trade, treasury, payments, lending, private wealth management, asset management, compliance, enterprise risk and business analytics, among others. With a process-driven approach for service-oriented architecture (SOA) deployments, we offer banks the combined benefits of interoperability, extensibility, and standardization. We also offer best-of-breed functionality for financial institutions that need to operate flexibly and competitively and respond rapidly to market dynamics in a fiercely challenging business environment. Oracle Financial Services Software has serviced over 1,000 customers in more than 135 countries through its portfolio of products and services.
We have two major business segments - the products business (comprising product licensing, consulting and support) and consulting services (comprising IT application and technology services). We also have a smaller business segment that offers business process outsourcing services to financial institutions.

Oracle Financial Services Software – Annual Report 2011-2012
These segments are described in detail below:
Products
Oracle FLEXCUBE is a complete banking product suite for consumer, corporate, investment, private wealth management, mobile and internet banking, consumer lending, asset management and investor servicing, including payments. Oracle FLEXCUBE enables banks to standardize operations across multiple countries, transform their local operations as well as address niche business models like direct banking, Islamic banking and mobile banking. Financial institutions use Oracle FLEXCUBE to respond faster to market dynamics, define and track processes, while ensuring compliance.
Oracle FLEXCUBE release 12 enables banks to meet the demands of the new age customer by delivering a portfolio-driven customer relationship using a combination of enhanced self-service and assisted support. The new version includes features that enable banks to deliver more personalized and convenient service to customers across all channels. The knowledge worker in the bank is enabled across channels with advisory tools with intelligence giving enterprise-wide 360-degree customer view, an in-built interaction framework to drive user behaviour. They are also assisted in aligning to the branch and personal goals through role-based dashboards with alerts and reminders.
Oracle FLEXCUBE release 12 offers a harmonized infrastructure and open development tools that allows more flexible deployment options and upgrade paths. Oracle FLEXCUBE release 12 gives financial institutions the power to redefine the banking experience and deliver a ‘personal banker’ experience to customers. It gives bankers the intelligence needed to truly understand customers and their interaction with the institution and the flexibility to deliver a highly responsive, personalized experience and robust-transaction capabilities regardless of the customer’s location.
Oracle FLEXCUBE Enterprise Limits and Collateral Management offers a single source for managing exposure across a business portfolio. It enables centralized collateral management, limits definition, tracking and exposure measurement for effective exposure management and resource utilization.
Oracle FLEXCUBE Private Banking is a comprehensive solution for private banking. It gives wealth managers a unified view and analyses of their customers’ wealth across asset classes, and provides the added benefits of performance tracking and improved customer relationship management. The application is a comprehensive, customer centric solution that offers a wealth management portal, a customer interaction tool, and portfolio management capabilities – all of which can be integrated with the existing core banking solutions used by a bank.
Oracle FLEXCUBE Investor Servicing is a process enabled transfer agency and investor servicing solution. It helps financial institutions manage the complete fund lifecycle and reduce operational costs through process automation across fund structures, intermediary hierarchies, and investors. The ISO 20022 and 15022 compliant Oracle FLEXCUBE Investor Servicing ensures enhanced STP processing through support for a wide variety of SWIFT NET 4.0 messages. With a comprehensive business rules engine for products – hedge funds, mutual funds and investment linked products, funds, and fee structures, Oracle FLEXCUBE Investor Servicing allows fund management companies to configure and launch new products rapidly.
Oracle Financial Services Leasing and Lending is a family of products provides functional coverage across lending, leasing, and mortgage lifecycles for consumer, commercial, syndicated, Islamic, and SME functions. The solution supports the complete business lifecycle across origination, servicing, and collections and enables financial institutions to provide better service and minimize delinquency rates through comprehensive and flexible processing of booking, disbursement, and payment. It centralizes origination functions, enabling them to improve customer experience and reduce transactional overheads.
Oracle Financial Services Analytical Applications are a complete and fully integrated portfolio of analytical solutions covering enterprise risk, performance management, regulatory compliance and customer insight. They are built upon a shared analytical infrastructure consisting of a unified financial services data model, shared analytical computations and the industry leading Oracle Business Intelligence platform.
The suite of applications contains comprehensive set of point solutions that can be integrated to give a holistic view across all analytical applications. Financial institutions need an integrated approach that combines a diverse set of compliance and risk solutions to help them address not only present regulatory needs, but also emerging and future risk and regulatory requirements. The framework is rules driven, and readily adapts to change. Unlike other hard coded solutions, Oracle Financial Services Analytical Applications provide both prebuilt rules and the capability to create and modify rules. This flexibility allows financial institutions to easily create custom rules for their own analytical requirements and to cost effectively address ever changing compliance regulations. Any rule can be viewed and audited for its underlying definition to enable supervisory oversight.
Services
Oracle Financial Services PrimeSourcing
Oracle Financial Services PrimeSourcing is the consulting arm of the Company. It offers end-to-end consulting services, providing comprehensive business and technology solutions that enable financial institutions to improve process efficiencies, optimize costs, meet risk and compliance requirements, define IT architecture, and manage the transformation process.
With a singular focus on Financial Services vertical, PrimeSourcing has proven domain expertise across Capital Markets, Private Banking, Global Wealth Management, Corporate Banking and Retail Banking.

37
The value based offerings from PrimeSourcing are designed to provide specialized application & technology services for Banking & Financial Services in areas such as Access Channels, Risk Governance & Compliance, Payments, Business Intelligence and product related surround services cutting across domains.
PrimeSourcing Consulting Services
PrimeSourcing offers end-to-end consulting services in the areas of Business & IT consulting and process improvement and transformation, Quality Consulting, SOA Strategy & Governance, IT Architecture Planning, Product Evaluation & Selection, IT Portfolio Assessment, program management, IT architecture and governance.
PrimeSourcing Application Services
PrimeSourcing provides comprehensive customized IT solutions for banking, securities and insurance those encompass the complete lifecycle of an IT application asset from conceptualization to creation and maintenance. This includes the expertise around specialized practice lines like payments, trade finance, business intelligence, CRM, Oracle Technology and Applications and testing; services include ADM Services, Testing, System Integration, implementation and Migration.
PrimeSourcing Technology Services
PrimeSourcing offers expertise in conceptualization, design, evaluation, implementation and management of IT infrastructure for financial institutions under two service lines. First line is of Technology Management Services, covering Data Management, Mainframe Services, Application Deployment, Monitoring & Management and Risk & Security Assessment. The second service line is of Remote Infrastructure Management where PrimeSourcing manages remotely monitors and supports customer’s applications and infrastructure providing them economies of scale, arbitrage benefits while keeping the best in class processes.
Oracle Business Process Outsourcing Services (BPO)
BPO offering excels in providing cost effective and high quality BPO services ranging from complex back-office work to contact centre services for the banking, capital markets, insurance and asset management domains. This comprehensive ecosystem of BPO services also draws upon software applications such as Oracle FLEXCUBE and is backed by a mature process and consulting framework.
BPO offering was selected in the Leadership Category for the ‘2010 The Global Outsourcing 100’. The Outsourcing Centre short listed it to be amongst 2010 Finalists for its Outsourcing Excellence Awards. The BPO offerings are ISO 9001 certified for quality management and ISO 27001 certified for information security management.
Corporate development
Mantas Singapore Pte. Ltd. and Mantas Limited, wholly owned subsidiaries of Mantas Inc. were dissolved with effect from March 1, 2012 and April 10, 2012, respectively.
SWOT analysis
Strengths:
– Acknowledged leadership in core banking, application services and Analytics Solutions (governance, risk and compliance, customer insight) and process outsourcing
– Superior quality and cost efficient, end to end service capability from business consulting to application development and deployment, IT management to Business Process Outsourcing
– Unmatched solutions portfolio with depth of offering in the retail, corporate and investment banking, funds, cash management, trade, treasury, payments, lending, private wealth management, asset management and business analytics
– Extensive global client base
– Deep domain expertise with proven track record
– Solutions built on best in class technology and architecture
– High quality manpower resources
– Strong R&D capability with strong balance sheet.
Weaknesses:
– Exposure to various economies
– Local resources in new markets.

Oracle Financial Services Software – Annual Report 2011-2012
Opportunities:
– Penetrate major markets like US, China, Brazil, Japan, North America, Russia, Latin America
– Develop strong global partner model, greatly expanding pipeline and delivery capabilities
– Provide integrated offerings on the Oracle technology and solution portfolio especially to tier-one financial institutions
– Increasing momentum in the acquisition of core banking systems by large and global financial institutions
– Cross-sell and up sell opportunities into global customer base.
Threats:
– Economic slow down
– Potential delays in decisions due to economic uncertainties
– Geo political factors
– Competition footprint in high growth geographies.
Outlook
The worldwide market for financial services is undergoing rapid transformation. Financial institutions in the advanced markets are at cross roads in planning decisions to replace their ageing technologies. Emerging markets are becoming increasingly significant sources of growth for firms in mature economies. New asset classes such as private equity and hedge funds have seen dramatic shifts in customer engagement and have altered the focus of capital markets. The payments space, a major source of revenues and profit for financial institutions, is being restructured, thus altering the fundamental dynamics of the banking industry.
Over the last 36 months there have been significant changes in the economic environment. Your Company views the current economic scenario as an opportunity to help financial institutions meet their emerging business needs. To sustain their growth and profitability, global financial institutions will need to excel in areas such as off shoring, taxation and financial reporting, internal controls and service and process innovation. Financial institutions are also reviewing their existing IT investments to ensure that they are attuned to changing customer preferences and aligned to the new business priorities. Core banking, risk management and compliance, investor servicing and internet & mobile banking are among the areas that continue to show significant potential. Financial institutions are innovating using available technologies to offer services to their customers on a ‘self service’ basis.
We see demand for core banking applications continuing as banks expand by buying the assets of other banks, establish presence in new countries or standardize applications across regions. Banks are looking at the centralization of banking services such as account opening and origination of credit to improve their service levels, increase productivity and gain greater control over processes that are subject to regulatory scrutiny.
Global regulators have re-emphasized the importance of stress testing in the measurement of liquidity and credit risk and in evaluating how banks would fare under different scenarios. As a result of these factors we have gained increasing traction at Tier 1 banks for our products. Banks have also exhibited renewed interest in aligning finance, risk and performance applications.
Oracle Financial Service Software is an acknowledged leader in the banking space and is committed to maintain its leadership position in financial services. Oracle Financial Service Software will continue to invest in expanding its banking footprint through its own internal R&D.
With a process driven approach based on service oriented architecture, your Company has the distinct advantage of offering banks the combined benefits of interoperability, extensibility and standardization. Together with Oracle we provide a complete banking footprint, spanning all major distribution, manufacturing and corporate administration functions.
Internal control systems and their adequacy
Oracle Financial Services Software group has in place adequate systems for internal control and documented procedures covering all financial and operating functions. These systems are designed to provide reasonable assurance with regard to maintaining proper accounting controls, monitoring economy and efficiency of operations, protecting assets from unauthorized use or losses, and ensuring reliability of financial and operational information. The group continuously strives to align all its processes and controls with global best practices.

39
Analysis of our consolidated financial results
The following discussion is based on our audited consolidated financial statements, which have been prepared in conformity with accounting principles generally accepted in India and complying in all material respects with the Accounting Standards notified by Companies (Accounting Standards) Rules, 2006 (as amended) and the relevant provisions of the Companies Act, 1956.
The consolidated financial statements are consolidated for Oracle Financial Services Software Group that includes Oracle Financial Services Software Limited (“the Company”), its subsidiaries and associate company (together referred to as “the Group” as described in Note 1 to the financial statements) as at March 31, 2012.
You should read the following discussion of our financial condition and results of operations together with the detailed consolidated Indian GAAP financial statements and the notes to those statements. Our fiscal year ends on March 31 of each year.
Our total revenues in fiscal 2012 were ` 31,466.8 million, representing an increase of 5% from ` 29,969.3 million in fiscal 2011. The profit for the year in fiscal 2012 was ` 9,092.7 million, as against ` 11,109.9 million in fiscal 2011. Our profit margin is at 29% and 37% for the fiscal years 2012 and 2011 respectively. We define profit margins for a particular period as the ratio of profit to total revenues from operations during such period.
Products business(Amounts in ` million)
Year endedMarch 31, 2012
Year ended March 31, 2011
Products revenues 22,822.8 19,965.4Operating expenses (13,078.2) (10,277.4)Income from operations 9,744.6 9,688.0Operating margin 43% 49%
Products revenues
As of March 31, 2012, our product revenues were ` 22,822.8 million, an increase of 14% from ` 19,965.4 million during the fiscal year ended March 31, 2011. Product revenues represented 72% and 67% of total revenues for fiscal years ended 2012 and 2011, respectively.
Our product revenues comprise license fees, professional fees for implementation and enhancement services and annual maintenance contract (Post Contract Support – PCS) fees for our products.
License fee
Our standard licensing arrangements for products provide the bank a right to use the product up to a limit on number of users or accounts or such other usage metric upon the payment of a license fee. The license fee is a function of a variety of quantitative and qualitative factors, including the number of copies sold, the number of users supported, the number and combination of the modules sold and the number of sites and geographical locations supported. The licenses are perpetual, non-exclusive, personal, non-transferable and royalty free.
Consulting fee
Along with licenses for our products, our customers can also optionally avail consulting services related to the implementation of products at their sites, integration with other systems or enhancements to address their specific requirements. The customer is typically charged a service fee on either a fixed price basis or a time and material basis based on the professional efforts incurred and associated out of pocket expenses.
Annual maintenance contract (PCS) fees
Customers typically sign an Annual Maintenance Contract with us under which, we provide technical support, maintenance, problem resolution and upgrades for the licensed products. These support agreements typically cover a period of 12 months.
The revenues generated from license fees and consulting services rendered by us depends on factors such as the number of new customers added, milestones achieved, implementation time, etc. Therefore, such revenues typically vary from year to year. The annual maintenance contracts generate steady revenues and would grow to the extent that new customers are entering a support agreement.
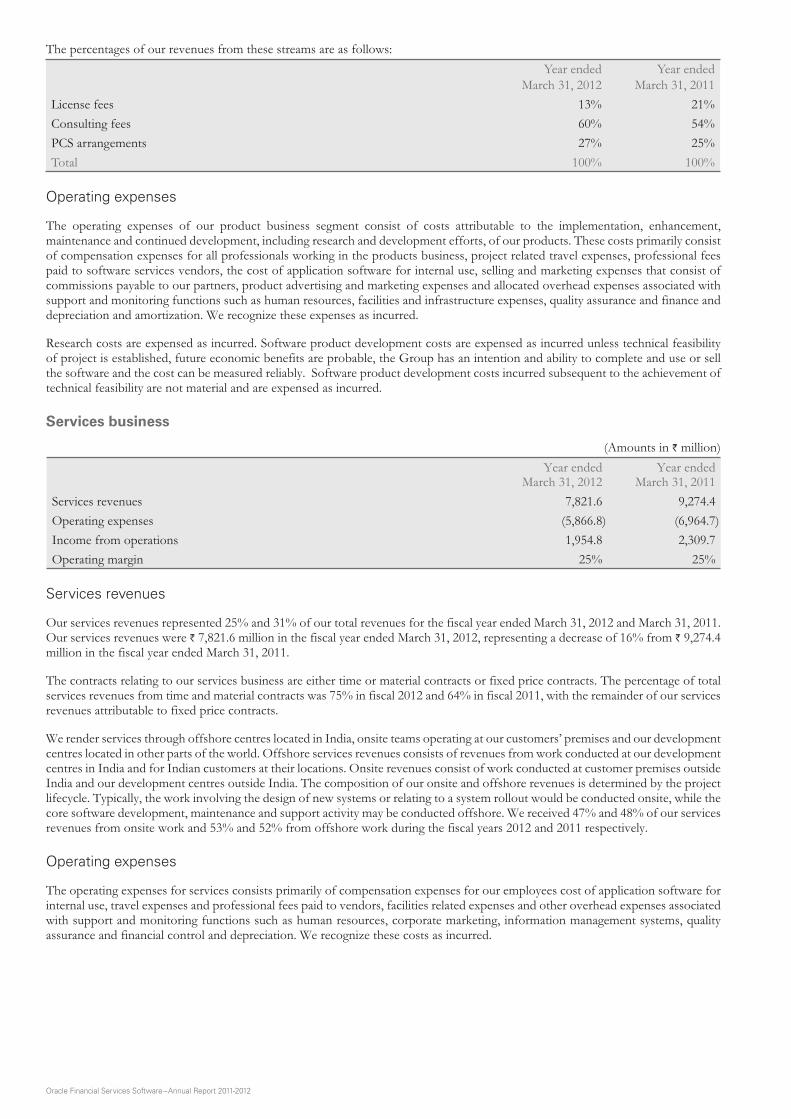
Oracle Financial Services Software – Annual Report 2011-2012
The percentages of our revenues from these streams are as follows:Year ended
March 31, 2012Year ended
March 31, 2011License fees 13% 21%Consulting fees 60% 54%PCS arrangements 27% 25%Total 100% 100%
Operating expenses
The operating expenses of our product business segment consist of costs attributable to the implementation, enhancement, maintenance and continued development, including research and development efforts, of our products. These costs primarily consist of compensation expenses for all professionals working in the products business, project related travel expenses, professional fees paid to software services vendors, the cost of application software for internal use, selling and marketing expenses that consist of commissions payable to our partners, product advertising and marketing expenses and allocated overhead expenses associated with support and monitoring functions such as human resources, facilities and infrastructure expenses, quality assurance and finance and depreciation and amortization. We recognize these expenses as incurred.
Research costs are expensed as incurred. Software product development costs are expensed as incurred unless technical feasibility of project is established, future economic benefits are probable, the Group has an intention and ability to complete and use or sell the software and the cost can be measured reliably. Software product development costs incurred subsequent to the achievement of technical feasibility are not material and are expensed as incurred.
Services business
(Amounts in ` million)Year ended
March 31, 2012Year ended
March 31, 2011Services revenues 7,821.6 9,274.4Operating expenses (5,866.8) (6,964.7)Income from operations 1,954.8 2,309.7Operating margin 25% 25%
Services revenues
Our services revenues represented 25% and 31% of our total revenues for the fiscal year ended March 31, 2012 and March 31, 2011. Our services revenues were ` 7,821.6 million in the fiscal year ended March 31, 2012, representing a decrease of 16% from ` 9,274.4 million in the fiscal year ended March 31, 2011.
The contracts relating to our services business are either time or material contracts or fixed price contracts. The percentage of total services revenues from time and material contracts was 75% in fiscal 2012 and 64% in fiscal 2011, with the remainder of our services revenues attributable to fixed price contracts.
We render services through offshore centres located in India, onsite teams operating at our customers’ premises and our development centres located in other parts of the world. Offshore services revenues consists of revenues from work conducted at our development centres in India and for Indian customers at their locations. Onsite revenues consist of work conducted at customer premises outside India and our development centres outside India. The composition of our onsite and offshore revenues is determined by the project lifecycle. Typically, the work involving the design of new systems or relating to a system rollout would be conducted onsite, while the core software development, maintenance and support activity may be conducted offshore. We received 47% and 48% of our services revenues from onsite work and 53% and 52% from offshore work during the fiscal years 2012 and 2011 respectively.
Operating expenses
The operating expenses for services consists primarily of compensation expenses for our employees cost of application software for internal use, travel expenses and professional fees paid to vendors, facilities related expenses and other overhead expenses associated with support and monitoring functions such as human resources, corporate marketing, information management systems, quality assurance and financial control and depreciation. We recognize these costs as incurred.

41
Business Process Outsourcing (BPO) services business
(Amounts in ` million)Year ended
March 31, 2012Year ended
March 31, 2011Revenues 822.4 729.5Operating Expenses (537.2) (496.8)Income from operations 285.2 232.7Operating margin 35% 32%
Business Process Outsourcing (BPO) services revenues
Our BPO services revenues represented 3% and 2% of our total revenues for the fiscal year ended March 31, 2012 and March 31, 2011. Our BPO services revenues were ` 822.4 million in the fiscal year ended March 31, 2012, an increase of 13% from ` 729.5 million in the fiscal year ended March 31, 2011.
Operating expenses
The operating expenses for BPO Services consist primarily of compensation expenses for our professionals, travel expenses, professional fees paid to vendors, facilities related expenses and other expenses. We recognize these costs as incurred.
Geographic breakup of revenues
Our overall revenues continue to be well diversified. The following table represents the percentage breakup of our revenues for our products and services business by region:
Year ended March 31, 2012 Year ended March 31, 2011Products Revenues
Services Revenues
Total Revenues
Products Revenues
Services Revenues
Total Revenues
USA 24% 61% 34% 19% 55% 31%Middle East, India and Africa 18% 4% 14% 20% 4% 15%Asia Pacific 33% 20% 30% 25% 24% 25%Europe 22% 14% 20% 32% 16% 26%Latin America and Caribbean 3% 1% 2% 4% 1% 3%Total 100% 100% 100% 100% 100% 100%
Customer concentration
Our operations and business depend on our relationships with a large number of customers. Our revenue from our top ten customers, as a percentage of our total revenues is at 36% for fiscal 2012 as against 35% for fiscal year 2011. The top ten customers in our services business contributed 59% of the total services revenues, and the top ten customers in our products business, contributed 34% of the total products revenues during fiscal 2012.
The percentage of total revenues during fiscal years 2012 and 2011 that we derived from our largest customer, largest five customers and largest ten customers is provided in the accompanying table. In the table, various affiliates of Citigroup are classified as separate customers and the last row sets forth the percentage of total revenues we earned from the various affiliates of Citigroup with respect to our products and services business individually and with respect to our business taken as a whole.
Products Revenues Services Revenues Total Revenues2012 2011 2012 2011 2012 2011
Largest customer 14% 10% 14% 12% 11% 9%Top 5 customers 24% 25% 39% 41% 25% 26%Top 10 customers 34% 32% 59% 59% 36% 35%Citigroup and its affiliates 10% 11% 50% 46% 21% 23%
Trade receivables
Trade receivables as of fiscal March 31, 2012 and 2011 were ` 8,972.1 million and ` 8,094.6 million respectively. Our days sales outstanding (which is the ratio of sundry debtors to total sales in a particular year multiplied by 365) for fiscal 2012 and 2011 were approximately 104 and 99 respectively. The Group periodically reviews its trade receivables outstanding as well as the ageing, quality of the trade receivables, customer relationship and the history of the client.

Oracle Financial Services Software – Annual Report 2011-2012
The following table represents the age profile of our trade receivables:
Period in days Year ended March 31, 2012
Year ended March 31, 2011
0-180 80% 96%More than 180 20% 4%Total 100% 100%
Foreign currency and treasury operations
A substantial portion of our revenues is generated in foreign currencies while a majority of our expenses are incurred in Indian Rupees (INR), with the remaining expenses are incurred in US Dollars (USD) and European currencies.
Our philosophy for treasury operations is conservative and we invest funds predominantly in time deposits with well-known and highly rated Indian and foreign banks. The Group has ensured adequate internal controls over asset management, including cash management operations, credit management and debt collection.
The Group also maintains funds mainly in USD, EUR, GBP, JPY and SGD bank accounts or in deposits based on comparative exchange rates, interest rates and currency requirements. The Group books forward covers from time to time in line with its treasury management philosophy.
Income taxes
Till March 31, 2011, we partially benefited from tax holidays extended by the Government of India to software products and IT services exporters from specially designated software technology parks in India. As a result of these incentives, our operations were subject to relatively lower tax liabilities in India. These tax incentives included a 10–year tax holiday from Indian corporate income taxes for the operation of seven of our Indian facilities. As a result, a substantial portion of our pre-tax income was not subject to tax in recent years.
The Finance Act, 2000, restricts the ten-year tax holiday available from the fiscal year in which the undertaking begins to manufacture or produce, or until fiscal 2011 (as extended in Finance Act, 2009), whichever is earlier. Thus, for our STPI units, this benefit has expired on 31 March 2011. Income taxes also include foreign taxes representing income taxes payable overseas by us in various countries.
Comparison of fiscal 2012 with fiscal 2011
Revenues from operations
Our total revenues in the fiscal year ended March 31, 2012 were ` 31,466.8 million, an increase of 5% over our total revenues of` 29,969.3 million in the fiscal year ended March 31, 2011. The increase in revenues was primarily attributable to an increase in the revenues from our products business.
Products revenues
Our products revenues in the fiscal year ended March 31, 2012 were ` 22,822.8 million, an increase of 14% over our products revenues of ` 19,965.4 million in the fiscal year ended March 31, 2011 on the strength of large customer wins in USA and ASPAC. The revenues from license fees comprised 13% of the revenues, implementation and customization fees comprised 60% and Annual Maintenance Contracts comprised 27% of the revenues for the fiscal 2012.
Services revenues
Our services revenues represented 25% and 31% of our total revenues for the fiscal year ended March 31, 2012 and March 31, 2011. Our services revenues were ` 7,821.6 million in the fiscal year ended March 31, 2012, a decrease of 16% from ` 9,274.4 million in the fiscal year ended March 31, 2011. Revenues from time and material contracts comprised 75% of the services revenues and fixed price contracts comprised 25% for the fiscal 2012.
Business Process Outsourcing (BPO) revenues
Our revenues from BPO services in the fiscal year ended March 31, 2012 were ` 822.4 million, increase of 13% over our revenues from BPO services of ` 729.5 million in the fiscal year ended March 31, 2011.

43
Other income, net
Our other income in the fiscal year ended March 31, 2012, was ` 4,217.5 million, as compared to ` 1,668.3 million in the fiscal year ended March 31, 2011. The overall increase of ` 2,549.2 million in other income was primarily attributable to higher interest income of ` 1,345.6 million and net foreign exchange gain of ` 1,217.3 million accruing mainly due to realization of Trade Receivables at better foreign currency exchange rates.
Expenses
Employee costs
Our employee costs increased by 15% to ` 15,186.9 million in the fiscal year ended March 31, 2012 from ` 13,152.6 million in the fiscal year ended March 31, 2011. Employee costs relate to salaries and bonuses paid to employees.
Travel related expenses (net of recoveries)
Our travel related expenditure increased marginally by 1% to ` 1,445.1 million in the fiscal year ended March 31, 2012 from ` 1,431.1 million in the fiscal year ended March 31, 2011. The overall travel expenses represents 5% of revenue from operations for both the fiscal year ended March 31, 2012 and March 31, 2011.
Professional fees
Our professional fees related expenditure increased by 13% to ` 2,005.0 million in the fiscal year ended March 31, 2012 from ` 1,767.4 million in the fiscal year ended March 31, 2011. The overall professional fees represents 6% of revenue from operations for both the fiscal year ended March 31, 2012 and March 31, 2011. Professional fees include services hired from external consultants for various projects.
Other expenses
Our other expenditure reduced by 25% to ̀ 1,718.6 million in the fiscal year ended March 31, 2012 from ̀ 2,276.3 million in the fiscal year ended March 31, 2011. The other expenses represent 5% and 8% of revenue from operations for the year ended March 31, 2012 and March 31, 2011 respectively. Other expenses primarily consist of various facilities costs, application software, communication and other miscellaneous expenses.
Depreciation and amortization
Our Depreciation and amortization charge for the year was ` 466.2 million and ` 408.2 million for the year ended March 31, 2012 and March 31, 2011 respectively representing 1% of revenues from operations for both the fiscal year ended March 31, 2012 and March 31, 2011.
Exceptional item
A customer had filed a lawsuit against the Company and one of its subsidiaries claiming damages of upwards of ` 5,784.2 million. In respect of this claim, the Company had provided ` 122.1 million in the year ended March 31, 2011. During the year ended March 31, 2012, the Company settled the said customer dispute for full release of all alleged claims and accordingly accounted the balance settlement amount, net of insurance claim, and disclosed the same as an exceptional item.
Income taxes
Our provision for income taxes in the fiscal year ended March 31, 2012 was ` 5,076.3 million, an increase of ` 3,706.2 million over our provision for income taxes of ` 1,370.1 million in the fiscal year ended March 31, 2011. Our effective tax rate was 36% in the fiscal year ended March 31, 2012 compared to 11% in the fiscal year ended March 31, 2011.
Profit for the year
As a result of the foregoing factors, net profit has reduced by 18% to ` 9,092.7 million in fiscal 2012 from ` 11,109.9 million in fiscal 2011. Our profit margin is 29% for the fiscal year 2012 as against 37% in the fiscal year 2011. We define profit margins for a particular period as the ratio of profit for the year to revenue from operations during such period.
Liquidity and capital resources
Our capital requirement relate primarily to financing the growth of our business. We have historically financed the majority of our working capital, capital expenditure and other requirements through our operating cash flow. During fiscal 2012 and 2011, we generated cash from operations of ` 7,714.1 million and ` 6,317.5 million respectively.
Oracle Financial Services Software is a zero debt company. We expect that our primary financing requirements in the future will be capital expenditure and working capital requirements in connection with the expansion of our business. We believe that the cash generated from operations will be sufficient to satisfy our currently foreseeable capital expenditure and working capital requirements.

Oracle Financial Services Software – Annual Report 2011-2012
Human capital
We recruit graduates from leading engineering and management institutions. We also hire functional experts from the banking industry. Our employee headcount at the end of the fiscal year ended March 2012 was 9,682 as compared to the employee headcount as on March 2011 at 9,652. The blend of functional knowledge and technical expertise, coupled with in-house training and real–life, experiences in working with financial institutions make our employees unique.
We enjoy cordial relationships with our employees and endeavour to give them an excellent, professionally rewarding and enriching work environment. We operate an effective performance management system, with a focus on employee development. This measures key result areas, competencies and training requirements ensuring all-round employee development.
Risks and concerns
Quantitative and Qualitative Disclosures about Market Risk
Our primary market risk exposures are due to the following:
– Foreign exchange rate fluctuations
– Fluctuations in interest rates.
As of March 31, 2012, we had Cash and Bank Balances of ` 39,475.9 million out of which ` 34,890.3 million was in interest–bearing bank deposits. Consequently, we face an exposure on account of fluctuation in interest rates. These funds were mainly invested in bank deposits of longer maturity (more than 90 days) to earn a higher rate of interest income.
A substantial portion of our revenues is generated in foreign currencies while a majority of our expenses are incurred in Indian Rupees and the balance in US Dollars and European currencies. Our functional currency for Indian operations and consolidated financials is the Indian Rupee. We expect that the majority of our revenues will continue to be generated in foreign currencies for the foreseeable future and a significant portion of our expenses, including personnel costs and capital and operating expenditure, to continue to be incurred in Indian Rupees.
In addition, we face normal business risks such as global competition and country risks pertaining to countries that we operate in.
Analysis of our unconsolidated results
The following discussion is based on our audited unconsolidated financial statements, which have been prepared in conformity with accounting principles generally accepted in India and complying in all material respects with the Accounting Standards notified by Companies (Accounting Standards) Rules, 2006 (as amended) and the relevant provisions of the Companies Act, 1956.
You should read the following discussion of our financial condition and results of operations together with the detailed unconsolidated Indian GAAP financial statements and the notes to those statements. Our fiscal year ends on March 31 of each year.
Our total revenues in fiscal 2012 were ` 26,058.5 million, representing an increase of 10% from ` 23,605.1 million in fiscal 2011. The net income in fiscal 2012 was ` 10,892.3 million, against ` 9,679.8 million in fiscal 2011. Our net income margin in fiscal 2012 is at 42% as against 41% in fiscal 2011. We define net income margins for a particular period as the ratio of profit for the year to revenue from operations during such period.
Products business
(Amounts in ` million)Year ended
March 31, 2012Year ended
March 31, 2011Product revenues 19,121.7 16,154.9Operating expenses (10,300.7) (7,537.2)Income from operations 8,821.0 8,617.7Operating margin 46% 53%
Products revenues
As of March 31, 2012, our product revenues were ` 19,121.7 million, an increase of 18% from `
respectively.
Our products revenues comprise license fees, professional fees for implementation and enhancement services and annual maintenance contract (Post Contract Support - PCS) fees for our products.
License fee
Our standard licensing arrangements for products provide the bank a right to use the product up to a limit on number of users or sites or such other usage metric upon the payment of a license fee. The license fee is a function of a variety of quantitative and qualitative factors, including the number of copies sold, the number of users supported, the number and combination of the

45
modules sold and the number of sites and geographical locations supported. The licenses are perpetual, non-exclusive, personal, non transferable and royalty free.
Consulting fee
Along with licenses for our products, our customers can also optionally avail consulting services related to the implementation
associated out of pocket expenses.
Annual maintenance contract (PCS) fees
Customers typically sign an Annual Maintenance Contract with us under which, we provide technical support, maintenance, problem resolution and upgrades for the licensed products. These support agreements typically cover a period of 12 months.
The revenues generated from license fees and consulting services rendered by us depend on factors such as the number of new customers added, milestones achieved, implementation time, etc. Therefore, such revenues typically vary from year to year. The annual maintenance contracts generate steady revenues and would grow to the extent that new customers are entering into a support agreement.
The percentages of our revenues from these streams are as follows:
Year ended March 31, 2012
Year ended March 31, 2011
License fees 12% 21%Consulting fees 61% 53%PCS arrangements 27% 26%Total 100% 100%
Operating expenses
The operating expenses of our product business segment consist of costs attributable to the implementation, enhancement, maintenance and continued development, including research and development efforts, of our products. These costs primarily consist of compensation expenses for all professionals working in the products business, project related travel expenses, professional fees paid to software services vendors, the cost of application software for internal use, selling and marketing expenses that consist of commissions payable to our partners, product advertising and marketing expenses and allocated overhead expenses associated with
depreciation and amortization. We recognize these expenses as incurred.
Research costs are expensed as incurred. Software product development costs are expensed as incurred unless technical feasibility
the software and the cost can be measured reliably. Software product development costs incurred subsequent to the achievement of technical feasibility are not material and are expensed as incurred.
Services business(Amounts in ` million)
Year ended March 31, 2012
Year ended March 31, 2011
Services revenues 6,936.8 7,450.2Operating expenses (5,248.6) (6,027.2)Income from operations 1,688.2 1,423.0Operating margin 24% 19%
Services revenues
Our services revenues were `
`
We render services through offshore centres located in India, onsite teams operating at our customers’ premises and our development centres located in other parts of the world. Offshore services revenues consists of revenues from work conducted at our development centres in India and for Indian customers at their locations. Onsite revenues consist of work conducted at customer premises outside
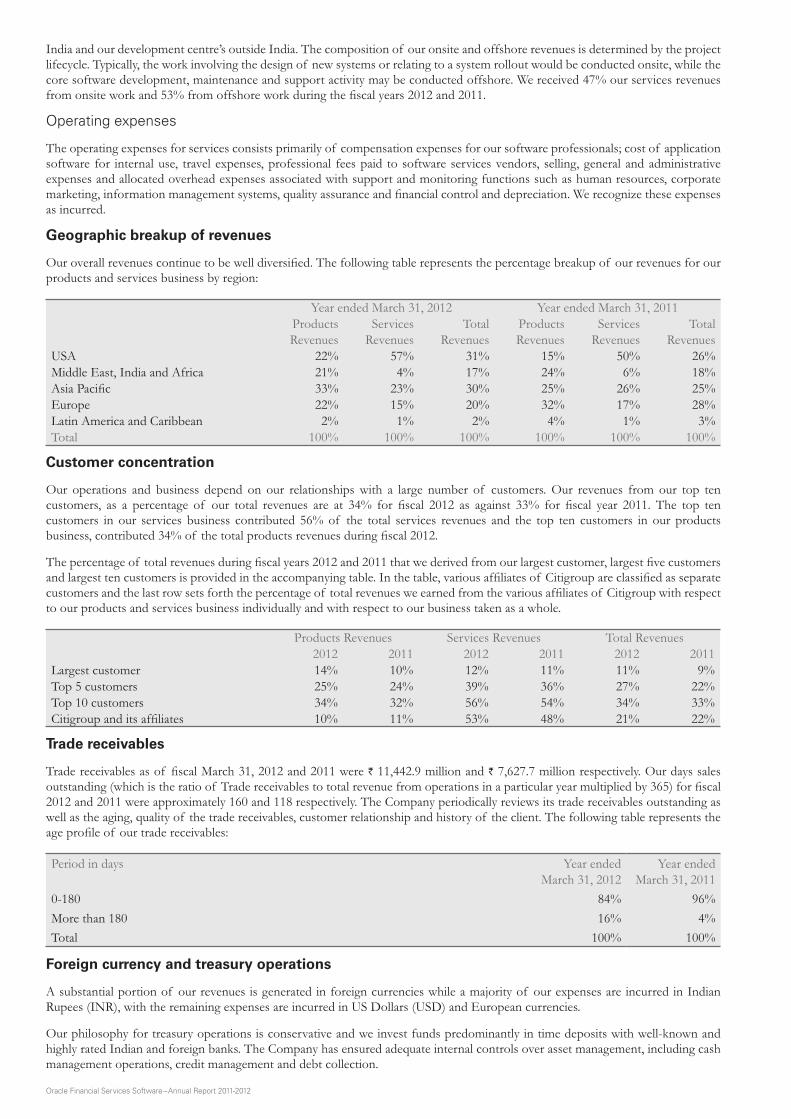
Oracle Financial Services Software – Annual Report 2011-2012
India and our development centre’s outside India. The composition of our onsite and offshore revenues is determined by the project lifecycle. Typically, the work involving the design of new systems or relating to a system rollout would be conducted onsite, while the core software development, maintenance and support activity may be conducted offshore. We received 47% our services revenues
Operating expenses
The operating expenses for services consists primarily of compensation expenses for our software professionals; cost of application software for internal use, travel expenses, professional fees paid to software services vendors, selling, general and administrative expenses and allocated overhead expenses associated with support and monitoring functions such as human resources, corporate
as incurred.
Geographic breakup of revenues
products and services business by region:
Year ended March 31, 2012 Year ended March 31, 2011Products Revenues
Services Revenues
Total Revenues
Products Revenues
Services Revenues
Total Revenues
USA 22% 57% 31% 15% 50% 26%Middle East, India and Africa 21% 4% 17% 24% 6% 18%
33% 23% 30% 25% 26% 25%Europe 22% 15% 20% 32% 17% 28%Latin America and Caribbean 2% 1% 2% 4% 1% 3%Total 100% 100% 100% 100% 100% 100%
Customer concentration
Our operations and business depend on our relationships with a large number of customers. Our revenues from our top ten
customers in our services business contributed 56% of the total services revenues and the top ten customers in our products
to our products and services business individually and with respect to our business taken as a whole.
Products Revenues Services Revenues Total Revenues2012 2011 2012 2011 2012 2011
Largest customer 14% 10% 12% 11% 11% 9%Top 5 customers 25% 24% 39% 36% 27% 22%Top 10 customers 34% 32% 56% 54% 34% 33%
10% 11% 53% 48% 21% 22%
Trade receivables
` 11,442.9 million and ` 7,627.7 million respectively. Our days sales
2012 and 2011 were approximately 160 and 118 respectively. The Company periodically reviews its trade receivables outstanding as well as the aging, quality of the trade receivables, customer relationship and history of the client. The following table represents the
Period in days Year ended March 31, 2012
Year ended March 31, 2011
0-180 84% 96%More than 180 16% 4%Total 100% 100%
Foreign currency and treasury operations
A substantial portion of our revenues is generated in foreign currencies while a majority of our expenses are incurred in Indian Rupees (INR), with the remaining expenses are incurred in US Dollars (USD) and European currencies.
Our philosophy for treasury operations is conservative and we invest funds predominantly in time deposits with well-known and highly rated Indian and foreign banks. The Company has ensured adequate internal controls over asset management, including cash management operations, credit management and debt collection.

47
The Company also maintains funds in USD, EUR, GBP and INR accounts based on comparative exchange rates, interest rates and currency requirements.
Income taxes
products and IT services exporters from specially designated Software Technology Parks in India (STPI). As a result of these incentives, our operations had been subject to relatively lower tax liabilities in India. These tax incentives included a 10-year tax holiday from Indian corporate income taxes for the operation of seven of our Indian facilities under the STPI scheme. As a result, a substantial portion of our pre-tax income was not subject to tax in India in past few years.
various countries.
Comparison of fiscal 2012 with fiscal 2011
Revenues from operations
` 26,058.5 million, an increase of 10% over our total revenues of `increase in the revenues from our products business.
Products revenues
`19,121.7 million, an increase of 18% over our products revenues of `The revenues from license fees comprised 12% of the revenues, implementation and customization fees comprised 61%, and Annual
Services revenues
were ` `
Other Income, net
` 3,750.3 million, as compared to `ended March 31, 2011. The overall increase of ` 2,347.3 million in other income is primarily attributable to higher interest income of ` 1,333.3 million and net foreign exchange gain of ` 1,037.3 million arising mainly due to realization of Trade Receivables at better foreign currency exchange rates.
Expenses
Employee costs
Our employee costs increased by 19% to ` ` 10,521.3 million in the
Travel related expenses (net of recoveries)
Our travel related expenditure reduced by 7% to ` ` 1,163.8 million in
ended March 31, 2012 and 2011 respectively.
Professional fees
Our professional fees related expenditure increased by 47% to ` ` 951.0
for the year ended March 31, 2012 and 2011 respectively. Professional fees include services hired from subsidiaries and that from external consultants for various projects.
Other expenses
Our other expenditure reduced by 25% to ` ` 1,544.2 million in the
31, 2012 and 2011 respectively. Other expenses primarily consist of various facilities costs, application software, communication and other miscellaneous expenses.

Oracle Financial Services Software – Annual Report 2011-2012
Depreciation and amortization
Our Depreciation and amortization charge for the year was ` 401.2 million and ` 336.5 million for the year ended March 31, 2012 and 2011 respectively representing 2% and 1% of revenues from operations.
Exceptional items, net
During the year ended March 31, 2012, the Company has received dividend of ` 1,833.3 million and ` 1,275.0 million from its wholly owned subsidiaries Oracle Financial Services Software B.V. and Oracle Financial Services Software Pte. Ltd. respectively. The same has been disclosed as an exceptional item.
` 5,784.2 million. In respect of this claim, the Company had provided ` 122.1 million in the year ended March 31, 2011. During the year ended March 31, 2012, the Company settled the said customer dispute for full release of all alleged claims and accordingly accounted the balance settlement amount, net of insurance claim, and disclosed the same as an exceptional item.
Income taxes
` 4,766.6 million, an increase of ` 4,102.5 million over our provision for income tax of `
Profit for the year
` `
Liquidity and capital resources
generated cash from operations of ` 4,375.8 million and ` 7,149.9 million respectively.
capital expenditure and working capital requirements in connection with the expansion of our business. We believe that the cash
Human capital
We recruit graduates from leading engineering and management institutions. We also hire functional experts from the banking
as on March 2011 at 8,447. The blend of functional knowledge and technical expertise, coupled with in-house training and real life,
We enjoy cordial relationships with our employees and endeavour to give them an excellent, professionally rewarding and enriching work environment. We operate an effective performance management system, with a focus on employee development. This measures key result areas, competencies and training requirements ensuring all-round employee development.
Risks and concerns
Quantitative and Qualitative Disclosures about Market Risk
Our primary market risk exposures are due to the following:
– Fluctuations in interest rates
– Fluctuations in the value of our investments.
As of March 31, 2012, we had Cash and Bank Balances of ` 35,109.2 million, out of which ` 33,514.2 million was in interest bearing
bank deposits of longer maturity (more than 90 days) to earn a higher rate of interest income.
A substantial portion of our revenues is generated in foreign currencies, while a majority of our expenses are incurred in Indian Rupees and the balance in US Dollars and European currencies. Our functional currency for Indian operations is the Indian Rupee. We expect that the majority of our revenues will continue to be generated in foreign currencies for the foreseeable future and a
Indian Rupees.
In addition, we face normal business risks such as global competition and country risks pertaining to countries that we operate in.

49
Consolidated Financials
Financial statements for the year ended March 31, 2012 prepared in accordance with Indian Generally Accepted Accounting Principles (Indian GAAP) (Consolidated).

Oracle Financial Services Software – Annual Report 2011-2012
This page has been intentionally left blank.

51
Auditors’ report
To the Board of Directors of Oracle Financial Services Software Limited
1. We have audited the attached consolidated balance sheet of Oracle Financial Services Software Limited, its subsidiaries and associate company (collectively referred to as the ‘Group’ as described in Note 1 to the consolidated financial statements) as at March 31, 2012, and also the consolidated statement of profit and loss and the consolidated cash flow statement for the year ended on that date annexed thereto. These financial statements are the responsibility of the Group’s management. Our responsibility is to express an opinion on these financial statements based on our audit.
2. We conducted our audit in accordance with generally accepted auditing standards in India. Those Standards require that we plan and perform the audit to obtain reasonable assurance whether the financial statements are free of material misstatements. An audit includes, examining on a test basis, evidence supporting the amounts and disclosures in the financial statements. An audit also includes assessing the accounting principles used and significant estimates made by management, as well as evaluating the overall financial statements. We believe that our audit provides a reasonable basis for our opinion.
3. We report that the consolidated financial statements have been prepared by the Group’s management in accordance with the requirements of Accounting Standard (‘AS’) 21, Consolidated Financial Statements and AS 23, Accounting for Investments in Associates in Consolidated Financial Statements, notified pursuant to the Companies (Accounting Standards) Rules, 2006 (as amended).
4. In our opinion and to the best of our information and according to the explanations given to us, the consolidated financial statements give a true and fair view in conformity with the accounting principles generally accepted in India :
(a) in the case of the consolidated balance sheet, of the state of affairs of the Group as at March 31, 2012;
(b) in the case of the consolidated statement of profit and loss, of the profit for the year ended on that date; and
(c) in the case of the consolidated cash flow statement, of the cash flows for the year ended on that date.
For S. R. Batliboi & Associates Firm registration number: 101049W Chartered Accountants
per Amit Majmudar Partner Membership No.: 36656
Mumbai, India May 11, 2012

Oracle Financial Services Software – Annual Report 2011-2012
Consolidated balance sheet as at March 31, 2012
As per our report of even date For and on behalf of the Board of Directors Oracle Financial Services Software Limited
For S. R. Batliboi & AssociatesFirm Registration No. 101049WChartered Accountants
Chaitanya Kamat Managing Director& Chief Executive Officer
Y M Kale Director
per Amit MajmudarPartnerMembership No.: 36656
Hoshi D Bhagwagar Company Secretary & Compliance Officer
S VenkatachalamDirector
Mumbai, IndiaMay 11, 2012
Mumbai, IndiaMay 11, 2012
(Amounts in ` million)Notes March 31, 2012 March 31, 2011
EQUITY AND LIABILITIESShareholders’ funds
Share capital 3 419.87 419.47 Reserves and surplus 4 62,753.79 53,637.13
63,173.66 54,056.60 Share application money pending allotment 3 (e) 1.24 0.78 Non- current liabilities
Deferred tax liability 5 92.58 91.56 Other Long-term liabilities 6 228.54 254.46 Long-term provisions 7 563.58 495.97
884.70 841.99 Current liabilities
Trade payable 6 272.15 151.70 Other current liabilities 6 6,917.97 5,219.34 Short-term provisions 7 929.99 1,022.81
8,120.11 6,393.85
TOTAL 72,179.71 61,293.22
ASSETSNon-current assets
Fixed assets Tangible assets 8 (a) 3,726.89 3,259.12 Intangible assets 8 (b) 6,086.63 6,086.63 Capital work-in-progress 8 (a) 544.47 559.70 Non-current investments 9 – – Deferred tax assets 5 707.33 755.24 Long-term loans and advances 11 4,962.84 6,482.02 Other non-current assets 12 2.85 2.02
16,031.01 17,144.73 Current assets
Current investments 10 9.98 9.98 Trade receivables 13 8,972.14 8,094.60 Cash and bank balances 14 39,475.91 29,021.67 Short-term loans and advances 11 2,939.08 2,935.54 Other current assets 12 4,751.59 4,086.70
56,148.70 44,148.49
TOTAL 72,179.71 61,293.22
Summary of significant accounting policies 2
The accompanying notes form an integral part of the consolidated financial statements.

53
Consolidated statement of profit and loss for the year ended March 31, 2012
(Amounts in ` million, except share data)Notes Year ended
March 31, 2012Year ended
March 31, 2011
INCOME
Revenue from operations 15 31,466.76 29,969.32 Other income, net 16 4,217.49 1,668.26
Total income 35,684.25 31,637.58
EXPENSES
Employee Cost 17 15,186.98 13,152.56 Travel related expenses (net of recoveries) 1,445.10 1,431.14 Professional fees 2,005.03 1,767.37 Other expenses 18 1,718.63 2,276.26 Depreciation and amortization 8 466.17 408.17
Total expenses 20,821.91 19,035.50
Profit before exceptional item and tax 14,862.34 12,602.08 Exceptional item 19 693.32 122.07 Profit before tax 14,169.02 12,480.01
Tax expenses Current tax 28 5,030.25 1,672.29 Deferred tax 46.04 (302.17)Total tax expenses 5,076.29 1,370.12
Profit for the year 9,092.73 11,109.89
Earnings per equity share of par value of ` 5 (March 31, 2011 ` 5) each (in `)
20
Basic 108.34 132.45 Diluted 108.23 132.25
Summary of significant accounting policies 2
The accompanying notes form an integral part of the consolidated financial statements.
As per our report of even date For and on behalf of the Board of Directors Oracle Financial Services Software Limited
For S. R. Batliboi & AssociatesFirm Registration No. 101049WChartered Accountants
Chaitanya Kamat Managing Director& Chief Executive Officer
Y M Kale Director
per Amit MajmudarPartnerMembership No.: 36656
Hoshi D Bhagwagar Company Secretary & Compliance Officer
S VenkatachalamDirector
Mumbai, IndiaMay 11, 2012
Mumbai, IndiaMay 11, 2012

Oracle Financial Services Software – Annual Report 2011-2012
Note 1: Corporate information
Oracle Financial Services Software Limited (the “Company”) was incorporated in India with limited liability on September 27, 1989. The Company is a subsidiary of Oracle Global (Mauritius) Limited (“Oracle”) with Oracle holding 80.36% (March 31, 2011 - 80.44%) ownership interest in the Company as at March 31, 2012.
The Company along with its subsidiaries and associate is principally engaged in the business of providing information technology solutions and knowledge processing services to the financial services industry worldwide. The Company has a suite of banking products, which caters to the needs of corporate, retail, investment banking, treasury operations and data warehousing.
The Company has following subsidiaries and associate (hereinafter collectively referred as the “Group”):
Companies Country of Incorporation Ownership Interest
Relationship
Direct holdingOracle Financial Services Software B.V. The Netherlands 100% SubsidiaryOracle Financial Services Software Pte. Ltd. Singapore 100% SubsidiaryOracle Financial Services Software America, Inc. United States of America 100% SubsidiaryISP Internet Mauritius Company Republic of Mauritius 100% SubsidiaryOracle (OFSS) Processing Services Limited India 100% SubsidiaryOracle (OFSS) ASP Private Limited India 100% SubsidiaryOracle Financial Services Software Chile Limitada Chile 100% SubsidiaryOracle Financial Services Software (Shanghai) Limited Republic of China 100% SubsidiaryLogin SA France 33% AssociateSubsidiaries of Oracle Financial Services Software America, Inc.
Oracle Financial Services Software, Inc. United States of America 100% Subsidiaryi-flex solutions Inc. (Canada) (dissolved on March 31, 2011) Canada 100% SubsidiaryMantas Inc. United States of America 100% SubsidiarySubsidiaries of Mantas Inc.Mantas Limited United Kingdom 100% SubsidiarySotas Inc. United States of America 100% SubsidiaryMantas Singapore Pte. Ltd. (dissolved on March 1, 2012) Singapore 100% SubsidiarySubsidiaries of Sotas Inc.Mantas India Private Limited India 100% SubsidiarySubsidiaries of i-flex solutions Inc. (Canada)Castek Inc. (dissolved on September 1, 2010) United States of America 100% SubsidiaryCastek Software Factory Ltd. (dissolved on September 1, 2010) United States of America 100% SubsidiaryCastek RBG Inc. (dissolved on September 1, 2010) United States of America 100% SubsidiarySubsidiary of Oracle Financial Services Software B.V. Oracle Financial Services Software SA Greece 100% SubsidiarySubsidiary of Oracle Financial Services Software Pte. Ltd.Oracle Financial Services Consulting Pte. Ltd. Singapore 100% SubsidiarySubsidiaries of ISP Internet Mauritius CompanyOracle (OFSS) BPO Services Inc. United States of America 100% SubsidiaryOracle (OFSS) BPO Services Limited India 100% Subsidiary
Note 2: Summary of significant accounting policies
(a) Basis of presentation and consolidation
The consolidated financial statements includes the accounts of the Company and its subsidiaries and are prepared in accordance with accounting principles generally accepted in India under the historical cost convention on the accrual basis of accounting and complying in all material respects with the Accounting Standards notified by Companies (Accounting Standards) Rules, 2006 (as amended). The consolidated financial statements have been prepared using uniform accounting policies for like transactions and
Notes annexed to and forming part of consolidated financial statements for the year ended March 31, 2012

55
other events in similar circumstances. The accounting policies have been consistently applied by the Group and are consistent with those used in the previous years’ except for changes in accounting policies described in note 2 (c) below. As these financial statements are not statutory financial statements, full compliance with the Companies Act, 1956 (the ‘Act’) is not required and hence these financial statements do not reflect all the disclosure requirements of the Act.
The consolidated financial statements are prepared in accordance with the principles and procedures required for the preparation and presentation of consolidated financial statements as laid down under Accounting Standard (‘AS’) 21, ‘Consolidated Financials Statements’ and AS 23, ‘Accounting for Investments in Associates in Consolidated Financial Statements’, notified by Companies (Accounting Standards) Rules, 2006 (as amended). The financial statements of the Company and its subsidiaries are consolidated on a line to line basis by adding together like items of assets, liabilities, income and expenses, after eliminating intra-group balances and intra-group transactions resulting in unrealized profits or unrealized cash losses. Any excess of the cost to the parent company of its investment in a subsidiary over the parent company’s portion of equity of subsidiary at the date, at which investment in the subsidiary is made, is described as goodwill and recognized separately as an asset in the consolidated financial statements. Investment in associate company is accounted under equity method in consolidated financial statements.
The significant accounting policies adopted by the Group, in respect of the consolidated financial statements are set out as below:
(b) Use of estimates
The preparation of financial statements in conformity with generally accepted accounting principles requires management to make estimates and assumptions that affect the reported amounts of assets and liabilities and disclosure of contingent liabilities at the date of the financial statements and the results of operations during the reporting year end. Although these estimates are based upon management’s best knowledge of current events and actions, actual results could differ from these estimates..
(c) Change in Accounting Policy
Presentation and disclosure of financial statements
During the year ended March 31, 2012, the revised Schedule VI notified under the Act, has become applicable to the Company, for preparation and presentation of its financial statements. The adoption of revised Schedule VI does not impact recognition and measurement principles followed for preparation of financial statements. However, it has significant impact on presentation and disclosures made in the financial statements. The Group has also reclassified the previous year figures in accordance with the requirements applicable in the current year.
(d) Fixed assets including intangibles and capital work-in-progress, depreciation, amortization and impairment
Fixed assets including intangibles and capital work-in-progress
Fixed assets including assets under finance lease arrangements are stated at cost less accumulated depreciation. The Group capitalizes all direct costs relating to the acquisition and installation of fixed assets. The cost of fixed assets not ready to use before balance sheet date are disclosed under ‘Capital work-in-progress’. Product Intellectual property rights (IPRs) are capitalized based on a fair value. The Group records the difference between considerations paid to acquire these IPRs and the fair value of assets and liabilities acquired as goodwill.
The Group purchases certain specific-use application software, which is in ready to use condition, for internal use. It is estimated that such software has a relatively short useful life, usually less than one year. The Group, therefore, charges to income the cost of acquiring such software.
Depreciation and amortization
Depreciation and amortization are computed using straight-line method, at the rates specified in Schedule XIV to the Act or based on the estimated useful life of assets, whichever is higher. Individual assets costing ` 5,000 or less are fully depreciated in the year of acquisition. The estimated useful life considered for depreciation of fixed assets is as follows:
Asset description Asset life (in years) Tangible assetsImprovement of leasehold premises Lesser of 7 years orlease termBuildings 20Computer equipments 3Office equipments 2–7Electricals and other installations 2–7Furniture and fixtures 2–7Vehicles under finance lease Lesser of 3 to 5 years or lease termIntangible assetsGoodwill on acquisition 3–5Product IPR 5PeopleSoft ERP 5

Oracle Financial Services Software – Annual Report 2011-2012
Impairment
Goodwill arising on consolidation is evaluated for impairment annually.
The carrying amounts of assets are reviewed at each balance sheet date if there is any indication of impairment based on internal/external factors. An impairment loss is recognized wherever the carrying amount of an asset exceeds its recoverable amount. The recoverable amount is the greater of the assets net selling price and value in use. In assessing value in use, the estimated future cash flows are discounted to their present value using a pre-tax discount rate that reflects current market assessments of the time value of money and risks specific to assets. After impairment, depreciation is provided on a revised carrying amount of assets over its remaining useful life.
(e) Investments
Investments that are readily realizable and intended to be held for not more than a year from the date on which such investments are made are classified as current investments. All other investments are classified as long-term investments. Trade investments refer to the investments made with the aim of enhancing the Group’s business interests in providing information technology solutions to the financial services industry worldwide.
Long term investments are stated at cost less provision for diminution on account of other than temporary decline in the value of the investment.
Current investments are stated at lower of cost and fair value determined on an individual investment basis.
(f) Foreign currency transactions
Initial recognition
– Foreign currency transactions are recorded in the reporting currency, by applying to the foreign currency amount the exchange rate between the reporting currency and the foreign currency at the date of the transaction.
Conversion
– Foreign currency denominated monetary items are translated into reporting currency at the closing rates of exchange prevailing at the date of the balance sheet. Non-monetary items, which are carried in terms of historical cost denominated in a foreign currency, are reported using the exchange rate at the date of the transaction.
Translation of integral and non-integral foreign operation
– Foreign operations of the Group are classified under integral and non integral foreign operations. The financial statements of integral foreign operations are translated as if the transactions of foreign operations have been those of the Company itself.
– In translating the financial statements of non-integral foreign operations for incorporation in financial statements, the assets and liabilities, both monetary and non-monetary, of the non-integral foreign operations are translated at closing rate, income and expense items of the non-integral foreign operations are translated at the average exchange rate; all the resulting exchange differences are accumulated in foreign currency translation reserve until the disposal of the net investment.
– On the disposal of a non-integral foreign operation, the cumulative amount of the exchange differences which have deferred and which relate to that operation are recognized as income or a expenses in the same period in which the gain or loss on disposal is recognized.
– When there is a change in the classification of a foreign operation, the translation procedures applicable to the revised classification are applied from the date of the change in the classification.
Exchange differences
– Exchange differences arising on the settlement of monetary items or on reporting Company’s monetary items at rates different from those at which they were initially recorded or reported in previous financial statement, are recognized as income or as expenses in the year in which they arise except those arising from investments in non-integral operations.
Forward exchange contracts entered into to hedge foreign currency risk of an existing asset
– The premium or discount arising at the inception of forward exchange contract is amortized and recognized as an expense/ income over the life of the contract. Exchange differences on such contracts are recognized in the statement of profit and loss in the period in which the exchange rates change. Any profit or loss arising on cancellation or renewal of such forward exchange contract is also recognized as income or as expense for the period.
(g) Revenue recognition
Revenue is recognized as follows:
Product licenses and related revenue:
– License fees are recognized, on delivery and subsequent milestone schedule as per the terms of the contract with the end user.

57
– Implementation and customization services are recognized as services are provided, when arrangements are on a time and material basis. Revenue for fixed price contracts is recognized using the proportionate completion method till contracts reach 90% completion. Balance revenue is recognized at the time of receipt of customer acceptance.
– Proportionate completion is measured based upon the efforts incurred to date in relation to the total estimated efforts to complete the contract. The Group monitors estimates of total contract revenue and cost on a routine basis throughout the delivery period. The cumulative impact of any change in estimates of the contract revenue or costs is reflected in the period in which the changes become known. In the event that a loss is anticipated on a particular contract, provision is made for the estimated loss.
– Product maintenance revenue is recognized, over the period of the maintenance contract on a straight line basis.
IT solutions and consulting services:
– Revenue from IT solutions and consulting services are recognized as services are provided, when arrangements are on a time and material basis.
– Revenue from fixed price contracts is recognized using the proportionate completion method till contracts reach 90% completion. Balance revenue is recognized at the time of receipt of customer acceptance. Proportionate completion is measured based upon the efforts incurred to date in relation to the total estimated efforts to complete the contract. The Group monitors estimates of total contract revenue and cost on a routine basis throughout the delivery period. The cumulative impact of any change in estimates of the contract revenue or costs is reflected in the period in which the changes become known. In the event that a loss is anticipated on a particular contract, provision is made for the estimated loss.
Business processing services (‘BPO’):
– Revenue from BPO services are recognized as services are provided, as per the arrangement with customers.
The Group presents revenues net of service tax and value added taxes in its consolidated statement of profit and loss.
Cost and revenue in excess of billing is classified as unbilled revenue while billing in excess of revenue is classified as deferred revenue.
Interest income
Interest income is recognized on a time proportion basis taking into account the amount outstanding and the rate applicable.
(h) Research and development expenses for software products
Research costs are expensed as incurred. Software product development costs are expensed as incurred unless technical feasibility of project is established, future economic benefits are probable, the Group has an intention and ability to complete and use or sell the software and the cost can be measured reliably. Software product development costs incurred subsequent to the achievement of technical feasibility are not material and are expensed as incurred.
(i) Retirement and other employee benefits
Provident fund and superannuation fund are defined contribution schemes and the Group has no further obligation beyond the contributions made to the fund. Contributions are charged to statement of profit and loss in the year in which they accrue.
Gratuity liability is a defined benefit obligation and is recorded based on actuarial valuation on projected unit credit method made at the end of the year. Under the gratuity plan, every employee who has completed at least five years of service gets a gratuity on departure @ 15 days of last drawn salary for each completed year of service. The gratuity liability and net periodic gratuity cost is actuarially determined after considering discount rates, expected long term return on plan assets and increase in compensation levels. All actuarial gain/loss are immediately recorded to statement of profit and loss and are not deferred. The Company makes contributions to a fund administered and managed by the Life Insurance Corporation of India (LIC) to fund the gratuity liability. Under this scheme, the obligation to pay gratuity remains with the Company, although LIC administers the scheme. Short term compensated absences are provided for based on estimates. Long term compensated absences are provided for based on actuarial valuation. The actuarial valuation is done as per projected unit credit method. All actuarial gains / losses are immediately recognized to the statement of profit and loss and are not deferred. The Group presents the entire leave as a current liability in the balance sheet, since it does not have an unconditional right to defer its settlement for 12 months after the balance sheet date.
(j) Leases
Where the Company is the lessee
Lease of assets under which substantially all the risks and benefits incidental to ownership are transferred to the Company are classified as finance leases. These assets are capitalized at the lower of the fair value and present value of the minimum lease payments at the inception of the lease term and disclosed as leased assets. Lease payments are apportioned between the finance charges and reduction of the lease liability based on the implicit rate of return. Finance charges are recognized as finance cost in the statement of profit and loss. Lease management fees, legal charges and other initial direct costs are capitalized.

Oracle Financial Services Software – Annual Report 2011-2012
Leases of assets under which all the risks and rewards of ownership are effectively retained by the lessor are classified as operating leases. Lease payments under operating leases are recognized as an expense in statement of profit and loss on a straight-line basis over the lease term.
(k) Income-tax
Tax expense comprises of current and deferred tax. Current income tax for the Company is measured at the amount expected to be paid to the tax authorities in accordance with the Indian Income Tax Act, 1961.Tax expense relating to overseas operations is determined in accordance with tax laws applicable in countries where such operations are domiciled. Advance taxes and provisions for current income taxes are presented in the balance sheet after off-setting advance taxes paid and income tax provisions arising in the same tax jurisdiction and enterprise.
Deferred income taxes are recognized for the future tax consequences attributable to timing differences between the financial statement determination of income and their recognition for tax purposes. The effect on deferred tax assets and liabilities of a change in tax rates is recognized in statement of profit and loss using the tax rates and tax laws that have been enacted or substantively enacted by the balance sheet date. Deferred tax assets and deferred tax liabilities across various countries of operation are not set off against each other as the company does not have a legal right to do so. Deferred tax assets are recognized and carried forward only to the extent that there is a reasonable certainty that sufficient future taxable income will be available against which such deferred tax assets can be realized. In situations where there are carry forward losses, deferred tax asset is recognized only if there is virtual certainty supported by convincing evidence that future taxable income will be available against which deferred tax asset can be realized. Unrecognized deferred tax assets of earlier years are re-assessed and recognized to the extent that it has become reasonably certain or virtually certain that future taxable income will be available against which deferred tax assets can be realized.
Minimum Alternative Tax (MAT) credit is recognized as an asset only when and to the extent there is convincing evidence that the Group will pay normal income tax during the specified period. In the year in which the MAT credit becomes eligible to be recognized as an asset in accordance with the recommendations contained in guidance Note issued by the Institute of Chartered Accountants of India (‘ICAI’), the said asset is created by way of a credit to the statement of profit and loss and shown as MAT Credit Entitlement. The Group reviews the same at each balance sheet date and writes down the carrying amount of MAT Credit Entitlement to the extent there is no longer convincing evidence to the effect that Group will pay normal Income Tax during the specified period.
(l) Earnings per share
The earnings considered in ascertaining the Group’s earnings per share comprise the net profit after tax. The number of shares used in computing basic earnings per share is the weighted average number of shares outstanding during the year. The number of shares used in computing diluted earnings per share comprises the weighted average number of shares considered for deriving basic earnings per share, and also the weighted average number of shares, if any which would have been issued on the conversion of all dilutive potential equity shares. The weighted average number of shares and potentially dilutive equity shares are adjusted for the bonus shares and sub-division of shares. For the purpose of calculating diluted earnings per share, the net profit or loss for the year attributable to equity shareholders and the weighted average number of shares outstanding during the year are adjusted for the effects of all dilutive potential equity shares.
(m) Share-based compensation/payments
Measurement and disclosure of the employee share-based payment plans is done in accordance with Securities Exchange Board of India (SEBI) (Employee Stock Option Scheme and Employee Stock Purchase Scheme) Guidelines, 1999 and the Guidance Note on Accounting for Employee Share-based Payments, issued by the ICAI. The Group uses the intrinsic value method of accounting for its employee share based compensation plan and other share based arrangements. Under this method compensation expense is recorded over the vesting period of the option on straight line basis, if the fair market value of the underlying stock exceeds the exercise price at the grant date.
(n) Provision
A provision is recognized when an enterprise has a present obligation as a result of past event and it is probable that an outflow of resources will be required to settle the obligation, in respect of which a reliable estimate can be made. Provisions are not discounted to its present value and are determined based on management estimate required to settle the obligation at the balance sheet date. These are reviewed at each balance sheet date and adjusted to reflect the current management estimates.
(o) Contingent liabilities
A contingent liability is a possible obligation that arises from past events whose existence will be confirmed by the occurrence or non-occurrence of one or more uncertain future events beyond the control of the Group or a present obligation that is not recognized because it is not probable that an outflow of resources will be required to settle the obligation. The Group does not recognize a contingent liability but discloses its existence in the financial statements.
(p) Cash and cash equivalents
Cash and cash equivalents for purpose of cash flow statement comprise cash at bank and in hand and short term investments with an original maturity of three months or less.

59
(Amounts in ` million, except share data) As at
March 31, 2012As at
March 31, 2011
Note 3: Share capital
Authorized:100,000,000 (March 31, 2011 – 100,000,000) equity shares of ` 5 each 500.00 500.00
Issued, subscribed and fully paid-up:83,973,757 (March 31, 2011 – 83,894,802) equity shares of ` 5 each 419.87 419.47
(a) The Company has only one class of equity shares having a par value of ` 5 per share. Each holder of equity shares is entitled to one vote per share.
In the event of liquidation of the Company, the holders of equity shares will be entitled to receive remaining assets of the Company, after distribution of all preferential amounts. The distribution will be in proportion to the number of equity shares held by the shareholders.
(b) Details of shareholders holding more than 5% equity shares in the company
March 31, 2012 March 31, 2011 No. of equity
shares% of equity
sharesNo. of equity
shares% of equity
sharesName of shareholder
Oracle Global (Mauritius) Limited, holding company 67,481,698 80.36% 67,481,698 80.44% As per records of the Company, including its register of shareholders/members and other declarations received from shareholders
regarding beneficial interest, the above shareholding represents both legal and beneficial ownerships of equity shares.(c) Reconciliation of equity shares outstanding at the beginning and at the end of the year
March 31, 2012 March 31, 2011 No. of equity
shares Amount No. of equity
shares Amount Outstanding at the beginning of year 83,894,802 419.47 83,854,857 419.27 Issued during the year - ESOP 78,955 0.40 39,945 0.20 Outstanding at the end of year 83,973,757 419.87 83,894,802 419.47
(d) Refer note 24 (b) for details of shares reserved for issue under the employee stock option (ESOP) plan of the Company.
(e) Share application money pending allotment represents the money received from employees of the Company towards exercise of 500 options at the exercise price of ` 1,290.85 under Employee Stock Option Scheme 2002 (“Scheme 2002”) and 289 options at the exercise price of ` 2,050.00 under Employee Stock Option Plan 2010 Scheme (“Scheme 2010”) (March 31, 2011 - 600 options at the exercise price of ` 1,290.85 under Scheme 2002). Each option will entitle one equity share of ` 5 each of the Company at a premium of ` 1,285.85 under Scheme 2002 and ` 2,045.00 under Scheme 2010 (March 31, 2011 - ` 1,285.85 per options under Scheme 2002).
March 31, 2012 March 31, 2011Note 4: Reserves and surplus
Securities premium Balance, beginning of the year 9,574.46 9,524.54 Received during the year on exercise of employee stock options 73.92 49.92 Balance, end of the year 9,648.38 9,574.46 General reserve 10,145.19 10,145.19 Foreign currency translation reserve Balance, beginning of the year (803.60) (804.30) Addition during the year on net investment in Non integral operations (49.08) 0.70 Balance, end of the year (852.68) (803.60)Gain on dilution of equity investment in joint venture – 0.91 Surplus in the statement of profit and loss account Balance, beginning of year 34,720.17 23,610.28 Profit for the year 9,092.73 11,109.89 Balance, end of the year 43,812.90 34,720.17
62,753.79 53,637.13
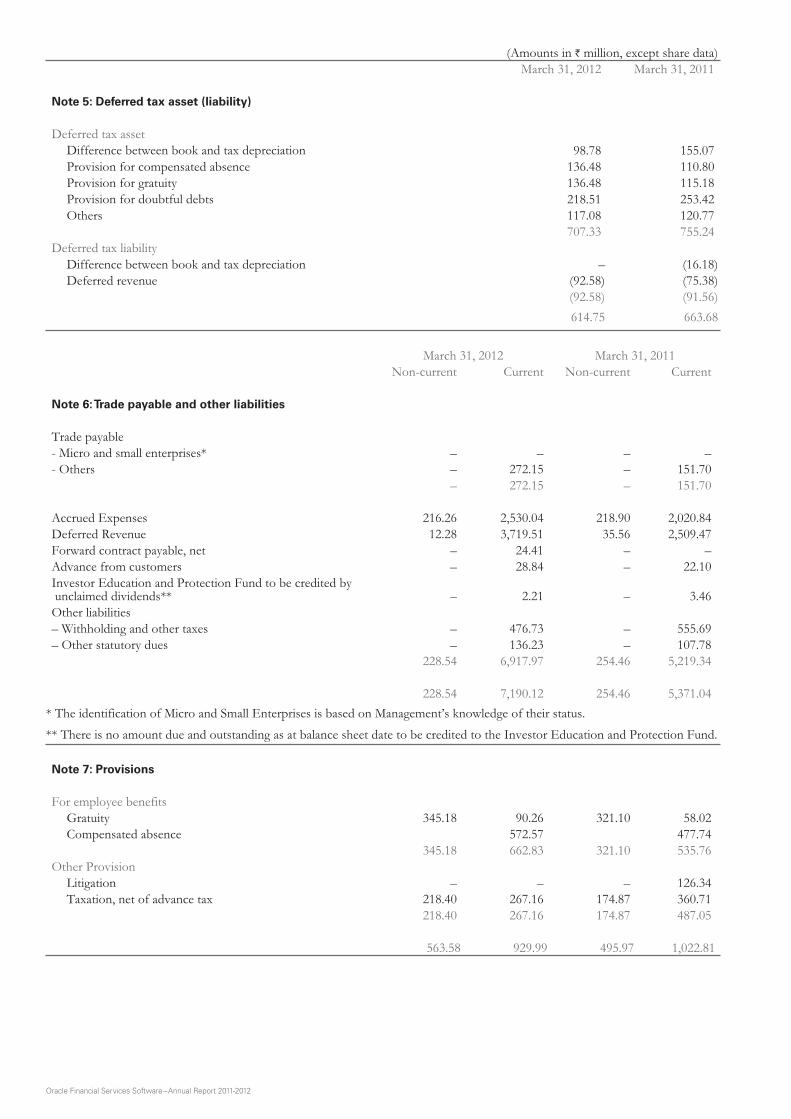
Oracle Financial Services Software – Annual Report 2011-2012
(Amounts in ` million, except share data) March 31, 2012 March 31, 2011
Note 5: Deferred tax asset (liability)
Deferred tax asset Difference between book and tax depreciation 98.78 155.07 Provision for compensated absence 136.48 110.80 Provision for gratuity 136.48 115.18 Provision for doubtful debts 218.51 253.42 Others 117.08 120.77
707.33 755.24 Deferred tax liability Difference between book and tax depreciation – (16.18) Deferred revenue (92.58) (75.38)
(92.58) (91.56) 614.75 663.68
March 31, 2012 March 31, 2011 Non-current Current Non-current Current
Note 6: Trade payable and other liabilities
Trade payable- Micro and small enterprises* – – – – - Others – 272.15 – 151.70
– 272.15 – 151.70
Accrued Expenses 216.26 2,530.04 218.90 2,020.84 Deferred Revenue 12.28 3,719.51 35.56 2,509.47 Forward contract payable, net – 24.41 – – Advance from customers – 28.84 – 22.10 Investor Education and Protection Fund to be credited by unclaimed dividends** – 2.21 – 3.46 Other liabilities– Withholding and other taxes – 476.73 – 555.69 – Other statutory dues – 136.23 – 107.78
228.54 6,917.97 254.46 5,219.34
228.54 7,190.12 254.46 5,371.04 * The identification of Micro and Small Enterprises is based on Management’s knowledge of their status.** There is no amount due and outstanding as at balance sheet date to be credited to the Investor Education and Protection Fund.
Note 7: Provisions
For employee benefits Gratuity 345.18 90.26 321.10 58.02 Compensated absence 572.57 477.74
345.18 662.83 321.10 535.76 Other Provision Litigation – – – 126.34 Taxation, net of advance tax 218.40 267.16 174.87 360.71
218.40 267.16 174.87 487.05
563.58 929.99 495.97 1,022.81

61
No
te 8
(a)
: Tan
gib
le a
sset
s
(Am
ount
s in
` m
illio
n, e
xcep
t sha
re d
ata)
Parti
cular
s G
ross
blo
ck
Dep
recia
tion
Net
blo
ck
As a
t A
pril
01,
2011
Add
ition
s Sa
le/
delet
ions
Tran
slatio
n ga
in (l
oss)
As a
t M
arch
31,
20
12
As a
t A
pril
01,
2011
For
the
year
Sa
le/
delet
ions
Tran
slatio
n ga
in (l
oss)
As a
t M
arch
31,
20
12
As a
t M
arch
31,
20
12
As a
t M
arch
31,
20
11
Free
hold
Lan
d 5
38.3
1 –
–
–
5
38.3
1 –
–
–
–
–
5
38.3
1 5
38.3
1 Im
prov
emen
t to
lease
hold
pre
mise
s 3
19.3
6 1
84.1
1 1
9.11
–
4
84.3
6 2
32.8
6 2
9.36
1
6.42
–
2
45.8
0 2
38.5
6 8
6.50
Bu
ildin
gs [R
efer
not
e be
low
] 1
,978
.92
7.0
0 –
–
1
,985
.92
237
.88
99.
52
–
–
337
.40
1,6
48.5
2 1
,741
.04
Com
pute
r equ
ipm
ents
Ow
ned
1,6
81.4
5 2
34.4
8 2
65.8
2 1
.40
1,6
51.5
1 1
,500
.43
124
.90
265
.17
0.8
8 1
,361
.04
290
.47
181
.02
Und
er fi
nanc
e lea
se 7
.23
–
–
–
7.2
3 7
.23
–
–
–
7.2
3 –
–
O
ffice
equ
ipm
ents
229
.66
18.
72
14.
44
0.2
1 2
34.1
5 1
55.9
9 2
4.48
1
0.11
0
.20
170
.56
63.
59
73.
67
Elec
trica
ls an
d ot
her i
nsta
llatio
ns 7
30.8
4 3
65.5
4 9
5.02
–
1
,001
.36
402
.08
90.
33
84.
29
–
408
.12
593
.24
328
.76
Furn
iture
and
fixt
ures
Ow
ned
748
.16
162
.63
132
.46
–
778
.33
461
.49
89.
36
114
.30
–
436
.55
341
.78
286
.67
Und
er fi
nanc
e lea
se 2
.98
–
–
–
2.9
8 2
.98
–
–
–
2.9
8 –
–
V
ehicl
es u
nder
fina
nce
lease
42.
48
–
10.
08
–
32.
40
19.
33
8.2
2 7
.57
–
19.
98
12.
42
23.
15
Tota
l 6
,279
.39
972
.48
536
.93
1.6
1 6
,716
.55
3,0
20.2
7 4
66.1
7 4
97.8
6 1
.08
2,9
89.6
6 3
,726
.89
3,2
59.1
2
As a
t Mar
ch 3
1, 2
011
5,1
59.2
0 1
,393
.38
272
.85
(0.3
4) 6
,279
.39
2,8
91.1
1 3
99.6
0 2
68.7
0 (1
.74)
3,0
20.2
7
C
apita
l wor
k-in
-pro
gres
s 5
44.4
7 5
59.7
0 4
,271
.36
3,8
18.8
2
Not
e:In
clude
s 10
(Mar
ch 3
1, 2
011
- 10)
shar
es o
f ` 5
0/- e
ach
in T
aksh
ila B
uild
ing
No.
9, C
o-op
Hou
sing
Socie
ty L
td.,
Mum
bai.

Oracle Financial Services Software – Annual Report 2011-2012
No
te 8
(b
): In
tan
gib
le a
sset
s
(Am
ount
s in
` m
illio
n, e
xcep
t sha
re d
ata)
Parti
cular
s G
ross
blo
ck
Am
ortiz
atio
n an
d im
pairm
ent l
osse
s N
et b
lock
As a
t A
pril
01,
2011
Add
ition
s S
ale/
delet
ions
[R
efer
no
te 2
]
Tran
slatio
n ga
in (l
oss)
As a
t M
arch
31,
20
12
As a
t A
pril
01,
2011
For
the
year
S
ale/
delet
ions
[R
efer
no
te 2
]
Tran
slatio
n ga
in (l
oss)
As a
t M
arch
31,
20
12
As a
t M
arch
31,
20
12
As a
t M
arch
31,
20
11
Goo
dwill
on
cons
olid
atio
n
[Ref
er n
ote
1] 6
,137
.76
–
–
–
6,1
37.7
6 5
1.13
–
–
–
5
1.13
6
,086
.63
6,0
86.6
3 G
oodw
ill o
n ac
quisi
tion
197
.47
–
–
–
197
.47
197
.47
–
–
–
197
.47
–
–
Prod
uct I
PR 1
38.6
2 –
–
–
1
38.6
2 1
38.6
2 –
–
–
1
38.6
2 –
–
Pe
opleS
oft E
RP 5
3.77
–
–
–
5
3.77
5
3.77
–
–
–
5
3.77
–
–
Tota
l 6
,527
.62
–
–
–
6,5
27.6
2 4
40.9
9 –
–
–
4
40.9
9 6
,086
.63
6,0
86.6
3
As a
t Mar
ch 3
1, 2
011
6,8
18.6
7 –
2
91.0
5 –
6
,527
.62
723
.47
8.5
7 2
91.0
5 –
4
40.9
9
Not
e:1.
A
ccum
ulat
ed am
ortiz
atio
n an
d im
pairm
ent l
osse
s as a
t Apr
il 1,
201
1 co
nsist
s of i
mpa
irmen
t of g
oodw
ill o
f Sup
erSo
lutio
ns C
orpo
ratio
n [m
erge
d w
ith O
racle
Fin
ancia
l Ser
vice
s Sof
twar
e, In
c. ef
fect
ive
Janu
ary
2, 2
008]
am
ount
ing
to `
51.
13.
2.
Goo
dwill
on
cons
olid
atio
n of
i-fle
x So
lutio
ns in
c. (C
anad
a) a
nd p
rovi
sion
for
impa
irmen
t on
the
sam
e am
ount
ing
to `
291
.05
was
writ
ten
back
dur
ing
the
prev
ious
yea
r on
diss
olut
ion
of t
his
entit
y ef
fect
ive
Mar
ch 3
1, 2
011.

63
(Amounts in ` million, except share data) March 31, 2012 March 31, 2011
Note 9: Non-current investments (trade) (at cost) (unquoted)
EBZ Online Private Limited242,240 (March 31, 2011 - 242,240) equity shares of ` 10 each, fully paid-up 45.00 45.00 Less: Provision for diminution in value of investment (45.00) (45.00)
Aggregate amount of unquoted investments – –
Aggregate amount of provision for diminution in value of unquoted trade investments 45.00 45.00
Note 10: Current investments (at cost or fair value, whichever is lower)
Non trade (quoted)
9% Dhanalakshmi Bank Bond Series VI10 (March 31, 2011 - 10) Bonds of ` 1,000,000 each, fully paid-up 9.98 9.98
Aggregate market value of quoted investment 9.98 9.98
March 31, 2012 March 31, 2011 Non-current Current Non-current Current
Note 11: Loans and advances (unsecured, considered good)
Advances recoverable in cash or in kind or for value to be received:Deposits for premises and others 2,207.63 665.02 2,317.36 981.47 Prepaid expenses 6.13 226.05 1.43 176.45 Other advances 332.31 462.40 302.43 355.87 Advance tax, net of provision for taxes ` 10,353.74 (March 31, 2011 ` 7,731.50) 2,366.82 7.52 1,889.06 28.84 MAT credit entitlement 49.95 1,578.09 1,971.74 1,392.91
4,962.84 2,939.08 6,482.02 2,935.54
Note 12: Other assets
Non-current bank balances [Refer note 14] 2.52 – 1.80 –
Interest accrued on Bank deposits 0.33 613.44 0.22 427.13 Unbilled revenue – 3,999.26 – 3,548.56 Recoverable expenses - billed – 138.89 – 111.01
0.33 4,751.59 0.22 4,086.70
2.85 4,751.59 2.02 4,086.70
Note 13: Trade receivables (unsecured)
(a) Outstanding for a period exceeding six months from date they are due for payment
Consider good – 1,750.76 – 335.64 Consider doubtful 631.98 198.79 557.79 333.31
631.98 1,949.55 557.79 668.95 Provision for doubtful receivables (631.98) (198.79) (557.79) (333.31)
– 1,750.76 – 335.64 (b) Other receivables Consider good – 7,221.38 – 7,758.96 Consider doubtful – 0.41 – 13.38
– 7,221.79 – 7,772.34 Provision for doubtful receivables – (0.41) – (13.38)
– 7,221.38 – 7,758.96
– 8,972.14 – 8,094.60

Oracle Financial Services Software – Annual Report 2011-2012
(Amounts in ` million, except share data) March 31, 2012 March 31, 2011
Non-current Current Non-current Current
Note 14: Cash and bank balances
(a) Cash and cash equivalents Cash on hand – 2.14 – 1.56 Cheques on hand – 0.55 – 0.49 Balances with banks: Current accounts – 4,580.70 – 2,961.81 Deposits with original maturity of less than three months – 566.73 – 351.26 Unclaimed dividend accounts – 2.21 – 3.46
– 5,152.33 – 3,318.58 (b) Other bank balances Balances with banks: Deposits with original maturity for more than 12 months – – – 15.00 Deposits with original maturity for more than 3 months but
less than 12 months – 34,319.44 – 25,683.27 Margin money deposits 2.52 4.14 1.80 4.82
2.52 34,323.58 1.80 25,703.09
Amount disclosed under non-current assets (2.52) – (1.80) –
Amount disclosed under current assets – 39,475.91 – 29,021.67
Year ended March 31, 2012
Year ended March 31, 2011
Note 15: Revenue from operations
Product licenses and related activities 22,822.81 19,965.43 IT solutions and consulting services 7,821.55 9,274.40 Business Processing Services 822.40 729.49
31,466.76 29,969.32
Note 16: Other income, net
a) Interest income Interest on: Bank deposits 2,738.90 1,390.44 Bonds 0.90 0.90 Income tax refund 1.29 2.92 Lease assets – 1.24
2,741.09 1,395.50 b) Other income, net Foreign exchange gain, net 1,444.51 227.16 (Loss) profit on sale of fixed assets, net (28.22) 4.06 Miscellaneous income 60.11 41.54
1,476.40 272.76 4,217.49 1,668.26
Note 17: Employee Cost
Salaries and bonus [Refer note below] 14,184.28 12,140.27 Staff welfare expenses 543.56 541.12 Contribution to provident and other funds 459.14 471.17
15,186.98 13,152.56 Employee costs for the year ended March 31, 2011 are net of ` 238.42 pertaining to write back of bonus provision of earlier year, no longer required due to changes in compensation policy of the Company.

65
(Amounts in ` million, except share data) Year ended
March 31, 2012Year ended
March 31, 2011Note 18: Other expenses
Application software 149.28 142.25 Communication expenses 192.97 256.78 Rent 651.62 890.44 Advertising expenses 18.19 31.39 Power 247.00 242.56 Insurance 25.67 19.82 Repairs and maintenance: Buildings and leasehold premises 37.26 16.54 Computer equipments 51.98 64.29 Others 59.83 65.38 Rates and taxes 157.98 70.45 Finance charge on leased assets 1.92 2.13 Provision for doubtful debts, net (182.47) 182.31 Bad debts 69.09 48.56 Miscellaneous expenses 238.31 243.36
1,718.63 2,276.26
Note 19: Exceptional item
Claim against the Company [Refer note below] 693.32 122.07
A customer had filed a lawsuit against the Company and one of its subsidiaries, claiming damages of upwards of ` 5,784.19. In respect of this claim, the Company had provided ` 122.07 in the year ended March 31, 2011. During the year ended March 31, 2012, the Company has settled the said customer dispute for full release of all alleged claims and accordingly has accounted the balance settlement amount, net of insurance claim and disclosed the same as an exceptional item.
Note 20: Reconciliation of basic and diluted shares used in computing earnings per share
Weighted average shares outstanding for basic earnings per share 83,929,749 83,882,022 Add: Effect of dilutive stock options 82,950 123,857 Weighted average shares outstanding for diluted earnings per share 84,012,699 84,005,879
Note 21: Capital and other commitments and contingent liabilities
Particulars March 31, 2012 March 31, 2011
(a) Capital CommitmentsContracts remaining to be executed on capital account not provided for (net of advances) including capital commitment through issuance of letter of intents of ` Nil (March 31, 2011 - ` 343.04). 470.44 919.97
(b) Contingent liabilities Claim against the Company [Refer note 19] Nil 5,306.41
Note 22: Leases
Where Company is lessee
Finance lease
The Group takes vehicles, furniture and fixture and computer equipments under finance lease of up to five years. None of the lease agreements have an escalation clause. Future minimum lease payments under finance lease as at March 31, 2012 and 2011 are as follows:
March 31, 2012Principal Interest Total
Not later than one year 7.25 1.33 981.47 Later than one year but not later than five years 7.14 0.64 7.78Total minimum payments 14.39 1.97 16.36

Oracle Financial Services Software – Annual Report 2011-2012
March 31, 2011Principal Interest Total
Not later than one year 8.75 2.56 11.31Later than one year but not later than five years 16.66 2.31 18.97Total minimum payments 25.41 4.87 30.28
Operating leaseThe Group has taken certain office premises and residential premises for employees under operating lease, which expire at various dates through year 2025. Some of these lease agreements have a price escalation clause. Gross rental expenses for the year ended March 31, 2012 aggregated to ` 642.34 (March 31, 2011 ` 878.50). The minimum rental payments to be made in future in respect of these leases are as follows:
March 31, 2012 March 31, 2011Not later than one year 516.40 609.99Later than one year but not later than five years 1,236.92 1,399.07Later than five years 1,118.38 2,339.01
2,871.70 4,348.07
Note 23: Derivative instruments and unhedged foreign currency exposure
The Company enters into forward foreign exchange contracts where the counter party is a bank. The Company purchases forward foreign exchange contracts to mitigate the risks of change in foreign exchange rate on receivables denominated in certain foreign currencies. The Company considers the risk of non-performance by the counter party as non-material. As at March 31, 2012 the Company has following outstanding derivative instrument:
(Amounts in US Dollar million)Particulars March 31, 2012 March 31, 2011Forward contracts – Sell 30.50 Nilin US DollarAs of balance sheet date, the Group’s net foreign currency exposure that is not hedged is ` 22,430.78 (March 31, 2011 ` 18,281.90).
Note 24: Share based compensation/payments
a) Employee Stock Purchase Scheme (‘ESPS’)
The Company has adopted the ESPS administered through a Trust (“the Trust”) to provide equity based incentives to key employees of the Company. As per the scheme, the Trust can purchase shares of the Company from market using the proceeds of loans obtained from the Company. Such shares are allocated by the Trust to nominated employees at an exercise price, which approximates the fair value on the date of the grant. The shares vest in the employees over a period of five years and the employees can purchase the shares from the Trust over a period of ten years based on continued employment, until which, the Trust holds the shares for the benefit of the employees. The employees are entitled to receive dividends, bonus, etc., that may be declared by the Company from time to time for the entire portion of shares held by the Trust on behalf of the employees.
On the acceptance of the offer, the selected employee undertakes to purchase the shares from the Trust within ten years from the date of acceptance of the offer. In case an employee resigns from employment, the rights relating to vested shares, which are eligible for exercise, may be purchased by the employee by payment of the exercise price whereas, the balance shares are forfeited in favor of the Trust. The Trustees have the right of recourse against the employees for any amounts that may remain unpaid on the shares accepted by them. As of the Balance Sheet date, the Trust has repaid the entire loan obtained from the Company on receipt of payments from employees against shares exercised.
The Securities and Exchange Board of India (‘SEBI’) has issued the Employee Stock Option Scheme and Stock Purchase Guidelines, 1999 (‘SEBI guidelines’), which are applicable to stock purchase schemes for employees of all Indian listed companies. In accordance with these guidelines, the excess of market price of the underlying equity shares on the date of grant of the stock options over the exercise price of the options is to be recognized in the books of account and amortized over the vesting period. However, no compensation cost has been recorded as the scheme terms are fixed and the exercise price equals the market price of the underlying stock on the grant date.

67
A summary of the activity in the Company’s ESPS is as follows: Year ended
March 31, 2012Year ended
March 31, 2011
Number of shares Number of sharesOpening balance of unallocated shares 166,142 165,150Shares forfeited during the year – 992Closing balance of unallocated shares 166,142 166,142
Opening balance of allocated shares 29,081 54,548Shares exercised during the year (10,264) (24,475)Shares forfeited during the year – (992)Closing balance of allocated shares 18,817 29,081
Shares eligible for exercise 18,817 29,081Shares not eligible for exercise – –Total allocated shares 18,817 29,081
b) Employee Stock Option Plan (‘ESOP’)
Pursuant to ESOP scheme approved by the shareholders of the Company on August 14, 2001, the Board of Directors, on March 4, 2002 approved the Employees Stock Option Scheme (“Scheme 2002”) for issue of 4,753,600 options to the employees and directors of the Company and its subsidiaries. According to the Scheme 2002, the Company has granted 4,548,920 options prior to the IPO and 619,000 options at various dates after IPO (including the grants of options out of options forfeited earlier).
On August 25, 2010, the Board of Directors approved the Employees Stock Option Plan 2010 Scheme (“Scheme 2010”) for issue of 618,000 options to the employees and directors of the Company and its subsidiaries. According to the Scheme 2010, the Company has granted 638,000 options (including the grants of options out of options forfeited earlier).
Pursuant to ESOP scheme approved by the shareholders of the Company in their meeting held on August 18, 2011, the Board of Directors approved the Employees Stock Option Plan 2011 Scheme (“Scheme 2011”) for issue of 5,100,000 options to the employees and directors of the Company and its subsidiaries. According to the Scheme 2011, the Company has granted 640,500 options till March 31, 2012.
As per the above schemes, each of 20% of the total options granted will vest to the eligible employees and directors on completion of 12, 24, 36, 48 and 60 months from the date of grant and is subject to continued employment of the employee or directorship of the director with the Company or its subsidiaries. Options have exercise period of 10 years from the date of grant. The employee pays the exercise price upon exercise of option.
A summary of the activity in the Company’s ESOP (Scheme 2002) is as follows:
Year ended March 31, 2012 Year ended March 31, 2011 Shares arising from options
Weighted average exercise price (`)
Shares arising from options
Weighted average exercise price (`)
Outstanding at beginning of year 245,837 1,414 242,382 1,152Granted – – 60,000 2,333Exercised (78,275) 932 (39,945) 1,255Forfeited (22,350) 1,107 (16,600) 1,291Outstanding at end of the year 145,212 1,721 245,837 1,414
Vested options 97,212 141,537Unvested options 48,000 104,300

Oracle Financial Services Software – Annual Report 2011-2012
A summary of the activity in the Company’s ESOP (Scheme 2010) is as follows:
Year ended March 31, 2012 Year ended March 31, 2011 Shares arising from options
Weighted average exercise price (`)
Shares arising from options
Weighted average exercise price (`)
Outstanding at beginning of year 561,865 2,050 – –Granted 20,000 2,342 618,000 2,050Exercised (680) 2,050 – –Forfeited (152,841) 2,050 (56,135) 2,050Outstanding at end of the year 428,344 2,064 561,865 2,050
Vested options 81,596 –Unvested options 346,748 561,865
A summary of the activity in the Company’s ESOP (Scheme 2011) is as follows:
Year ended March 31, 2012 Year ended March 31, 2011 Shares arising from options
Weighted average exercise price (`)
Shares arising from options
Weighted average exercise price (`)
Outstanding at beginning of year – – – –Granted 640,500 1,936 – –Exercised – – – –Forfeited (23,000) 1,930 – –Outstanding at end of the year 617,500 1,937 – –
Vested options – –Unvested options 617,500 –
The weighted average share price for the year over which stock options were exercised was ` 2,234 (March 31, 2011 - ` 2,188).
The details of options unvested and options vested and exercisable as on March 31, 2012 are as follows:
Exercise prices (`)
Options Weighted average exercise price (`)
Weighted average
remaining contractual life (Years)
Options unvested 1,930 577,500 1,930 9.72,032 40,000 2,032 9.72,050 326,748 2,050 8.42,333 48,000 2,333 8.62,342 20,000 2,342 9.3
Options vested and exercisable 515 32 515 1.3 1,291 85,180 1,291 4.1
2,050 81,596 2,050 8.42,333 12,000 2,333 8.6
1,191,056 1,956 8.8

69
The details of options unvested and options vested and exercisable as on March 31, 2011 were as follows:
Exercise prices (`)
Options Weighted average exercise price (`)
Weighted average
remaining contractual life (Years)
Options unvested 1,291 44,300 1,291 5.12,050 561,865 2,050 9.42,333 60,000 2,333 9.6
Options vested and exercisable 265 31,400 265 0.9 515 32 515 2.3
1,291 110,105 1,291 5.1807,702 1,856 8.3
Stock Options granted during the year ended March 31, 2012:
The weighted average fair value of stock options granted during the year was ` 1,195 (March 31, 2011 - ` 844).
The Black Scholes valuation model has been used for computing the above weighted average fair value of stock options granted considering the following inputs:
Scheme 2010 Scheme 2011 Scheme 2011
Exercise Price (`) 2,342 1,930 2,032Expected Volatility 48% 50% 50%Historical Volatility 48% 50% 50%Life of the options granted (Vesting and exercise period) in years 10 10 10Expected dividends Nil Nil NilAverage risk-free interest rate 8.50% 8.40% 8.40%Expected dividend rate Nil Nil Nil
The expected volatility was determined based on historical volatility data; historical volatility includes early years of the Company’s life; the Company expects the volatility of its share price to reduce as it matures.
The Company measures the cost of ESOP using intrinsic value method. Had compensation cost been determined in a manner consistent with the fair value approach, the Company’s net profit and earnings per share as reported would have changed to the amounts indicated below:
(Amounts in ` million, except share data) Year ended
March 31, 2012Year ended
March 31, 2011
Profit as reported 9,092.73 11,109.89Add: Employee stock compensation under intrinsic value method Nil NilLess: Employee stock compensation under fair value method (190.48) (132.72)Proforma profit 8,902.25 10,977.17Earnings Per ShareBasic - As reported 108.34 132.45 - Pro forma 106.07 130.86Diluted - As reported 108.23 132.25 - Pro forma 106.01 130.67

Oracle Financial Services Software – Annual Report 2011-2012
Note 25: Employee Benefits Obligation
Defined contribution plans During the year ended March 31, 2012 and 2011, the Group contributed following amounts to defined contributions plans:
(Amounts in ` million, except share data) Particulars Year ended
March 31, 2012Year ended
March 31, 2011Provident fund 212.02 193.33Superannuation fund 81.52 61.64
293.54 254.97
Defined benefit plan - gratuity
The amounts recognized in the statement of profit and loss are as follows:
Particulars Year ended March 31, 2012
Year ended March 31, 2011
Current service cost 63.77 48.11Interest cost 33.06 22.34Expected return on plan assets (0.32) (0.18)Past service cost Nil 55.64Recognized net actuarial loss 22.87 37.58Total included in ‘employee benefit expense’ 119.38 163.49
Actual return on plan assets 0.61 0.62
The amounts recognized in the balance sheet are as follows:
Particulars March 31, 2012 March 31, 2011Present value of funded obligations 408.90 370.12Present value of unfunded obligations 27.99 24.12Total defined benefit obligations 436.89 394.24Fair value of plan assets (1.45) (15.12)Net liability 435.44 379.12
Changes in present value of defined benefit obligation representing reconciliation of opening and closing balances thereof are as follows:
Particulars Year ended March 31, 2012
Year ended March 31, 2011
Defined benefit obligation at beginning of the year 394.24 273.81Current service cost 63.77 48.11Interest cost 33.06 22.34Benefits paid (80.64) (43.69)Actuarial loss 23.15 38.03Past service cost Nil 55.64Liabilities related to employees transferred from a subsidiary 3.31 NilDefined benefit obligation at end of the year 436.89 394.24
Changes in the fair value of plan assets representing reconciliation of opening and closing balances thereof are as follows:
Particulars Year endedMarch 31, 2012
Year ended March 31, 2011
Fair value of plan assets at beginning of the year 15.12 2.36Expected return on plan assets 0.32 0.18Actuarial gain 0.28 0.45Contributions by employer 56.24 53.49Benefits paid (73.82) (41.36)Liabilities related to employees transferred from a subsidiary 3.31 NilFair value of plan assets at end of the year 1.45 15.12
Plan assets are administered by LIC and 100% of the plan assets are invested in lower risk assets, primarily in debt securities.

71
The assumptions used in accounting for the gratuity plan are set out as below:
March 31, 2012 March 31, 2011Discount rate 8.30%-8.47% 7.60%-7.94%Expected returns on plan assets 7.50% 7.50%Salary escalation rate 6.00%-8.00% 6.00%-8.00%
The estimates of future salary increase, considered in actuarial valuation, take account of inflation, seniority, promotions and other relevant factors such as supply and demand in the employment market.
The Group evaluates these assumptions annually based on its long-term plans of growth and industry standards. The discount rates are based on current market yields on government bonds consistent with the currency and estimated term of the post employment benefits obligations. Plan assets are administered by the LIC and invested in lower risk assets, primarily debt securities. The expected rate of return on plan assets is based on the expected average long term rate of return on investments of the fund during the terms of the obligation.
The Group’s contribution for the year ending March 31, 2013 is expected to be ` 90.22.
The expected benefit payments as of March 31, 2012 are below::
Year ending March 31, Amount2013 91.71 2014 84.39 2015 83.49 2016 87.192017 92.002018-2022 416.55
Present value of the defined benefit obligation, fair value of the plan assets, deficit and experience adjustments in the plan assets and liabilities for current and previous four years are as follows:
Particulars Year ended March 31, 2012
Year ended March 31, 2011
Year ended March 31, 2010
Year ended March 31, 2009
Year ended March 31, 2008
Present value of funded obligations (408.90) (370.12) (257.77) (231.67) (174.00)Present value of unfunded obligations (27.99) (24.12) (16.04) (8.07) (2.74)Fair value of plan assets 1.45 15.12 2.36 1.47 0.23Deficit (435.44) (379.12) (271.45) (238.27) (176.51)
Experience adjustments on plan liabilities 37.17 48.35 (10.68) 3.20 18.05Experience adjustments on plan assets 0.28 0.45 (2.18) 0.26 (0.47)
Note 26: Segment information
Business segments are defined as a distinguishable component of an enterprise that is engaged in providing a group of related products or services and that is subject to differing risks and returns and about which separate financial information is available. This information is reviewed and evaluated regularly by the management in deciding how to allocate resources and in assessing the performance.
The Group is organized by business segment and geographically. For management purposes the Group is primarily organized on a worldwide basis into three business segments:
a) Product licenses and related activities (‘Products’)
b) IT solutions and consulting services (‘Services’) and
c) Business Processing Services (‘BPO - Services’)
The business segments are the basis on which the Group reports its primary operational information to management. Product licenses and related activities segment deals with various banking software products. The related activities include enhancements, implementation and maintenance activities.
IT solutions and consulting services segment offers services spanning the entire lifecycle of applications used by financial service institutions. The division’s portfolio includes Consulting, Application, Support and Technology Services that help institutions improve efficiency, optimize costs, meet risk and compliance mandates and implement IT solutions finely attuned to their business needs.
BPO - Services comprises of business process outsourcing services to the Lending, Collections, Customer Service, Capital Markets industry.

Oracle Financial Services Software – Annual Report 2011-2012
(Amounts in ` million, except share data)Year ended
March 31, 2012
Particulars Products Services BPO - Services Total Revenue 22,822.81 7,821.55 822.40 31,466.76
Segment result 9,744.61 1,954.75 285.24 11,984.60 Unallocable expenses (1,339.75)Other income, net 4,217.49 Profit before exceptional item and tax 14,862.34 Exceptional item [Refer note 19] (693.32)Profit before tax 14,169.02 Tax expenses [Refer note 28] (5,076.29)Net profit 9,092.73
Year ended March 31, 2011
Particulars Products Services BPO - Services Total Revenue 19,965.43 9,274.40 729.49 29,969.32
Segment result 9,687.98 2,309.70 232.69 12,230.37 Unallocable expenses (1,296.55)Other income, net 1,668.26 Profit before exceptional item and tax 12,602.08 Exceptional item [Refer note 19] (122.07)Profit before tax 12,480.01 Tax expenses [Refer note 28] (1,370.12)Net profit 11,109.89
Year ended March 31, 2012
Other information Particulars Products Services BPO -
Services Unallocable Total
Capital expenditure by segment Tangible assets 469.81 361.51 9.59 131.56 972.47 Depreciation and amortization 195.71 163.69 21.99 84.78 466.17 Other non cash expenses (80.00) (31.63) (1.75) – (113.38)Segment assets 18,402.49 4,173.98 245.72 49,357.52 72,179.71 Segment liabilities 6,190.42 2,096.91 136.07 581.41 9,004.81 Share application money pending allotment – – – 1.24 1.24 Shareholders' funds – – – 63,173.66 63,173.66
Year ended March 31, 2011
Other information Particulars Products Services BPO -
Services Unallocable Total
Capital expenditure by segment Tangible assets 717.44 556.08 0.94 118.92 1,393.38 Depreciation and amortization 158.08 165.13 19.08 65.88 408.17 Other non cash expenses 186.19 43.66 1.02 – 230.87 Segment assets 15,799.70 4,386.18 244.66 40,862.68 61,293.22 Segment liabilities 3,729.01 797.21 124.57 2,585.05 7,235.84 Share application money pending allotment – – – 0.78 0.78 Shareholders' funds – – – 54,056.60 54,056.60
Segment revenue and expense:
Revenue is generated through licensing of software products as well as by providing software solutions to the customers including consulting services and business process outsourcing services. The expenses which are not directly attributable to a business segment are classified as unallocable expenses.

73
Segment assets and liabilities:
Segment assets include all operating assets used by a segment and consist principally of debtors, net of allowances, unbilled revenue, deposits for premises and fixed assets. Segment liabilities primarily includes deferred revenues, advance from customer, Accrued employee cost and other current liabilities. While most such assets and liabilities can be directly attributed to individual segments, the carrying amount of certain assets and liabilities used jointly by two or more segments is allocated to segments on a reasonable basis. Assets and liabilities that cannot be allocated between the segments are shown as part of unallocable assets and liabilities.
Geographical segments
The following table shows the distribution of the Group’s consolidated sales by geographical market:
Year ended March 31, 2012
Year ended March 31, 2011
Regions Amount % Amount %United States of America 10,670.58 34% 9,214.45 31%Europe 6,238.09 20% 7,896.37 26%Asia Pacific 9,342.97 30% 7,443.21 25%Middle East, India and Africa 4,528.60 14% 4,362.01 15%Latin America and Caribbean 686.52 2% 1,053.28 3%
31,466.76 100% 29,969.32 100%
The following table shows the Group’s consolidated assets by geographical market:
Year ended March 31, 2012
Year ended March 31, 2011
Regions Amount % Amount %United States of America 9,078.88 13% 8,193.71 13%Europe 5,028.98 7% 6,308.34 10%Asia Pacific 9,055.63 13% 5,933.23 10%Middle East, India and Africa 48,658.29 66% 40,602.80 66%Latin America and Caribbean 357.93 1% 255.14 1%
72,179.71 100% 61,293.22 100%
The following table shows the Group’s consolidated additions to fixed assets & intangible assets by geographical market:
Year ended March 31, 2012
Year ended March 31, 2011
Regions Amount % Amount %United States of America 12.36 1% 14.92 1%Europe 49.57 5% 1.33 0%Asia Pacific 8.82 1% 9.33 1%Middle East, India and Africa 901.06 93% 1,364.18 98%Latin America and Caribbean 0.66 0% 3.62 0%
972.47 100% 1,393.38 100%
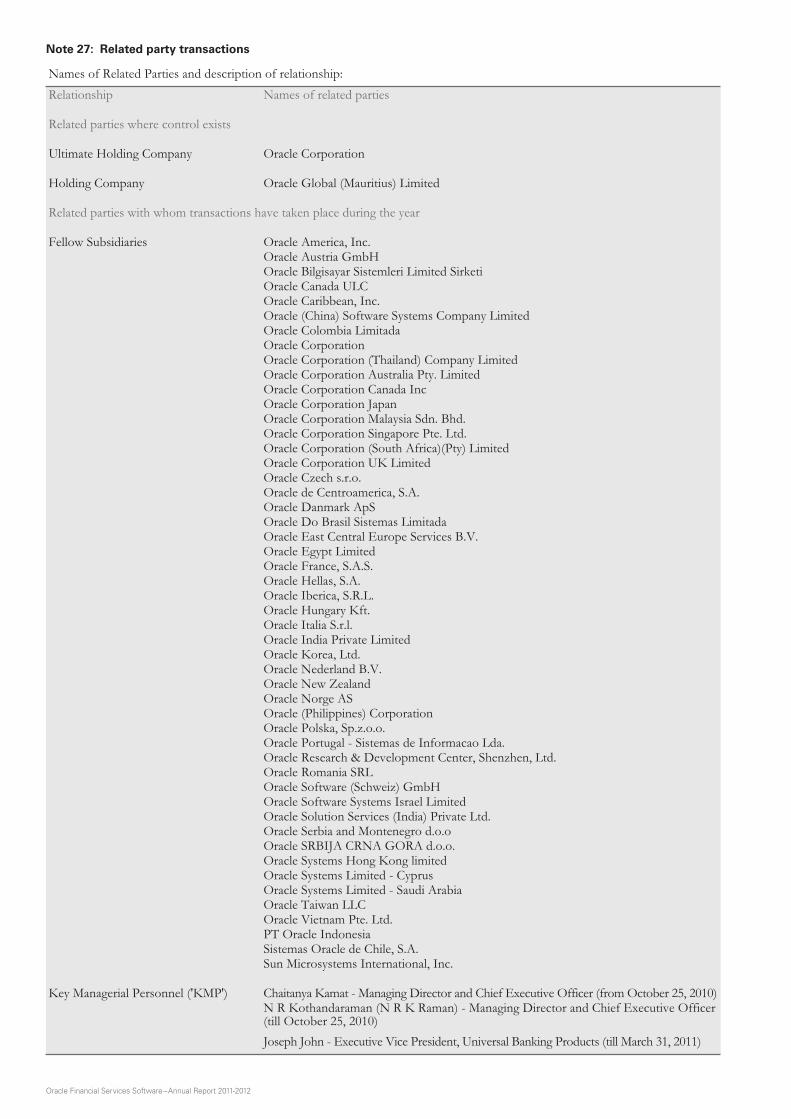
Oracle Financial Services Software – Annual Report 2011-2012
Note 27: Related party transactions
Names of Related Parties and description of relationship:Relationship Names of related parties
Related parties where control exists
Ultimate Holding Company Oracle Corporation
Holding Company Oracle Global (Mauritius) Limited
Related parties with whom transactions have taken place during the year
Fellow Subsidiaries Oracle America, Inc.Oracle Austria GmbHOracle Bilgisayar Sistemleri Limited SirketiOracle Canada ULCOracle Caribbean, Inc.Oracle (China) Software Systems Company LimitedOracle Colombia LimitadaOracle CorporationOracle Corporation (Thailand) Company LimitedOracle Corporation Australia Pty. LimitedOracle Corporation Canada IncOracle Corporation JapanOracle Corporation Malaysia Sdn. Bhd.Oracle Corporation Singapore Pte. Ltd.Oracle Corporation (South Africa)(Pty) LimitedOracle Corporation UK LimitedOracle Czech s.r.o.Oracle de Centroamerica, S.A.Oracle Danmark ApSOracle Do Brasil Sistemas LimitadaOracle East Central Europe Services B.V.Oracle Egypt LimitedOracle France, S.A.S.Oracle Hellas, S.A.Oracle Iberica, S.R.L.Oracle Hungary Kft.Oracle Italia S.r.l.Oracle India Private LimitedOracle Korea, Ltd.Oracle Nederland B.V.Oracle New ZealandOracle Norge ASOracle (Philippines) CorporationOracle Polska, Sp.z.o.o.Oracle Portugal - Sistemas de Informacao Lda.Oracle Research & Development Center, Shenzhen, Ltd.Oracle Romania SRLOracle Software (Schweiz) GmbHOracle Software Systems Israel LimitedOracle Solution Services (India) Private Ltd.Oracle Serbia and Montenegro d.o.oOracle SRBIJA CRNA GORA d.o.o.Oracle Systems Hong Kong limitedOracle Systems Limited - CyprusOracle Systems Limited - Saudi ArabiaOracle Taiwan LLCOracle Vietnam Pte. Ltd.PT Oracle IndonesiaSistemas Oracle de Chile, S.A.Sun Microsystems International, Inc.
Key Managerial Personnel ('KMP') Chaitanya Kamat - Managing Director and Chief Executive Officer (from October 25, 2010)N R Kothandaraman (N R K Raman) - Managing Director and Chief Executive Officer (till October 25, 2010)Joseph John - Executive Vice President, Universal Banking Products (till March 31, 2011)

75
Transactions and balances outstanding with these parties are described below:
(Amounts in ` million, except share data)Transactions Amount receivable (payable)
Year ended March 31, 2012
Year ended March 31, 2011
As at March 31, 2012
As at March 31, 2011
RevenueFellow SubsidiariesOracle America, Inc. 916.02 622.44 358.45 184.70 Oracle (Philippines) Corporation 128.85 15.27 111.29 12.38 Oracle Austria GmbH 2.73 12.66 2.79 2.77 Oracle Bilgisayar Sistemleri Limited Sirketi 1.21 1.14 2.95 0.44 Oracle Canada ULC 115.83 – 75.71 – Oracle (China) Software Systems Company Limited 47.11 – – – Oracle Corporation Canada Inc – 88.06 – 26.89 Oracle Colombia Limitada 343.03 155.73 197.75 141.82 Oracle Corporation (South Africa)(Pty) Limited 179.12 105.41 104.07 21.22 Oracle Corporation (Thailand) Company Limited 177.62 101.34 91.33 88.46 Oracle Corporation Australia Pty. Limited 3,431.61 2,587.91 1,597.38 1,696.14 Oracle Corporation Malaysia Sdn. Bhd. 19.22 24.25 37.21 23.17 Oracle Corporation Singapore Pte. Ltd. 3.75 19.74 1.78 3.29 Oracle Corporation UK Limited 176.24 670.95 343.53 925.56 Oracle Czech s.r.o. 30.21 – 21.09 – Oracle Danmark ApS 16.90 – 7.12 – Oracle de Centroamerica, S.A. – 1.32 – 0.23 Oracle Do Brasil Sistemas Limitada 60.18 1.82 2.04 1.78 Oracle East Central Europe Services B.V. 283.49 81.32 163.96 (11.51)Oracle Egypt Limited 28.78 28.51 35.28 18.47 Oracle Hellas, S.A. – 0.20 – – Oracle Hungary Kft. 35.38 7.76 26.43 – Oracle Iberica, S.R.L. 6.96 32.17 7.49 38.47 Oracle India Private Limited 1.92 4.51 1.80 – Oracle Italia S.r.l. 37.38 – 34.38 – Oracle Nederland B.V. 96.71 31.66 2.24 23.69 Oracle New Zealand 46.54 – – – Oracle Norge AS 51.69 104.48 39.86 23.31 Oracle Polska, Sp.z.o.o. 56.47 7.36 30.25 1.36 Oracle Portugal - Sistemas de Informacao Lda. 219.03 164.30 201.55 112.09 Oracle Software (Schweiz) GmbH 2.66 – 2.63 – Oracle Serbia and Montenegro d.o.o 10.36 – – – Oracle SRBIJA CRNA GORA d.o.o. 9.80 – 1.51 – Oracle Systems Hong Kong limited 457.14 109.25 113.45 71.21 Oracle Systems Limited - Saudi Arabia 168.86 46.93 186.49 15.83 Oracle Taiwan LLC 100.49 – 114.07 – Oracle Vietnam Pte. Ltd. 103.33 11.09 37.16 10.78 PT Oracle Indonesia 79.11 0.73 9.43 – Oracle Romania SRL 181.41 11.28 110.54 – Sistemas Oracle de Chile, S.A. 0.45 3.17 – –
Unbilled revenueFellow SubsidiariesOracle America, Inc. – – 285.36 161.82 Oracle Bilgisayar Sistemleri Limited Sirketi – – – 0.84 Oracle (China) Software Systems Company Limited – – 47.11 – Oracle Canada ULC – – 29.57 – Oracle Colombia Limitada – – 48.02 34.55 Oracle Corporation (South Africa)(Pty) Limited – – 29.03 36.46 Oracle Corporation (Thailand) Company Limited – – 90.30 22.47 Oracle Corporation Australia Pty. Limited – – 591.18 333.92 Oracle Corporation Canada Inc – – – 36.69 Oracle Corporation Malaysia Sdn. Bhd. – – 7.27 6.70 Oracle Corporation UK Limited – – (5.28) – Oracle Czech s.r.o. – – 7.01 – Oracle Danmark ApS – – 7.01 –

Oracle Financial Services Software – Annual Report 2011-2012
(Amounts in ` million, except share data)Transactions Amount receivable (payable)
Year ended March 31, 2012
Year ended March 31, 2011
As at March 31, 2012
As at March 31, 2011
Oracle East Central Europe Services B.V. – – 25.26 34.17 Oracle Egypt Limited – – 12.29 – Oracle Hungary Kft. – – 8.34 7.74 Oracle India Private Limited – – – 2.99 Oracle Italia S.r.l. – – 2.04 – Oracle Nederland B.V. – – 82.96 – Oracle New Zealand – – 46.54 – Oracle Norge AS – – 1.23 5.95 Oracle (Philippines) Corporation – – 2.64 2.75 Oracle Serbia and Montenegro d.o.o – – 10.36 – Oracle SRBIJA CRNA GORA d.o.o. – – 1.91 – Oracle Polska, Sp.z.o.o. – – 6.09 5.47 Oracle Portugal – Sistemas de Informacao Lda. – – 15.77 6.76 Oracle Romania SRL – – 39.38 11.26 Oracle Systems Hong Kong limited – – 130.94 30.85 Oracle Systems Limited - Saudi Arabia – – 8.08 31.00 Oracle Taiwan LLC – – 1.55 – Oracle Vietnam Pte. Ltd. – – 36.76 1.44 PT Oracle Indonesia – – 10.75 – Sistemas Oracle de Chile, S.A. – – 0.45 –
Provision for doubtful debtsFellow subsidiariesOracle America, Inc. 1.18 (4.11) (9.25) (8.07)Oracle Portugal - Sistemas de Informacao Lda. – (1.45) – – PT Oracle Indonesia – (0.06) – –
Application software expensesFellow subsidiariesOracle India Private Limited 64.40 51.27 (18.90) (14.30)Oracle Systems Limited - Saudi Arabia 0.37 – (0.74) – Oracle Caribbean, Inc. – 0.49 (0.21) (0.30)Oracle Software Systems Israel Limited 0.42 0.22 – –
Professional fee expensesFellow subsidiariesOracle America, Inc. 0.04 5.30 – (4.78)Oracle Bilgisayar Sistemleri Limited Sirketi (0.01) 0.01 – (0.01)Oracle Canada ULC 0.12 – – – Oracle Do Brasil Sistemas Limitada – 0.01 (0.01) (0.01)Oracle Corporation Canada Inc – 1.59 – (1.59)Oracle Corporation (South Africa)(Pty) Limited – 0.34 – (0.34)Oracle Corporation (Thailand) Company Limited (0.73) 2.27 (1.54) (2.27)Oracle Corporation Australia Pty. Limited 1.65 45.66 (0.59) (29.45)Oracle Corporation Malaysia Sdn. Bhd. 0.02 0.40 (0.12) (0.40)Oracle de Centroamerica, S.A. – 0.04 – (0.04)Oracle Egypt Limited – 1.39 (0.18) (1.39)Oracle Hellas, S.A. – 0.01 – (0.01)Oracle India Private Limited 89.71 0.05 (80.74) (0.05)Oracle Nederland B.V. (0.00) 0.78 – – Oracle Polska, Sp.z.o.o. 0.00 0.05 – (0.05)Oracle Portugal - Sistemas de Informacao Lda. 0.01 1.70 (1.33) (1.70)Oracle Software Systems Israel Limited (0.00) 0.08 – (0.08)Oracle Solution Services (India) Private Ltd. 1.84 – – – Oracle Systems Hong Kong limited (0.11) 0.50 – (0.50)Oracle Systems Limited - Saudi Arabia – 0.11 – (0.11)Oracle Vietnam Pte. Ltd. (0.05) 0.12 – (0.12)PT Oracle Indonesia 0.00 0.03 – (0.03)Sistemas Oracle de Chile, S.A. (0.11) 0.11 – (0.11)Oracle Research & Development Center, Shenzhen, Ltd. 133.23 63.05 (81.54) (74.99)

77
(Amounts in ` million, except share data)Transactions Amount receivable (payable)
Year ended March 31, 2012
Year ended March 31, 2011
As at March 31, 2012
As at March 31, 2011
Other expensesFellow subsidiariesOracle America, Inc. 0.26 20.34 – (20.22)Oracle India Private Limited 1.39 4.84 – – Oracle Caribbean, Inc. – 0.28 – (0.28)Oracle Corporation Singapore Pte. Ltd. 1.48 – (0.16) – Oracle Corporation (South Africa)(Pty) Limited 12.39 31.54 – – Oracle Nederland B.V. – 3.17 – – Oracle Hellas, S.A. 0.50 0.20 – – Sistemas Oracle de Chile, S.A. – 0.11 – (0.11)Sun Microsystems International, Inc. – 0.93 – (0.93)Oracle Corporation Canada Inc – 1.68 – (1.68)Oracle Do Brasil Sistemas Limitada – 0.01 – (0.01)
Procurement of fixed assetsFellow SubsidiariesOracle Corporation Singapore Pte. Ltd. 46.91 11.39 – –
Deferred RevenueFellow subsidiariesOracle America, Inc. – – (20.82) (10.96)Oracle Austria GmbH – – (1.50) (1.75)Oracle Colombia Limitada – – (24.35) (21.22)Oracle Corporation (Thailand) Company Limited – – (6.93) (1.12)Oracle Corporation Australia Pty. Limited – – (210.28) (96.97)Oracle Corporation Malaysia Sdn. Bhd. – – (15.99) (18.40)Oracle Corporation Singapore Pte. Ltd. – – (1.99) (1.74)Oracle Corporation UK Limited – – (149.50) (130.79)Oracle Corporation (South Africa)(Pty) Limited – – (3.36) (3.01)Oracle East Central Europe Services B.V. – – (6.01) (6.51)Oracle Egypt Limited – – (8.33) (8.60)Oracle Iberica, S.R.L. – – (6.43) (6.20)Oracle Italia S.r.l. – – (4.38) – Oracle Nederland B.V. – – (2.32) (1.11)Oracle Norge AS – – (21.53) – Oracle (Philippines) Corporation – – (1.15) (0.39)Oracle Polska, Sp.z.o.o. – – (1.17) – Oracle Portugal - Sistemas de Informacao Lda. – – (28.98) (14.31)Oracle SRBIJA CRNA GORA d.o.o. – – (0.25) – Oracle Systems Hong Kong limited – – (7.51) (6.52)Oracle Systems Limited - Saudi Arabia – – (27.89) – Oracle Taiwan LLC – – (13.43) – Oracle Vietnam Pte. Ltd. – – (2.48) (0.13)PT Oracle Indonesia – – (2.42) –
Security DepositOracle India Private Limited – – 0.89 0.89
Rent expensesFellow subsidiariesOracle India Private Limited 6.17 6.50 – – Oracle Korea, Ltd. 0.15 0.42 – – Oracle (China) Software Systems Company Limited – 0.51 – – Oracle Corporation Australia Pty. Limited 1.98 1.86 – – Oracle Corporation UK Limited (2.31) – (2.31) – Oracle Corporation Singapore Pte. Ltd. 1.30 – 1.30 – Oracle (Philippines) Corporation 0.02 0.10 – (0.02)Oracle Corporation Malaysia Sdn. Bhd. 0.19 0.36 0.03 (0.03)

Oracle Financial Services Software – Annual Report 2011-2012
As per our report of even date For and on behalf of the Board of Directors Oracle Financial Services Software Limited
For S. R. Batliboi & AssociatesFirm Registration No. 101049WChartered Accountants
Chaitanya KamatManaging Director& Chief Executive Officer
Y M Kale Director
per Amit MajmudarPartnerMembership No.: 36656
Hoshi D Bhagwagar Company Secretary & Compliance Officer
S VenkatachalamDirector
Mumbai, IndiaMay 11, 2012
Mumbai, IndiaMay 11, 2012
(Amounts in ` million, except share data)Transactions Amount receivable (payable)
Year ended March 31, 2012
Year ended March 31, 2011
As at March 31, 2012
As at March 31, 2011
Oracle America, Inc. 17.03 (4.14) – (0.09)Oracle Systems Limited - Cyprus 0.43 0.43 (0.08) (0.03)Oracle Systems Hong Kong limited 1.58 1.06 0.13 – Oracle Nederland B.V. 7.09 12.90 1.86 (3.50)Oracle France, S.A.S. 1.94 3.01 – (0.37)Oracle Taiwan LLC 0.92 0.78 0.08 – Oracle Corporation Japan 22.54 20.11 – – Sistemas Oracle de Chile, S.A. 18.47 13.22 – (13.22)
Advance received from CustomersFellow subsidiariesOracle America, Inc. (28.49) (275.31) (39.39) (67.88)Oracle Colombia Limitada 0.04 – (0.04) – Oracle Corporation Australia Pty. Limited 35.68 12.85 (61.37) (25.69)Oracle East Central Europe Services B.V. 54.03 – (54.03) – Oracle Egypt Limited – (2.64) – –
Key Managerial personnelRemuneration [Refer note 1 below] 29.41 40.32 – –
Note 1: Remuneration includes salary, bonus and perquisites. The bonus is included on payment basis. As the liabilities for gratuity and compensated absence are provided on an actuarial basis for the Company as a whole, the amounts pertaining to individual KMP are not included above. During the year, 30,000 options under the Scheme 2011 (March 31, 2011 - 60,000 options under the Scheme 2002 and 10,600 options under the Scheme 2010) were granted to KMP.
Note 28: Provision for taxes
a) Breakup of current tax is as follows:(Amounts in ` million, except share data)
Year ended March 31, 2012 2011
Current tax 5,030.25 3,099.17 Less: MAT credit entitlement – (1,426.88)Net Current tax 5,030.25 1,672.29
b) During the year ended March 31, 2011, the Group has recorded net income tax expense of ` 439.73 related to previous years.
Note 29:
Till the year ended March 31, 2011, the Company was using pre-revised Schedule VI to the Companies Act 1956, for preparation and presentation of its financial statements. During the year ended March 31, 2012, the revised Schedule VI notified under the Companies Act 1956, has become applicable to the Company. The Company has reclassified previous year figures to conform to this year’s classification.
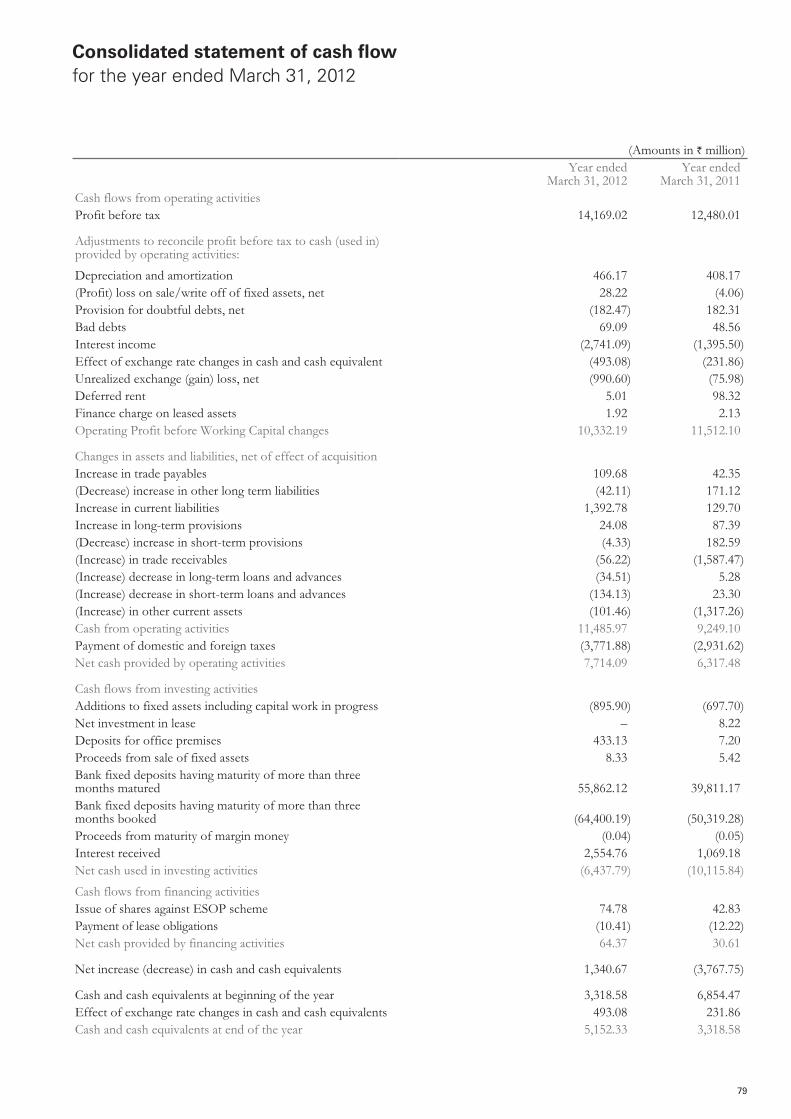
79
(Amounts in ` million)Year ended
March 31, 2012Year ended
March 31, 2011Cash flows from operating activitiesProfit before tax 14,169.02 12,480.01
Adjustments to reconcile profit before tax to cash (used in) provided by operating activities:Depreciation and amortization 466.17 408.17 (Profit) loss on sale/write off of fixed assets, net 28.22 (4.06)Provision for doubtful debts, net (182.47) 182.31 Bad debts 69.09 48.56 Interest income (2,741.09) (1,395.50)Effect of exchange rate changes in cash and cash equivalent (493.08) (231.86)Unrealized exchange (gain) loss, net (990.60) (75.98)Deferred rent 5.01 98.32 Finance charge on leased assets 1.92 2.13 Operating Profit before Working Capital changes 10,332.19 11,512.10
Changes in assets and liabilities, net of effect of acquisitionIncrease in trade payables 109.68 42.35 (Decrease) increase in other long term liabilities (42.11) 171.12 Increase in current liabilities 1,392.78 129.70 Increase in long-term provisions 24.08 87.39 (Decrease) increase in short-term provisions (4.33) 182.59 (Increase) in trade receivables (56.22) (1,587.47)(Increase) decrease in long-term loans and advances (34.51) 5.28 (Increase) decrease in short-term loans and advances (134.13) 23.30 (Increase) in other current assets (101.46) (1,317.26)Cash from operating activities 11,485.97 9,249.10 Payment of domestic and foreign taxes (3,771.88) (2,931.62)Net cash provided by operating activities 7,714.09 6,317.48
Cash flows from investing activitiesAdditions to fixed assets including capital work in progress (895.90) (697.70)Net investment in lease – 8.22 Deposits for office premises 433.13 7.20 Proceeds from sale of fixed assets 8.33 5.42 Bank fixed deposits having maturity of more than three months matured 55,862.12 39,811.17 Bank fixed deposits having maturity of more than three months booked (64,400.19) (50,319.28)Proceeds from maturity of margin money (0.04) (0.05)Interest received 2,554.76 1,069.18 Net cash used in investing activities (6,437.79) (10,115.84)Cash flows from financing activitiesIssue of shares against ESOP scheme 74.78 42.83 Payment of lease obligations (10.41) (12.22)Net cash provided by financing activities 64.37 30.61
Net increase (decrease) in cash and cash equivalents 1,340.67 (3,767.75)
Cash and cash equivalents at beginning of the year 3,318.58 6,854.47 Effect of exchange rate changes in cash and cash equivalents 493.08 231.86 Cash and cash equivalents at end of the year 5,152.33 3,318.58
Consolidated statement of cash flowfor the year ended March 31, 2012

Oracle Financial Services Software – Annual Report 2011-2012
Consolidated statement of cash flow (continued)for the year ended March 31, 2012
Year ended March 31, 2012
Year ended March 31, 2011
Component of cash and cash equivalentsCash on hand 2.14 1.56 Cheques on hand 0.55 0.49 Balances with banks: Current accounts* 4,580.70 2,961.81 Deposit accounts with original maturity of less than 3
months 566.73 351.26 Unclaimed dividend accounts 2.21 3.46 Total cash and cash equivalents [Refer note 14 (a)] 5,152.33 3,318.58
* Includes balance of ` Nil (March 31, 2011 - ` 24.32) with Central Bank of Libya which is not freely remissible to the Company due to unstable conditions in Libya.
As per our report of even date For and on behalf of the Board of Directors Oracle Financial Services Software Limited
For S. R. Batliboi & AssociatesFirm Registration No. 101049WChartered Accountants
Chaitanya KamatManaging Director& Chief Executive Officer
Y M Kale Director
per Amit MajmudarPartnerMembership No.: 36656
Hoshi D Bhagwagar Company Secretary & Compliance Officer
S VenkatachalamDirector
Mumbai, IndiaMay 11, 2012
Mumbai, IndiaMay 11, 2012

81
Unconsolidated Financials
Financial statements for the year ended March 31, 2012 prepared in accordance with Indian Generally Accepted Accounting Principles (Indian GAAP) (Unconsolidated).

Oracle Financial Services Software – Annual Report 2011-2012
This page has been intentionally left blank.

83
Auditors’ report
To the Members of Oracle Financial Services Software Limited
1. We have audited the attached balance sheet of Oracle Financial Services Software Limited (the ‘Company’) as at March 31, 2012 and also the statement of profit and loss and the cash flow statement for the year ended on that date annexed thereto. These financial statements are the responsibility of the Company’s management. Our responsibility is to express an opinion on these financial statements based on our audit.
2. We conducted our audit in accordance with auditing standards generally accepted in India. Those Standards require that we plan and perform the audit to obtain reasonable assurance about whether the financial statements are free of material misstatement. An audit includes examining, on a test basis, evidence supporting the amounts and disclosures in the financial statements. An audit also includes assessing the accounting principles used and significant estimates made by management, as well as evaluating the overall financial statement presentation. We believe that our audit provides a reasonable basis for our opinion.
3. As required by the Companies (Auditor’s Report) Order, 2003 (as amended) (the ‘Order’) issued by the Central Government of India in terms of sub-section (4A) of Section 227 of the Companies Act, 1956 (the ‘Act’), we enclose in the Annexure a statement on the matters specified in paragraphs 4 and 5 of the said Order.
4. Further to our comments in the Annexure referred to above, we report that:
i. We have obtained all the information and explanations, which to the best of our knowledge and belief were necessary for the purposes of our audit;
ii. In our opinion, proper books of account as required by law have been kept by the Company so far as appears from our examination of those books;
iii. The balance sheet, statement of profit and loss and cash flow statement dealt with by this report are in agreement with the books of account;
iv. In our opinion, the balance sheet, statement of profit and loss and cash flow statement dealt with by this report comply with the accounting standards referred to in sub-section (3C) of section 211 of the Act;
v. On the basis of the written representations received from the directors, as on March 31, 2012, and taken on record by the Board of Directors, we report that none of the directors is disqualified as on March 31, 2012 from being appointed as a director in terms of clause (g) of sub-section (1) of section 274 of the Act; and
vi. In our opinion and to the best of our information and according to the explanations given to us, the said accounts give the information required by the Act, in the manner so required and give a true and fair view in conformity with the accounting principles generally accepted in India:
a) in the case of the balance sheet, of the state of affairs of the Company as at March 31, 2012;
b) in the case of the statement of profit and loss, of the profit for the year ended on that date; and
c) in the case of cash flow statement, of the cash flows for the year ended on that date.
For S. R. Batliboi & Associates Firm registration number: 101049W Chartered Accountants
per Amit Majmudar Partner Membership No.: 36656
Mumbai, India May 11, 2012

Oracle Financial Services Software – Annual Report 2011-2012
(i) (a) The Company has maintained proper records showing full particulars, including quantitative details and situation of fixed assets.
(b) Fixed assets have been physically verified by the management during the year and no material discrepancies were identified on such verification.
(c) There was no disposal of a substantial part of fixed assets during the year.
(ii) Due to the nature of its business, clause 4 (ii) (a) to (c) of the Order, relating to physical verification of inventory are not applicable to the Company.
(iii) (a) According to the information and explanations given to us, the Company has not granted any loans, secured or unsecured to companies, firms or other parties covered in the register maintained under section 301 of the Act. Accordingly, the provisions of clause 4 (iii) (a) to (d) of the Order are not applicable to the Company and hence not commented upon.
(b) According to the information and explanations given to us, the Company has not taken any loans, secured or unsecured from companies, firms or other parties covered in the register maintained under section 301 of the Act. Accordingly, the provisions of clause 4 (iii) (e) to (g) of the Order are not applicable to the Company and hence not commented upon.
(iv) In our opinion and according to the information and explanations given to us, there is an adequate internal control system commensurate with the size of the Company and the nature of its business, for the purchase of fixed assets, sale of licenses and sale of services. During the course of our audit, we have not observed any major weakness or continuing failure to correct any major weakness in the internal control system of the Company in respect of these areas. The activities of the Company do not involve purchase of inventory.
(v) In our opinion there are no contracts or arrangements that need to be entered into the register maintained under section 301 of the Act. Accordingly, the provisions of clause 4 (v) (b) of the Order is not applicable to the Company and hence not commented upon.
(vi) The Company has not accepted any deposits from the public.
(vii) In our opinion, the Company has an internal audit system commensurate with the size of the Company and nature of its business.
(viii) To the best of our knowledge and as explained, the Central Government has not prescribed maintenance of cost records under clause (d) of sub-section (1) of section 209 of the Act for the products of the Company.
(ix) (a) Undisputed statutory dues including provident fund, investor education and protection fund, employees’ state insurance, income-tax, sales-tax, wealth-tax, service tax, customs duty, cess and other material statutory dues have generally been regularly deposited with the appropriate authorities though there have been considerable delays in few cases of service tax, foreign taxes, income tax, value added tax and foreign withholding tax. As explained to us, the Company did not have any dues of excise duty.
(b) According to the information and explanations given to us, undisputed dues in respect of provident fund, investor education and protection fund, employees’ state insurance, income-tax, wealth-tax, service tax, sales-tax, customs duty, cess and other material statutory dues which were outstanding, at the year end for a period of more than six months from the date they became payable are as follows:
Name of the statute
Nature of the dues Amount (Rs) Period to which the amount relates Due Date Date of Payment
Foreign Tax Income Tax 242,606,933 April 2005 to August 2011 Various dates Not yet paid
Value added Tax (‘VAT’) 27,229,963 April 2007 to March 2009 Various dates Not yet paid
Withholding Tax 107,137,477 July 2007 to June 2011 Various dates Not yet paid
Annexure referred to in paragraph 3 of our report of even dateRe: Oracle Financial Services Software Limited (the ‘Company’)

85
(c) According to the records of the Company, the dues outstanding of income-tax, sales-tax, wealth-tax, service tax, custom duty and cess on account of any dispute, are as follows:
Name of the statute Nature of the dues
Amount (Rs) Period to which the amount relates
Forum where dispute is pending
The Karnataka Value Added Tax Act, 2003
VAT and interest, penalty thereon
16,646,456 April 2005 to March 2007 Joint Commissioner of commercial taxes (Appeal)
The Central Sales Tax Act, 1956
CST and interest, penalty thereon
8,009,557 April 2002 to March 2003 and April 2005 to March 2007
Joint Commissioner of commercial taxes (Appeal)
The Karnataka Sales Tax Act, 1957
VAT 145,113 April 2002 to March 2004 Joint Commissioner of commercial taxes(Appeal)
The Karnataka Value Added Tax Act 2003
VAT and penalty thereon
581,668 April 2004 to March 2005 Appellate Tribunal, Bangalore
The Central Sales Tax Act 1956
CST and penalty thereon
616,622 April 2004 to March 2005 Appellate Tribunal, Bangalore
The Income Tax Act, 1961
Income Tax and interest thereon
16,635,399* April 2006 to March 2007 Commissioner of Appeal (Income-tax)
The Income Tax Act, 1961
Income Tax and interest thereon
81,279,735 April 2007 to March 2008 Commissioner of Appeal (Income-tax)
The Income Tax Act, 1961
Income Tax and interest thereon
34,291,770 April 2004 to March 2005 Deputy Commissioner of Income-tax -
under section 154The Income Tax Act, 1961
Tax deduction at source and interest thereon
52,547,270 April 2008 to March 2009 Commissioner of Appeal (Income-tax)
* `16,635,399 paid on April 27, 2012.(x) The Company has no accumulated losses at the end of the financial year and it has not incurred cash losses in the current
and immediately preceding financial year.
(xi) The Company did not have any dues to any financial institution, bank or debenture holder during the year.
(xii) According to the information and explanations given to us and based on the documents and records produced to us, the Company has not granted loans and advances on the basis of security by way of pledge of shares, debentures and other securities.
(xiii) In our opinion, the Company is not a chit fund or a nidhi / mutual benefit fund / society. Therefore, the provisions of clause 4(xiii) of the Order are not applicable to the Company.
(xiv) In our opinion, the Company is not dealing in or trading in shares, securities, debentures and other investments. Accordingly, the provisions of clause 4(xiv) of the Order are not applicable to the Company.
(xv) According to the information and explanations given to us, the Company has not given any guarantee for loans taken by others from bank or financial institutions.
(xvi) The Company did not have any term loans outstanding during the year.
(xvii) According to the information and explanations given to us and on an overall examination of the balance sheet of the Company, we report that no funds raised on short-term basis have been used for long-term investment.
(xviii) The Company has not made any preferential allotment of shares to parties or companies covered in the register maintained under section 301 of the Act.
(xix) The Company did not have any outstanding debentures during the year.
(xx) The Company has not raised any money by public issue during the year.
(xxi) Based upon the audit procedures performed for the purpose of reporting the true and fair view of the financial statements and as per the information and explanations given by the management, we report that no fraud on or by the Company has been noticed or reported during the year.
For S. R. Batliboi & AssociatesFirm registration number: 101049W Chartered Accountants
per Amit MajmudarPartner Membership No.: 36656
Mumbai, India May 11, 2012
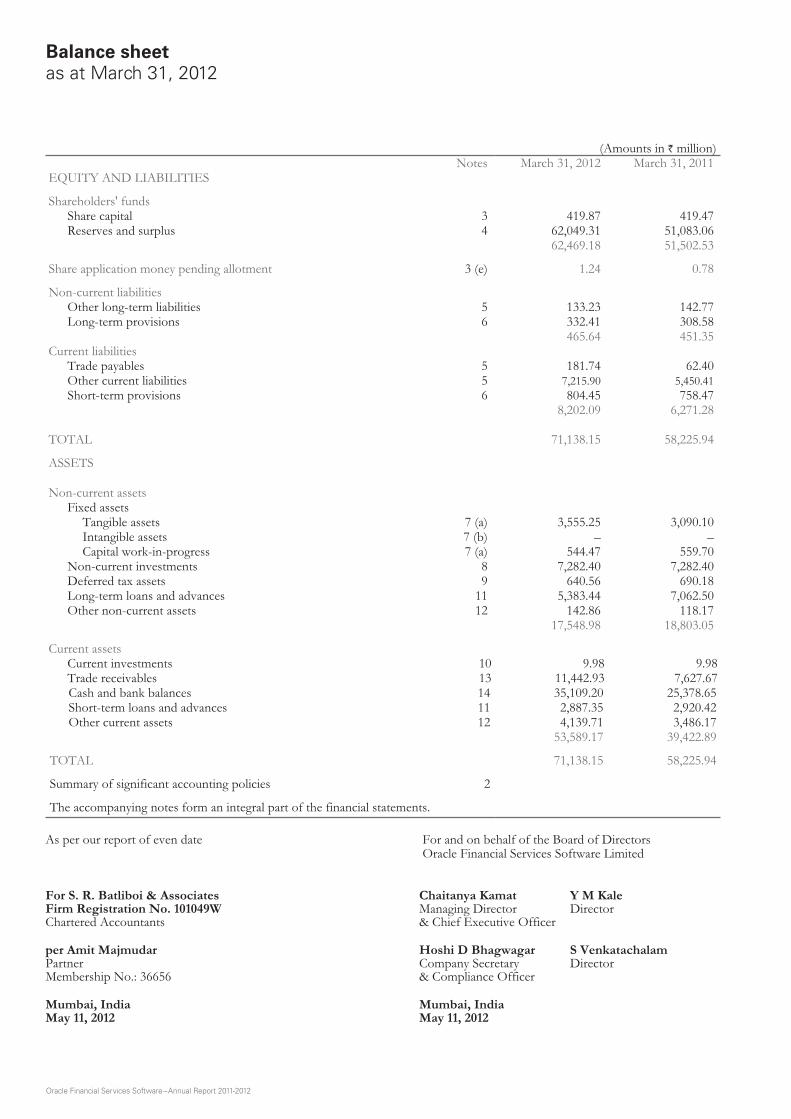
Oracle Financial Services Software – Annual Report 2011-2012
(Amounts in ` million)Notes March 31, 2012 March 31, 2011
EQUITY AND LIABILITIES
Shareholders' fundsShare capital 3 419.87 419.47Reserves and surplus 4 62,049.31 51,083.06
62,469.18 51,502.53
Share application money pending allotment 3 (e) 1.24 0.78
Non-current liabilitiesOther long-term liabilities 5 133.23 142.77Long-term provisions 6 332.41 308.58
465.64 451.35Current liabilities
Trade payables 5 181.74 62.40Other current liabilities 5 7,215.90 5,450.41Short-term provisions 6 804.45 758.47
8,202.09 6,271.28
TOTAL 71,138.15 58,225.94
ASSETS
Non-current assetsFixed assets
Tangible assets 7 (a) 3,555.25 3,090.10Intangible assets 7 (b) – –Capital work-in-progress 7 (a) 544.47 559.70
Non-current investments 8 7,282.40 7,282.40Deferred tax assets 9 640.56 690.18Long-term loans and advances 11 5,383.44 7,062.50Other non-current assets 12 142.86 118.17
17,548.98 18,803.05
Current assetsCurrent investments 10 9.98 9.98Trade receivables 13 11,442.93 7,627.67Cash and bank balances 14 35,109.20 25,378.65Short-term loans and advances 11 2,887.35 2,920.42Other current assets 12 4,139.71 3,486.17
53,589.17 39,422.89
TOTAL 71,138.15 58,225.94
Summary of significant accounting policies 2
The accompanying notes form an integral part of the financial statements.
Balance sheetas at March 31, 2012
As per our report of even date For and on behalf of the Board of Directors Oracle Financial Services Software Limited
For S. R. Batliboi & AssociatesFirm Registration No. 101049WChartered Accountants
Chaitanya KamatManaging Director& Chief Executive Officer
Y M KaleDirector
per Amit MajmudarPartnerMembership No.: 36656
Hoshi D BhagwagarCompany Secretary& Compliance Officer
S VenkatachalamDirector
Mumbai, IndiaMay 11, 2012
Mumbai, IndiaMay 11, 2012

87
As per our report of even date For and on behalf of the Board of DirectorsOracle Financial Services Software Limited
For S. R. Batliboi & AssociatesFirm Registration No. 101049WChartered Accountants
Chaitanya KamatManaging Director& Chief Executive Officer
Y M KaleDirector
per Amit MajmudarPartnerMembership No.: 36656
Hoshi D BhagwagarCompany Secretary& Compliance Officer
S VenkatachalamDirector
Mumbai, IndiaMay 11, 2012
Mumbai, IndiaMay 11, 2012
(Amounts in ` million, except share data)Notes Year ended
March 31, 2012 Year ended
March 31, 2011INCOME
Revenue from operations 15 26,058.54 23,605.06Other income, net 16 3,750.34 1,403.02Total income 29,808.88 25,008.08
EXPENSES
Employee costs 17 12,532.65 10,521.32Travel related expenses (net of recoveries) 1,079.81 1,163.78Professional fees 1,395.72 950.95Other expenses 18 1,155.56 1,544.17Depreciation and amortization 7 401.19 336.49
16,564.93 14,516.71Provision for diminution in value of investment – 25.42Total expenses 16,564.93 14,542.13
Profit before exceptional items and tax 13,243.95 10,465.95Exceptional items, net 19 2,414.98 (122.07)Profit before tax 15,658.93 10,343.88
Tax expensesCurrent tax 33 4,716.97 970.19Deferred tax 49.63 (306.10)
Total tax expenses 4,766.60 664.09
Profit for the year 10,892.33 9,679.79
Earnings per equity share of par value of ` 5 (March 31, 2011 ` 5) each (in `) 20
Basic 129.78 115.40Diluted 129.65 115.23
Summary of significant accounting policies 2
The accompanying notes form an integral part of the financial statements.
Statement of profit and lossfor the year ended March 31, 2012

Oracle Financial Services Software – Annual Report 2011-2012
Note 1: Corporate information
Oracle Financial Services Software Limited (the “Company”) was incorporated in India with limited liability on September 27, 1989. The Company is a subsidiary of Oracle Global (Mauritius) Limited holding 80.36% (March 31, 2011 – 80.44%) ownership interest in the Company as at March 31, 2012.
The Company is principally engaged in the business of providing information technology solutions to the financial services industry worldwide. The Company has a suite of banking products, which caters to the needs of corporate, retail, investment banking, treasury operations and data warehousing.
Note 2: Summary of significant accounting policies
(a) Basis of presentation
The financial statements are prepared under the historical cost convention, on the accrual basis of accounting, in conformity with accounting principles generally accepted in India and complying in all material respects with the Accounting Standards notified by Companies (Accounting Standards) Rules, 2006 (as amended) and the relevant provisions of the Companies Act, 1956 (the ‘Act’). The accounting policies have been consistently applied by the Company and are consistent with those used in the previous years’ except for the changes in accounting policies described in note 2(c) below.
The significant accounting policies adopted by the Company, in respect of the financial statements are set out as below:
(b) Use of estimates
The preparation of financial statements in conformity with generally accepted accounting principles requires management to make estimates and assumptions that affect the reported amounts of assets and liabilities and disclosure of contingent liabilities at the date of the financial statements and the results of operations during the reporting year end. Although these estimates are based upon management’s best knowledge of current events and actions, actual results could differ from these estimates.
(c) Change in accounting policy
Presentation and disclosure of financial statements
During the year ended March 31, 2012, the revised Schedule VI notified under the Act has become applicable to the Company for preparation and presentation of its financial statements. The adoption of revised Schedule VI does not impact recognition and measurement principles followed for preparation of financial statements. However, it has significant impact on presentation and disclosures made in the financial statements. The Company has also reclassified the previous year figures in accordance with the requirements applicable in the current year.
(d) Fixed assets including intangibles and capital work-in-progress, depreciation, amortization and impairment
Fixed assets including intangibles and capital work-in-progress
Fixed assets including assets under finance lease arrangements are stated at cost less accumulated depreciation. The Company capitalizes all direct costs relating to the acquisition and installation of fixed assets. The cost of fixed assets not ready to use before balance sheet date are disclosed under ‘Capital work-in-progress’. Product Intellectual Property Rights (IPRs acquired as part of business acquisitions are capitalized based on a fair value. The Company records the difference between considerations paid to acquire these IPRs and the fair value of assets and liabilities acquired as goodwill.
The Company purchases certain specific-use application software, which is in ready to use condition, for internal use. It is estimated that such software has a relatively short useful life, usually less than one year. The Company, therefore, charges to income the cost of acquiring such software.
Notes annexed to and forming part of financial statements for the year ended March 31, 2012

89
Depreciation and amortization
Depreciation and amortization are computed using straight-line method, at the rates specified in Schedule XIV to the Act or based on the estimated useful life of assets, whichever is higher. Individual assets costing ` 5,000 or less are fully depreciated in the year of acquisition. The estimated useful life considered for depreciation of fixed assets is as follows:
Asset description Asset life (in years)
Tangible assetsImprovement of leasehold premises Lesser of 7 years or lease termBuildings 20Computer equipments 3Office equipments 2–7Electricals and other installations 2–7Furniture and fixtures 2–7Vehicles under finance Lease Lesser of 3 to 5 years or lease termIntangible assetsGoodwill on acquisition 3–5Product IPR 5PeopleSoft ERP 5
Impairment
The carrying amounts of assets are reviewed at each balance sheet date if there is any indication of impairment based on internal/external factors. An impairment loss is recognized wherever the carrying amount of an asset exceeds its recoverable amount. The recoverable amount is the greater of the assets net selling price and value in use. In assessing value in use, the estimated future cash flows are discounted to their present value using a pre-tax discount rate that reflects current market assessments of the time value of money and risks specific to assets. After impairment, depreciation is provided on the revised carrying amount of the asset over its remaining useful life.
(e) Investments
Investments that are readily realizable and intended to be held for not more than a year from the date on which such investments are made are classified as current investments. All other investments are classified as long-term investments. Trade investments refer to the investments made with the aim of enhancing the Company’s business interests in providing information technology solutions to the financial services industry worldwide.
Long term investments are stated at cost less provision for diminution on account of other than temporary decline in the value of the investment.
Current investments are stated at lower of cost and fair value determined on an individual investment basis.
(f) Foreign currency transactions
Initial recognition
Foreign currency transactions are recorded in Indian Rupees, by applying to the foreign currency amount the exchange rate between the Indian Rupees and the foreign currency at the date of the transaction.
Conversion
Foreign currency denominated monetary items are translated into Rupees at the closing rates of exchange prevailing at the date of the balance sheet. Non-monetary items, which are carried in terms of historical cost denominated in a foreign currency, are reported using the exchange rate at the date of the transaction.
Exchange differences
Exchange differences arising on the settlement of monetary items or on reporting Company’s monetary items at rates different from those at which they were initially recorded or reported in previous financial statements are recognized as income or expenses in the year in which they arise.

Oracle Financial Services Software – Annual Report 2011-2012
(g) Forward exchange contracts entered into to hedge foreign currency risk of an existing asset
The premium or discount arising at the inception of forward exchange contract is amortized and recognized as an expense/income over the life of the contract. Exchange differences on such contracts are recognized in the statement of profit and loss in the period in which the exchange rates change. Any profit or loss arising on cancellation or renewal of such forward exchange contract is also recognized as income or as expense for the period.
(h) Revenue recognition
Revenue is recognized as follows:
Product licenses and related revenue
- License fees are recognized, on delivery and subsequent milestone schedule as per the terms of the contract with the end user.
- Implementation and customization services are recognized as services are provided, when arrangements are on a time and material basis. Revenue for fixed price contracts is recognized using the proportionate completion method till contracts reach 90% completion. Balance revenue is recognized at the time of receipt of customer acceptance.
Proportionate completion is measured based upon the efforts incurred to date in relation to the total estimated efforts to complete the contract. The Company monitors estimates of total contract revenue and cost on a routine basis throughout the delivery period. The cumulative impact of any change in estimates of the contract revenue or costs is reflected in the period in which the changes become known. In the event that a loss is anticipated on a particular contract, provision is made for the estimated loss.
- Product maintenance revenue is recognized, over the period of the maintenance contract on a straight line basis.
IT solutions and consulting services
- Revenue from IT solutions and consulting services are recognized as services are provided, when arrangements are on a time and material basis.
- Revenue from fixed price contracts is recognized using the proportionate completion method till contract reach 90% completion. Balance revenue is recognized at the time of receipt of customer acceptance. Proportionate completion is measured based upon the efforts incurred to date in relation to the total estimated efforts to complete the contract. The Company monitors estimates of total contract revenue and cost on a routine basis throughout the delivery period. The cumulative impact of any change in estimates of the contract revenue or costs is reflected in the period in which the changes become known. In the event that a loss is anticipated on a particular contract, provision is made for the estimated loss.
The Company presents revenues net of service tax and value added taxes in its statement of profit and loss.
Cost and revenue in excess of billings is classified as unbilled revenue while billing in excess of revenue is classified as deferred revenue.
Interest income
Interest income is recognized on a time proportion basis taking into account the amount outstanding and the rate applicable.
Dividend income
Dividend income is recognized when the company’s right to receive dividend is established by the reporting date.
(i) Research and development expenses for software products
Research costs are expensed as incurred. Software product development costs are expensed as incurred unless technical feasibility of the project is established, future economic benefits are probable, the Company has an intention and ability to complete and use or sell the software and the cost can be measured reliably. Software product development costs incurred subsequent to the achievement of technical feasibility are not material and are expensed as incurred.
(j) Retirement and other employee benefits
Provident fund and superannuation fund are defined contribution schemes and the Company has no further obligation beyond the contributions made to the fund. Contributions are charged to statement of profit and loss in the year in which they accrue.
Gratuity liability is a defined benefit obligation and is recorded based on actuarial valuation on projected unit credit method made at the end of the year. Under the gratuity plan, every employee who has completed at least five years of service gets a gratuity on departure @ 15 days of last drawn salary for each completed year of service. The gratuity liability and net periodic gratuity cost is actuarially determined after considering discount rates, expected long term return on plan assets and increase in compensation levels. All actuarial gain/loss are immediately recorded to statement of profit and loss and are not deferred. The Company makes contributions to a fund administered and managed by the Life Insurance Corporation of India (LIC) to fund the gratuity liability. Under this scheme, the obligation to pay gratuity remains with the Company, although LIC administers the scheme.

91
Short term compensated absences are provided for based on estimates. Long term compensated absences are provided for based on actuarial valuation. The actuarial valuation is done as per projected unit credit method. All actuarial gains/losses are immediately recognized to statement of profit and loss and are not deferred. The Company presents the entire leave as a current liability in the balance sheet, since it does not have an unconditional right to defer its settlement for 12 months after the balance sheet date.
(k) Leases
Where the Company is the lessee
Lease of assets under which substantially all the risks and benefits incidental to ownership are transferred to the Company are classified as finance leases. These assets are capitalized at the lower of the fair value and present value of the minimum lease payments at the inception of the lease term and disclosed as leased assets. Lease payments are apportioned between the finance charges and reduction of the lease liability based on the implicit rate of return. Finance charges are recognized as finance cost in statement of profit and loss. Lease management fees, legal charges and other initial direct costs are capitalized.
Leases of assets under which all the risks and rewards of ownership are effectively retained by the lessor are classified as operating leases. Lease payments under operating leases are recognized as an expense in statement of profit and loss on a straight-line basis over the lease term.
(l) Income-tax
Tax expense comprises of current and deferred tax. Current income tax is measured at the amount expected to be paid to the tax authorities in accordance with the Indian Income Tax Act, 1961 (‘Indian Income Tax Act’). Deferred income taxes are recognized for the future tax consequences attributable to timing differences between the financial statement determination of income and their recognition for tax purposes. Deferred tax is measured based on the tax rates and the tax laws enacted or substantively enacted at the balance sheet date. Deferred tax assets are recognized and carried forward only to the extent that there is a reasonable certainty that sufficient future taxable income will be available against which such deferred tax assets can be realized. Unrecognized deferred tax assets of earlier years are re-assessed and recognized to the extent that it has become reasonably certain that future taxable income will be available against which deferred tax assets can be realized. The carrying value of assets is reviewed at each balance sheet date. The Company writes-down the carrying amount of deferred tax asset to the extent that it is no longer reasonably certain, that sufficient future taxable income will be available against which deferred tax asset can be realized. Minimum Alternative tax (‘MAT’) credit is recognized as an asset only when and to the extent there is convincing evidence that the Company will pay normal income tax during the specified period. In the year in which the MAT credit becomes eligible to be recognized as an asset in accordance with the recommendations contained in guidance note issued by the Institute of Chartered Accountants of India (‘ICAI’), the said asset is created by way of a credit to statement of profit and loss and shown as MAT Credit Entitlement. The Company reviews the same at each balance sheet date and writes down the carrying amount of MAT Credit Entitlement to the extent there is no longer convincing evidence to the effect that Company will pay normal Income Tax during the specified period.
(m) Earnings per share
The earnings considered in ascertaining the Company’s earnings per share comprise the net profit after tax. The number of shares used in computing basic earnings per share is the weighted average number of shares outstanding during the year. The number of shares used in computing diluted earnings per share comprises the weighted average number of shares considered for deriving basic earnings per share, and also the weighted average number of shares, if any which would have been issued on the conversion of all dilutive potential equity shares. The weighted average number of shares and potentially dilutive equity shares are adjusted for the bonus shares and sub-division of shares. For the purpose of calculating diluted earnings per share, the net profit or loss for the year attributable to equity shareholders and the weighted average number of shares outstanding during the year are adjusted for the effects of all dilutive potential equity shares.
(n) Share-based compensation/payments
Measurement and disclosure of the employee share-based payment plans is done in accordance with Securities Exchange Board of India (‘SEBI’) (Employee Stock Option Scheme and Employee Stock Purchase Scheme) Guidelines, 1999 and the Guidance Note on Accounting for Employee Share-based Payments, issued by the ICAI. The Company uses the intrinsic value method of accounting for its employee share based compensation plan and other share based arrangements. Under this method compensation expense is recorded over the vesting period of the option on a straight line basis, if the fair market value of the underlying stock exceeds the exercise price at the grant date.
(o) Provisions
A provision is recognized when an enterprise has a present obligation as a result of past event and it is probable that an outflow of resources will be required to settle the obligation, in respect of which a reliable estimate can be made. Provisions are not discounted to its present value and are determined based on management estimate required to settle the obligation at the balance sheet date. These are reviewed at each balance sheet date and adjusted to reflect the current management estimates.
(p) Contingent liabilities
A contingent liability is a possible obligation that arises from past events whose existence will be confirmed by the occurrence or non-occurrence of one or more uncertain future events beyond the control of the Company or a present obligation that is not

Oracle Financial Services Software – Annual Report 2011-2012
recognized because it is not probable that an outflow of resources will be required to settle the obligation. The Company does not recognize a contingent liability but discloses its existence in the financial statements.
(q) Cash and cash equivalents
Cash and cash equivalents for the purpose of cash flow statement comprise cash at bank and in hand and short-term investments with an original maturity of three months or less.
(Amounts in ` million, except share data)March 31, 2012 March 31, 2011
Note 3: Share capital
Authorized:100,000,000 (March 31, 2011 - 100,000,000) equity shares of ` 5 each 500.00 500.00
Issued, subscribed and fully paid-up:83,973,757 (March 31, 2011 - 83,894,802) equity shares of ` 5 each 419.87 419.47
(a) The Company has only one class of equity shares having a par value of ` 5 per share. Each holder of equity shares is entitled to one vote per share.
In the event of liquidation of the Company, the holders of equity shares will be entitled to receive remaining assets of the Company, after distribution of all preferential amounts. The distribution will be in proportion to the number of equity shares held by the shareholders.
(b) Details of shareholders holding more than 5% equity shares in the Company
Name of shareholder March 31, 2012 March 31, 2011Number of
equity shares% of equity shares
Number of equity
shares
% of equity shares
Oracle Global (Mauritius) Limited, holding company. 67,481,698 80.36% 67,481,698 80.44%As per records of the Company, including its register of shareholders/members and other declarations received from shareholders regarding beneficial interest, the above shareholding represents both legal and beneficial ownerships of equity shares.
(c) Reconciliation of equity shares outstanding at the beginning and at the end of the yearMarch 31, 2012 March 31, 2011
Number of equity shares
Amount Number of equity
shares
Amount
Outstanding at the beginning of the year 83,894,802 419.47 83,854,857 419.27Issued during the year - ESOP 78,955 0.40 39,945 0.20Outstanding at the end of the year 83,973,757 419.87 83,894,802 419.47
(d) Refer note 24 (b) for details of shares reserved for issue under the employee stock option (ESOP) plan of the Company.
(e) Share application money pending allotment represents the money received from employees of the Company towards exercise of 500 options at the exercise price of ` 1,290.85 under Employee Stock Option Scheme 2002 ("Scheme 2002") and 289 options at the exercise price of ` 2,050.00 under Employee Stock Option Plan 2010 Scheme ("Scheme 2010") (March 31, 2011 - 600 options at the exercise price of ` 1,290.85 under Scheme 2002). Each option will entitle one equity share of ` 5 each of the Company at a premium of ` 1,285.85 under Scheme 2002 and ` 2,045.00 under Scheme 2010 (March 31, 2011 - ` 1,285.85 per options under Scheme 2002).

93
(Amounts in ` million, except share data)March 31, 2012 March 31, 2011
Note 4: Reserves and surplus
Securities premium Balance, beginning of the year 9,574.16 9,524.24 Received during the year on exercise of employee stock options 73.92 49.92 Balance, end of the year 9,648.08 9,574.16
General reserve 10,145.19 10,145.19
Surplus in the statement of profit and loss Balance, beginning of the year 31,363.71 21,683.92 Profit for the year 10,892.33 9,679.79 Balance, end of the year 42,256.04 31,363.71Total reserves and surplus 62,049.31 51,083.06
March 31, 2012 March 31, 2011Non-current Current Non-current Current
Note 5: Liabilities
Trade Payables - Micro and small enterprises* – – – – - Others – 181.74 – 62.40
– 181.74 – 62.40
Amount due to subsidiaries [Refer note 27] – 2,199.67 – 2,013.69Accrued expenses 122.77 1,717.09 114.32 1,355.99Deferred revenues 10.46 3,047.60 28.45 1,893.71Advances from customers – 8.27 – 2.98Investor Education and Protection Fund to be credited by unclaimed dividends**
– 2.21 – 3.46
Forward contract payable, net – 24.41 – –Other liabilities
- Withholding and other taxes – 164.80 – 137.58 - Other statutory dues – 51.85 – 43.00
133.23 7,215.90 142.77 5,450.41
133.23 7,397.64 142.77 5,512.81
* The identification of Micro and Small Enterprises is based on Management’s knowledge of their status.** There is no amount due and outstanding as at balance sheet date to be credited to the Investor Education and Protection Fund.
Note 6: Provisions
For employee benefitsGratuity 332.41 75.04 308.58 46.41Compensated absence – 468.66 – 389.52
332.41 543.70 308.58 435.93Other Provision
Litigation – – – 126.34Taxation, net of advance tax – 260.75 – 196.20
– 260.75 – 322.54
332.41 804.45 308.58 758.47
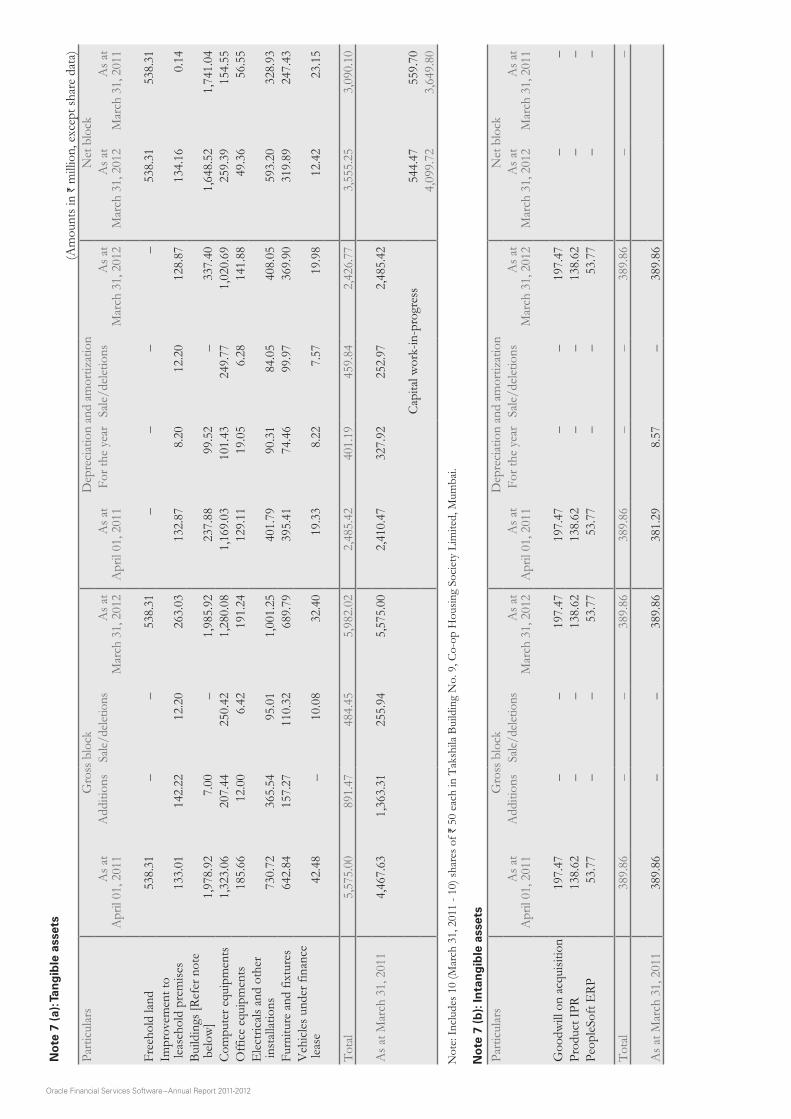
Oracle Financial Services Software – Annual Report 2011-2012
No
te 7
(a)
: Tan
gib
le a
sset
s(A
mou
nts i
n ` m
illio
n, e
xcep
t sha
re d
ata)
Parti
cular
s G
ross
blo
ck D
epre
ciatio
n an
d am
ortiz
atio
n N
et b
lock
As a
t A
pril
01, 2
011
Add
ition
s S
ale/d
eletio
nsA
s at
Mar
ch 3
1, 2
012
As a
t A
pril
01, 2
011
For t
he y
ear
Sale/
delet
ions
As a
t M
arch
31,
201
2A
s at
Mar
ch 3
1, 2
012
As a
t M
arch
31,
201
1
Free
hold
land
538
.31
– –
538
.31
– –
– –
538
.31
538
.31
Impr
ovem
ent t
o lea
seho
ld p
rem
ises
133
.01
142
.22
12.
20 2
63.0
3 1
32.8
7 8
.20
12.
20 1
28.8
7 1
34.1
6 0
.14
Build
ings
[Ref
er n
ote
belo
w]
1,9
78.9
2 7
.00
– 1
,985
.92
237
.88
99.
52 –
337
.40
1,6
48.5
2 1
,741
.04
Com
pute
r equ
ipm
ents
1,3
23.0
6 2
07.4
4 2
50.4
2 1
,280
.08
1,1
69.0
3 1
01.4
3 2
49.7
7 1
,020
.69
259
.39
154
.55
Offi
ce e
quip
men
ts 1
85.6
6 1
2.00
6.4
2 1
91.2
4 1
29.1
1 1
9.05
6.2
8 1
41.8
8 4
9.36
56.
55E
lectri
cals
and
othe
r in
stall
atio
ns 7
30.7
2 3
65.5
4 9
5.01
1,0
01.2
5 4
01.7
9 9
0.31
84.
05 4
08.0
5 5
93.2
0 3
28.9
3Fu
rnitu
re a
nd fi
xtur
es 6
42.8
4 1
57.2
7 1
10.3
2 6
89.7
9 3
95.4
1 7
4.46
99.
97 3
69.9
0 3
19.8
9 2
47.4
3V
ehicl
es u
nder
fina
nce
lease
42.
48 –
10.
08 3
2.40
19.
33 8
.22
7.5
7 1
9.98
12.
42 2
3.15
Tota
l 5
,575
.00
891
.47
484
.45
5,9
82.0
2 2
,485
.42
401
.19
459
.84
2,4
26.7
7 3
,555
.25
3,0
90.1
0
As a
t Mar
ch 3
1, 2
011
4,4
67.6
3 1
,363
.31
255
.94
5,5
75.0
0 2
,410
.47
327
.92
252
.97
2,4
85.4
2
Cap
ital w
ork-
in-p
rogr
ess
544
.47
559
.70
4,0
99.7
2 3
,649
.80
Not
e: In
clude
s 10
(Mar
ch 3
1, 2
011
- 10)
shar
es o
f ` 5
0 ea
ch in
Tak
shila
Bui
ldin
g N
o. 9
, Co-
op H
ousin
g So
ciety
Lim
ited,
Mum
bai.
No
te 7
(b
): In
tan
gib
le a
sset
s
Parti
cular
s G
ross
blo
ck D
epre
ciatio
n an
d am
ortiz
atio
n N
et b
lock
As a
t A
pril
01, 2
011
Add
ition
s S
ale/d
eletio
nsA
s at
Mar
ch 3
1, 2
012
As a
t A
pril
01, 2
011
For t
he y
ear
Sale/
delet
ions
As a
t M
arch
31,
201
2A
s at
Mar
ch 3
1, 2
012
As a
t M
arch
31,
201
1
Goo
dwill
on
acqu
isitio
n 1
97.4
7 –
– 1
97.4
7 1
97.4
7 –
– 1
97.4
7 –
–Pr
oduc
t IPR
138
.62
– –
138
.62
138
.62
– –
138
.62
– –
Peop
leSof
t ERP
53.
77 –
– 5
3.77
53.
77 –
– 5
3.77
– –
Tota
l 3
89.8
6 –
– 3
89.8
6 3
89.8
6 –
– 3
89.8
6 –
–
As a
t Mar
ch 3
1, 2
011
389
.86
– –
389
.86
381
.29
8.5
7 –
389
.86

95
(Amounts in ` million, except share data)March 31, 2012 March 31, 2011
Note 8: Non-current investments (trade) (at cost) (unquoted)
(i) In wholly owned subsidiaries
Oracle (OFSS) ASP Private Limited 5,170,000 (March 31, 2011 - 5,170,000) equity shares of ` 10 each, fully paid-up 46.10 46.10 Less: Provision for diminution in value of investment (46.10) (46.10)
– –
Oracle Financial Services Software B.V. 140,000 (March 31, 2011 - 140,000) equity shares of EUR 100 each, fully paid-up 776.31 776.31
Oracle Financial Services Software Pte. Ltd. 250,000 (March 31, 2011 - 250,000) equity shares of SGD 1 each, fully paid-up 6.63 6.63
Oracle Financial Services Software America, Inc. [Refer note 32 (a)] 1 (March 31, 2011 - 1) equity share of USD 0.01 each, fully paid-up 3,452.26 3,452.26 100 (March 31, 2011 - 100) Series A Convertible Participating Preference Shares of USD 0.01 each, fully paid-up 2,839.49 2,839.49
Oracle Financial Services Software (Shanghai) Limited 100% (March 31, 2011 - 100%) subscription to the registered capital 45.51 45.51
Oracle Financial Services Software Chile Limitada 100% (March 31, 2011 - 100%) subscription to the registered capital 70.49 70.49
ISP Internet Mauritius Company [Refer note 32 (b)] 30,000 (March 31, 2011 - 30,000) equity shares of USD 1 each, fully paid-up 192.12 192.12 Less: Provision for diminution in value of investment (120.00) (120.00)
72.12 72.12 Oracle (OFSS) Processing Services Limited 1,300,000 (March 31, 2011 - 1,300,000) equity shares of ` 10 each, fully paid-up 13.00 13.00
(ii) In associate
Login SA 33,000 (March 31, 2011 - 33,000) equity shares of EUR 2 each, fully paid-up 6.59 6.59
(iii) In other
EBZ Online Private Limited 242,240 (March 31, 2011 - 242,240) equity shares of ` 10 each, fully paid-up 45.00 45.00 Less: Provision for diminution in value of investment (45.00) (45.00)
– –
Aggregate amount of unquoted investments 7,282.40 7,282.40
Aggregate amount of provision for diminution in value of unquoted trade investments 211.10 211.10
Note 9: Deferred tax assets
Difference between book and tax depreciation 94.71 154.33Provision for compensated absence 132.59 106.91Provision for gratuity 132.20 115.18Provision for doubtful debts 218.03 247.23Others 63.03 66.53
640.56 690.18
Note 10: Current investment (at cost or fair value, whichever is lower)
Non trade (quoted)
9% Dhanalakshmi Bank Bonds Series VI10 (March 31, 2011 - 10) bonds of ` 1,000,000 each, fully paid-up 9.98 9.98Aggregate market value of quoted investment 9.98 9.98

Oracle Financial Services Software – Annual Report 2011-2012
(Amounts in ` million, except share data)As at As at
March 31, 2012 March 31, 2011Non-current Current Non-current Current
Note 11: Loans and advances (unsecured, considered good)
Loan to subsidiaries [Refer note 27] 729.78 30.00 758.52 30.00Amount recoverable from subsidiaries [Refer note 27] – 70.82 – 122.90Advances recoverable in cash or in kind or for value to be received:Deposits for premises and others 2,164.71 656.07 2,290.92 931.93Prepaid expenses 4.57 131.00 1.42 113.01Other advances 332.31 421.77 302.43 329.71Advance tax, net of provision for taxes ` 9,834.17 (March 31, 2011 ` 7,312.88) 2,152.07 – 1,767.45 –MAT credit entitlement – 1,577.69 1,941.76 1,392.87
5,383.44 2,887.35 7,062.50 2,920.42
Note 12: Other assets
Non current bank balances [Refer note 14] 2.38 – 1.68 –
Interest accrued on :Bank deposits 0.33 606.29 0.22 420.92Loan to subsidiaries 140.15 – 116.27 –Unbilled revenue – 3,393.98 – 2,991.78Recoverable expenses – billed – 139.44 – 73.47
140.48 4,139.71 116.49 3,486.17
142.86 4,139.71 118.17 3,486.17
Note 13: Trade receivables (unsecured)
(a) Outstanding for a period exceeding six months from the date they are due for payment:
Considered good – 1,784.50 – 267.25Considered doubtful 553.67 184.25 385.43 424.86
553.67 1,968.75 385.43 692.11Provision for doubtful receivables (553.67) (184.25) (385.43) (424.86)
– 1,784.50 – 267.25
(b) Other receivables:
Considered good – 9,658.43 – 7,360.42Considered doubtful – 1.44 – 13.29
– 9,659.87 – 7,373.71Provision for doubtful receivables – (1.44) – (13.29)
– 9,658.43 – 7,360.42
– 11,442.93 – 7,627.67

97
(Amounts in ` million, except share data)As at As at
March 31, 2012 March 31, 2011Non-current Current Non-current Current
Note 14: Cash and bank balances
(a) Cash and cash equivalents
Cash on hand – 0.42 – 0.47 Cheques on hand – 0.55 – 0.49 Balances with banks: Current accounts – 1,591.81 – 1,046.98 Deposit accounts with original maturity of less than 3 months
– 3.76 – 26.10
Unclaimed dividend accounts – 2.21 – 3.46 – 1,598.75 – 1,077.50
(b) Other bank balances
Balances with banks: Deposit accounts with original maturity of more than 3 months but less than 12 months
– 33,506.76 – 24,296.76
Margin money deposit 2.38 3.69 1.68 4.39 2.38 33,510.45 1.68 24,301.15
Amount disclosed under non-current assets (2.38) – (1.68) –
Amount disclosed under current assets – 35,109.20 – 25,378.65
Year ended March 31,2012
Year ended March 31, 2011
Note 15: Revenue from operations
Product licenses and related activities 19,121.73 16,154.85IT solutions and consulting services 6,936.81 7,450.21
26,058.54 23,605.06
Note: Revenue from product licenses and related activities includes prior year reversal of ` 159.56 for the year ended March 31, 2012.
Note 16: Other income, net
(a) Interest income Interest on: Bank deposits 2,690.08 1,355.47 Bonds 0.90 0.90 Loan to subsidiaries 6.52 6.54 Leased assets – 1.24
2,697.50 1,364.15
(b) Other income, net
Foreign exchange gain, net 1,056.41 19.07 (Loss) profit on sale of fixed assets, net (16.57) 5.01 Miscellaneous income 13.00 14.79
1,052.84 38.87
3,750.34 1,403.02

Oracle Financial Services Software – Annual Report 2011-2012
(Amounts in ` million, except share data)Year ended
March 31,2012Year ended
March 31, 2011Note 17: Employee costs
Salaries and bonus [Refer note below] 11,678.98 9,675.46Staff welfare expenses 457.33 445.56Contribution to provident and other funds 396.34 400.30
12,532.65 10,521.32
Note: Employee costs for the year ended March 31, 2011 are net of ` 219.11 pertaining to write back of bonus provision of earlier year no longer required due to changes in the compensation policy of the Company.
Note 18: Other expenses
Application software 127.40 100.09Communication expenses 92.61 123.85Rent 408.53 598.32Advertising expenses 2.65 4.96Power 213.13 190.39Insurance 24.76 19.44Repairs and maintenance:
Buildings and leasehold premises 19.08 12.85Computer equipments 40.55 38.05Others 51.28 51.76
Rates and taxes 110.43 50.56Finance charge on leased assets 1.92 2.13Provision for doubtful debts, net (150.71) 199.52Bad debts 62.78 0.04Auditors' remuneration [Refer note 28] 7.86 8.08Miscellaneous expenses 143.29 144.13
1,155.56 1,544.17
Note 19: Exceptional items, net
Dividend income [Refer note (a) below] 3,108.30 –Claim against the Company [Refer note (b) below] (693.32) (122.07)
2,414.98 (122.07)
(a) During the year ended March 31, 2012, the Company has received dividend of ` 1,833.30 and ` 1,275.00 from its wholly owned subsidiaries Oracle Financial Services Software B.V. and Oracle Financial Services Software Pte. Ltd. respectively. Considering the amount of dividend received, the same has been disclosed as an exceptional item.
(b) A customer had filed a lawsuit against the Company and one of its subsidiaries, claiming damages of upwards of ` 5,784.19. In respect of this claim, the Company had provided ` 122.07 in the year ended March 31, 2011. During the year ended March 31, 2012, the Company has settled the said customer dispute for full release of all alleged claims and accordingly has accounted the balance settlement amount, net of insurance claim and disclosed the same as an exceptional item.
Note 20: Reconciliation of basic and diluted equity shares used in computing earnings per share
Weighted average shares outstanding for basic earnings per share 83,929,749 83,882,022Add: Effect of dilutive stock options 82,950 123,857Weighted average shares outstanding for diluted earnings per share 84,012,699 84,005,879
March 31, 2012 March 31, 2011Note 21: Capital and other commitments and contingent liabilities
(a) Capital commitments 470.44 919.97 Contracts remaining to be executed on capital account not provided for (net of
advances) including capital commitment through issuance of letter of intents of ` Nil (March 31, 2011 - ` 343.04).
(b) Contingent liabilitiesClaim against the Company [Refer note 19] Nil 5,306.41

99
Note 22: Leases
Where Company is lessee
Finance lease
The Company takes vehicles under finance lease of up to five years. None of the lease agreements have an escalation clause. Future minimum lease payments under finance lease as at March 31, 2012 and 2011 are as follows:
(Amounts in ` million, except share data)March 31, 2012
Principal Interest TotalNot later than one year 7.25 1.33 8.58Later than one year but not later than five years 7.14 0.64 7.78Total minimum payments 14.39 1.97 16.36
March 31, 2011
Principal Interest TotalNot later than one year 8.75 2.56 11.31Later than one year but not later than five years 16.66 2.31 18.97Total minimum payments 25.41 4.87 30.28
Operating lease
The Company has taken certain office premises and residential premises for employees under operating lease, which expire at various dates through year 2025. Some of the lease agreements have a price escalation clause. Gross rental expenses for the year ended March 31, 2012 aggregated to ` 397.92 (March 31, 2011 - ` 589.70). The minimum rental payments to be made in future in respect of these leases are as follows:
March 31, 2012 March 31, 2011
Not later than one year 236.73 355.29Later than one year but not later than five years 408.75 669.24Later than five years 821.78 2,005.07
1,467.26 3,029.60
Note 23: Derivative instruments and un-hedged foreign currency exposure
The Company enters into forward foreign exchange contracts where the counter party is a bank. The Company purchases forward foreign exchange contracts to mitigate the risks of change in foreign exchange rate on receivables denominated in certain foreign currencies. The Company considers the risk of non-performance by the counter party as non-material. As at March 31, 2012 the Company has following outstanding derivative instrument:
(Amounts in US Dollar million) Particulars March 31, 2012 March 31, 2011
Forward contracts – Sellin US Dollar 30.50 Nil
As of the balance sheet date, the Company’s net foreign currency exposure that is not hedged is ` 22,415.20 (March 31, 2011 ` 16,991.50).
Note 24: Share based compensation/payments
a) Employee Stock Purchase Scheme (‘ESPS’)
The Company has adopted the ESPS administered through a Trust (“the Trust”) to provide equity based incentives to key employees of the Company. As per the scheme, the Trust can purchase shares of the Company from market using the proceeds of loans obtained from the Company. Such shares are allocated by the Trust to nominated employees at an exercise price, which approximates the fair value on the date of the grant. The shares vest in the employees over a period of five years and the employees can purchase the shares from the Trust over a period of ten years based on continued employment, until which, the Trust holds the shares for the benefit of the employees. The employees are entitled to receive dividends, bonus, etc., that may be declared by the Company from time to time for the entire portion of shares held by the Trust on behalf of the employees.

Oracle Financial Services Software – Annual Report 2011-2012
On the acceptance of the offer, the selected employee undertakes to purchase the shares from the Trust within ten years from the date of acceptance of the offer. In case an employee resigns from employment, the rights relating to vested shares, which are eligible for exercise, may be purchased by the employee by payment of the exercise price whereas, the balance shares are forfeited in favor of the Trust. The Trustees have the right of recourse against the employees for any amounts that may remain unpaid on the shares accepted by them. As of the Balance Sheet date, the Trust has repaid the entire loan obtained from the Company on receipt of payments from employees against shares exercised.
The Securities and Exchange Board of India (‘SEBI’) has issued the Employee Stock Option Scheme and Stock Purchase Guidelines, 1999 (‘SEBI guidelines’), which are applicable to stock purchase schemes for employees of all Indian listed companies. In accordance with these guidelines, the excess of market price of the underlying equity shares on the date of grant of the stock options over the exercise price of the options is to be recognized in the books of account and amortized over the vesting period. However, no compensation cost has been recorded as the scheme terms are fixed and the exercise price equals the market price of the underlying stock on the grant date.
A summary of the activity in the Company’s ESPS is as follows:
Year endedMarch 31, 2012
Year endedMarch 31, 2011
Number of shares Number of sharesOpening balance of unallocated shares 166,142 165,150Shares forfeited during the year – 992Closing balance of unallocated shares 166,142 166,142
Opening balance of allocated shares 29,081 54,548Shares exercised during the year (10,264) (24,475)Shares forfeited during the year – (992)Closing balance of allocated shares 18,817 29,081
Shares eligible for exercise 18,817 29,081Shares not eligible for exercise – –Total allocated shares 18,817 29,081
b) Employee Stock Option Plan (‘ESOP’)
Pursuant to ESOP scheme approved by the shareholders of the Company on August 14, 2001, the Board of Directors, on March 4, 2002 approved the Employees Stock Option Scheme (“Scheme 2002”) for issue of 4,753,600 options to the employees and directors of the Company and its subsidiaries. According to the Scheme 2002, the Company has granted 4,548,920 options prior to the IPO and 619,000 options at various dates after IPO (including the grants of options out of options forfeited earlier).
On August 25, 2010, the Board of Directors approved the Employees Stock Option Plan 2010 Scheme (“Scheme 2010”) for issue of 618,000 options to the employees and directors of the Company and its subsidiaries. According to the Scheme 2010, the Company has granted 638,000 options (including the grants of options out of options forfeited earlier).
Pursuant to ESOP scheme approved by the shareholders of the Company in their meeting held on August 18, 2011, the Board of Directors approved the Employees Stock Option Plan 2011 Scheme (“Scheme 2011”) for issue of 5,100,000 options to the employees and directors of the Company and its subsidiaries. According to the Scheme 2011, the Company has granted 640,500 options till March 31, 2012.
As per the above schemes, each of 20% of the total options granted will vest to the eligible employees and directors on completion of 12, 24, 36, 48 and 60 months from the date of grant and is subject to continued employment of the employee or directorship of the director with the Company or its subsidiaries. Options have exercise period of 10 years from the date of grant. The employee pays the exercise price upon exercise of option.
A summary of the activity in the Company’s ESOP (Scheme 2002) is as follows:
Year ended March 31, 2012 Year ended March 31, 2011Shares arisingfrom options
Weighted average exercise price (`)
Shares arisingfrom options
Weighted average exercise price (`)
Outstanding at beginning of year 245,837 1,414 242,382 1,152Granted – – 60,000 2,333Exercised (78,275) 932 (39,945) 1,255Forfeited (22,350) 1,107 (16,600) 1,291Outstanding at end of the year 145,212 1,721 245,837 1,414
Vested options 97,212 141,537Unvested options 48,000 104,300

101
A summary of the activity in the Company’s ESOP (Scheme 2010) is as follows:
Year ended March 31, 2012 Year ended March 31, 2011Shares arisingfrom options
Weighted average exercise price (`)
Shares arisingfrom options
Weighted average exercise price (`)
Outstanding at beginning of year 561,865 2,050 – –Granted 20,000 2,342 618,000 2,050Exercised (680) 2,050 – –Forfeited (152,841) 2,050 (56,135) 2,050Outstanding at end of the year 428,344 2,064 561,865 2,050
Vested options 81,596 –Unvested options 346,748 561,865
A summary of the activity in the Company’s ESOP (Scheme 2011) is as follows:
Year ended March 31, 2012 Year ended March 31, 2011Shares arisingfrom options
Weighted average exercise price (`)
Shares arisingfrom options
Weighted average exercise price (`)
Outstanding at beginning of year – – – –Granted 640,500 1,936 – –Exercised – – – –Forfeited (23,000) 1,930 – –Outstanding at end of the year 617,500 1,937 – –
Vested options – –Unvested options 617,500 –
The weighted average share price for the year over which stock options were exercised was ` 2,234 (March 31, 2011 - ` 2,188).
The details of options unvested and options vested and exercisable as on March 31, 2012 are as follows:
Exercise prices (`) Options Weighted average exercise price (`)
Weighted average remaining
contractual life (Years)
Options unvested 1,930 577,500 1,930 9.72,032 40,000 2,032 9.72,050 326,748 2,050 8.42,333 48,000 2,333 8.62,342 20,000 2,342 9.3
Options vested and exercisable 515 32 515 1.31,291 85,180 1,291 4.12,050 81,596 2,050 8.42,333 12,000 2,333 8.6
1,191,056 1,956 8.8The details of options unvested and options vested and exercisable as on March 31, 2011 are as follows:
Exercise prices (`) Options Weighted average exercise price (`)
Weighted average remaining
contractual life (Years)
Options unvested 1,291 44,300 1,291 5.12,050 561,865 2,050 9.42,333 60,000 2,333 9.6
Options vested and exercisable 265 31,400 265 0.9515 32 515 2.3
1,291 110,105 1,291 5.1807,702 1,856 8.3

Oracle Financial Services Software – Annual Report 2011-2012
Stock Options granted during the financial year ended March 31, 2012:
The weighted average fair value of stock options granted during the year was ` 1,195 (March 31, 2011 - ` 844).
The Black Scholes valuation model has been used for computing the above weighted average fair value of stock options granted considering the following inputs:
Scheme 2010 Scheme 2011 Scheme 2011
Exercise Price (`) 2,342 2,032 1,930Expected Volatility 48% 50% 50%Historical Volatility 48% 50% 50%Life of the options granted (Vesting and exercise period) in years 10 10 10Expected dividends Nil Nil NilAverage risk-free interest rate 8.50% 8.4% 8.4%Expected dividend rate Nil Nil Nil
The expected volatility was determined based on historical volatility data; historical volatility includes early years of the Company’s life; the Company expects the volatility of its share price to reduce as it matures.
The Company measures the cost of ESOP using intrinsic value method. Had compensation cost been determined in a manner consistent with the fair value approach, the Company’s net profit and earnings per share as reported would have changed to the amounts indicated below:
(Amounts in ` million, except share data) Year ended Year endedMarch 31, 2012 March 31, 2011
Profit as reported 10,892.33 9,679.79Add: Employee stock compensation under intrinsic value method Nil NilLess: Employee stock compensation under fair value method (190.48) (132.72)
Proforma profit 10,701.85 9,547.07
Earnings Per ShareBasic
- As reported 129.78 115.40- Pro forma 127.51 113.82
Diluted- As reported 129.65 115.23Pro forma 127.44 113.68
Note 25: Employee Benefit Obligation
Defined contribution plans
During year ended March 31, 2012 and 2011, the Company contributed following amounts to defined contributions plans:
(Amounts in ` million, except share data) Particulars March 31, 2012 March 31, 2011
Provident fund 205.96 184.90Superannuation fund 81.52 61.63
287.48 246.53
Defined benefit plan – gratuity
The amounts recognized in the statement of profit and loss for the year ended March 31, 2012 and 2011 are as follows:
Particulars Year ended March 31, 2012
Year ended March 31, 2011
Current service cost 58.95 44.16Interest cost 31.63 21.40Expected return on plan assets (0.32) (0.18)Recognized net actuarial (gain) loss 18.44 34.57Past service cost – 53.12Total included in employee benefit expense’ 108.70 153.07
Actual return on plan assets 0.61 0.62

103
The amounts recognized in the balance sheet are as follows:
(Amounts in ` million, except share data)Particulars Year ended
March 31, 2012Year ended
March 31, 2011
Present value of funded obligations 408.90 370.11Fair value of plan assets (1.45) (15.12)Net liability 407.45 354.99
Changes in present value of defined benefit obligation representing reconciliation of opening and closing balances thereof are as follows:
Particulars Year ended March 31, 2012
Year ended March 31, 2011
Defined benefit obligation at beginning of the year 370.11 257.77Current service cost 58.95 44.16Interest cost 31.63 21.40Benefits paid (73.82) (41.36)Actuarial (gain) loss 18.72 35.02Past service cost – 53.12Liabilities related to employees transferred from a subsidiary 3.31 –Defined benefit obligation at end of the year 408.90 370.11
Changes in the fair value of plan assets representing reconciliation of opening and closing balances thereof are as follows:
Particulars Year ended March 31, 2012
Year ended March 31, 2011
Fair value of plan assets at beginning of the year 15.12 2.36Expected return on plan assets 0.32 0.18Actuarial gain (loss) 0.28 0.45Contribution by employer 56.24 53.49Benefits paid (73.82) 41.36Assets related to employees transferred from a subsidiary 3.31 –Fair value of plan assets at end of the year 1.45 15.12
Plan assets are administered by LIC and 100% of the plan assets are invested in lower risk assets, primarily in debt securities.
The assumptions used in accounting for the gratuity plan are set out as below:
March 31, 2012 March 31, 2011
Discount rate 8.47% 7.94%Expected return on plan assets 7.50% 7.50%Salary escalation rate 8.00% 8.00%
The estimates of future salary increase, considered in actuarial valuation, take account of inflation, seniority, promotions and other relevant factors such as supply and demand in the employment market.
The Company evaluates these assumptions annually based on its long-term plans of growth and industry standards. The discount rates are based on current market yields on government bonds consistent with the currency and estimated term of the post employment benefits obligations. Plan assets are administered by the LIC and invested in lower risk assets, primarily debt securities. The Company’s contribution to the fund for the year ending March 31, 2013 is expected to be ` 75.00.
The expected benefit payments from the fund as of March 31, 2012 are below:
Year ending March 31 Amount2013 76.492014 77.242015 79.902016 83.992017–22 501.74

Oracle Financial Services Software – Annual Report 2011-2012
Present value of the defined benefit obligation, fair value of the plan assets, deficit and experience adjustments in the plan assets and liabilities for the current year and previous four years are as follows:
(Amounts in ` million, except share data)Particulars Year ended
March 31, 2012Year ended
March 31, 2011Year ended
March 31, 2010Year ended
March 31, 2009Year ended
March 31, 2008
Present value of funded obligations (408.90) (370.11) (257.77) (231.67) (173.99)Fair value of plan assets 1.45 15.12 2.36 1.47 0.23Deficit (407.45) (354.99) (255.41) (230.20) (173.76)
Experience adjustmentsOn plan liabilities 32.26 43.12 (13.35) (0.72) 20.05On plan assets 0.28 0.45 (2.18) 0.26 (0.47)
Note 26: Segment information
Business segments are defined as a distinguishable component of an enterprise that is engaged in providing a group of related products or services and that is subject to differing risks and returns and about which separate financial information is available. This information is reviewed and evaluated regularly by the management in deciding how to allocate resources and in assessing the performance.The Company is organized by business segment and geographically. For management purposes the Company is primarily organized on a worldwide basis into two business segments:a) Product licenses and related activities (‘Products’) andb) IT solutions and consulting services (‘Services’).The business segments are the basis on which the Company reports its primary operational information to management. Product licenses and related activities segment deals with various banking software products. The related activities include enhancements, implementation and maintenance activities.IT solutions and consulting services segment offers services spanning the entire lifecycle of applications used by financial service institutions. The division’s portfolio includes Consulting, Application, Support and Technology Services that help institutions improve efficiency, optimize costs, meet risk and compliance mandates and implement IT solutions finely attuned to their business needs.
Year ended March 31, 2012
Particulars Products Services TotalRevenue 19,121.73 6,936.81 26,058.54
Segment result 8,821.00 1,688.18 10,509.18Unallocable expenses (1,015.57)Other income, net 3,750.34Profit before exceptional items and tax 13,243.95Exceptional items, net [Refer note 19] 2,414.98Profit before tax 15,658.93Tax expenses [Refer note 33] (4,766.60)Net profit 10,892.33
Year ended March 31, 2011
Particulars Products Services TotalRevenue 16,154.85 7,450.21 23,605.06
Segment result 8,617.74 1,423.02 10,040.76Unallocable expenses (952.41)Other income, net 1,403.02Provision for diminution in value of investment (25.42)Profit before exceptional items and tax 10,465.95Exceptional item [Refer note 19] (122.07)Profit before tax 10,343.88Tax expenses [Refer note 33] (664.09)Net profit 9,679.79

105
Other information:(Amounts in ` million, except share data)
Year ended March 31, 2012
Particulars Products Services Unallocable TotalCapital expenditure by segment Tangible assets 469.81 361.51 60.15 891.47Depreciation and amortization 171.49 164.88 64.82 401.19Other non cash expenses (60.24) (27.69) – (87.93)Segment assets 14,552.26 5,172.70 51,413.19 71,138.15Segment liabilities 6,007.01 1,580.31 1,080.41 8,667.73Share application money pending allotment – – 1.24 1.24Shareholders’ funds – – 62,469.18 62,469.18
Year ended March 31, 2011
Particulars Products Services Unallocable TotalCapital expenditure by segment Tangible assets 717.44 556.08 89.79 1,363.31Depreciation and amortization 133.10 160.39 43.00 336.49Other non cash expenses 171.85 27.71 – 199.56Segment assets 9,981.04 4,409.85 43,835.05 58,225.94Segment liabilities 4,195.09 1,686.65 840.89 6,722.63Share application money pending allotment – – 0.78 0.78Shareholders’ funds – – 51,502.53 51,502.53
Segment revenue and expense:
Revenue is generated through licensing of software products as well as by providing software solutions to the customers including consulting services. The expenses which are not directly attributable to a business segment are classified as unallocable expenses.
Segment assets and liabilities:
Segment assets include all operating assets used by a segment and consist principally of debtors, net of allowances, unbilled revenue, deposits for premises and fixed assets. Segment liabilities primarily includes deferred revenues, advance from customer, accrued employee cost and other current liabilities. While most of such assets and liabilities can be directly attributed to individual segments, the carrying amount of certain assets and liabilities used jointly by two or more segments is allocated to the segment on a reasonable basis. Assets and liabilities that cannot be allocated between the segments are shown as part of unallocable assets and liabilities.
Geographical segments
The following table shows the distribution of the Company’s sales by geographical market :
Year ended March 31, 2012
Year ended March 31, 2011
Regions Amount % Amount %United States of America 8,054.19 31% 6,234.14 26%Europe 5,303.90 20% 6,441.63 28%Asia Pacific 7,798.38 30% 5,915.58 25%Middle East, India and Africa 4,387.05 17% 4,217.26 18%Latin America and Caribbean 515.02 2% 796.45 3%
26,058.54 100% 23,605.06 100%
The following table shows the Company’s assets by geographical market :
Year ended March 31, 2012
Year ended March 31, 2011
Regions Amount % Amount %United States of America 11,145.70 16% 10,230.89 18%Europe 4,024.96 6% 3,224.53 6%Asia Pacific 6,571.63 9% 4,215.37 7%Middle East, India and Africa 49,189.69 68% 40,364.96 68%Latin America and Caribbean 206.17 1% 190.19 1%
71,138.15 100% 58,225.94 100%
Total cost incurred during the year to acquire fixed assets within India is disclosed in Note 7.

Oracle Financial Services Software – Annual Report 2011-2012
Note 27: Names of Related Parties and description of relationship:Relationship Names of related parties
(i) Related parties where control exists
Ultimate Holding Company Oracle Corporation
Holding Company Oracle Global (Mauritius) Limited
Direct Subsidiaries Oracle Financial Services Software B.V.Oracle Financial Services Software Pte. Ltd.Oracle Financial Services Software Chile LimitadaOracle Financial Services Software (Shanghai) LimitedOracle Financial Services Software America, Inc.ISP Internet Mauritius CompanyOracle (OFSS) Processing Services LimitedOracle (OFSS) ASP Private Limited
Subsidiaries of Subsidiaries Subsidiary of Oracle Financial Services Software B.V.- Oracle Financial Services Software SA
Subsidiary of Oracle Financial Services Software Pte. Ltd.- Oracle Financial Services Consulting Pte. Ltd.
Subsidiaries of Oracle Financial Services Software America, Inc.- Oracle Financial Services Software, Inc.- i-flex solutions Inc.(Canada) (dissolved on March 31, 2011) Subsidiaries of i-flex solutions Inc.(Canada) - Castek Software Factory Ltd. (dissolved on September 01, 2010) - Castek RBG Inc. (dissolved on September 01, 2010) - Castek Inc. (dissolved on September 01, 2010)- Mantas Inc. Subsidiaries of Mantas Inc. - Mantas Singapore Pte. Ltd. (dissolved on March 01, 2012) - Mantas India Private Limited - Mantas Limited (dissolved on April 10, 2012) - Sotas Inc.
Subsidiaries of ISP Internet Mauritius Company- Oracle (OFSS) BPO Services Inc.- Oracle (OFSS) BPO Services Limited
Associate Login S. A.
(ii) Related parties with whom transactions have taken place during the year
Fellow Subsidiaries Oracle America, Inc.Oracle Hungary Kft.Oracle Egypt Ltd.Oracle Nederland B.V.Oracle Caribbean, Inc.Oracle Systems Limited - Saudi ArabiaOracle India Private LimitedOracle East Central Europe LimitedOracle Corporation Australia Pty. LimitedOracle Corporation Singapore Pte. Ltd.Oracle Corporation (Thailand) Company LimitedOracle do Brasil Sistemas LimitadaOracle Systems Limited - CyprusOracle Software (Schweiz) GmbHOracle Systems Hong Kong LimitedOracle East Central Europe Services BVOracle de Centroamérica, S.A.Oracle Corporation (South Africa)(Pty) LimitedOracle Portugal - Sistemas de Informação Lda.Oracle Solution Services (India) Private Ltd.Oracle Research & Development Center, Shenzhen, Ltd.
Key Managerial Personnel ('KMP') Chaitanya Kamat - Managing Director and Chief Executive Officer (from October 25, 2010)N R Kothandaraman (N R K Raman) - Managing Director and Chief Executive Officer (till October 25, 2010)Joseph John - Executive Vice President, Universal Banking Products (till March 31, 2011)
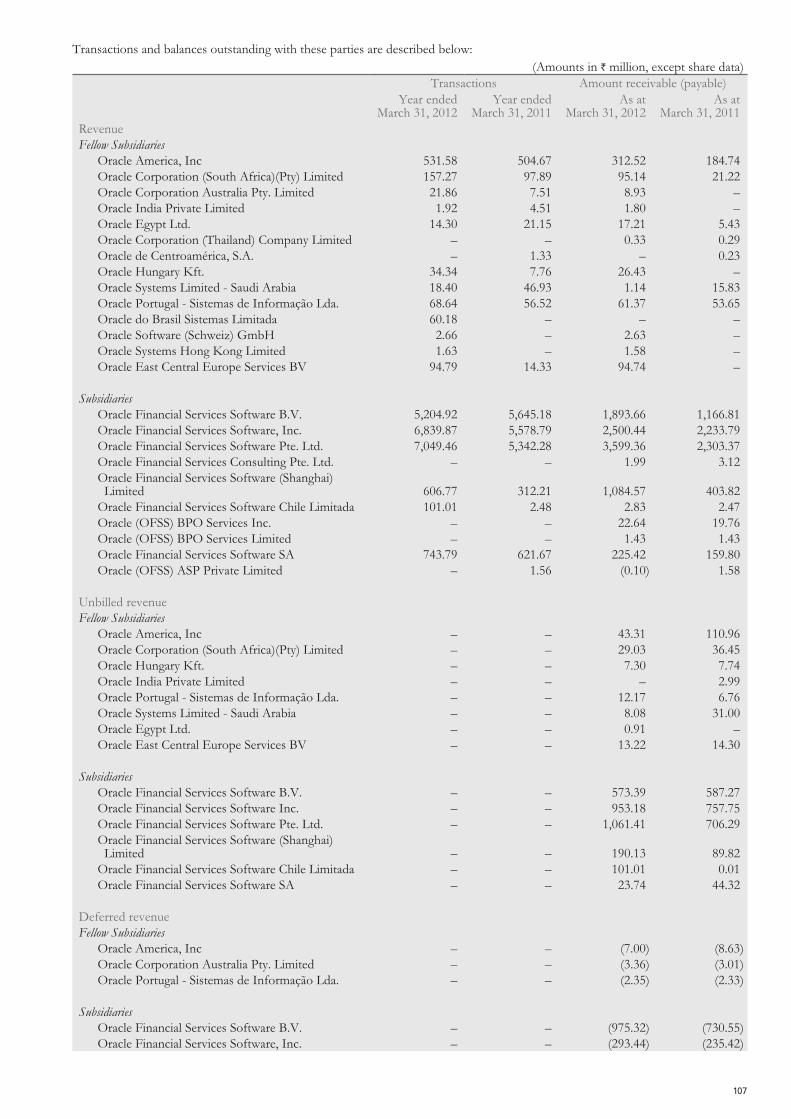
107
Transactions and balances outstanding with these parties are described below:(Amounts in ` million, except share data)
Transactions Amount receivable (payable)Year ended
March 31, 2012Year ended
March 31, 2011As at
March 31, 2012As at
March 31, 2011RevenueFellow Subsidiaries
Oracle America, Inc 531.58 504.67 312.52 184.74Oracle Corporation (South Africa)(Pty) Limited 157.27 97.89 95.14 21.22Oracle Corporation Australia Pty. Limited 21.86 7.51 8.93 –Oracle India Private Limited 1.92 4.51 1.80 –Oracle Egypt Ltd. 14.30 21.15 17.21 5.43Oracle Corporation (Thailand) Company Limited – – 0.33 0.29Oracle de Centroamérica, S.A. – 1.33 – 0.23Oracle Hungary Kft. 34.34 7.76 26.43 –Oracle Systems Limited - Saudi Arabia 18.40 46.93 1.14 15.83Oracle Portugal - Sistemas de Informação Lda. 68.64 56.52 61.37 53.65Oracle do Brasil Sistemas Limitada 60.18 – – –Oracle Software (Schweiz) GmbH 2.66 – 2.63 –Oracle Systems Hong Kong Limited 1.63 – 1.58 –Oracle East Central Europe Services BV 94.79 14.33 94.74 –
SubsidiariesOracle Financial Services Software B.V. 5,204.92 5,645.18 1,893.66 1,166.81Oracle Financial Services Software, Inc. 6,839.87 5,578.79 2,500.44 2,233.79Oracle Financial Services Software Pte. Ltd. 7,049.46 5,342.28 3,599.36 2,303.37Oracle Financial Services Consulting Pte. Ltd. – – 1.99 3.12Oracle Financial Services Software (Shanghai) Limited 606.77 312.21 1,084.57 403.82Oracle Financial Services Software Chile Limitada 101.01 2.48 2.83 2.47Oracle (OFSS) BPO Services Inc. – – 22.64 19.76Oracle (OFSS) BPO Services Limited – – 1.43 1.43Oracle Financial Services Software SA 743.79 621.67 225.42 159.80Oracle (OFSS) ASP Private Limited – 1.56 (0.10) 1.58
Unbilled revenueFellow Subsidiaries
Oracle America, Inc – – 43.31 110.96Oracle Corporation (South Africa)(Pty) Limited – – 29.03 36.45Oracle Hungary Kft. – – 7.30 7.74Oracle India Private Limited – – – 2.99Oracle Portugal - Sistemas de Informação Lda. – – 12.17 6.76Oracle Systems Limited - Saudi Arabia – – 8.08 31.00Oracle Egypt Ltd. – – 0.91 –Oracle East Central Europe Services BV – – 13.22 14.30
SubsidiariesOracle Financial Services Software B.V. – – 573.39 587.27Oracle Financial Services Software Inc. – – 953.18 757.75Oracle Financial Services Software Pte. Ltd. – – 1,061.41 706.29Oracle Financial Services Software (Shanghai) Limited – – 190.13 89.82Oracle Financial Services Software Chile Limitada – – 101.01 0.01Oracle Financial Services Software SA – – 23.74 44.32
Deferred revenueFellow Subsidiaries
Oracle America, Inc – – (7.00) (8.63)Oracle Corporation Australia Pty. Limited – – (3.36) (3.01)Oracle Portugal - Sistemas de Informação Lda. – – (2.35) (2.33)
SubsidiariesOracle Financial Services Software B.V. – – (975.32) (730.55)Oracle Financial Services Software, Inc. – – (293.44) (235.42)
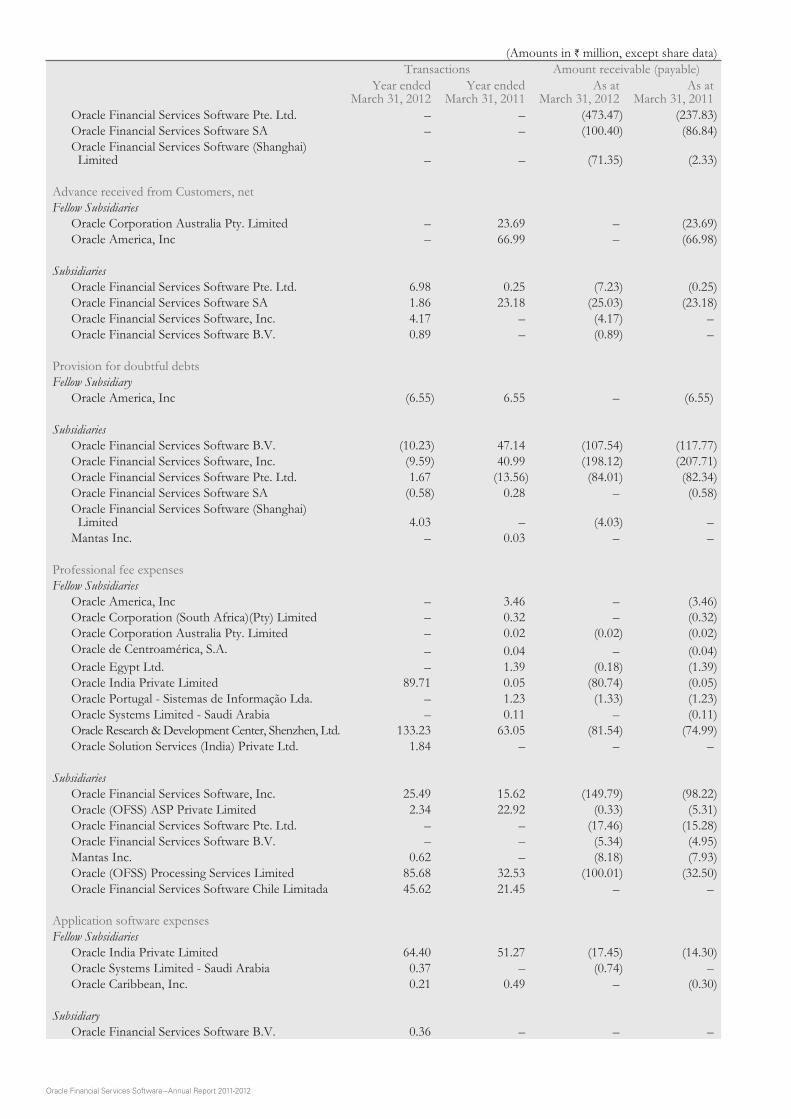
Oracle Financial Services Software – Annual Report 2011-2012
(Amounts in ` million, except share data)Transactions Amount receivable (payable)
Year endedMarch 31, 2012
Year endedMarch 31, 2011
As atMarch 31, 2012
As atMarch 31, 2011
Oracle Financial Services Software Pte. Ltd. – – (473.47) (237.83)Oracle Financial Services Software SA – – (100.40) (86.84)Oracle Financial Services Software (Shanghai) Limited – – (71.35) (2.33)
Advance received from Customers, netFellow Subsidiaries
Oracle Corporation Australia Pty. Limited – 23.69 – (23.69)Oracle America, Inc – 66.99 – (66.98)
SubsidiariesOracle Financial Services Software Pte. Ltd. 6.98 0.25 (7.23) (0.25)Oracle Financial Services Software SA 1.86 23.18 (25.03) (23.18)Oracle Financial Services Software, Inc. 4.17 – (4.17) –Oracle Financial Services Software B.V. 0.89 – (0.89) –
Provision for doubtful debtsFellow Subsidiary
Oracle America, Inc (6.55) 6.55 – (6.55)
SubsidiariesOracle Financial Services Software B.V. (10.23) 47.14 (107.54) (117.77)Oracle Financial Services Software, Inc. (9.59) 40.99 (198.12) (207.71)Oracle Financial Services Software Pte. Ltd. 1.67 (13.56) (84.01) (82.34)Oracle Financial Services Software SA (0.58) 0.28 – (0.58)Oracle Financial Services Software (Shanghai) Limited 4.03 – (4.03) –Mantas Inc. – 0.03 – –
Professional fee expensesFellow Subsidiaries
Oracle America, Inc – 3.46 – (3.46)Oracle Corporation (South Africa)(Pty) Limited – 0.32 – (0.32)Oracle Corporation Australia Pty. Limited – 0.02 (0.02) (0.02)Oracle de Centroamérica, S.A. – 0.04 – (0.04)Oracle Egypt Ltd. – 1.39 (0.18) (1.39)Oracle India Private Limited 89.71 0.05 (80.74) (0.05)Oracle Portugal - Sistemas de Informação Lda. – 1.23 (1.33) (1.23)Oracle Systems Limited - Saudi Arabia – 0.11 – (0.11)Oracle Research & Development Center, Shenzhen, Ltd. 133.23 63.05 (81.54) (74.99)Oracle Solution Services (India) Private Ltd. 1.84 – – –
SubsidiariesOracle Financial Services Software, Inc. 25.49 15.62 (149.79) (98.22)Oracle (OFSS) ASP Private Limited 2.34 22.92 (0.33) (5.31)Oracle Financial Services Software Pte. Ltd. – – (17.46) (15.28)Oracle Financial Services Software B.V. – – (5.34) (4.95)Mantas Inc. 0.62 – (8.18) (7.93)Oracle (OFSS) Processing Services Limited 85.68 32.53 (100.01) (32.50)Oracle Financial Services Software Chile Limitada 45.62 21.45 – –
Application software expensesFellow Subsidiaries
Oracle India Private Limited 64.40 51.27 (17.45) (14.30)Oracle Systems Limited - Saudi Arabia 0.37 – (0.74) –Oracle Caribbean, Inc. 0.21 0.49 – (0.30)
SubsidiaryOracle Financial Services Software B.V. 0.36 – – –

109
(Amounts in ` million, except share data)Transactions Amount receivable (payable)
Year endedMarch 31, 2012
Year endedMarch 31, 2011
As atMarch 31, 2012
As atMarch 31, 2011
Reimbursement of expensesSubsidiaries
Oracle Financial Services Software B.V. 794.70 954.09 (145.63) (291.58)Oracle Financial Services Software Inc. 2,188.68 2,052.03 (1,335.70) (707.08)Oracle Financial Services Software Pte. Ltd. 2,302.78 1,635.46 (252.83) (796.92)Oracle (OFSS) Processing Services Limited (0.04) (1.97) 48.62 48.58Oracle (OFSS) ASP Private Limited 14.89 (10.27) 22.20 74.33Oracle Financial Services Software (Shanghai) Limited 169.76 53.99 (184.40) (53.92)
Key managerial personnelRemuneration [Refer note 1 below] 29.41 40.32 – –
Rent expensesFellow Subsidiaries
Oracle Nederland B.V. – 6.78 – (1.66)Oracle Systems Limited - Cyprus 0.43 0.43 (0.08) (0.03)
Other expensesFellow Subsidiaries
Oracle India Private Limited – 3.27 – –Oracle Corporation (South Africa)(Pty) Limited 12.39 31.54 – –Oracle Corporation Singapore Pte. Ltd. 1.48 – (0.16) –
Procurement of fixed assetsFellow Subsidiaries
Oracle Corporation Singapore Pte. Ltd. 46.91 11.39 – –
Loan outstandingSubsidiaries
Oracle Financial Services Software America, Inc. [Refer note 2 below] 65.08 (4.77) 511.22 446.14ISP Internet Mauritius Company [Refer note 2 below] 6.18 (0.45) 48.56 42.38Oracle (OFSS) BPO Services Limited [Refer note 3 below] (100.00) (200.00) 200.00 300.00
Interest on loan givenSubsidiaries
Oracle Financial Services Software America, Inc. 4.90 5.01 127.66 106.87ISP Internet Mauritius Company 1.62 1.53 12.50 9.40
Provision for diminution in investmentSubsidiaries
ISP Internet Mauritius Company – – (120.00) (120.00)Oracle (OFSS) ASP Private Limited – 25.42 (46.10) (46.10)
Investments during the yearSubsidiaries
Oracle Financial Services Software Chile Limitada – 70.49 – –Note:
1. Remuneration includes salary, bonus and perquisites. The bonus is included on payment basis. As the liabilities for gratuity and compensated absence are provided on an actuarial basis for the Company as a whole, the amounts pertaining to individual KMP are not included above. During the year 30,000 options under the Scheme 2011 (March 31, 2011 - 60,000 options under the Scheme 2002 and 10,600 options under the Scheme 2010) were granted to KMP.
2. Loan given to subsidiaries represents loan to Oracle Financial Services Software America, Inc. amounting to ` 511.22 (interest LIBOR + 50 basis points) as at March 31, 2012 (March 31, 2011 - ` 446.14) and ISP Internet Mauritius Company amounting to ` 48.56 (interest LIBOR + 50 basis points) as at March 31, 2012 (March 31, 2011 - ` 42.38). No additional loans have been given during the year. The amount shown above is towards the revaluation impact of the outstanding loans.
3. During the year ended March 31, 2011, the Company had signed a settlement agreement with Oracle (OFSS) BPO Services Limited while repaying ` 200.00 along with an interest waiver on the same. Further to this, the outstanding amount as on March 31, 2011 will be repaid in 10 equal annual installments.

Oracle Financial Services Software – Annual Report 2011-2012
(Amounts in ` million, except share data) Year ended
March 31, 2012 Year ended
March 31, 2011Note 28: Auditors’ remunerationStatutory audits (including quarterly audits for the year ended March 31, 2011) 2.25 6.18Limited Review 3.09 –Tax audit 0.79 0.74Certifications 1.19 0.62Out-of-pocket expenses 0.55 0.54
7.86 8.08
Note 29: Earnings in foreign currency (on accrual basis)Product licenses and related revenue 18,194.79 15,306.21IT solutions and consulting services 6,838.99 7,355.84Dividend income [Refer note 19] 3,108.30 –Interest income 6.52 4.82
28,148.60 22,666.87
Note 30: Expenditure in foreign currency (on accrual basis)Employee costs 5,718.97 4,428.44Travel related expenses (net of recoveries) 714.39 824.65Professional fees 1,027.30 632.45Application software 42.14 (11.51)Foreign taxes 119.88 341.88Exceptional item [Refer note 19] 693.32 122.07Miscellaneous expenses 81.39 28.40
8,397.39 6,366.38
Note 31: Value of imports on CIF basis - capital goods 179.47 96.54
Note 32: Investments in wholly owned subsidiaries
(a) As at March 31, 2012, the Company has total investment of ` 6,291.74 in Oracle Financial Services Software America, Inc. ('OAI'). Further, the Company has loan outstanding of ` 511.22 to OAI. OAI is the holding company for US operations and has acquired companies in earlier years. On a consolidated basis, OAI along with subsidiaries (‘OAI Group’) has accumulated losses of ` 520.66 as at March 31, 2012. The OAI Group has posted a profit of ` 464.16 for the year ended March 31, 2012. Based on the assessment of the estimated future cash flows from the US operations and the results of the current year, the management of the Company believes that no provision is required towards diminution in the value of investment in OAI as at March 31, 2012.
(b) As at March 31, 2012, the Company has total investment of ` 192.12 in ISP Internet Mauritius Company ('ISP') which is the holding company of Oracle (OFSS) BPO Services Inc., US and Oracle (OFSS) BPO Services Limited, India, entities operating in business of Business Process Outsourcing (BPO). Further, the Company has an outstanding loan of ` 48.56 from ISP and ` 200.00 from Oracle (OFSS) BPO Services Limited as at March 31, 2012. On a consolidated basis, ISP and its subsidiaries (‘ISP Group’) have accumulated losses amounting to ` 226.08 as at March 31, 2012. However ISP Group has posted a profit of` 47.73 for the year ended March 31, 2012. Accordingly, the Company believes that ` 120.00 recorded as diminution in value of investment in earlier year is appropriate and no further diminution in value is considered necessary as at the balance sheet date.
Note 33: Tax expenses Year ended Year endedMarch 31, 2012 March 31, 2011
a) Break up of current tax is as follows:Current Tax 4,716.97 2,405.16Less : MAT credit entitlement – (1,434.97)Net Current Tax liability 4,716.97 970.19
b) During the year ended March 31, 2011, the Company has recorded income tax expenses of ` 337.41 related to previous years.
Note 34:
Till the year ended March 31, 2011, the Company was using pre-revised Schedule VI to the Companies Act 1956, for preparation and presentation of its financial statements. During the year ended 31 March 2012, the revised Schedule VI notified under the Companies Act 1956, has become applicable to the Company. The Company has reclassified previous year figures to conform to this year’s classification.
As per our report of even date attached For and on behalf of the Board of DirectorsOracle Financial Services Software Limited
For S. R. Batliboi & AssociatesFirm Registration number: 101049WChartered Accountants
Chaitanya KamatManaging Director& Chief Executive Officer
Y M KaleDirector
per Amit MajmudarPartnerMembership No.: 36656
Hoshi D BhagwagarCompany Secretary& Compliance Officer
S VenkatachalamDirector
Mumbai, IndiaMay 11, 2012
Mumbai, IndiaMay 11, 2012

111
(Amounts in ` million)Year ended March
31, 2012Year ended March
31, 2011
Cash flows from operating activitiesProfit before tax 15,658.93 10,343.88
Adjustments to reconcile profit before taxes to cash (used in) provided by operating activities:
Depreciation and amortization 401.19 336.49(Profit) loss on sale of fixed assets, net 16.57 (5.01)Interest income (2,697.50) (1,364.15)Dividend income [Refer note 19] (3,108.30) –Provision for diminution in value of investment – 25.42Effect of exchange rate changes in cash and cash equivalent 46.26 (68.41)Unrealized exchange (gain) loss, net (387.85) 101.75Finance charge on leased assets 1.92 2.13Deferred rent 2.53 88.10Provision for doubtful debts, net (150.71) 199.52Bad debts 62.78 0.04
Operating Profit before Working Capital changes 9,845.82 9,659.76
Movements in working capital(increase) decrease in trade receivables (3,312.87) 864.55Increase in other current assets (468.17) (1,171.73)(Decrease) increase in short-term loans and advances 44.22 (11.38)Decrease in long-term loans and advances (33.03) 2.08Increase in trade payables 119.34 41.65Decrease in other current liabilities 1,357.20 (181.39)Increase in other long-term liabilities (9.54) 195.17Increase in other short-term provisions (18.57) 166.59Increase in other long-term provisions 23.83 84.59Cash from operating activities 7,548.23 9,649.89Payment of domestic and foreign taxes (3,172.43) (2,499.95)Net cash provided by operating activities 4,375.80 7,149.94
Cash flows from investing activitiesAdditions to fixed assets including capital work-in-progress and advances (766.20) (647.74)Net investment in lease – 8.22Repayment of non-current loan by subsidiary company 100.00 200.00Investment in subsidiary company – (70.49)Placement of long-term office deposits 275.86 (598.53)Refund of short-term office deposits 126.21 606.62Proceeds from sale of fixed assets 5.04 5.18Bank fixed deposits having maturity of more than three months matured 52,073.00 35,687.73Bank fixed deposits having maturity of more than three months booked (61,283.00) (46,281.16)Dividend received from subsidiaries [Refer note 19] 3,108.30 –Interest received 2,488.14 1,035.75Net cash (used) in investing activities (3,872.65) (10,054.42)
Statement of cash flowfor the year ended March 31, 2012

Oracle Financial Services Software – Annual Report 2011-2012
Statement of cash flow (continued)for the year ended March 31, 2012
(Amounts in ` million)Year ended March
31, 2012Year ended March
31, 2011Cash flows from financing activitiesIssue of shares against Employee Stock Option scheme 74.78 42.83Payment of lease obligations (10.42) (12.22)Net cash provided by financing activities 64.36 30.61
Net increase in cash and cash equivalents 567.51 (2,873.87)Cash and cash equivalents at beginning of the year 1,077.50 3,882.96Effect of exchange rate changes (46.26) 68.41Cash and cash equivalents at end of the year 1,598.75 1,077.50
Component of cash and cash equivalentsCash on hand 0.42 0.47Cheques on hand 0.55 0.49Balances with banks: Current accounts* 1,591.81 1,046.98 Deposit accounts with original maturity of less than 3 months 3.76 26.10 Unclaimed dividend accounts 2.21 3.46Total cash and cash equivalents [Refer note 14(a)] 1,598.75 1,077.50
* Includes balance of ` Nil (March 31, 2011 - ` 24.32) with Central Bank of Libya which is not freely remissible to the Company due to unstable conditions in Libya.
As per our report of even date For and on behalf of the Board of DirectorsOracle Financial Services Software Limited
For S. R. Batliboi & AssociatesFirm Registration No. 101049WChartered Accountants
Chaitanya KamatManaging Director& Chief Executive Officer
Y M KaleDirector
per Amit MajmudarPartnerMembership No.: 36656
Hoshi D BhagwagarCompany Secretary& Compliance Officer
S VenkatachalamDirector
Mumbai, IndiaMay 11, 2012
Mumbai, IndiaMay 11, 2012

113
Sta
tem
ent
pu
rsu
ant
to S
ecti
on
212
of
the
Co
mp
anie
s A
ct, 1
956
rela
tin
g t
o S
ub
sid
iary
Co
mp
anie
s
(Am
ount
s in
` m
illio
n, e
xcep
t sha
re d
ata)
O
racle
Fin
ancia
l Ser
vice
s So
ftwar
e B.
V.
Ora
cle F
inan
cial S
ervi
ces
Softw
are
SAO
racle
Fin
ancia
l Ser
vice
s So
ftwar
e Pt
e. Lt
d.O
racle
Fin
ancia
l Ser
vice
s Co
nsul
ting
Pte.
Ltd.
Ora
cle F
inan
cial S
ervi
ces
Softw
are
Am
erica
, Inc
.
The
Fina
ncial
Yea
r of t
he S
ubsid
iary
Com
pany
en
ded
on M
arch
31,
201
2 M
arch
31,
201
2 M
arch
31,
201
2 M
arch
31,
201
2 M
arch
31,
201
2
Hol
ding
Com
pany
Ora
cle F
inan
cial S
ervi
ces
Softw
are
Lim
ited
Ora
cle F
inan
cial S
ervi
ces
Softw
are
B.V
.O
racle
Fin
ancia
l Ser
vice
s So
ftwar
e Li
mite
dO
racle
Fin
ancia
l Ser
vice
s So
ftwar
e Pt
e. Lt
d.O
racle
Fin
ancia
l Ser
vice
s So
ftwar
e Li
mite
d
Hol
ding
Com
pany
's in
tere
st10
0%10
0%10
0%10
0%10
0%
Shar
es h
eld b
y th
e H
oldi
ng C
ompa
ny in
the
Subs
idiar
y14
0,00
0 eq
uity
shar
es o
f E
UR
100
each
, fu
lly p
aid-u
p
60,0
00 sh
ares
of
EU
R 1
each
, fu
lly p
aid-u
p
250,
000
shar
es o
f SG
D 1
eac
h
fully
paid
-up
16,1
85,1
70 sh
ares
of
SGD
1 e
ach
fu
lly p
aid-u
p
1 E
quity
shar
e of
U
SD 0
.01
each
fu
lly p
aid-u
p
Net
agg
rega
te o
f Pro
fit/(
loss
es) o
f the
subs
idiar
y so
far a
s it c
once
rns t
he M
embe
rs o
f the
Hol
ding
Com
pany
and
is n
ot d
ealt
with
in th
e ac
coun
ts o
f the
Hol
ding
Com
pany
a. fo
r the
fina
ncial
yea
r end
ed o
n M
arch
31,
201
2 3
68.2
1 8
0.28
2
37.7
8 (2
3.09
) (9
6.14
)
b.
for t
he p
revi
ous f
inan
cial y
ears
of t
he su
bsid
iary
since
it b
ecam
e a
subs
idiar
y 2
,345
.52
272
.03
1,7
08.6
2 (1
76.6
0) (6
47.3
2)
Net
agg
rega
te o
f Pro
fit/(
loss
es) o
f the
subs
idiar
y so
far a
s it c
once
rns t
he M
embe
rs o
f the
Hol
ding
Com
pany
and
is d
ealt
with
or p
rovi
ded
for i
n th
e ac
coun
ts o
f the
Hol
ding
Com
pany
a. fo
r the
fina
ncial
yea
r end
ed o
n M
arch
31,
201
2–
––
––
b.
for t
he p
revi
ous f
inan
cial y
ears
of t
he su
bsid
iary
since
it b
ecam
e a
subs
idiar
y–
––
––

Oracle Financial Services Software – Annual Report 2011-2012
Sta
tem
ent
pu
rsu
ant
to S
ecti
on
212
of
the
Co
mp
anie
s A
ct, 1
956
rela
tin
g t
o S
ub
sid
iary
Co
mp
anie
s (c
on
tin
ued
)
(Am
ount
s in
` m
illio
n, e
xcep
t sha
re d
ata)
O
racle
Fin
ancia
l Ser
vice
s So
ftwar
e, In
c.M
anta
s Inc
.M
anta
s Ltd
.1So
tas I
nc.
Man
tas S
inga
pore
Pte
. Lt
d.2
The
Fina
ncial
Yea
r of t
he S
ubsid
iary
Com
pany
en
ded
on M
arch
31,
201
2 M
arch
31,
201
2 M
arch
31,
201
2 M
arch
31,
201
2M
arch
1, 2
012
Hol
ding
Com
pany
Ora
cle F
inan
cial S
ervi
ces
Softw
are
Am
erica
, Inc
.O
racle
Fin
ancia
l Ser
vice
s So
ftwar
e A
mer
ica, I
nc.
Man
tas I
nc.
Man
tas I
nc.
Man
tas I
nc.
Hol
ding
Com
pany
's in
tere
st10
0%10
0%10
0%10
0%10
0%
Shar
es h
eld b
y th
e H
oldi
ng C
ompa
ny in
the
Subs
idiar
yN
IL1
shar
e of
USD
0.0
1 pa
r va
lue
com
mon
stoc
k at
U
SD 1
.00
NIL
NIL
NIL
Net
agg
rega
te o
f Pro
fit/(
loss
es) o
f the
subs
idiar
y so
far a
s it c
once
rns t
he M
embe
rs o
f the
Hol
ding
Com
pany
and
is n
ot d
ealt
with
in th
e ac
coun
ts o
f the
Hol
ding
Com
pany
a. fo
r the
fina
ncial
yea
r end
ed o
n M
arch
31,
201
2 5
39.1
6 2
0.21
0
.20
(0.0
6) (0
.06)
b.
for t
he p
revi
ous f
inan
cial y
ears
of t
he su
bsid
iary
since
it b
ecam
e a
subs
idiar
y (2
95.3
9) (4
9.95
) 1
.80
(0.4
1) (0
.42)
Net
agg
rega
te o
f Pro
fit/(
loss
es) o
f the
subs
idiar
y so
far a
s it c
once
rns t
he M
embe
rs o
f the
Hol
ding
Com
pany
and
is d
ealt
with
or p
rovi
ded
for i
n th
e ac
coun
ts o
f the
Hol
ding
Com
pany
a. fo
r the
fina
ncial
yea
r end
ed o
n M
arch
31,
201
2–
––
––
b.
for t
he p
revi
ous f
inan
cial y
ears
of t
he su
bsid
iary
since
it b
ecam
e a
subs
idiar
y–
––
––
1 Diss
olve
d on
Apr
il 10
, 201
22 D
issol
ved
on M
arch
1, 2
012

115
Sta
tem
ent
pu
rsu
ant
to S
ecti
on
212
of
the
Co
mp
anie
s A
ct, 1
956
rela
tin
g t
o S
ub
sid
iary
Co
mp
anie
s (c
on
tin
ued
)
(Am
ount
s in
` m
illio
n, e
xcep
t sha
re d
ata)
M
anta
s Ind
ia Pr
ivat
e Li
mite
dIS
P In
tern
et M
aurit
ius
Com
pany
Ora
cle (O
FSS)
BPO
Se
rvice
s Inc
.O
racle
(OFS
S) B
PO
Serv
ices L
imite
dO
racle
(OFS
S) P
roce
ssin
g Se
rvice
s Lim
ited
The
Fina
ncial
Yea
r of t
he S
ubsid
iary
Com
pany
en
ded
on M
arch
31,
201
2 M
arch
31,
201
2 M
arch
31,
201
2 M
arch
31,
201
2M
arch
31,
201
2
Hol
ding
Com
pany
Sota
s Inc
.O
racle
Fin
ancia
l Ser
vice
s So
ftwar
e Li
mite
dIS
P In
tern
et M
aurit
ius
Com
pany
IS
P In
tern
et M
aurit
ius
Com
pany
O
racle
Fin
ancia
l Ser
vice
s So
ftwar
e Li
mite
d
Hol
ding
Com
pany
's in
tere
st10
0%10
0%10
0%10
0%10
0%
Shar
es h
eld b
y th
e H
oldi
ng C
ompa
ny in
the
Subs
idiar
y15
,00,
000
Equ
ity S
hare
s of
` 10
/- e
ach
fully
paid
-up
25,2
00 S
eries
A o
rdin
ary
shar
es o
f No
Par v
alue
4,80
0 Se
ries B
ord
inar
y sh
ares
of N
o Pa
r valu
e
20,0
00 c
omm
on st
ock
of
USD
0.0
1 ea
ch5,
819,
360
equi
ty sh
ares
of
` 10
/- e
ach
fully
paid
-up
1,30
0,00
0 E
quity
shar
es o
f `
10/-
eac
h fu
lly p
aid-u
p
Net
agg
rega
te o
f Pro
fit/(
loss
es) o
f the
subs
idiar
y so
far a
s it c
once
rns t
he M
embe
rs o
f the
Hol
ding
Com
pany
and
is n
ot d
ealt
with
in th
e ac
coun
ts o
f the
Hol
ding
Com
pany
a. fo
r the
fina
ncial
yea
r end
ed o
n M
arch
31,
201
2 0
.78
0.8
7 (6
.80)
78.
46 9
9.59
b.
for t
he p
revi
ous f
inan
cial y
ears
of t
he su
bsid
iary
since
it b
ecam
e a
subs
idiar
y (0
.87)
(30.
85)
(352
.71)
89.
05
154
.76
Net
agg
rega
te o
f Pro
fit/(
loss
es) o
f the
subs
idiar
y so
far a
s it c
once
rns t
he M
embe
rs o
f the
Hol
ding
Com
pany
and
is d
ealt
with
or p
rovi
ded
for i
n th
e ac
coun
ts o
f the
Hol
ding
Com
pany
a. fo
r the
fina
ncial
yea
r end
ed o
n M
arch
31,
201
2–
––
––
b.
for t
he p
revi
ous f
inan
cial y
ears
of t
he su
bsid
iary
since
it b
ecam
e a
subs
idiar
y–
––
––

Oracle Financial Services Software – Annual Report 2011-2012
Sta
tem
ent
pu
rsu
ant
to S
ecti
on
212
of
the
Co
mp
anie
s A
ct, 1
956
rela
tin
g t
o S
ub
sid
iary
Co
mp
anie
s (c
on
tin
ued
)
(Am
ount
s in
` m
illio
n, e
xcep
t sha
re d
ata)
O
racle
(OFS
S) A
SP P
rivat
e Li
mite
dO
racle
Fin
ancia
l Ser
vice
s So
ftwar
e Ch
ile L
imita
daO
racle
Fin
ancia
l Ser
vice
s So
ftwar
e (S
hang
hai)
Lim
ited
The
Fina
ncial
Yea
r of t
he S
ubsid
iary
Com
pany
end
ed o
n M
arch
31,
201
2 M
arch
31,
201
2 M
arch
31,
201
2
Hol
ding
Com
pany
Ora
cle F
inan
cial S
ervi
ces
Softw
are
Lim
ited
Ora
cle F
inan
cial S
ervi
ces
Softw
are
Lim
ited
Ora
cle F
inan
cial S
ervi
ces
Softw
are
Lim
ited
Hol
ding
Com
pany
's in
tere
st10
0%10
0%10
0%
Shar
es h
eld b
y th
e H
oldi
ng C
ompa
ny in
the
Subs
idiar
y51
,70,
000
Equ
ity S
hare
s of
` 10
/- e
ach
fully
paid
-up
N.A
.N
.A.
Net
agg
rega
te o
f Pro
fit/(
loss
es) o
f the
subs
idiar
y so
far a
s it c
once
rns t
he M
embe
rs o
f the
Hol
ding
Com
pany
and
is n
ot d
ealt
with
in th
e ac
coun
ts o
f the
Hol
ding
Com
pany
a.
for t
he fi
nanc
ial y
ear e
nded
on
Mar
ch 3
1, 2
012
(1.1
7) (2
0.68
) 4
3.58
b.
for t
he p
revi
ous f
inan
cial y
ears
of t
he su
bsid
iary
since
it b
ecam
e a
subs
idiar
y (2
5.90
) (6
0.07
) 6
6.84
Net
agg
rega
te o
f Pro
fit/(
loss
es) o
f the
subs
idiar
y so
far a
s it c
once
rns t
he M
embe
rs o
f the
Hol
ding
Com
pany
and
is d
ealt
with
or p
rovi
ded
for i
n th
e ac
coun
ts o
f the
Hol
ding
Com
pany
a. f
or th
e fin
ancia
l yea
r end
ed o
n M
arch
31,
201
2–
––
b.
for t
he p
revi
ous f
inan
cial y
ears
of t
he su
bsid
iary
since
it b
ecam
e a
subs
idiar
y–
––
For a
nd o
n be
half
of th
e Bo
ard
of D
irect
ors
Ora
cle F
inan
cial S
ervi
ces S
oftw
are
Lim
ited
Ch
aita
nya
Kam
atM
anag
ing
Dire
ctor
& C
hief
Exe
cutiv
e O
ffice
r
Y M
Kal
e D
irect
or
Hos
hi D
Bh
agw
agar
Co
mpa
ny S
ecre
tary
&
Com
plian
ce O
ffice
r
S V
enka
tach
alam
Dire
ctor
Mu
mb
ai, I
nd
iaM
ay 1
1, 2
012

117
Sta
tem
ent
un
der
Sec
tio
n 2
12(8
) o
f th
e C
om
pan
ies
Act
, 195
6 re
lati
ng
to
Su
bsi
dia
ry C
om
pan
ies (A
mou
nts i
n `
mill
ion,
exc
ept s
hare
dat
a)N
ame
of th
e su
bsid
iary
com
pany
Repo
rting
Cu
rren
cyE
xcha
nge
Rate
3Sh
are
Capi
tal
Rese
rves
4To
tal
Ass
ets
Tota
l Li
abili
ties
Inve
stm
ent
othe
r tha
n In
vest
men
t in
Subs
idiar
y
Turn
over
Prof
it/(L
oss)
be
fore
Ta
xatio
n
Prov
ision
fo
r Ta
xatio
n
Prof
it af
ter
Taxa
tion
Prop
osed
D
ivid
end
Coun
try o
f In
corp
orat
ion
Ora
cle F
inan
cial S
ervi
ces
Softw
are
B.V
.6E
UR
68.
22
776
.31
880
.43
4,5
52.3
2 2
,895
.58
–
6,0
96.8
0 3
96.4
1 (2
8.20
) 3
68.2
1 –
Th
e N
ethe
rland
s
Ora
cle F
inan
cial S
ervi
ces
Softw
are
SAE
UR
68.
22
723
.65
361
.75
1,4
30.8
7 3
45.4
7 –
9
25.1
4 1
12.9
6 (3
2.68
) 8
0.28
–
G
reec
e
Ora
cle F
inan
cial S
ervi
ces
Softw
are
Pte.
Ltd.
7U
SD 5
1.12
6
.63
671
.40
6,1
41.3
4 5
,463
.31
–
8,4
83.3
6 3
43.7
4 (1
05.9
6) 2
37.7
8 –
Si
ngap
ore
Ora
cle F
inan
cial S
ervi
ces
Cons
ultin
g Pt
e. Lt
d.U
SD 5
1.12
4
6.37
(1
99.6
9) 4
5.43
1
98.7
5 –
3
.53
(23.
09)
–
(23.
09)
–
Sing
apor
e
Ora
cle F
inan
cial S
ervi
ces
Softw
are
Am
erica
, Inc
.U
SD 5
1.12
5
,810
.57
(203
.69)
6,5
53.7
5 9
46.8
7 –
–
(9
1.80
) (4
.34)
(96.
14)
–
USA
Ora
cle F
inan
cial S
ervi
ces
Softw
are,
Inc.
USD
51.
12
–
788
.99
10,
350.
45
9,5
61.4
6 –
9
,700
.87
619
.39
(80.
23)
539
.16
–
USA
Man
tas I
nc.
USD
51.
12
5,6
50.1
7 (7
68.1
1) 4
,893
.35
11.
29
–
–
20.
84
(0.6
3) 2
0.21
–
U
SA
Man
tas L
td.1
GBP
81.
61
–
2.1
6 5
.10
2.9
4 –
–
0
.20
–
0.2
0 –
U
K
Sota
s Inc
.U
SD 5
1.12
–
(0
.50)
–
0.5
0 –
–
(0
.06)
–
(0.0
6) –
U
SA
Man
tas S
inga
pore
Pte
. Ltd
.2U
SD 5
1.12
–
(0
.49)
0.0
7 0
.56
–
–
(0.0
6) –
(0
.06)
–
Sing
apor
e
Man
tas I
ndia
Priv
ate
Lim
ited
INR
1.0
0 1
5.00
(0
.09)
15.
05
0.1
4 –
–
0
.89
(0.1
1) 0
.78
–
Indi
a
ISP
Inte
rnet
Mau
ritiu
s Co
mpa
nyU
SD 5
1.12
1
39.9
8 (2
0.48
) 1
80.5
6 6
1.06
–
–
0
.87
–
0.8
7 –
Re
publ
ic of
M
aurit
ius
Ora
cle (O
FSS)
BPO
Ser
vice
s In
c. U
SD 5
1.12
–
(4
37.8
8) 8
2.07
5
19.9
5 –
3
23.0
0 (6
.67)
(0.1
3) (6
.80)
–
USA
Ora
cle (O
FSS)
BPO
Ser
vice
s Li
mite
dIN
R 1
.00
58.
19
167
.51
500
.61
274
.91
–
259
.06
70.
53
7.9
3 7
8.46
–
In
dia
Ora
cle (O
FSS)
Pro
cess
ing
Serv
ices L
imite
dIN
R 1
.00
13.
00
254
.35
342
.30
74.
95 –
2
83.8
1 1
51.1
8 (5
1.59
) 9
9.59
–
In
dia

Oracle Financial Services Software – Annual Report 2011-2012
Sta
tem
ent
un
der
Sec
tio
n 2
12(8
) o
f th
e C
om
pan
ies
Act
, 195
6 re
lati
ng
to
Su
bsi
dia
ry C
om
pan
ies
(co
nti
nu
ed)
1 D
issol
ved
on A
pril
10, 2
012
2 D
issol
ved
on M
arch
1, 2
012
3 E
xcha
nge
rate
as o
f Mar
ch 3
1, 2
012
4 Th
e re
serv
e fig
ures
hav
e ch
ange
d du
e to
aud
it ad
just
men
t ent
ries p
asse
d po
st b
alanc
e sh
eet d
ate.
5 A
ccou
ntin
g po
licy
adop
ted
for f
oreig
n cu
rren
cy tr
ansa
ctio
ns a
re si
mila
r to
thos
e ad
opte
d in
con
solid
ated
fina
ncial
s.6 D
urin
g th
e ye
ar th
e Co
mpa
ny re
ceiv
ed d
ivid
end
of `
1,8
33.3
0 m
illio
n (E
UR
27 m
illio
n) fr
om it
s sub
sidiar
y O
racle
Fin
ancia
l Ser
vice
s Sof
twar
e B.
V.
7 D
urin
g th
e ye
ar th
e Co
mpa
ny re
ceiv
ed d
ivid
end
of `
1,2
75.0
0 m
illio
n (U
SD 2
5 m
illio
n) fr
om it
s sub
sidiar
y O
racle
Fin
ancia
l Ser
vice
s Sof
twar
e Pt
e. Lt
d.
For a
nd o
n be
half
of th
e Bo
ard
of D
irect
ors
Ora
cle F
inan
cial S
ervi
ces S
oftw
are
Lim
ited
Ch
aita
nya
Kam
atM
anag
ing
Dire
ctor
& C
hief
Exe
cutiv
e O
ffice
r
Y M
Kal
e D
irect
or
Hos
hi D
Bh
agw
agar
Co
mpa
ny S
ecre
tary
&
Com
plian
ce O
ffice
r
S V
enka
tach
alam
Dire
ctor
Mu
mb
ai, I
nd
iaM
ay 1
1, 2
012
The C
ompa
ny p
rese
nts a
udite
d co
nsol
idat
ed fi
nanc
ial st
atem
ents
und
er In
dian
GA
AP
in it
s Ann
ual R
epor
t. Th
e acc
ount
s and
relat
ed re
ports
of t
he su
bsid
iary c
ompa
nies
are n
ot at
tach
ed to
the A
nnua
l Rep
ort o
f the
Com
pany
fo
r the
year
ende
d M
arch
31,
201
2 in
term
s of t
he g
ener
al ex
empt
ion
prov
ided
by t
he M
inist
ry o
f Com
pany
Affa
irs v
ide G
ener
al Ci
rcul
ar N
o. :
2/20
11 d
ated
Feb
ruar
y 8, 2
011
and
that
the C
ompa
ny h
as fu
lfille
d th
e con
ditio
ns
stat
ed th
erein
.
The
Com
pany
will
mak
e av
ailab
le th
e ac
coun
ts a
nd r
epor
ts o
f th
e su
bsid
iary
com
pani
es u
pon
requ
est b
y an
y m
embe
r/in
vest
or o
f th
e Co
mpa
ny o
r its
sub
sidiar
y co
mpa
nies
. The
acc
ount
s an
d re
ports
of
the
subs
idiar
y co
mpa
nies
will
be
kept
ope
n fo
r ins
pect
ion
by a
ny m
embe
r at t
he re
gist
ered
offi
ce o
f the
Com
pany
and
the
regi
ster
ed o
ffice
of t
he su
bsid
iaries
dur
ing
offic
e ho
urs o
f the
Com
pany
/sub
sidiar
ies. T
he C
ompa
ny w
ill a
lso m
ake
the
sam
e av
ailab
le at
its w
ebsit
e w
ww
.ora
cle.co
m/f
inan
cialse
rvice
s.
(Am
ount
s in
` m
illio
n, e
xcep
t sha
re d
ata)
Nam
e of
the
subs
idiar
y co
mpa
nyRe
porti
ng
Curr
ency
Exc
hang
e Ra
te3
Shar
e Ca
pita
lRe
serv
es4
Tota
l A
sset
sTo
tal
Liab
ilitie
sIn
vest
men
t ot
her t
han
Inve
stm
ent in
Subs
idiar
y
Turn
over
Prof
it/(L
oss)
be
fore
Ta
xatio
n
Prov
ision
fo
r Ta
xatio
n
Prof
it af
ter
Taxa
tion
Prop
osed
D
ivid
end
Coun
try o
f In
corp
orat
ion
Ora
cle (O
FSS)
ASP
Priv
ate
Lim
ited
INR
1.0
0 5
1.70
(2
6.30
) 5
2.62
2
7.22
–
2
7.46
(1
.13)
(0.0
4) (1
.17)
–
Indi
a
Ora
cle F
inan
cial S
ervi
ces
Softw
are
Chile
Lim
itada
CLP
0.1
0 7
0.49
(8
0.75
) 2
54.0
1 2
64.2
7 –
2
43.1
5 (1
5.66
) (5
.02)
(20.
68)
–
Chile
Ora
cle F
inan
cial S
ervi
ces
Softw
are
(Sha
ngha
i) Li
mite
dCN
Y 8
.12
45.
51
110
.42
1,4
89.3
4 1
,333
.41
–
748
.26
54.
03
(10.
45)
43.
58
–
Repu
blic
of
Chin
a
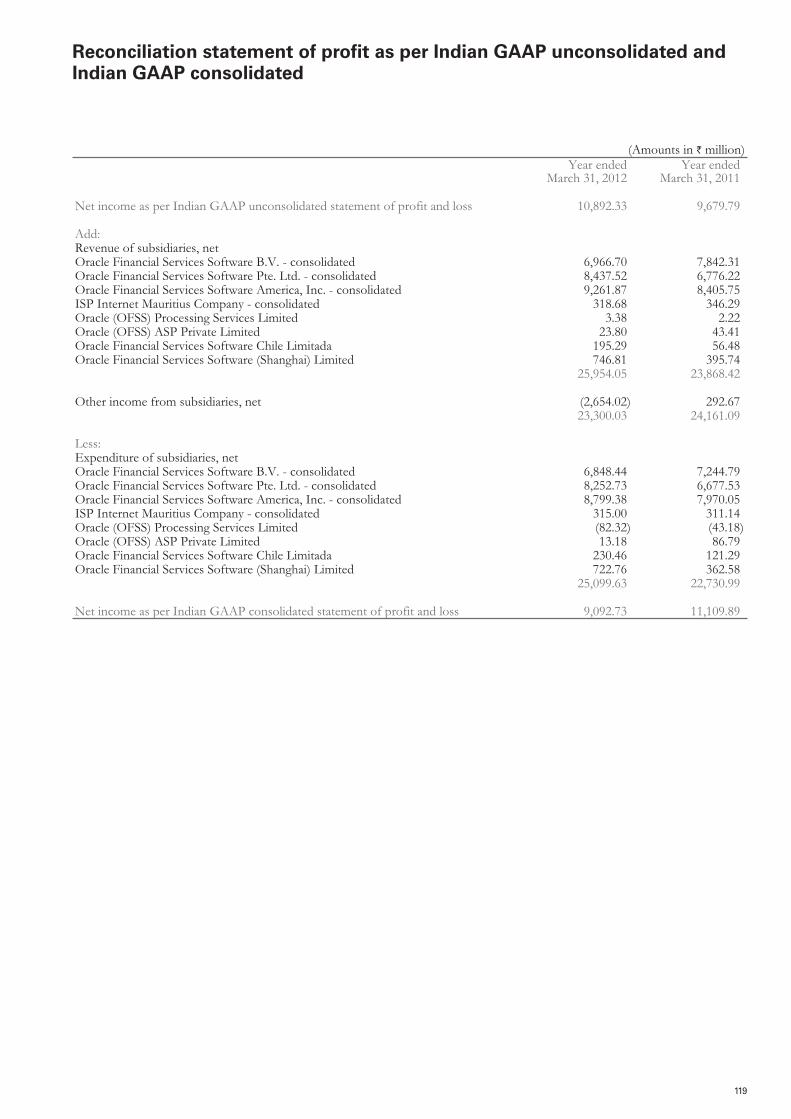
119
Reconciliation statement of profit as per Indian GAAP unconsolidated and Indian GAAP consolidated
(Amounts in ` million)Year ended
March 31, 2012Year ended
March 31, 2011
Net income as per Indian GAAP unconsolidated statement of profit and loss 10,892.33 9,679.79
Add:Revenue of subsidiaries, netOracle Financial Services Software B.V. - consolidated 6,966.70 7,842.31 Oracle Financial Services Software Pte. Ltd. - consolidated 8,437.52 6,776.22 Oracle Financial Services Software America, Inc. - consolidated 9,261.87 8,405.75 ISP Internet Mauritius Company - consolidated 318.68 346.29 Oracle (OFSS) Processing Services Limited 3.38 2.22 Oracle (OFSS) ASP Private Limited 23.80 43.41 Oracle Financial Services Software Chile Limitada 195.29 56.48 Oracle Financial Services Software (Shanghai) Limited 746.81 395.74
25,954.05 23,868.42
Other income from subsidiaries, net (2,654.02) 292.67 23,300.03 24,161.09
Less:Expenditure of subsidiaries, netOracle Financial Services Software B.V. - consolidated 6,848.44 7,244.79 Oracle Financial Services Software Pte. Ltd. - consolidated 8,252.73 6,677.53 Oracle Financial Services Software America, Inc. - consolidated 8,799.38 7,970.05 ISP Internet Mauritius Company - consolidated 315.00 311.14 Oracle (OFSS) Processing Services Limited (82.32) (43.18)Oracle (OFSS) ASP Private Limited 13.18 86.79 Oracle Financial Services Software Chile Limitada 230.46 121.29 Oracle Financial Services Software (Shanghai) Limited 722.76 362.58
25,099.63 22,730.99
Net income as per Indian GAAP consolidated statement of profit and loss 9,092.73 11,109.89

Oracle Financial Services Software – Annual Report 2011-2012
This page has been intentionally left blank.

121
Notice of Annual General Meeting

Oracle Financial Services Software – Annual Report 2011-2012
This page has been intentionally left blank.

123
Notice to members
NOTICE is hereby given that the Twenty Third Annual General Meeting of Oracle Financial Services Software Limited will be held at The Leela Kempinski, Sahar, Andheri (East), Mumbai 400059 on Friday, August 17, 2012 at 3.00 p.m. to transact the following business:
Ordinary Business:
on that date and the Reports of the Board of Directors and the Auditors thereon.
2. To appoint a Director in place of Mr. Y M Kale, who retires by rotation and, being eligible, offers himself for re-appointment.
3. To appoint a Director in place of Mr. Frank Brienzi, who retires by rotation and, being eligible, offers himself for re-appointment.
4. To appoint a Director in place of Mr. William Corey West, who retires by rotation and, being eligible, offers himself for re-appointment.
Special Business:
“RESOLVED THAT pursuant to the provisions of Section 228 and other applicable provisions, if any, of the Companies Act, 1956, the Board of Directors of the Company be and is hereby authorized to appoint Branch Auditors to conduct the audit of
By Order of the Board
Hoshi D Bhagwagar
Oracle Park Off Western Express Highway Goregaon (East) Mumbai 400063
July 10, 2012
Notes:
a. The information as required pursuant to Clause 49 of the listing agreement along with an Explanatory Statement as required under Section 173 (2) of the Companies Act, 1956 in respect of item no. 6 as mentioned in the above Notice are annexed hereto.
b. The Register of Members and the Share Transfer Books of the Company will remain closed from Saturday, August 11, 2012 to Friday, August 17, 2012, both days inclusive, for the purpose of Annual General Meeting.
c. A MEMBER ENTITLED TO ATTEND AND VOTE IS ENTITLED TO APPOINT A PROXY OR PROXIES TO ATTEND AND VOTE INSTEAD OF HIMSELF ON A POLL ONLY AND THAT A PROXY NEED NOT BE A MEMBER.
the commencement of the meeting.
e. The members/proxies are requested to bring duly completed Attendance Slips sent herewith for attending the meeting.
f. The documents referred to in the Notice and the Explanatory Statement annexed hereto are available for inspection by the
Company.
g. Members may please note that the Registrars and Transfer Agents have set up a separate cell to address various investor queries. Accordingly, the queries can be directed to +91-22-2594 6970 or can be e-mailed to [email protected]
h. Members who hold shares in physical form are requested to notify promptly any change in their addresses to the Company’s RegistraL.B.S. Marg, Bhandup (West), Mumbai 400078. The Members who hold shares in demat mode are requested to notify promptly, any change in their addresses to their respective Depository Participants.

Oracle Financial Services Software – Annual Report 2011-2012
i. As a part of Green Initiative in Corporate Governance, the Ministry of Corporate Affairs vide its Circular No. 17/2011 dated
of the Companies Act, 1956, if the service of a document has been made through electronic mode, provided the company has obtained e-mail address for sending the notice/documents through e-mail by giving an advance opportunity to the members to register their e-mail address and changes therein from time to time with the Company. The Company has since been annually sending communications to the members of the Company seeking their preference for receiving corporate documents and has issued/dispatched Annual Reports accordingly.
k. Pursuant to Sections 205A, 205C and other applicable provisions, if any, of the Companies Act, 1956, any money transferred to the unpaid dividend account which remains unpaid or unclaimed for a period of 7 years from the date they become due for payment, is required to be transferred to the “Investor Education and Protection Fund” set up by the Central Government.
Education and Protection Fund” in due course. Once the amount is so transferred, no claims shall lie against the aforesaid fund or the Company in respect of such dividend amount thereafter. The members are requested to send to the Company their
l. Members may kindly note that due to security reasons, there could be certain restrictions and limitations in terms of movement of people, hand baggage and vehicles at the venue of the meeting. People and their accompanied items would be subject to inspection. We solicit your co-operation.
m. Members may please note that the Company has made arrangements of to and fro bus service for the members to reach the venue of the Annual General Meeting. The details are given below:
Bus pick up:
At 2.15 p.m.From Ghatkopar (East) Railway Station (next to Platinum Mall) to the Venue At 2.15 p.m.
Bus drop:
On conclusion of the meetingFrom the Venue to Ghatkopar (East) Railway Station
ADDITIONAL INFORMATION PURSUANT TO CLAUSE 49 OF THE LISTING AGREEMENT WITH REGARD TO DIRECTORS SEEKING APPOINTMENT/RE-APPOINTMENT AT THE TWENTY THIRD ANNUAL GENERAL MEETING:
1. Mr. Y M Kale
Mr. Y M Kale, born on November 4, 1947, was President of the Institute of Chartered Accountants of India (1995-1996) and is also a fellow member of the Institute of Chartered Accountants of England and Wales. He has contributed to various governmental and regulatory bodies such as the Securities & Exchange Board of India, the Committee of Offer Documents, the Committee of Takeovers and the Committee on Accounting for Corporates. He has participated as a member of the group for the Introduction of Concurrent Audit of Banks, which was organized by the Reserve Bank of India. He was a member of the National Drugs and Pharmaceutical Development Council of the Government of India. He was also on the Board of the International Accounting Standards Committee from 1995 to 1998 as India’s representative.
Mr. Kale does not hold any equity shares of the Company as on date.
Mr. Kale holds directorships and committee memberships* in the following Companies:
List of other Directorships held Membership in Committees of other companies
Chairmanship in Committees of other companies
Ashok Leyland Limited (Alternate Director) – –Gulf Oil Marine Limited – –Hinduja Foundries Limited (Alternate Director) – –IndusInd Bank Limited (Alternate Director) – –Hinduja National Power Corporation Limited (Alternate Director) – –Hinduja Leyland Finance Limited – –
* Only the Audit and Shareholders’ Grievances Committees are considered.

125
2. Mr. Frank Brienzi
Mr. Frank Brienzi, born on February 25, 1962, is Senior Vice President and General Manager of Oracle’s Financial Services Global Business Unit. He is a member of board of directors of Oracle Financial Services Software Limited and he oversees
large-scale banking and insurance development, sales and account management. For the past 15 years, he was a managing partner
Forbes and InformationWeek. He currently serves on the board of Aidmatrix and is Vice-Chairman for NPower, Texas. He is an active member in United Way programs and Stonebriar Community Church. He holds double majors in mathematics and management information systems from the University of Northern Colorado.
Mr. Brienzi does not hold any equity shares of the Company as on date.
Mr. Brienzi holds directorships and committee memberships* in the following Companies:
List of other Directorships held Membership in Committees of other companies
Chairmanship in Committees of other companies
NPower, Texas – –Aidmatrix – –
* Only the Audit and Shareholders’ Grievances Committees are considered.
3. Mr. William Corey West
to his role at Oracle. He began his career with Arthur Andersen in 1984, as part of the accounting and audit practice. He served clients in a variety of industries for 14 years and left Arthur Andersen in 1998 as a partner. After leaving Arthur Andersen, he
He joined Oracle Corporation on April 2, 2007. He graduated from the University of Washington in December 1984 with a
Mr. West does not hold any equity shares of the Company as on date.
Mr. West holds directorships and committee memberships* in the following Companies:
List of other Directorships held Membership in Committees of other companies
Chairmanship in Committees of other companies
BEA Crossgain International – –BEA Systems Ireland Holding Limited – –Eontec Limited – –J.D. Edwards Europe Limited – –Netsure Telecom Limited – –OCAPAC Distributor Partner – –OCAPAC Hardware Partner – –OCAPAC Holding Company – –OCAPAC Research Company – –OCAPAC Research Partner – –Oracle Australia Holdings Pty. Ltd. – –Oracle Consolidation Australia Pty. Ltd. – –Oracle Corporation Malaysia Holdings Sdn Bhd. – –Oracle Global (Mauritius) Limited – –Oracle Hong Kong Holdings Ltd. – –Oracle Singapore Holdings Pte Ltd. – –Oracle Technology Company – –Siebel Systems Ireland Holding Ltd. – –Sun Microsystems Technology Limited – –
* Only the Audit and Shareholders’ Grievances Committees are considered.

Oracle Financial Services Software – Annual Report 2011-2012
Annexure to notice
Explanatory Statement as required by Section 173 (2) of the Companies Act, 1956.
The following Explanatory Statement sets out all the material facts relating to the special business mentioned under item no. 6 in the accompanying Notice dated July 10, 2012.
Item no. 6:
branch auditors for conducting the audit of the books of accounts of the Company at such branches.
The Board of Directors of the Company (“the Board”) seeks approval of the Members for authorizing the Board to appoint Branch
No Director is in any way concerned or interested in the resolution at item no. 6 of the Notice.
Your Directors recommend the resolution at item no. 6 of the Notice.
By Order of the Board
Hoshi D Bhagwagar
Oracle Park Off Western Express Highway Goregaon (East) Mumbai 400063 July 10, 2012

127
I/We .......................................................................................................................... of .......................................................... in the
district of ..................................................................................................................... being a member/members of the above
named Company, hereby appoint .............................................................................................................................................
of ................................................................................... in the district of .......................................................................................
or failing him/her ..................................................................................................... of ............................................................. in the
district of .............................................................. as my/our proxy to attend and vote for me/us and on my/our behalf at
the Twenty Third Annual General Meeting of the Company to be held on Friday, August 17, 2012 at 3.00 p.m. at The Leela
Kempinski, Sahar, Andheri (East), Mumbai 400059, and at any adjournment thereof.
Signed this ................................................. day of ................................................. 2012.
Ledger Folio No. ........................................ DP ID ......................................... Client ID .................................................................
No. of Shares held ............................................................
Notes: 1. The proxy need not be a member. 2. The proxy form duly signed across ` 1/- revenue stamp should reach the Registered Office of the Company not
less than 48 hours before the time fixed for the meeting.
PROXY FORM
Oracle Financial Services Software LimitedRegistered Office: Oracle Park, Off Western Express Highway
Goregaon (East), Mumbai 400063
ATTENDANCE SLIP
I hereby record my presence at the Twenty Third Annual General Meeting of the Company held on Friday, August 17, 2012 at 3.00 p.m. at The Leela Kempinski, Sahar, Andheri (East), Mumbai 400059.
Full name of the Shareholder ................................................................................................................................................................................ (in block letters)
Ledger Folio No. ............................................... DP ID ................................................ Client ID ........................................................................
Number of Shares held ..............................................................................................................................................................................................
Signature of Shareholder or Proxy attending ...................................................................................................................................................
Full name of Proxy .............................................................................................................................................................................................. (in block letters)
Please provide full name of the 1st Joint Holder.
........................................................................................................................................................................................................................................
Note: Please fill in the attendance slip and hand it over at the ENTRANCE OF THE HALL.
Oracle Financial Services Software LimitedRegistered Office: Oracle Park, Off Western Express Highway
Goregaon (East), Mumbai 400063
Please affix ` 1/-
revenue stamp and sign across


Oracle Financial Services Software Limited
Registered Office
Oracle Park
Off Western Express Highway
Goregaon (East)
Mumbai, 400063, Maharashtra
India
Investor Enquiries
Phone: + 91.22.6718.3000
Fax: + 91.22.6718.4604
oracle.com/financialservices
Oracle is committed to developing practices and products that help protect the environment
Copyright © 2012, Oracle Financial Services Software Limited and/or its affiliates. All rights reserved.
Oracle is a registered trademark of Oracle Corporation and/or its affiliates. Other names may be trademarks of their respective owners.