oracle financial services software - moneycontrol.com
TRANSCRIPT

Re
sult
Up
da
te
Rev inline, License wins (up 16% YTD) drives up profitability OFSS reported inline results with a revenue growth of 6.8% YoY at Rs
12.4bn (DE Rs12.3bn). OPM for Q3 stood at 47.2% up 419bps YoY (up 125bps on QoQ basis), as cost efficiency got further deep. EBIT and PAT were ahead of estm at Rs 5.9bn (DE Rs5.5) and Rs4.2bn (DE 3.9bn).
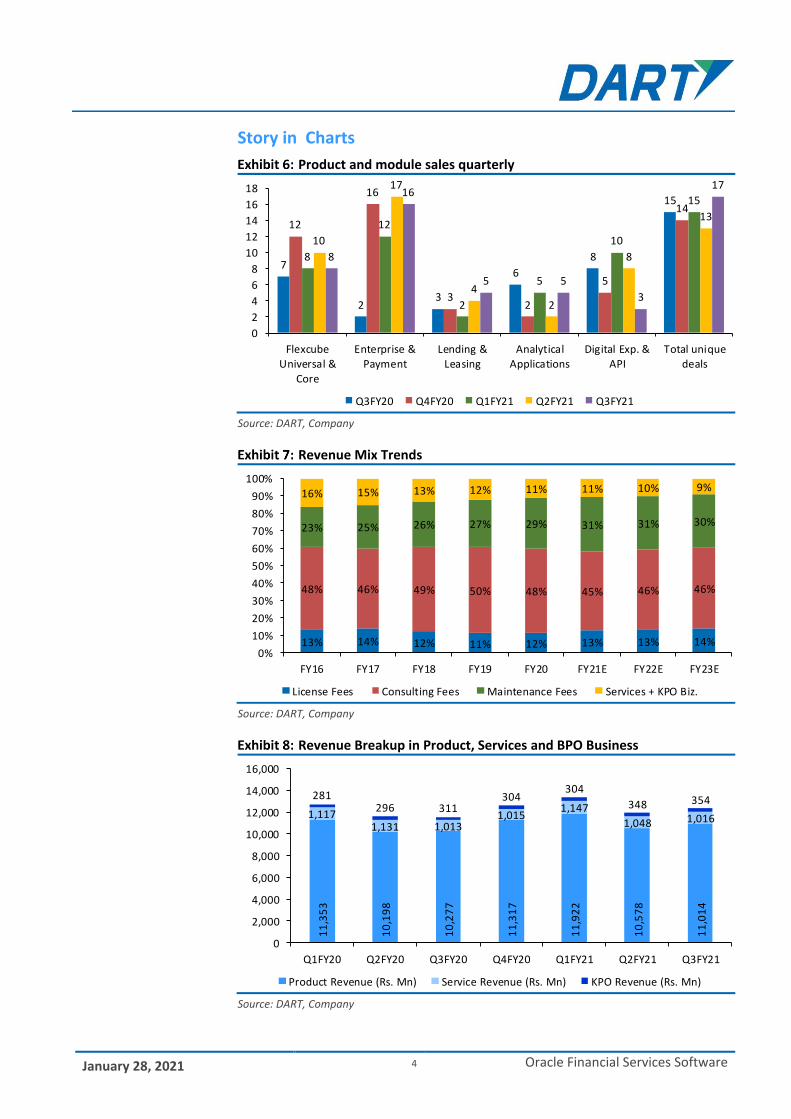
OFSS signed new Licenses worth US$19.1mn ahead of our estm of $16mn ($12mn in Q2FY20) that included 17 new deals across Geos including 6 in developed markets (Exhibit 6) and also witnessed 23 go-lives in the quarter.
Improved deal momentum (License wins up 16% YoY for 9MFY21) led by Digital acceleration theme (Banks investing both on creating digital channels), significant savings on cost in WFH (YTD EBIT margins up 364bps) could extend the overall earnings momentum significantly.
Global leadership in underpenetrated CBS business, unmatched access, superior technology, integrated & reliable offering would ensure that OFSS emerge as most preferred vendor in the segment. Superior pricing and brand appeal would mean stronger profitability, improved cash generation (FCF Yield 5%+) and generous pay-outs. We continue to maintain OFSS as our preferred pick with Buy rating on the stock with DCF based TP of Rs4000 (implies 16x on FY23E PER).
Signed $19.1mn in Licenses; won 17 new deals across markets OFSS added 17 new deals that included 37 different product modules being sold across Geographies (6 deals in developed markets – UK/US/Netherlands/Canada) and product offerings – 8 Universal Banking, 3 Digital Experience and 16 Enterprise/Payments deals. The demand for Implementation (down 2.2% on YoY basis) continued to slide despite 23 go-lives indicating increased partner sales during the quarter. AMC were up 10% on YoY (1.3% QoQ), contributing about ~36% of revenues. Overall Product revenues were up 7% on YoY basis at Rs11bn (89% of revenues), Services business witnessed revenue growth of about 3.5% YoY. OFSS reported overall EBIT margins at 47.2% in Q3 led by sustained cost actions as it was able to optimize both on employee cost (down 3% QoQ) and Travel cost (down 12% QoQ). Gross margin improved in line with strong license signings - up 56% on YoY basis. We expect profitability to see some pressure in FY22E on cost normalizations. Q3FY21 Result (Rs Mn)
Particulars Q3FY21 Q3FY20 YoY (%) Q2FY21 QoQ (%)
Revenue 12,384 11,601 6.8 11,974 3.4
Total Expense 6,272 6,339 (1.1) 6,195 1.2
EBITDA 6,112 5,262 16.2 5,778 5.8
Depreciation 262 268 (2.3) 272 (3.7)
EBIT 5,850 4,993 17.2 5,506 6.2
Other Income 177 596 (70.3) 123 43.4
Interest 0 0 0
EBT 6,027 5,589 7.8 5,630 7.1
Tax 1,730 1,022 69.2 1,709 1.2
RPAT 4,297 4,567 (5.9) 3,921 9.6
APAT 4,297 4,567 (5.9) 3,921 9.6
(bps) (bps)
Gross Margin (%) 43.4 44.9 (152) 46.5 (306)
EBITDA Margin (%) 49.4 45.4 400 48.3 109
NPM (%) 34.7 39.4 (467) 32.7 195
Tax Rate (%) 28.7 18.3 1042 30.4 (165)
EBIT Margin (%) 47.2 43.0 419 46.0 125
CMP Rs 3,270
Target / Upside Rs 4,000 / 22%
NIFTY 13,818
Scrip Details
Equity / FV Rs 429mn / Rs 5
Market Cap Rs 281bn
USD 4bn
52-week High/Low Rs 3,542/ 1,506
Avg. Volume (no) 61,421
Bloom Code OFSS IN
Price Performance 1M 3M 12M
Absolute (%) 2 5 13
Rel to NIFTY (%) 3 (12) (1)
Shareholding Pattern
Jun'20 Sep'20 Dec'20
Promoters 73.4 73.3 73.3
MF/Banks/FIs 6.4 7.0 8.0
FIIs 13.2 12.4 11.0
Public / Others 7.0 7.3 7.7
Valuation (x)
FY21E FY22E FY23E
P/E 15.8 15.0 13.4
EV/EBITDA 9.2 8.6 7.5
ROE (%) 26.9 27.9 30.1
RoACE (%) 26.5 27.5 29.6
Estimates (Rs mn)
FY21E FY22E FY23E
Revenue 51,170 55,852 62,996
EBITDA 25,550 26,926 30,455
PAT 17,770 18,715 20,953
EPS (Rs.) 206.6 217.6 243.6
VP - Research: Rahul Jain Tel: +9122 40969771
E-mail: [email protected]
Associate: Divyesh Mehta Tel: +91 22 40969768
E-mail: [email protected]
Oracle Financial Services Software
Buy
January 28, 2021

January 28, 2021 2 Oracle Financial Services Software
Quarterly performance versus estimates
Estimates % Variation Comment
(in Rs mn) Actual Dolat Consensus Dolat Consensus
Revenue 12,384 12,329 12,163 0.5 1.8 Strong licence signings drove rev beat.
EBIT 5,850 5,566 4,811 5.1 21.6 Stronger growth and significant cost savings in SG&A led to OPM beat EBIT, margin 47.2 45.1 39.6 210 bps 770 bps
PAT 4,297 1,852 3,948 132.0 8.8 normalization of tax rate and higher other income led to wider beat on PAT
Source: DART, Company
Change in Estimates Given strong licence win momentum in Q3 and 9MFY21, we expect the growth traction to sustain/extend in FY22/23E and thus have factored in revenue growth of 8%/10% respectively (estimates largely retained). Factoring in further OPM beat in Q3 - we have scaled up our OPM estimates by 150bps/168bps for FY22/23E; resulting in earnings upgrade of about 2.5%/0.4%/2.4% for FY21/FY22/23E.
Change in Estimates
FY20 FY21E FY22E FY23E
In mn Actual Old New Change Old New Change Old New Change
USD Revenue 685 701 692 (1.2) 758 750 (1.1) 840 829 (1.4)
YoY growth (%) (3.9) 2.3 1.1 (122 bps) 8.1 8.3 18 bps 10.9 10.6 (29 bps)
INR Revenue 48,613 51,821 51,170 (1.3) 57,606 55,852 (3.0) 63,860 62,996 (1.4)
YoY growth (%) (2.0) 6.6 5.3 (134 bps) 11.2 9.1 (201 bps) 10.9 12.8 194 bps
EBIT 21,223 24,348 24,486 0.6 25,780 25,831 0.2 28,641 29,310 2.3
EBIT margin (%) 43.7 47.0 47.9 87 bps 44.8 46.2 150 bps 44.8 46.5 168 bps
PAT 14,622 17,267 17,770 2.9 18,647 18,715 0.4 20,473 20,953 2.3
EPS (Rs Abs) 169.7 200.8 205.8 2.5 216.8 217.7 0.4 238.1 243.7 2.4
Source: DART, Company
Key Assumptions in Our Estimates Metrics FY20A FY21E FY22E FY23E
USD License Wins ($ Mn) 76 89 101 115 USD Product Revenue Growth (2.8) 1.4 9.5 11.6 USD Other Revenue Growth (11.6) (1.4) (1.5) 1.0 USD Revenue Growth (3.9) 1.1 8.3 10.6 USD/INR (Abs) 71.0 73.9 74.5 76.0 INR Revenue Growth (2.0) 5.3 9.1 12.8 EBIT Margin (%) 43.7 47.9 46.2 46.5 EPS Growth (%) 5.3 21.3 5.8 12.0
Source: DART, Company
Key Revenue Growth Matrix (YoY) Particulars Q1FY20 Q2FY20 Q3FY20 Q4FY20 Q1FY21 Q2FY21 Q3FY21
License Wins Growth 3.6 (35.8) (17.6) 12.7 1.7 11.7 56.6 USD Product Revenue Growth (7.9) (4.2) (1.4) 2.7 (1.4) (1.4) 3.5 USD Other Revenue Growth (8.2) (9.5) (9.9) (18.0) (2.5) (7.0) (0.1) USD Revenue Growth (7.9) (4.9) (2.5) 0.5 (1.5) (2.1) 3.1 INR Revenue Growth (5.2) (4.2) (2.2) 4.0 4.9 3.0 6.8
Source: DART, Company
January 28, 2021 3 Oracle Financial Services Software
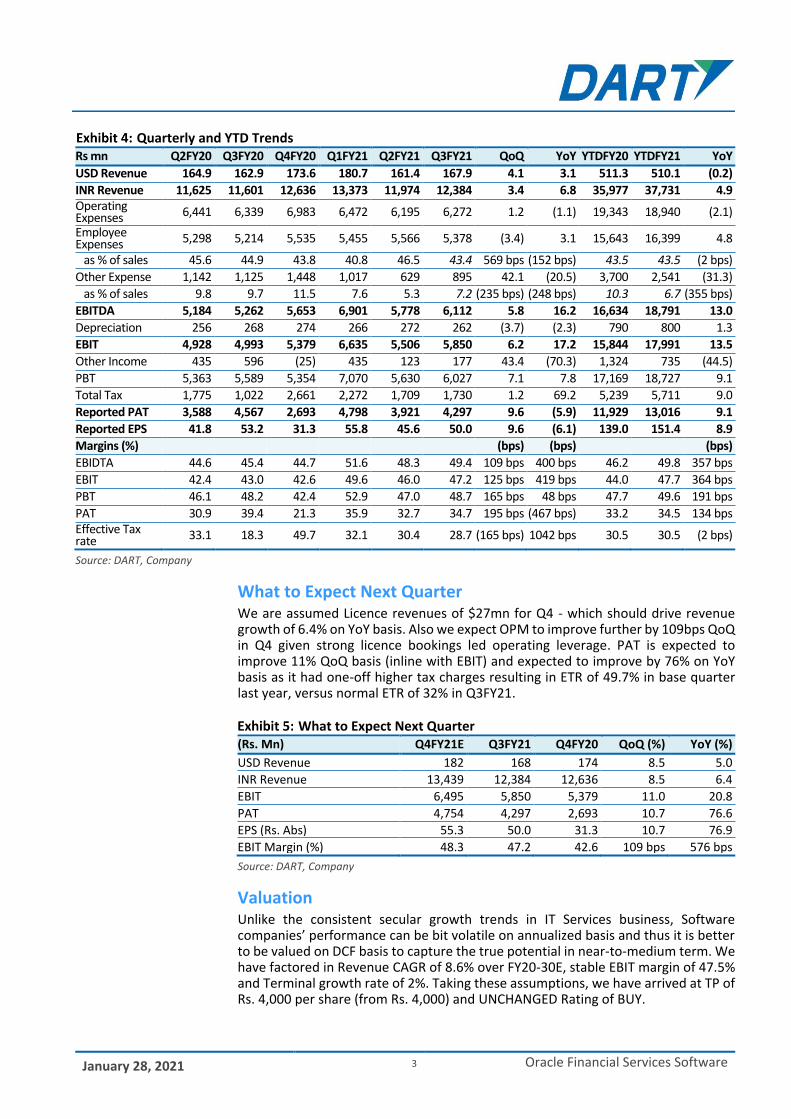
Quarterly and YTD Trends
Rs mn Q2FY20 Q3FY20 Q4FY20 Q1FY21 Q2FY21 Q3FY21 QoQ YoY YTDFY20 YTDFY21 YoY
USD Revenue 164.9 162.9 173.6 180.7 161.4 167.9 4.1 3.1 511.3 510.1 (0.2)
INR Revenue 11,625 11,601 12,636 13,373 11,974 12,384 3.4 6.8 35,977 37,731 4.9 Operating Expenses 6,441 6,339 6,983 6,472 6,195 6,272 1.2 (1.1) 19,343 18,940 (2.1)
Employee Expenses 5,298 5,214 5,535 5,455 5,566 5,378 (3.4) 3.1 15,643 16,399 4.8
as % of sales 45.6 44.9 43.8 40.8 46.5 43.4 569 bps (152 bps) 43.5 43.5 (2 bps)
Other Expense 1,142 1,125 1,448 1,017 629 895 42.1 (20.5) 3,700 2,541 (31.3)
as % of sales 9.8 9.7 11.5 7.6 5.3 7.2 (235 bps) (248 bps) 10.3 6.7 (355 bps)
EBITDA 5,184 5,262 5,653 6,901 5,778 6,112 5.8 16.2 16,634 18,791 13.0
Depreciation 256 268 274 266 272 262 (3.7) (2.3) 790 800 1.3
EBIT 4,928 4,993 5,379 6,635 5,506 5,850 6.2 17.2 15,844 17,991 13.5
Other Income 435 596 (25) 435 123 177 43.4 (70.3) 1,324 735 (44.5)
PBT 5,363 5,589 5,354 7,070 5,630 6,027 7.1 7.8 17,169 18,727 9.1
Total Tax 1,775 1,022 2,661 2,272 1,709 1,730 1.2 69.2 5,239 5,711 9.0
Reported PAT 3,588 4,567 2,693 4,798 3,921 4,297 9.6 (5.9) 11,929 13,016 9.1
Reported EPS 41.8 53.2 31.3 55.8 45.6 50.0 9.6 (6.1) 139.0 151.4 8.9
Margins (%) (bps) (bps) (bps)
EBIDTA 44.6 45.4 44.7 51.6 48.3 49.4 109 bps 400 bps 46.2 49.8 357 bps
EBIT 42.4 43.0 42.6 49.6 46.0 47.2 125 bps 419 bps 44.0 47.7 364 bps
PBT 46.1 48.2 42.4 52.9 47.0 48.7 165 bps 48 bps 47.7 49.6 191 bps
PAT 30.9 39.4 21.3 35.9 32.7 34.7 195 bps (467 bps) 33.2 34.5 134 bps Effective Tax rate 33.1 18.3 49.7 32.1 30.4 28.7 (165 bps) 1042 bps 30.5 30.5 (2 bps)
Source: DART, Company
What to Expect Next Quarter We are assumed Licence revenues of $27mn for Q4 - which should drive revenue growth of 6.4% on YoY basis. Also we expect OPM to improve further by 109bps QoQ in Q4 given strong licence bookings led operating leverage. PAT is expected to improve 11% QoQ basis (inline with EBIT) and expected to improve by 76% on YoY basis as it had one-off higher tax charges resulting in ETR of 49.7% in base quarter last year, versus normal ETR of 32% in Q3FY21.
What to Expect Next Quarter (Rs. Mn) Q4FY21E Q3FY21 Q4FY20 QoQ (%) YoY (%)
USD Revenue 182 168 174 8.5 5.0
INR Revenue 13,439 12,384 12,636 8.5 6.4
EBIT 6,495 5,850 5,379 11.0 20.8
PAT 4,754 4,297 2,693 10.7 76.6
EPS (Rs. Abs) 55.3 50.0 31.3 10.7 76.9
EBIT Margin (%) 48.3 47.2 42.6 109 bps 576 bps
Source: DART, Company
Valuation Unlike the consistent secular growth trends in IT Services business, Software companies’ performance can be bit volatile on annualized basis and thus it is better to be valued on DCF basis to capture the true potential in near-to-medium term. We have factored in Revenue CAGR of 8.6% over FY20-30E, stable EBIT margin of 47.5% and Terminal growth rate of 2%. Taking these assumptions, we have arrived at TP of Rs. 4,000 per share (from Rs. 4,000) and UNCHANGED Rating of BUY.
January 28, 2021 4 Oracle Financial Services Software
Story in Charts
Product and module sales quarterly
Source: DART, Company
Revenue Mix Trends
Source: DART, Company
Revenue Breakup in Product, Services and BPO Business
Source: DART, Company
7
23
6
8
15
12
16
32
5
14
8
12
2
5
10
15
10
17
4
2
8
13
8
16
5 5
3
17
0
2
4
6
8
10
12
14
16
18
Flexcube
Universal &
Core
Enterprise &
Payment
Lending &
Leasing
Analytical
Applications
Digital Exp. &
API
Total unique
deals
Q3FY20 Q4FY20 Q1FY21 Q2FY21 Q3FY21
13% 14% 12% 11% 12% 13% 13% 14%
48% 46% 49% 50% 48% 45% 46% 46%
23% 25% 26% 27% 29% 31% 31% 30%
16% 15% 13% 12% 11% 11% 10% 9%
0%
10%
20%
30%
40%
50%
60%
70%
80%
90%
100%
FY16 FY17 FY18 FY19 FY20 FY21E FY22E FY23E
License Fees Consulting Fees Maintenance Fees Services + KPO Biz.
11
,35
3
10
,19
8
10
,27
7
11
,31
7
11
,92
2
10
,57
8
11
,01
4
1,117 1,131 1,013
1,015 1,147
1,048 1,016
281 296 311
304 304
348 354
0
2,000
4,000
6,000
8,000
10,000
12,000
14,000
16,000
Q1FY20 Q2FY20 Q3FY20 Q4FY20 Q1FY21 Q2FY21 Q3FY21
Product Revenue (Rs. Mn) Service Revenue (Rs. Mn) KPO Revenue (Rs. Mn)

January 28, 2021 5 Oracle Financial Services Software
License Wins Trend improving
Source: DART, Company
Dividend Payout to get revived as robust FCF Generation continues
Source: DART, Company
PE Band Chart
OFSS PE Band Chart: Valuation is recovering as growth is improving over quarters
Source: DART, Company
29.0 12.0 12.2 23.0 29.5 13.4 19.1
3.6
-35.8
-17.6
12.7 1.7
11.7
56.6
-60
-40
-20
0
20
40
60
80
0
5
10
15
20
25
30
35
Q1FY20 Q2FY20 Q3FY20 Q4FY20 Q1FY21 Q2FY21 Q3FY21
License Deal Wins ($ mn) YoY Growth - RHS
83
12
6
13
2
15
3
17
1
21
5
20
1
21
3
10
0
17
0
13
0
0
18
0
20
0
20
0
20
0
32
9
35
7
31
1
33
0
52
4
55
0
56
6
60
0
0
100
200
300
400
500
600
700
FY16 FY17 FY18 FY19 FY20 FY21E FY22E FY23E
FCF per Share Dividend Per Share Cash per Share
68
1012141618202224262830
Jan
-18
Ma
r-18
Ma
y-1
8
Jul-
18
Sep
-18
No
v-1
8
Jan
-19
Ma
r-19
Ma
y-1
9
Jul-
19
Sep
-19
No
v-1
9
Jan
-20
Ma
r-20
Ma
y-2
0
Jul-
20
Sep
-20
No
v-2
0
Jan
-21
1yr fwd PE Median (3 Yr) Plus1SD Minus1SD Plus2SD Minus2SD
January 28, 2021 6 Oracle Financial Services Software
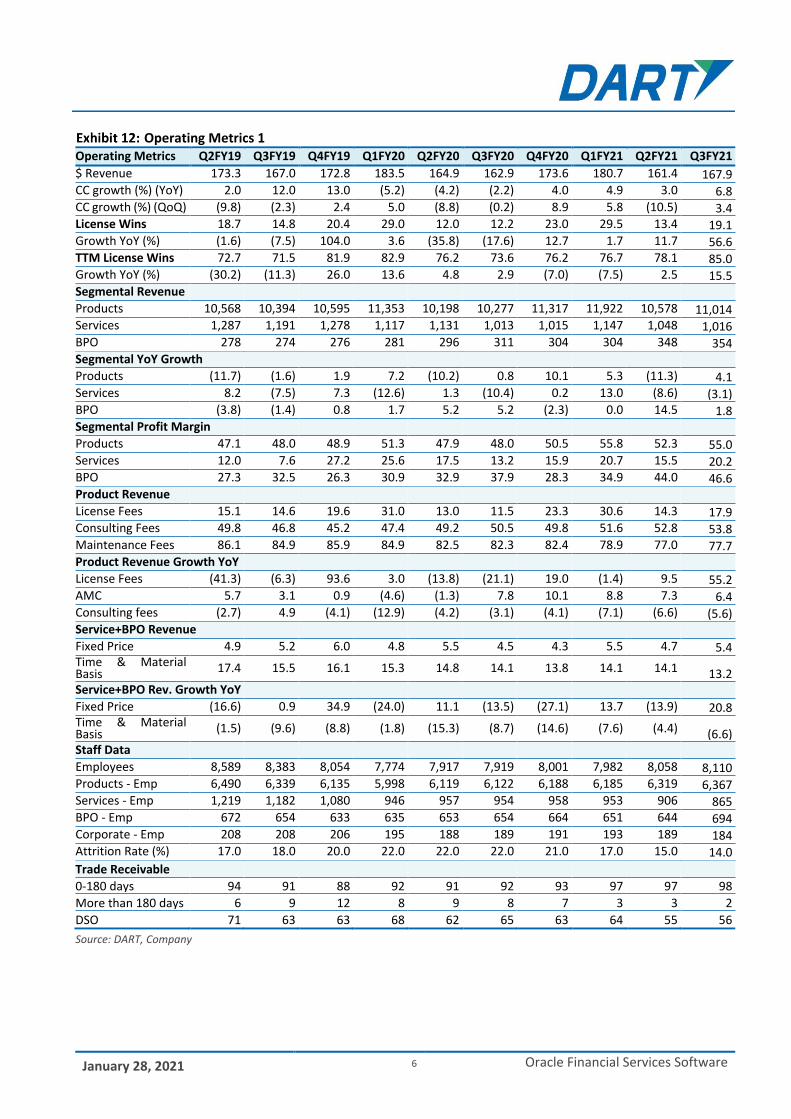
Operating Metrics 1
Operating Metrics Q2FY19 Q3FY19 Q4FY19 Q1FY20 Q2FY20 Q3FY20 Q4FY20 Q1FY21 Q2FY21 Q3FY21
$ Revenue 173.3 167.0 172.8 183.5 164.9 162.9 173.6 180.7 161.4 167.9 CC growth (%) (YoY) 2.0 12.0 13.0 (5.2) (4.2) (2.2) 4.0 4.9 3.0 6.8 CC growth (%) (QoQ) (9.8) (2.3) 2.4 5.0 (8.8) (0.2) 8.9 5.8 (10.5) 3.4 License Wins 18.7 14.8 20.4 29.0 12.0 12.2 23.0 29.5 13.4 19.1 Growth YoY (%) (1.6) (7.5) 104.0 3.6 (35.8) (17.6) 12.7 1.7 11.7 56.6 TTM License Wins 72.7 71.5 81.9 82.9 76.2 73.6 76.2 76.7 78.1 85.0 Growth YoY (%) (30.2) (11.3) 26.0 13.6 4.8 2.9 (7.0) (7.5) 2.5 15.5 Segmental Revenue Products 10,568 10,394 10,595 11,353 10,198 10,277 11,317 11,922 10,578 11,014 Services 1,287 1,191 1,278 1,117 1,131 1,013 1,015 1,147 1,048 1,016 BPO 278 274 276 281 296 311 304 304 348 354 Segmental YoY Growth Products (11.7) (1.6) 1.9 7.2 (10.2) 0.8 10.1 5.3 (11.3) 4.1 Services 8.2 (7.5) 7.3 (12.6) 1.3 (10.4) 0.2 13.0 (8.6) (3.1) BPO (3.8) (1.4) 0.8 1.7 5.2 5.2 (2.3) 0.0 14.5 1.8 Segmental Profit Margin Products 47.1 48.0 48.9 51.3 47.9 48.0 50.5 55.8 52.3 55.0 Services 12.0 7.6 27.2 25.6 17.5 13.2 15.9 20.7 15.5 20.2 BPO 27.3 32.5 26.3 30.9 32.9 37.9 28.3 34.9 44.0 46.6 Product Revenue License Fees 15.1 14.6 19.6 31.0 13.0 11.5 23.3 30.6 14.3 17.9 Consulting Fees 49.8 46.8 45.2 47.4 49.2 50.5 49.8 51.6 52.8 53.8 Maintenance Fees 86.1 84.9 85.9 84.9 82.5 82.3 82.4 78.9 77.0 77.7 Product Revenue Growth YoY License Fees (41.3) (6.3) 93.6 3.0 (13.8) (21.1) 19.0 (1.4) 9.5 55.2 AMC 5.7 3.1 0.9 (4.6) (1.3) 7.8 10.1 8.8 7.3 6.4 Consulting fees (2.7) 4.9 (4.1) (12.9) (4.2) (3.1) (4.1) (7.1) (6.6) (5.6) Service+BPO Revenue Fixed Price 4.9 5.2 6.0 4.8 5.5 4.5 4.3 5.5 4.7 5.4 Time & Material Basis 17.4 15.5 16.1 15.3 14.8 14.1 13.8 14.1 14.1 13.2 Service+BPO Rev. Growth YoY Fixed Price (16.6) 0.9 34.9 (24.0) 11.1 (13.5) (27.1) 13.7 (13.9) 20.8 Time & Material Basis (1.5) (9.6) (8.8) (1.8) (15.3) (8.7) (14.6) (7.6) (4.4) (6.6) Staff Data Employees 8,589 8,383 8,054 7,774 7,917 7,919 8,001 7,982 8,058 8,110 Products - Emp 6,490 6,339 6,135 5,998 6,119 6,122 6,188 6,185 6,319 6,367 Services - Emp 1,219 1,182 1,080 946 957 954 958 953 906 865 BPO - Emp 672 654 633 635 653 654 664 651 644 694 Corporate - Emp 208 208 206 195 188 189 191 193 189 184 Attrition Rate (%) 17.0 18.0 20.0 22.0 22.0 22.0 21.0 17.0 15.0 14.0
Trade Receivable
0-180 days 94 91 88 92 91 92 93 97 97 98
More than 180 days 6 9 12 8 9 8 7 3 3 2
DSO 71 63 63 68 62 65 63 64 55 56
Source: DART, Company
January 28, 2021 7 Oracle Financial Services Software
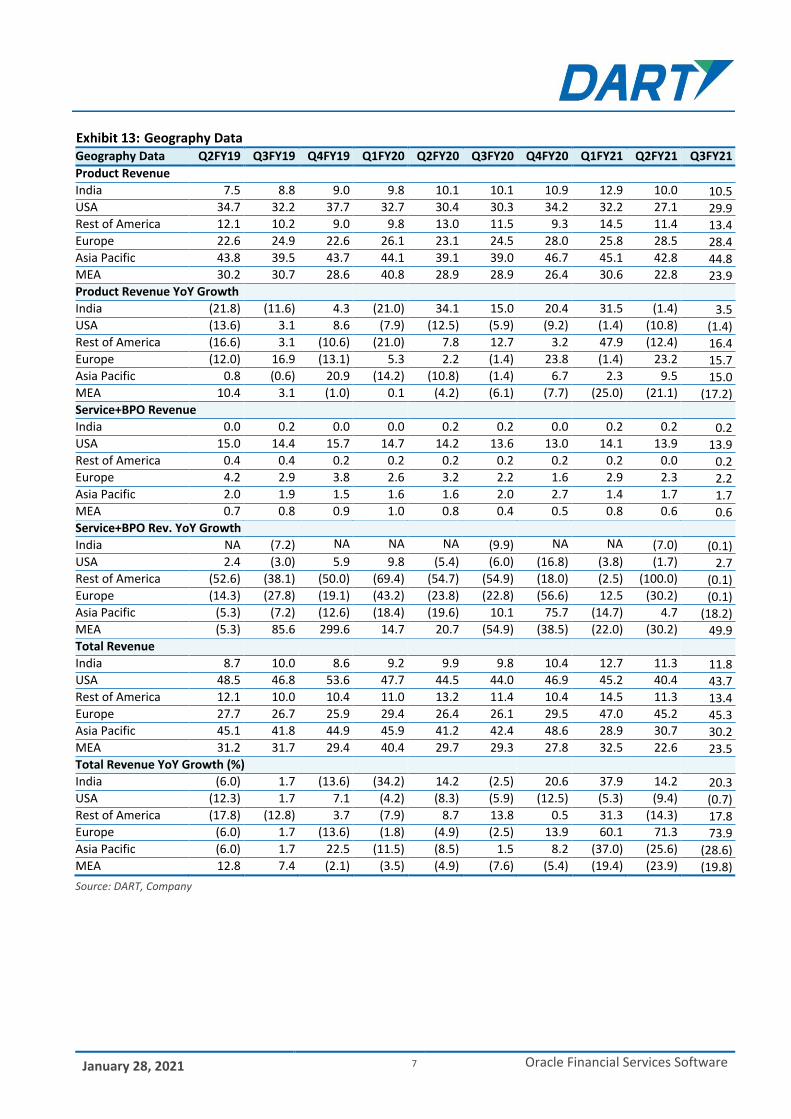
Geography Data
Geography Data Q2FY19 Q3FY19 Q4FY19 Q1FY20 Q2FY20 Q3FY20 Q4FY20 Q1FY21 Q2FY21 Q3FY21
Product Revenue
India 7.5 8.8 9.0 9.8 10.1 10.1 10.9 12.9 10.0 10.5 USA 34.7 32.2 37.7 32.7 30.4 30.3 34.2 32.2 27.1 29.9 Rest of America 12.1 10.2 9.0 9.8 13.0 11.5 9.3 14.5 11.4 13.4 Europe 22.6 24.9 22.6 26.1 23.1 24.5 28.0 25.8 28.5 28.4 Asia Pacific 43.8 39.5 43.7 44.1 39.1 39.0 46.7 45.1 42.8 44.8 MEA 30.2 30.7 28.6 40.8 28.9 28.9 26.4 30.6 22.8 23.9 Product Revenue YoY Growth India (21.8) (11.6) 4.3 (21.0) 34.1 15.0 20.4 31.5 (1.4) 3.5 USA (13.6) 3.1 8.6 (7.9) (12.5) (5.9) (9.2) (1.4) (10.8) (1.4) Rest of America (16.6) 3.1 (10.6) (21.0) 7.8 12.7 3.2 47.9 (12.4) 16.4 Europe (12.0) 16.9 (13.1) 5.3 2.2 (1.4) 23.8 (1.4) 23.2 15.7 Asia Pacific 0.8 (0.6) 20.9 (14.2) (10.8) (1.4) 6.7 2.3 9.5 15.0 MEA 10.4 3.1 (1.0) 0.1 (4.2) (6.1) (7.7) (25.0) (21.1) (17.2) Service+BPO Revenue India 0.0 0.2 0.0 0.0 0.2 0.2 0.0 0.2 0.2 0.2 USA 15.0 14.4 15.7 14.7 14.2 13.6 13.0 14.1 13.9 13.9 Rest of America 0.4 0.4 0.2 0.2 0.2 0.2 0.2 0.2 0.0 0.2 Europe 4.2 2.9 3.8 2.6 3.2 2.2 1.6 2.9 2.3 2.2 Asia Pacific 2.0 1.9 1.5 1.6 1.6 2.0 2.7 1.4 1.7 1.7 MEA 0.7 0.8 0.9 1.0 0.8 0.4 0.5 0.8 0.6 0.6 Service+BPO Rev. YoY Growth India NA (7.2) NA NA NA (9.9) NA NA (7.0) (0.1) USA 2.4 (3.0) 5.9 9.8 (5.4) (6.0) (16.8) (3.8) (1.7) 2.7 Rest of America (52.6) (38.1) (50.0) (69.4) (54.7) (54.9) (18.0) (2.5) (100.0) (0.1) Europe (14.3) (27.8) (19.1) (43.2) (23.8) (22.8) (56.6) 12.5 (30.2) (0.1) Asia Pacific (5.3) (7.2) (12.6) (18.4) (19.6) 10.1 75.7 (14.7) 4.7 (18.2) MEA (5.3) 85.6 299.6 14.7 20.7 (54.9) (38.5) (22.0) (30.2) 49.9 Total Revenue India 8.7 10.0 8.6 9.2 9.9 9.8 10.4 12.7 11.3 11.8 USA 48.5 46.8 53.6 47.7 44.5 44.0 46.9 45.2 40.4 43.7 Rest of America 12.1 10.0 10.4 11.0 13.2 11.4 10.4 14.5 11.3 13.4 Europe 27.7 26.7 25.9 29.4 26.4 26.1 29.5 47.0 45.2 45.3 Asia Pacific 45.1 41.8 44.9 45.9 41.2 42.4 48.6 28.9 30.7 30.2 MEA 31.2 31.7 29.4 40.4 29.7 29.3 27.8 32.5 22.6 23.5 Total Revenue YoY Growth (%) India (6.0) 1.7 (13.6) (34.2) 14.2 (2.5) 20.6 37.9 14.2 20.3 USA (12.3) 1.7 7.1 (4.2) (8.3) (5.9) (12.5) (5.3) (9.4) (0.7) Rest of America (17.8) (12.8) 3.7 (7.9) 8.7 13.8 0.5 31.3 (14.3) 17.8 Europe (6.0) 1.7 (13.6) (1.8) (4.9) (2.5) 13.9 60.1 71.3 73.9 Asia Pacific (6.0) 1.7 22.5 (11.5) (8.5) 1.5 8.2 (37.0) (25.6) (28.6) MEA 12.8 7.4 (2.1) (3.5) (4.9) (7.6) (5.4) (19.4) (23.9) (19.8)
Source: DART, Company

January 28, 2021 8 Oracle Financial Services Software
Profit and Loss Account
(Rs Mn) FY20A FY21E FY22E FY23E
Revenue 48,613 51,170 55,852 62,996
Total Expense 26,326 25,620 28,926 32,541
COGS 21,178 21,938 23,735 26,185
Employees Cost 0 0 0 0
Other expenses 5,148 3,681 5,191 6,356
EBIDTA 22,287 25,550 26,926 30,455
Depreciation 1,064 1,064 1,095 1,145
EBIT 21,223 24,486 25,831 29,310
Interest 0 0 0 0
Other Income 1,300 1,032 1,292 1,731
Exc. / E.O. items 0 0 0 0
EBT 22,523 25,519 27,123 31,041
Tax 7,901 7,748 8,408 10,088
RPAT 14,622 17,770 18,715 20,953
Minority Interest 0 0 0 0
Profit/Loss share of associates 0 0 0 0
APAT 14,622 17,770 18,715 20,953
Balance Sheet
(Rs Mn) FY20A FY21E FY22E FY23E
Sources of Funds
Equity Capital 429 429 429 429
Minority Interest 0 0 0 0
Reserves & Surplus 65,266 65,838 67,355 71,109
Net Worth 65,696 66,268 67,784 71,538
Total Debt 0 0 0 0
Net Deferred Tax Liability 962 1,107 1,137 1,202
Total Capital Employed 66,658 67,375 68,921 72,740
Applications of Funds
Net Block 9,526 9,322 9,187 9,152
CWIP 0 2 2 2
Investments 102 102 102 102
Current Assets, Loans & Advances 69,571 71,846 74,678 79,761
Inventories 0 0 0 0
Receivables 9,254 8,832 9,793 11,218
Cash and Bank Balances 13,316 15,669 17,060 19,933
Loans and Advances 0 0 0 0
Other Current Assets 15,349 15,693 16,173 16,958
Less: Current Liabilities & Provisions 12,542 13,898 15,048 16,278
Payables 355 351 396 446
Other Current Liabilities 12,187 13,547 14,652 15,832
sub total
Net Current Assets 57,029 57,948 59,629 63,484
Total Assets 66,658 67,375 68,921 72,740
E – Estimates

January 28, 2021 9 Oracle Financial Services Software
Important Ratios
Particulars FY20A FY21E FY22E FY23E
(A) Margins (%)
Gross Profit Margin 43.6 42.9 42.5 41.6
EBIDTA Margin 45.8 49.9 48.2 48.3
EBIT Margin 43.7 47.9 46.2 46.5
Tax rate 35.1 30.4 31.0 32.5
Net Profit Margin 30.1 34.7 33.5 33.3
(B) As Percentage of Net Sales (%)
COGS 43.6 42.9 42.5 41.6
Employee 0.0 0.0 0.0 0.0
Other 10.6 7.2 9.3 10.1
(C) Measure of Financial Status
Gross Debt / Equity 0.0 0.0 0.0 0.0
Interest Coverage
Inventory days 0 0 0 0
Debtors days 69 63 64 65
Average Cost of Debt
Payable days 3 3 3 3
Working Capital days 428 413 390 368
FA T/O 5.1 5.5 6.1 6.9
(D) Measures of Investment
AEPS (Rs) 170.4 206.6 217.6 243.6
CEPS (Rs) 182.8 219.0 230.3 256.9
DPS (Rs) 180.0 200.0 200.0 200.0
Dividend Payout (%) 105.6 96.8 91.9 82.1
BVPS (Rs) 765.5 770.5 788.1 831.8
RoANW (%) 25.4 26.9 27.9 30.1
RoACE (%) 25.3 26.5 27.5 29.6
RoAIC (%) 46.9 46.6 49.9 56.0
(E) Valuation Ratios
CMP (Rs) 3270 3270 3270 3270
P/E 19.2 15.8 15.0 13.4
Mcap (Rs Mn) 2,81,126 2,81,126 2,81,126 2,81,126
MCap/ Sales 5.8 5.5 5.0 4.5
EV 2,36,158 2,33,806 2,32,414 2,29,541
EV/Sales 4.9 4.6 4.2 3.6
EV/EBITDA 10.6 9.2 8.6 7.5
P/BV 4.3 4.2 4.1 3.9
Dividend Yield (%) 5.5 6.1 6.1 6.1
(F) Growth Rate (%)
Revenue (2.0) 5.3 9.1 12.8
EBITDA 3.9 14.6 5.4 13.1
EBIT 1.5 15.4 5.5 13.5
PBT (0.7) 13.3 6.3 14.4
APAT 5.5 21.5 5.3 12.0
EPS 5.2 21.3 5.3 12.0
Cash Flow
(Rs Mn) FY20A FY21E FY22E FY23E
CFO 15,218 19,381 18,257 19,451
CFI (13,841) 170 332 621
CFF (474) (17,198) (17,198) (17,198)
FCFF 14,688 18,519 17,297 18,341
Opening Cash 11,563 13,316 15,669 17,060
Closing Cash 13,316 15,669 17,060 19,933
E – Estimates

DART RATING MATRIX
Total Return Expectation (12 Months)
Buy > 20%
Accumulate 10 to 20%
Reduce 0 to 10%
Sell < 0%
Rating and Target Price History
Month Rating TP (Rs.) Price (Rs.)
Feb-20 Buy 3,875 2,982
May-20 Buy 3,100 2,526
Jul-20 Buy 3,500 3,191
Aug-20 Buy 4,000 2,960
Aug-20 Buy 4,000 3,042
Sep-20 Buy 4,000 2,965
Nov-20 Buy 4,000 3,145
*Price as on recommendation date
DART Team
Purvag Shah Managing Director [email protected] +9122 4096 9747
Amit Khurana, CFA Head of Equities [email protected] +9122 4096 9745
CONTACT DETAILS
Equity Sales Designation E-mail Direct Lines
Dinesh Bajaj VP - Equity Sales [email protected] +9122 4096 9709
Kapil Yadav VP - Equity Sales [email protected] +9122 4096 9735
Yomika Agarwal VP - Equity Sales [email protected] +9122 4096 9772
Jubbin Shah VP - Derivatives Sales [email protected] +9122 4096 9779
Ashwani Kandoi AVP - Equity Sales [email protected] +9122 4096 9725
Lekha Nahar AVP - Equity Sales [email protected] +9122 4096 9740
Equity Trading Designation E-mail
P. Sridhar SVP and Head of Sales Trading [email protected] +9122 4096 9728
Chandrakant Ware VP - Sales Trading [email protected] +9122 4096 9707
Shirish Thakkar VP - Head Domestic Derivatives Sales Trading [email protected] +9122 4096 9702
Kartik Mehta Asia Head Derivatives [email protected] +9122 4096 9715
Dinesh Mehta Co- Head Asia Derivatives [email protected] +9122 4096 9765
Bhavin Mehta VP - Derivatives Strategist [email protected] +9122 4096 9705
1,490
2,000
2,510
3,020
3,530
4,040
Jan-2
0
Fe
b-2
0
Mar-
20
Apr-
20
May-2
0
Jun-2
0
Jul-20
Aug-2
0
Sep-2
0
Oct-
20
Nov-2
0
Dec-2
0
(Rs) OFSS Target Price
Dolat Capital Market Private Limited. Sunshine Tower, 28th Floor, Senapati Bapat Marg, Dadar (West), Mumbai 400013
Our Research reports are also available on Reuters, Thomson Publishers, DowJones and Bloomberg (DCML <GO>)
Analyst(s) Certification The research analyst(s), with respect to each issuer and its securities covered by them in this research report, certify that: All of the views expressed in this research report accurately reflect his or her or their personal views about all of the issuers and their securities; and No part of his or her or their compensation was, is, or will be directly or indirectly related to the specific recommendations or views expressed in this research report.
I. Analyst(s) and Associate (S) holding in the Stock(s): (Nil)
II. Disclaimer: This research report has been prepared by Dolat Capital Market Private Limited. to provide information about the company(ies) and sector(s), if any, covered in the report and may be distributed by it and/or its affiliated company(ies) solely for the purpose of information of the select recipient of this report. This report and/or any part thereof, may not be duplicated in any form and/or reproduced or redistributed without the prior written consent of Dolat Capital Market Private Limited. This report has been prepared independent of the companies covered herein. Dolat Capital Market Private Limited. and its affiliated companies are part of a multi-service, integrated investment banking, brokerage and financing group. Dolat Capital Market Private Limited. and/or its affiliated company(ies) might have provided or may provide services in respect of managing offerings of securities, corporate finance, investment banking, mergers & acquisitions, financing or any other advisory services to the company(ies) covered herein. Dolat Capital Market Private Limited. and/or its affiliated company(ies) might have received or may receive compensation from the company(ies) mentioned in this report for rendering any of the above services. Research analysts and sales persons of Dolat Capital Market Private Limited. may provide important inputs to its affiliated company(ies) associated with it. While reasonable care has been taken in the preparation of this report, it does not purport to be a complete description of the securities, markets or developments referred to herein, and Dolat Capital Market Private Limited. does not warrant its accuracy or completeness. Dolat Capital Market Private Limited. may not be in any way responsible for any loss or damage that may arise to any person from any inadvertent error in the information contained in this report. This report is provided for information only and is not an investment advice and must not alone be taken as the basis for an investment decision. The investment discussed or views expressed herein may not be suitable for all investors. The user assumes the entire risk of any use made of this information. The information contained herein may be changed without notice and Dolat Capital Market Private Limited. reserves the right to make modifications and alterations to this statement as they may deem fit from time to time. Dolat Capital Market Private Limited. and its affiliated company(ies), their directors and employees may; (a) from time to time, have a long or short position in, and buy or sell the securities of the company(ies) mentioned herein or (b) be engaged in any other transaction involving such securities and earn brokerage or other compensation or act as a market maker in the financial instruments of the company(ies) discussed herein or act as an advisor or lender/borrower to such company(ies) or may have any other potential conflict of interests with respect to any recommendation and other related information and opinions. This report is neither an offer nor solicitation of an offer to buy and/or sell any securities mentioned herein and/or not an official confirmation of any transaction. This report is not directed or intended for distribution to, or use by any person or entity who is a citizen or resident of or located in any locality, state, country or other jurisdiction, where such distribution, publication, availability or use would be contrary to law, regulation or which would subject Dolat Capital Market Private Limited. and/or its affiliated company(ies) to any registration or licensing requirement within such jurisdiction. The securities described herein may or may not be eligible for sale in all jurisdictions or to a certain category of investors. Persons in whose possession this report may come, are required to inform themselves of and to observe such restrictions.
For U.S. Entity/ persons only: This research report is a product of Dolat Capital Market Private Limited., which is the employer of the research analyst(s) who has prepared the research report. The research analyst(s) preparing the research report is/are resident outside the United States (U.S.) and are not associated persons of any U.S. regulated broker-dealer and therefore the analyst(s) is/are not subject to supervision by a U.S. broker-dealer, and is/are not required to satisfy the regulatory licensing requirements of FINRA or required to otherwise comply with U.S. rules or regulations regarding, among other things, communications with a subject company, public appearances and trading securities held by a research analyst account.
This report is intended for distribution by Dolat Capital Market Private Limited. only to "Major Institutional Investors" as defined by Rule 15a-6(b)(4) of the U.S. Securities and Exchange Act, 1934 (the Exchange Act) and interpretations thereof by U.S. Securities and Exchange Commission (SEC) in reliance on Rule 15a 6(a)(2). If the recipient of this report is not a Major Institutional Investor as specified above, then it should not act upon this report and return the same to the sender. Further, this report may not be copied, duplicated and/or transmitted onward to any U.S. person or entity.
In reliance on the exemption from registration provided by Rule 15a-6 of the Exchange Act and interpretations thereof by the SEC in order to conduct certain business with Major Institutional Investors, Dolat Capital Market Private Limited. has entered into an agreement with a U.S. registered broker-dealer Ltd StoneX Financial Inc.(“StoneX”). Transactions in securities discussed in this research report should be effected through StoneX Financial Inc.(“StoneX”) or another U.S. registered broker dealer/Entity as informed by Dolat Capital Market Private Limited. from time to time.
Dolat Capital Market Private Limited.
Corporate Identity Number: U65990DD1993PTC009797 Member: BSE Limited and National Stock Exchange of India Limited.
SEBI Registration No: BSE - INZ000274132, NSE - INZ000274132, Research: INH000000685 Registered office: Office No. 141, Centre Point, Somnath, Daman – 396 210, Daman & Diu
Board: +9122 40969700 | Fax: +9122 22651278 | Email: [email protected] | www.dolatresearch.com