or - uploads-ssl.webflow.com
TRANSCRIPT

Sele
cto
r H
igh
Co
nvi
ctio
n E
qu
ity
Fun
d Q
uar
terl
y N
ew
sle
tte
r N
o.7
1
Mar
ch 2
02
1
In this quarterly edition, we review performance and attribution and provide a snapshot of company results from the recent February reporting season.
We discuss the widely used PE ratio, the conundrum of owning ‘stranded assets’, and China’s latest five-year plan targeting self-sufficiency via leadership in science and technology.
We review “Black Box Thinking” and consider the book’s relevance to our portfolio.
On our cover is the eye-opening remuneration levels of US CEOs. We highlight how this relates to our portfolio and the way we vote. As reference, we include our Environmental, Social and Governance (ESG) and Voting Policy 2021.
Chart. Median total compensation for US S&P 500 CEOs. Source: MyLogIQ, WSJ.
Selector Funds Management Limited ACN 102756347 AFSL 225316 Level 8, 10 Bridge Street Sydney NSW 2000 Australia Tel 612 8090 3612 www.selectorfund.com.au

P
f
Selector is a Sydney based fund manager. Our team combines deep experience in financial markets
with diversity of background and thought. We believe in long-term wealth creation and building
lasting relationships with our investors.
We focus on stock selection, the funds are high conviction, concentrated and index unaware. As a
result, the portfolios have low turnover and produce tax effective returns.
Selector has a 16-year track record of outperformance and we continue to seek businesses with
leadership qualities, run by competent management teams, underpinned by strong balance sheets
and with a focus on capital management.

Selector High Conviction Equity Fund Quarterly Newsletter #71
2
CONTENTS
IN BRIEF – MARCH QUARTER 3
PORTFOLIO OVERVIEW 8
PORTFOLIO CONTRIBUTORS 10
WHAT A ‘PER’ DOES NOT CAPTURE 12
STRANDED ASSETS 15
REPORTING SEASON SNAPSHOT 18
BLACK BOX THINKING – BOOK REVIEW 31
CHINA’S ROADMAP – SCIENCE AND TECHNOLOGY 38
REMUNERATION AND WHY WE VOTE THE WAY WE DO 42
ENVIRONMENTAL, SOCIAL AND GOVERNANCE, ESG POLICY 2021 44
VOTING POLICY 2021 51
COMPANY ENGAGEMENTS – MARCH 2021 QUARTER 55
Selector Funds Management
3
IN BRIEF – MARCH QUARTER
Dear Investor,
Twelve months on, the alphabet guess work is over.
Earlier predictions on whether the world would
experience a L, U, W, Z or even a Nike Swoosh-shaped
economic recovery can now be put to bed, as the letter
V has emerged victorious.
When The Conference Board1, an organisation that
analyses economic trends, surveyed 606 global CEOs for
their view in July 2020, 42% picked a U-shaped recovery
and another 32% chose L. Under these scenarios the
duration of a recovery would have ranged from one to
several years. Only 11% suggested a V-shaped outcome,
a recovery of less than one year.
Rapid and unprecedented stimulus actions by
governments and further loosening of monetary policies
led to stronger economic activity and a quicker recovery
in employment ranks. As we look beyond the current
quarter and as markets reopen post vaccination program
rollouts, this recovery is expected to strengthen.
During March, the U.S. Biden Administration got the
green light to fulfil its electoral promise of providing
relief in response to the worst economic crisis since the
Great Depression. The US$1.9t coronavirus funding bill,
known as the American Rescue Plan, includes (amongst
other benefits) direct payments of US$1,400 to millions
of low to middle income Americans.
Passed by the U.S. Senate with a final vote of 50-49,
President Biden’s 2021 stimulus package is one of the
largest rescue measures in U.S. history and easily
surpasses the 2008 Global Financial Crisis Troubled Asset
Relief Program (TARP) of US$700b, used in bailing out
the banking institutions.
A second Biden package is expected to follow,
earmarked for infrastructure that could take the whole
fiscal outlay to circa US$4.2t2. It is worth noting these
funding measures are in addition to the already US$2.25t
Coronavirus Relief Bill (CARES Act) introduced by former
President Donald Trump in March 2020.
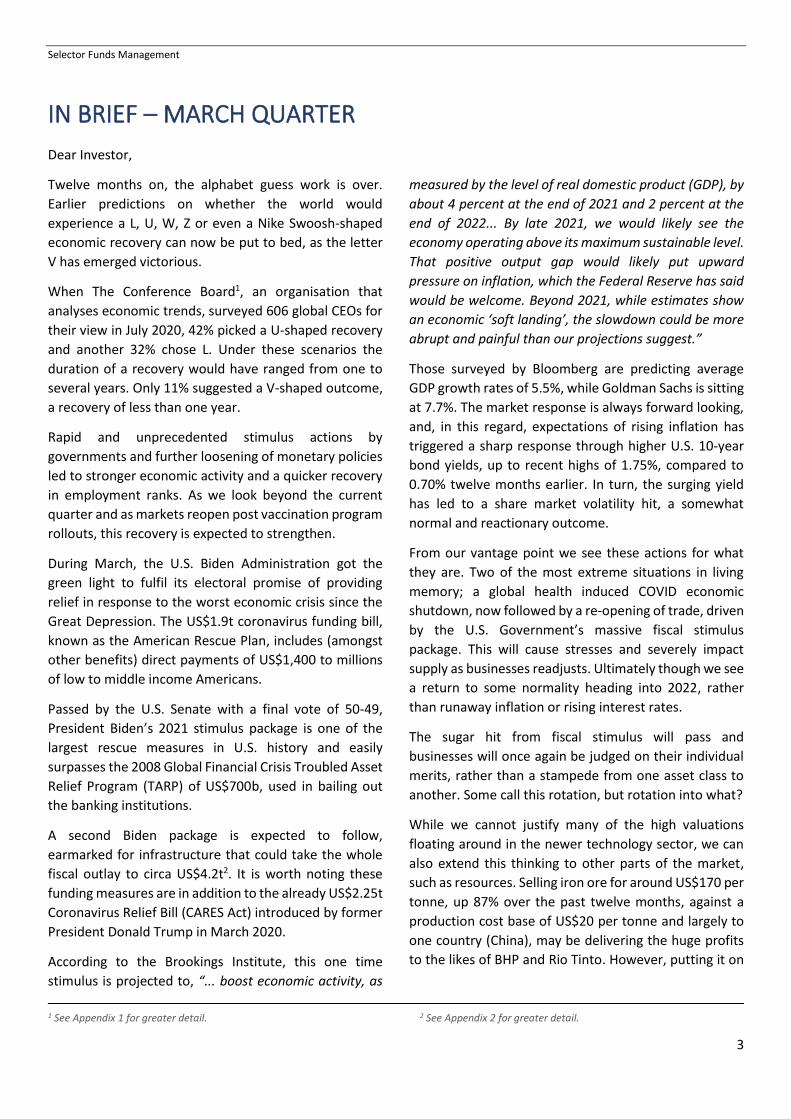
According to the Brookings Institute, this one time
stimulus is projected to, “... boost economic activity, as
1 See Appendix 1 for greater detail.
measured by the level of real domestic product (GDP), by
about 4 percent at the end of 2021 and 2 percent at the
end of 2022... By late 2021, we would likely see the
economy operating above its maximum sustainable level.
That positive output gap would likely put upward
pressure on inflation, which the Federal Reserve has said
would be welcome. Beyond 2021, while estimates show
an economic ‘soft landing’, the slowdown could be more
abrupt and painful than our projections suggest.”
Those surveyed by Bloomberg are predicting average
GDP growth rates of 5.5%, while Goldman Sachs is sitting
at 7.7%. The market response is always forward looking,
and, in this regard, expectations of rising inflation has
triggered a sharp response through higher U.S. 10-year
bond yields, up to recent highs of 1.75%, compared to
0.70% twelve months earlier. In turn, the surging yield
has led to a share market volatility hit, a somewhat
normal and reactionary outcome.
From our vantage point we see these actions for what
they are. Two of the most extreme situations in living
memory; a global health induced COVID economic
shutdown, now followed by a re-opening of trade, driven
by the U.S. Government’s massive fiscal stimulus
package. This will cause stresses and severely impact
supply as businesses readjusts. Ultimately though we see
a return to some normality heading into 2022, rather
than runaway inflation or rising interest rates.
The sugar hit from fiscal stimulus will pass and
businesses will once again be judged on their individual
merits, rather than a stampede from one asset class to
another. Some call this rotation, but rotation into what?
While we cannot justify many of the high valuations
floating around in the newer technology sector, we can
also extend this thinking to other parts of the market,
such as resources. Selling iron ore for around US$170 per
tonne, up 87% over the past twelve months, against a
production cost base of US$20 per tonne and largely to
one country (China), may be delivering the huge profits
to the likes of BHP and Rio Tinto. However, putting it on
2 See Appendix 2 for greater detail.
Selector High Conviction Equity Fund Quarterly Newsletter #71
4
a future multiple that appears altogether unsustainable
is perhaps equally risky.
We touch on some of these aspects in two of our
quarterly articles, “What a PER does not capture” and
“Stranded assets”. We provide commentary on reporting
season and review “Black Box Thinking”.
We discuss China’s new five-year plan, which was
released in March with an emphasis on increasing
research and development spend, specifically across
science and technology.
So as not to be left behind, U.K. Prime Minister Boris
Johnson echoed similar commitments during the month,
stating that science and technology is now “a metric of
global power” and “This government will invest more in
research and development than any of our predecessors,
because innovation is the key to our success at home and
abroad. From speeding our economic recovery, to
shaping emerging technologies in accordance with
freedom and openness, we will better protect ourselves
against threats to our economic security.”
In addition, we touch on the thorny issue of CEO
compensation, as the chart on the cover page of our
latest quarterly illustrates, and why we place such high
importance on voting at annual general meetings. This is
covered in our Voting policy and included in Selector’s
Environmental, Social, Governance ESG Policy 2021
edition.
As we move into the second quarter of 2021 and beyond,
we would caution investors in extrapolating Government
stimulus programs and the flow on effects on business
performance as anything but normal.
Within this setting our overarching focus, as always, will
be on backing those management teams and companies
that continue to build out their competitive offering,
with one eye on the now and the other on the future.
This requires a very fine balance as “Black Box Thinking”
author Matthew Syed rightly puts, “success is about
developing the capacity to think big and small, to be both
imaginative and disciplined, to immerse oneself in the
minutiae of a problem and to stand beyond it in order to
glimpse the wider vista”.
We would suggest there are many businesses in the
portfolio that aptly fit that description.
For the March quarter, the Portfolio delivered a gross
negative return of 1.91% compared to the S&P ASX All
Ordinaries Accumulation Index, which posted a gain of
3.61%. For the financial year to date, the Portfolio
delivered a gross positive return of 13.43% compared to
the Index, which has posted a gain of 19.86%.
We trust you find the report informative.
Regards,
Selector Investment Team

Selector Funds Management
5
Appendix 1: The Conference Board – shapes of recovery
Source: The Conference Board
Selector High Conviction Equity Fund Quarterly Newsletter #71
6
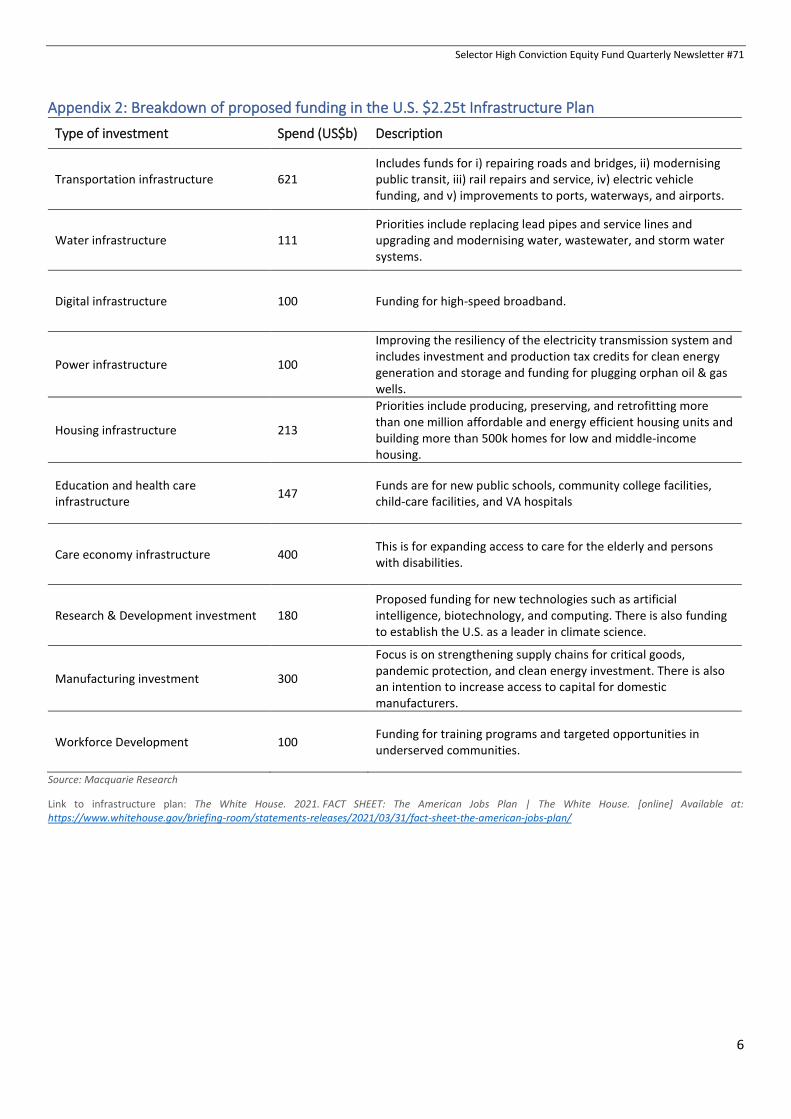
Appendix 2: Breakdown of proposed funding in the U.S. $2.25t Infrastructure Plan
Type of investment Spend (US$b) Description
Transportation infrastructure 621 Includes funds for i) repairing roads and bridges, ii) modernising public transit, iii) rail repairs and service, iv) electric vehicle funding, and v) improvements to ports, waterways, and airports.
Water infrastructure 111 Priorities include replacing lead pipes and service lines and upgrading and modernising water, wastewater, and storm water systems.
Digital infrastructure 100 Funding for high-speed broadband.
Power infrastructure 100
Improving the resiliency of the electricity transmission system and includes investment and production tax credits for clean energy generation and storage and funding for plugging orphan oil & gas wells.
Housing infrastructure 213
Priorities include producing, preserving, and retrofitting more than one million affordable and energy efficient housing units and building more than 500k homes for low and middle-income housing.
Education and health care infrastructure
147 Funds are for new public schools, community college facilities, child-care facilities, and VA hospitals
Care economy infrastructure 400 This is for expanding access to care for the elderly and persons with disabilities.
Research & Development investment 180 Proposed funding for new technologies such as artificial intelligence, biotechnology, and computing. There is also funding to establish the U.S. as a leader in climate science.
Manufacturing investment 300
Focus is on strengthening supply chains for critical goods, pandemic protection, and clean energy investment. There is also an intention to increase access to capital for domestic manufacturers.
Workforce Development 100 Funding for training programs and targeted opportunities in underserved communities.
Source: Macquarie Research
Link to infrastructure plan: The White House. 2021. FACT SHEET: The American Jobs Plan | The White House. [online] Available at: https://www.whitehouse.gov/briefing-room/statements-releases/2021/03/31/fact-sheet-the-american-jobs-plan/

Selector Funds Management
7
“Winners require innovation and discipline, the imagination to see the big picture and the focus to perceive the very small. The great task rarely achieved is to blend creative intensity with relentless discipline so as to amplify the creativity rather than destroy it. When you marry operating excellence with innovation you multiply the value of your creativity.”
Jim Collins American researcher and author
of bestseller ‘Good to Great’

Selector High Conviction Equity Fund Quarterly Newsletter #71
8
PORTFOLIO OVERVIEW
Table 1: Performance as at 31 March 2021*
Inception Date: 30/10/2004
*Performance figures are historical percentages. Returns are annualised and assume the reinvestment of all distributions.
Graph 1: Gross value of $100,000 invested since inception
Table 2: Fund’s Top 10 Holdings
Top 10 March 2021 % Top 10 December 2020 %
Domino's Pizza Enterprises 6.68 James Hardie Industries 6.28
James Hardie Industries 6.39 Domino's Pizza Enterprises 5.90
Aristocrat Leisure 5.69 Aristocrat Leisure 5.07
Reece 5.50 Reece 4.86
TechnologyOne 4.97 SEEK 4.80
SEEK 4.68 ResMed 4.65
Cochlear 4.48 Altium 4.41
ResMed 4.21 carsales.com 4.36
carsales.com 3.79 Nanosonics 4.23
CSL 3.74 Iress 4.15
Total 50.13 Total 48.71
$0
$100,000
$200,000
$300,000
$400,000
$500,000
$600,000
$700,000
$800,000
2004 2005 2006 2007 2008 2009 2010 2011 2012 2013 2014 2015 2016 2017 2018 2019 2020
SFW XAOAI
3 Month 6 Month 1 Year 3 Year 5 Year 10 Year 15 year Since
Inception
Fund (net of fees) (2.31) 7.99 33.78 10.88 13.36 13.79 8.47 10.90
Fund (gross of fees) (1.91) 8.52 36.28 13.00 15.48 15.92 10.46 13.01
All Ords. Acc. Index 3.61 18.56 41.14 10.09 10.57 7.97 6.48 8.22
Difference (gross of fees) (5.52) (10.04) (4.86) 2.91 4.91 7.95 3.98 4.79

Selector Funds Management
9
Table 3: Unit prices as at 31 March 2021
Selector employs a high conviction, index unaware, stock selection investment strategy. The Fund’s top 10 positions
usually represent a high percentage of its equity exposure. Current and past portfolio composition has historically
been very unlike that of your average “run-of-the-mill index hugging” fund manager. Our goal remains focused on
truly differentiated broad-cap businesses rather than the closet index hugging portfolios offered by most large fund
managers.
Table 4: ASX sector performance – March 2021 quarter
S&P ASX Industry Sectors Quarter Performance (%)
Financials 11.32
Consumer Discretionary 7.44
Telecommunications 7.05
Energy 2.86
Materials 0.66
Consumer Staples (0.80)
A-REITS (1.13)
Industrials (1.83)
Utilities (2.64)
Healthcare (2.90)
Information Technology (11.53)
Table 5: Fund’s industry weightings
Unit Prices Entry Price Mid Price Exit Price
$3.1579 $3.1500 $3.1421
Industry group March 2021 (%) December 2020 (%)
Software & Services 22.84 24.04
Consumer Services 18.21 17.70
Health Care Equipment & Services 14.29 16.30
Media & Entertainment 9.84 10.64
Capital Goods 8.68 7.81
Materials 6.39 6.28
Diversified Financials 4.48 4.74
Pharmaceuticals, Biotech & Life Sciences 4.16 3.97
Cash & Other 2.93 0.29
Household & Personal Products 2.49 2.41
Insurance 2.13 2.50
Automobiles & Components 2.12 1.94
Consumer Durables & Apparel 1.42 1.38

Selector High Conviction Equity Fund Quarterly Newsletter #71
10
PORTFOLIO CONTRIBUTORS
Graph 2: Contributors and Detractors – March 2021 quarter
Top quarterly contributors
1. Reece (ASX:REH) Refer to the reporting season article below.
2. Domino’s Pizza Enterprises (ASX:DMP) Refer to the reporting season article below.
3. TechnologyOne (ASX:TNE) During the period, TechnologyOne held its annual
general meeting. The company remains on track to
deliver strong Software-as-a-Service (SaaS) annual
recurring revenue and profit growth for full year 2021.
SaaS continues to be the primary opportunity across the
company’s key markets of local government, higher
education and government related businesses.
Management has affirmed a strong pipeline for 2021 and
will provide further details at its first half results.
TechnologyOne has a market capitalisation of $3.1b with
net cash of $125m.
4. Aristocrat Leisure (ASX:ALL) Aristocrat Leisure’s annual general meeting held in
March reaffirmed the group’s positive business
momentum. The company’s land-based operations have
continued to maintain or enhance market leading share,
a result of strong customer support and investments
undertaken during the period.
The digital business is also growing share across the core
genres of Social Casino, Social Casual and Strategy and
RPG. Increased investments in user acquisition (UA) and
design & development (D&D) to scale existing while
introducing new games has led to strong growth in digital
bookings. Management is intent on accelerating the
positive progress enjoyed in this division, as reflected in
the recent acquisitions of proven, world-class game
studios, Neskin and Proteus.
As a content provider, Aristocrat’s people are paramount
towards the long-term success of the business. The
company has reiterated a ‘people first’ focus, which we
cover in more detail in our article “Remuneration, and
why we vote the way we do”.
Aristocrat Leisure has a market capitalisation of $23.5b.
5. Cochlear (ASX:COH) Refer to the reporting season article below.
Bottom quarterly contributors
1. Nanosonics (ASX:NAN) Refer to the reporting season article below.
2. Altium (ASX:ALU) Refer to the reporting season article below.
3. Infomedia (ASX:IFM) Refer to the reporting season article below.
-1.50% -1.00% -0.50% 0.00% 0.50% 1.00%
REECE
DOMINO'S PIZZA ENTERPRISES
TECHNOLOGYONE
ARISTOCRAT LEISURE
COCHLEAR
APPEN
POLYNOVO
INFOMEDIA
ALTIUM
NANOSONICS

Selector Funds Management
11
4. PolyNovo (ASX:PNV) Refer to the reporting season article below.
5. Appen (ASX:APX) Refer to the reporting season article below.

Selector High Conviction Equity Fund Quarterly Newsletter #71
12
WHAT A ‘PER’ DOES NOT CAPTURE
Undertaking a comparative analysis of businesses
through a price to earnings ratio (PER) is a lazy way to
invest. Pick the low PER stocks, accompanied in most
instances by overly generous dividend payouts and hey
presto you have what appears on paper to be low risk
and better valued stocks.
This short cut investment approach is alive and well,
even among the most established and reputable of
investment houses, despite considerable shortcomings.
Calculating a company’s PER requires a relatively
straightforward formula: ‘the share price of the business
divided by the net profits expressed as earnings per
share (EPS). The higher the PER number the more you are
paying for the business and vice-versa.
Now of these two inputs, the share price is a given. It is
set by the stock market and as proponents of the
efficient market hypothesis would argue it incorporates
all the important and available information known. We
would beg to differ.
No single ratio can tell you all you need to know about a
stock, and in fact the EPS calculation is not as
straightforward, involving all manner of financial
gymnastics to get to the bottom line. The accountants
have engineered a job for life, ably supported by the
auditing community who make sure everything is in
order, or qualified.
What makes the PER comparison difficult is the very
thing that should make it easy. That is, the lack of
consistency in calculating the most important input, net
profits. What gets included (the type of expenses), what
is missing (outlays that are capitalised and not
expensed), what is applied differently (rate of
depreciation write-off against assets) and what is
random (one off gains and losses), are the very things
that make this output, and what investors are relying on,
such a hit and miss process.
To deduce that a portfolio with a lower average PER
carries less risk and therefore by definition, greater
potential upside, is like comparing apples with oranges.
The obvious fact that they are both fruits is where any
similarity ends.
The PER itself is reflective of what an investor is prepared
to pay for a business compared to its earnings. Generally,
it captures either historical or past earnings and some
expectation of future profits. A low multiple is often
attributed to lower growth businesses. Conversely a high
PER is associated with a higher earnings profile.
Obviously, a lower ratio is preferred, being a quicker
period for the investment outlaid to be recouped, but in
truth that is where the assumptions stop, and the
realities start.
Unlike an asset class, like a toll road, that has some sort
of revenue predictability (at least we thought it did until
COVID came along), most businesses are dynamic.
Regulation, competition, new markets, loss of clients and
economic impacts, all go into the mix to define how well
a business may perform.
A PER of 10 might sound great on the surface but anyone
owning Telstra, of which we are not one, are still holding
their breath, having witnessed the slide in profits and the
cut in dividends over the past decade. The share price
over this period remains largely unchanged at roughly
$3.40, despite a recent high point of $6.59 in 2015 and
its listing price of $3.40 back in 1997.
The introduction of the Federal Government’s wholly
owned wholesale internet monopoly operator, the
National Broadband Network (NBN) certainly changed
the dynamics of this industry over recent years and its
longer term impact is still to play out.
For Telstra shareholders, however, what is crystal clear
is a business that has delivered diminishing returns and
a highly leveraged balance sheet; a result reflective of
the intensity of capital reinvestment and accompanying
shareholder pressure to maintain an unsustainable level
of dividend payments.
In 2010, Telstra’s net debt stood at $13.9b, with
revenues of $25b and reported net profits of $3.9b. In
June 2020 reported net debt had risen to $16.8b, while
net profits had collapsed to $1.8b on group revenues
largely unchanged at $26b. These metrics, as crude as
they are, do not portray a flattering story. For investors,
hopes of future earnings are now being pinned on an
asset sell-off program and the extension of the

Selector Funds Management
13
company’s national mobile dominance with the rollout
of its 5G network.
Today, the business trades on a historical PER of 22,
more than double what it was in 2010. This is not a result
of a share price (numerator) increase, rather the
earnings per share (denominator) has slumped. The debt
profile is higher, but interest payments have also fallen,
in part due to the lower interest rate environment,
thereby disguising another concern.
Finally, despite the pressure for capital reinvestment,
dividends are being maintained at 16 cents per share,
equivalent to a 100% payout of profits, but down from
the 28 cents paid a decade ago.
So, what are investors to make of a PER? In short, it is
crude and hides all manner of business sins. The absolute
number may indicate the level of risk one is exposed to,
but in truth investing is not that simple. As Telstra
shareholders have unfortunately experienced, the long-
term success and sustainability of a business goes well
beyond a company’s PER score. There is more that goes
into the mix of what makes a good business, as well as
the risks at play, than just a raw number.
We have written at length in earlier quarterlies on some
of these metrics, many qualitative in nature. Below we
expand on a few, but it should not surprise our readers
to know that the last thing we consider in any company
analysis process, is the valuation. It is not that we are
dismissive of this, but more that the long-term success of
any business is dependent on multiple factors.
Top of the list is the business team, which we loosely
term management. The focus however extends beyond
the chief executive officer (CEO) and finance personnel.
While the CEO is critical in setting the strategy and
direction, the best companies are those with a collective
purpose from the top down. There needs to be buy in
from the board all the way to the office junior. It is this
very buy in, what we call culture that is nurtured over
time.
Culturally aligned businesses have that special x-factor
and are often seen in founder-led organisations. They
have a clearly focused purpose, a true north star pursuit,
involving a strategic intent. Importantly, success is
measured against internal objectives, rather than market
obsessed yearly metrics.
We focus on the long-term financial trends to gauge the
progressive health of a business. A pause in earnings
growth, or a commitment to invest further, is often
frowned upon by analysts as it has a direct impact on
carefully crafted financial discounted cashflow models
(DCF*). A DCF valuation, one that aims to capture the
long-term discounted cash flows of a business, can vary
so dramatically on any given event, that it leads to manic
whips in business valuations and share price targets.
Given all the moving parts that impact the running of a
business, short-term events are not only likely but
normal. Sticking a share price valuation based on a DCF,
which is frankly ridiculous to measure1 in the first
instance, is illustrative of an industry obsessed with a
just-in-time investing mentality.
In contrast, exceptional business leaders approach the
task of leading differently. Short-term disappointments
are par for the course, as is the drive to innovate and
remain focused.
A culturally aligned team in pursuit of its business
objectives often displays common traits, including:
1. Founder or significant investor base allowing for
shareholder alignment.
2. An ownership approach that measures success over
decades not months.
3. A reinvestment commitment that sits at the core and
preferably expensed.
4. A balance sheet that is not ‘debt’ optimised,
providing flexibility and latency to move.
5. A shareholder relationship that values transparency
and delivers actions that advances a purpose that are
in the best interests of owners, including society.
6. The pursuit of leadership, often doing the
unconventional.
When you package this up, while it is a powerful
combination it is not without its heartaches. The zigs and
zags in business are tough enough, only made more
difficult when operating in a public environment.
As we all know good news gets rewarded and the not so
good harshly dealt. It is little wonder why many boards
and management teams choose their words carefully
when discussing performance or trading updates.

Selector High Conviction Equity Fund Quarterly Newsletter #71
14
Delivering tough news is never easy nor is a change to a
dividend policy done lightly, but that is exactly what is
needed at times. Without firm action, the risk of long-
term damage is simply magnified.
The Telstra board’s decision to maintain a dividend
payout policy in excess of 100%, when clearly the
business was under competitive pressure and capital
reinvestment was a priority, is still hard to fathom or
stomach.
Shareholder pressure drove this outcome, now reflected
in a higher debt profile and a less flexible balance sheet.
Even today the board is prepared to compromise itself in
order to satisfy investor and market demands.
If nothing else, the board’s primary role is as custodians
of a business, while management should be focused on
driving a better, more sustainable enterprise.
With all that in mind, what is an appropriate PER? The
short answer is it depends.
As to what it depends on, well that list is extensive: how
you get to that ratio; whether the management team are
investing for the long haul or executing to extract
maximum short-term gains; whether the balance sheet
is clean and cashed up or swimming in debt; whether
auditors are having to justify the accounts or approve
how costs are capitalised; or do the numbers just flow
effortlessly off the page, reflecting a level of
conservatism that all investors are entitled to.
Ultimately, it requires a level of understanding that can
only be achieved by getting into the nitty gritty. Only
then will an apple to apples comparison be at least
considered possible.
3 Investopedia. 2021. Top 3 Pitfalls Of Discounted Cash Flow Analysis. [online] Available at: https://www.investopedia.com/investing/pitfalls-of-discounted-cash-flow-analysis/#:~:text=The%20most%20prevalent%20is%20that,total%20shots%20in%20the%20dark .
*Ridiculous DCF A discounted cashflow (DCF) model is great for
generating a price target, often impressively close to a
share price, because it has so many convenient levers.
Yet a DCF fails to fit our common-sense approach and
according to Investopedia3 it has the following issues,
which we agree with.
DCF common-sense issue #1
The most obvious real-world issue is that the uncertainty
with cash flow projection increases each year in the
forecast. A DCF model often uses five or even 10 years'
worth of estimates. The outer years of the model are
likely to be total shots in the dark.
DCF common-sense issue #2
Free cash flow projection involves estimating capital
expenditures for each model year. Again, the degree of
uncertainty increases with each additional year in the
model.
In the real-world, capital expenditures can be largely
discretionary; in a down year, for example, a company's
management may rein in capital-expenditure plans (the
inverse may also be true). Capital expenditure
assumptions are usually quite risky.
DCF common-sense issue #3
Perhaps the most contentious assumptions in a DCF
model are the discount rate and growth rate
assumptions. All manner of discount rate assumptions
can be applied to an equity DCF model. The various
approaches are quite theoretical and may not work well
in real-world investing applications.
Perhaps the biggest problem with growth rate
assumptions is when they are used as a perpetual growth
rate assumption. Assuming anything will hold in
perpetuity, other than a toll road, goes against our
common-sense approach. SFM
Selector Funds Management
15
STRANDED ASSETS
“Stranded assets are investments that are not able to meet a viable
economic return and which are likely to see their economic life curtailed
due to a combination of technology, regulatory and market changes.”
Bankers are familiar with the term stranded assets,
investors less so. The current decade is likely to change
all that and investors will do well to understand the
consequences.
First, let us take a step back in time. It is the year 1962
and the company is Berkshire Hathaway. Warren Buffett
had just stepped up to invest in a struggling textile
business. It was a value play, with all the visible
attractions that such assets tend to exhibit; low
valuations, excess capital tied up in hard assets and the
promise of running a better, more efficient operation.
There was only one problem, the textile business was a
poor one. Buffett knew that and had planned to offload
the business to management, who originally agreed to
terms and then reneged. Buffett doubled up, took
control and acknowledging the poor financial outlook
confronting the textile business, stopped investing. He
diverted his energy and money into investments,
specifically insurance, starting with National Indemnity
in 1967 and subsequently auto insurer Geico, which was
fully acquired in 1996. As they say, the rest is history.
Buffett as we all know is no ordinary investor. Even
though he refers to the purchase of the Berkshire textile
business as one of his worst investment decisions, he did
not compound the error. He had seen the writing on the
wall and in his 1985 letter to shareholders made a point
to share his hard earned lessons to investors, “I won’t
close down businesses of sub-normal profitability merely
to add a fraction of a point to our corporate rate of
return. However, I also feel it inappropriate for even an
exceptionally profitable company to fund an operation
once it appears to have unending losses in prospect.”
In Buffett’s 2012 shareholder letter the message of
where not to invest was crystal clear, “Generally
speaking, it pays to stay away from declining businesses.
It's very hard. You'd be amazed at the offerings of
businesses we get where they say... it's only six times
EBITDA, and then they project some future that doesn't
have any meaning whatsoever. If you really think a
business is declining, most of the time you should avoid
it.”
It is not always obvious that a business is in decline. As
societies change and new technologies are rolled out
their impacts are felt by business and consumers alike.
These slow-moving trends may appear benign at first,
but they invariably exert their influence on how capital is
deployed.
Capital is the great leveller, flowing to where the returns
are greatest, rather than where it is needed most. A
business that becomes stranded, is one that is caught
between the here and now and the future. And as Buffett
determined, it is unwise to deploy more capital into a
business that is in a rate of decline. When the economics
of the business no longer support it, it is time to get out.
We learnt this valuable lesson when we exited our
investment in liquefied natural gas (LNG) operator, Oil
Search during 2020. Its main asset, the world class Papua
New Guinea (PNG) LNG project commenced production
in 2014. It had transformed the company by providing a
very competitive and abundant energy source at a low-
cost to a growing global audience. Management was first
class and despite PNG’s political instability, the
company’s presence in the region appeared assured.
All this changed when a new PNG Government took a
combative approach to future LNG development. The
company looked to augment its PNG operations by
buying into a highly prospective oil province on the North
Slope, Alaska.
The PNG situation was tricky but not terminal. Drilling for
oil in Alaska was, however, something different. It is not
that management were cavalier or wrong in their
assessment of the significant opportunity present, but
more so the world’s view of these types of endeavours

Selector High Conviction Equity Fund Quarterly Newsletter #71
16
had changed. They had become for all intents and
purposes non-bankable.
While drilling had confirmed a significant oil resource,
funding the project’s development would ultimately
require the support of the banking fraternity.
What changed? No doubt COVID-19 did not help the
matter, with a collapse in demand sending oil prices
spiralling to decade lows. Environmental concerns have
always existed, but the North Slope is home to some of
the global industry’s oil majors, like ConocoPhillips, while
the Prudhoe Bay region of Alaska is home to five of the
top ten producing oil fields in the United States of
America.
Now, we would surmise that climate change and the
growing global acceptance for action, has permanently
altered the investment resource landscape.
Governments will no longer endorse new projects
without extensive due diligence and environmental
analysis. Investors, led by the powerful industry
superannuation funds, will now screen out sectors,
industries and companies that no longer meet long-run
acceptable metrics or member expectations.
In this instance the “canary in the coal mine” is the coal
industry itself. Targeted as a non-investable asset class
by prominent investors, including the world’s largest
fund manager, the US$8.7t BlackRock Group led by CEO
Larry Fink, coal has figuratively speaking become a dirty
word.
The writing was on the wall for not only the coal industry
to see, but also those operating in exploration and
development, including the likes of Oil Search. We exited
our investment knowing this was a business under
increasing operational duress and exposed to investor
and funding scrutiny.
We lost money but that did not alter our view that this
was the correct course of action. In the end, the bankers
had raised the alarm bell. This was an acknowledgment
of the shifting sands, driven by climate change action.
While others may see an opportunity to invest in an asset
class that, while wounded by COVID, will recover, we see
ongoing structural weakness. We moved on.
History provides a wonderful catalogue of past winners
disrupted by human advancements. Kodak and
Blockbuster are two names that come to mind, along
with companies who have been in the line of fire with the
shift from fixed telephony to mobile, cash to digital
payments, or even shopping malls to online retail. These
seismic shifts are not necessarily felt overnight, but
ultimately there will be an impact.
Many investors often confuse the past with the future.
Find a business, value it using simplistic metrics like its
net asset backing, a price earnings ratio or what appears
to be a very low earnings before interest, tax,
depreciation and amortisation (EBITDA) multiple, while
at the same time being seduced by a tempting yield.
It is easily done when the investment also comes with a
known brand. However, as Buffett discovered with the
Berkshire textile business, reputation counts for nought.
You only need to look at a handful of recognised brands
to realise the challenging landscape they have now found
themselves in. Think telecommunication operator
Telstra, energy providers such as AGL and Origin Energy,
insurers including reputable names QBE and IAG, and
property plays like Scentre Group (operator of
Westfield).
Investors have been put on notice. COVID-19 not only
impacted our lives in a direct and meaningful way, but it
also shocked us into action and accelerated a permanent
shift in business and consumer behaviour.
At the core, technology will continue to be the great
disrupter. Adopting a status quo approach is a recipe for
failure as advancements continue at a rapid pace. One
must only look at the swift vaccine response to COVID-
19 to appreciate the role technology is having in the field
of science.
Directors too are coming to grips with a company’s
licence to operate, now increasingly captured under the
heading Environmental, Social and Governance (ESG). It
is no longer good enough to just voice concern, investors
are demanding action. This is akin to renowned
management guru Peter Drucker’s approach, “what gets
measured, gets managed”.
As we saw during the last quarter, some companies
shocked investors twice. Take energy provider AGL as an
example. First, it pre-reported an earnings downgrade,
never a positive experience.
Second, it reported a $1.9b write down to its asset value,
accounting for onerous wind farm contracts written
Selector Funds Management
17
during 2006 and 2012, while increasing provisions for
environmental restoration of its fossil fuel assets.
Further impairments of $532m were made on its natural
gas assets.
All up a $2.7b hit to a business caught in the middle of an
energy transition movement from carbon to renewables.
Addressing investors at the group’s recent 2021 half year
result, AGL CEO Brett Redman outlined the difficult task
facing the group. He stated the company is “actively
assessing our business model and capital structure to
maximise shareholder value and support our evolving
strategy as the shaping forces of customer needs,
community expectations and technology continue to
accelerate.”
We suspect we are going to witness a lot more write
downs as companies assess the negative ramifications of
technological impacts and competitive market forces.
The danger comes when a traditional utility type
operation, carrying inflated asset values and
accompanied by high leverage in the form of debt,
realises the world has changed. As one side of the
balance sheet shrinks, the implications are felt on the
other in the form of higher gearing ratios and lower
returns to investors.
The general insurance industry is another grappling with
a host of challenges. Near zero global interest rates has
driven low returns on an insurer’s ‘float’ (representing
premiums collected before payouts are made), while
ongoing external shocks continue to deliver long
duration risk. For our liking it is an industry with too
many unknowns, inexplicably caught in the past and
unable to predict the future, while providing investors
little in the way of reassurance.
We may struggle as investors to understand why some
businesses and sectors are valued so highly while others
languish, but invariably the forces at play are right,
capital will flow to where it should.
And here it is worth watching what the bankers and
insurers are doing. As the world’s underwriters of capital
and risk, their actions carry weight. A case in point, in
2019 eleven major banks with significant holdings in the
global shipping industry signed onto an extensive set of
guidelines.
Christened the Poseidon Principles, the guidelines were
designed to accelerate decarbonisation across the
sector. By measuring annually, the carbon intensity of a
signatories shipping portfolio, it sets a benchmark for
what it means to be a responsible bank in the maritime
sector, while simultaneously forcing change down the
line.
We certainly do not take anything for granted. While our
day to day lives have been turned upside down in many
ways, the era of technological disruption and scientific
discovery may be at its infancy.
When a company finds itself on the wrong end of
business economics, no share price level is cheap
enough. To borrow a line from Buffett, “Time is the friend
of the wonderful business, the enemy of the mediocre.”
SFM
Selector High Conviction Equity Fund Quarterly Newsletter #71
18
REPORTING SEASON SNAPSHOT
Altium (ASX: ALU) After eight years of consecutive, double-digit growth,
electronic printed circuit board (PCB) designer Altium
experienced a challenging first half, with revenue
declining 3% to US$89.6m. CEO and Executive Director
Aram Mirkazemi explained the first half was “Altium's
pitstop”, reflecting the external pressures from COVID-
19 and the organisation's hard pivot to the cloud,
otherwise known as its “Netflix Moment”.
At the end of the period, the company's subscriber base
stood at 52,157 seats, up 12%. The impact of COVID-19
was most readily seen in the lower uptake of new
perpetual licence sales, down 15% for the half. This was
compounded by licence compliance challenges in China,
weighing down on the group’s performance in region.
Importantly, while perpetual licences decreased, term-
based licenses more than doubled over the period,
boding well for Altium’s goal of reaching 80% recurring
revenue by 2025, off its current base of 65%.
With over 100,000 engineers using Altium Designer
worldwide, it is the most widely used professional PCB
design tool and the key enabler for the company to
dominate the PCB industry.
Complementing this core business is Altium’s cloud
business NEXAR, which seeks to drive industry
transformation. NEXAR, houses the Altium 365 cloud
platform, online parts catalogue provider Octopart and
Smart Manufacturing. Following two years of
organisational transition, NEXAR is pioneering an
industry shift to real time collaboration that connects
online design, product development and parts sourcing
all the way through to manufacturing. In essence it is the
digitisation of this space.
Altium has recognised that current processes for design
collaboration are archaic, with engineers having to
contend with various forms of communication and file
transfer systems to share and discuss designs. Through
the company’s latest platform offering, Altium 365 users
host their designs on the cloud and can collaborate
seamlessly across the supply chain in real time.
For the fragmented electronics industry, Altium 365 is
aimed at managing production risk and driving
productivity. There are now 9,300 active monthly users
and 4,400 active monthly accounts on the platform since
its launch in May 2020. The company has undertaken
little marketing, with growth to date driven by user
experience and word of mouth.
Importantly, Altium will not require any change to its
current designer software licensing model and is offering
free standard access to Altium 365 for all users. A
network effect should increase the rate of use, reduce
churn and in turn drive incremental software licence
sales. Over time, the company is expecting to monetise
transactions and premium services within the 365
offering.
With these changes comes the opportunity for stronger
growth as CEO Mirkazemi explains, “As part of this
transition, our team has switched from one engine of
growth with one flywheel to two engines of growth with
four independent flywheels. These new flywheels are
built to drive adoption of our CAD tools and cloud
platform. For the adoption of CAD tools, there are two
dedicated flywheels that focus on high-volume and high-
touch sales. And for the cloud platform, there are two
additional flywheels that focus on bringing customers to
the cloud and bringing partners to the ecosystem that is
being built around Altium 365. These flywheels are fully
formed and are beginning to spin out. Our focus is now
fully dedicated to building ever-increasing momentum in
these flywheels.”
The group’s strategic decision to singularly focus on
Altium’s connected platform offering, led to the decision
to divest the non-core TASKING business for US$110m.
CEO Mirkazemi outlined the reasoning behind the move,
“While TASKING is a great business, it does not play a
central role in our design to realization strategy for the
electronics industry, which is being delivered through our
new cloud platform Altium 365. The divestment of
TASKING will free up organizational capacity and allow
Altium leadership to focus on our main game, which is to
expand Altium 365 and accelerate its adoption”.
Altium confirmed that full year 2021 revenue guidance is
likely to settle at the lower end of the previously
indicated range of US$190m to US$195m, along with
operating profits (EBITDA) of US$70m to US$76m.

Selector Funds Management
19
Altium closed the period with cash of US$88.3m
(excluding the TASKING proceeds of US$110m), no debt
and a market capitalisation of $3.6b.
Appen (ASX: APX) Following its solid first half result, Appen released a
trading update to the market in November, lowering
underlying operating earnings (EBITDA) guidance for full
year 2020 within the range of $106m-$109m, compared
to the $125m-$130m previously guided. The full results
were released in February, with group revenues rising
12% to $599.9m and underlying EBITDA improving by 8%
to $108.6m, representing an EBITDA margin of 18.1%.
Both updates prompted broad market sell offs, with
Appen's near term growth expectations lowered due to:
1. Exchange rate headwinds
2. The impact of COVID-19 on new business
development and renewals with smaller customers
3. Reprioritisation of projects from major customers
Appen’s business model is highly reliant on its major
customers, and in this case the company was impacted
on the downside. CEO Brayan explained traditional data
refreshes, which occur late in the year, were less than
expected, “Our major customers rely on advertising as
their major source of revenue, and hence, they reacted by
deferring some projects and reallocating resources to
new product developments to lessen their reliance on
advertising. This, in turn, impacted our revenue to the
extent that we did not see the uplift in revenue from our
major customers in Q4 that we have seen in other years.”
We note the near-term concerns that surround – major
technology players facing external pressures including –
changes to IDFA (Identity for Advertisers) for Apple users
to opt in to tracking data, and multiple anti-trust cases,
brought by state and federal regulatory bodies in the
U.S., in relation to monopolistic behaviour around digital
advertising. Perceived earnings uncertainty is driven by
Appen's dependency on major technology firms – as
these tech titans look to diversify digital advertising
revenue, they are reprioritising resources into new
product areas which involve Appen.
Importantly, management is confident data
requirements are not being brought in-house. Appen has
seen a 34% year-on-year increase in projects with
existing customers, which CEO Brayan notes as
“extremely positive” and indicative of the importance
Appen's offering has to the future growth within these
organisations.
CEO Brayan also highlighted a gradual recovery stating,
“In regard to our major customers and projects that were
deferred or impacted by resource reallocation, we are
seeing most of the material projects that were deferred
in the second half recommence in the first half of '21, and
present indications suggest a steady return of the
projects that were impacted late in 2021.”
As we highlighted in our December quarterly 2020
newsletter, Appen operates as a leader within the
relevance space, having a proven ability to efficiently
scale its crowd workers as demand requires. Globally,
there is only one competitor with the scale to compete
effectively. This was private equity owned Lionbridge,
recently acquired by Canadian communications and
information technology company TELUS International
for US$935m.
Despite the pressures, the Relevance segment grew
revenues by 15% to $538.2m and operating profits by 8%
to $112.7m. The group’s Speech and Image division,
encompassing speech, text, image and video data
labelling recorded revenues down 10% to $61.2m, as the
inconsistent nature of work has led to some customers
deferring projects due to COVID. Operating profits fell by
42% to $12.4m, as the company continues to invest in
building the right base to facilitate growth as activity
returns.
The business continues to invest to grow its technology
offering. This transition was accelerated with the
acquisition of Figure Eight in 2019 for a total
consideration of $287m, a best-in-class machine learning
annotation platform. Appen – offers an integrated,
secure solution alongside its leading crowd workforce,
allowing clients to create, manage and monitor data
labelling projects, while providing efficiencies within the
crowd data labelling and hiring processes.
This strategic play has positioned Appen well from a
product and technological standpoint. The annotation
platform expands Appen's reach to companies without
their own platform, which bodes well for potential
customer growth and diversification.
Four of Appen's top five major global technology
customers use the annotation platform, as it can service

Selector High Conviction Equity Fund Quarterly Newsletter #71
20
a range of use cases and data types that their own
platforms cannot. Appen becomes increasingly
integrated with clients' operations as they transition
more projects over to the platform. This leads to
improved productivity and quality of work as well as
better predictability and visibility of future projects and
revenue. The company already has one enterprise-wide
platform agreement with an existing major customer
valued in excess of US$80m. We consider this is a strong
endorsement of the company’s technological capability
and representative of the integral role Appen has in this
customer's new and existing product roadmap.
Additional investments across sales and marketing,
augmented with material software development spend
has positioned the business to remain at the industry
forefront, as evidenced by:
• Signing a record 136 new customers in 2020 across
multiple industries, geographies, data modalities
and use cases.
• Committed revenue of $92.0m in 2H20 or 31% of
total revenue, up from $36.3m in 1H20 or 12% of
total revenue.
• Revenues in China has grown 60% quarter on quarter
across the full year, with the business servicing the
major Chinese technology players.
In its outlook statement, Appen has flagged near-term
challenges due to the timing of project deliveries and a
stronger Australian dollar. The company expects its
underlying EBITDA for FY21 to be in the range of US83m-
US$90m, representing growth of 17-28% from FY20
excluding the foreign exchange gain.
Appen operates in the Artificial Intelligence (AI) space,
which has increased in importance over the past year as
organisations accelerate their digitisation initiatives.
Financially, Appen has a capital light balance sheet and
the ability to self-fund its growth initiatives for the
foreseeable future. Management are focused on matters
within their control, which is to maintain the delivery of
high quality data at speed for customers, while investing
to build a sustainable business for the long-term.
Appen has a market capitalisation of $2.0b and net cash
of $78m.
carsales.com (ASX: CAR) Leading online automotive listings business carsales.com
released its first half FY21 results in February. For the
half, the company reported revenue of $199m and net
profit after tax of $61m, a decline of 7% and 14%
respectively against the prior corresponding period
(pcp).
This result reflects the difficult trading conditions posed
by the COVID-19 health crisis. Despite this, investments
in international markets continue to provide significant
scope for carsales, with offshore markets now
contributing 25% or $26.3m of total look-through
operating profits (EBITDA).
It is important to note that the result is muddied by the
COVID-19 Dealer Support Package which saw $11m in
fees waived over the period. Adjusted for the support
package and other one-offs, the company reported
revenues down 2% to $210m while net profit after tax
lifted 17% to $74m
These figures reflect an expansion in core business
margins as the company reduces costs, exits under-
performing businesses and focuses on improving general
business profitability.
On the domestic front dealer sales volumes and traffic to
the website remained resilient, assisted in part due to
Carsales' support package. Strong demand for used cars
encouraged dealers to continue to invest in depth
products despite the backdrop of a tougher economic
environment.
The group’s Media division fared less well, impacted by a
challenging new car market, that was further
complicated by cuts to car manufacturers advertising
budgets.
While the effects of COVID-19 have been similarly felt
offshore, the group’s operations in both South Korea and
Brazil delivered strong performances for the period.
Wholly owned Encar (South Korea) delivered revenue of
$38.6m and operating profits of $20.6m, an increase of
19% and 26% respectively. This result was underpinned
by the Guarantee Vehicle Inspection and Dealer Direct
(similar to Carsales' Instant Offer product) services.
Webmotors (Brazil), of which Carsales has a 30%
ownership stake, delivered revenue of $32.5m and
operating profits of $15.4m, a decrease of 21% and 15%

Selector Funds Management
21
respectively, driven by unfavourable currency
movements. In constant currency, Webmotors grew
revenue 11% with operating profits increasing 21%.
On a look-through basis, International businesses
contributed revenues of $53.8m and operating profits of
$26.3m for the period, an increase of 5% and 29%
respectively.
The majority of these businesses are market leaders,
providing a long runway for growth.
Carsales has a market capitalisation of $5.0b and a net
debt of $361m.
Cochlear (ASX: COH) Leading global bionic ear manufacturer Cochlear
delivered a less eventful 2021 half year result, following
a tumultuous end to the previous period that included an
adverse legal decision, the initial onset of COVID-19 and
a $1.1b capital raising. The group’s overall financial
metrics were solid. A softer first quarter was followed by
a much improved second period, with revenues down 1%
in constant currency (cc) to $742.8m and underlying net
profits falling 4% cc to $125.3m.
Cochlear implant numbers recovered strongly, with
revenues rising 1% to $455m, offset by modest declines
in Services down 2% to $215m and Acoustics off by 7%
to $73m. This was underpinned by the group’s
developed market regions with unit sales up 5%, offset
by unit declines of 30% in emerging markets.
Importantly, surgeries have returned to pre-COVID levels
across several developed markets, while new candidate
pipelines are quickly rebuilding.
One region worth highlighting is China. The company has
committed capital to building a manufacturing base in
the country and has successfully grown unit sales over
the years. While the company is loath to break down unit
sales by region, China sits within the top three alongside
the U.S. and Germany. It is a powerful position, noting
the significant unmet demand that resides in the
country.
Amidst the crisis, Cochlear has maintained its
investments in research and development (R&D) and
people. Choosing not to reduce its workforce has
allowed employees to focus on providing superior
customer service and support.
The recent release of four new products, including the
off the ear Kanso 2 sound processor, has further
differentiated the company's product portfolio. This
innovation mindset is explained further in our “Black Box
Thinking” article. Overall, these initiatives have led to
market share gains and helped further cement its
leadership position within the profound hearing loss
market.
Financially, Cochlear now has significant flexibility,
operating with a net cash balance of $502m, while also
continuing to generate free cash flows. The group
declared an interim dividend of $1.15 per share, which
represents a payout ratio of 60% and signals the group’s
confidence in its outlook and ability to generate positive
returns.
The passage of time has undoubtedly given more
certainty around Cochlear's operating environment.
Hospitals are better informed and equipped to deal with
the virus, while nationwide vaccination programs are
accelerating. Cochlear is poised to benefit as elective
surgeries are reprioritised, having fortified its balance
sheet and improved its competitive moat during COVID.
Having managed the impacts of COVID, the opportunity
ahead for Cochlear is to grow its implant base, with the
company noting "less than 10% of people who would
benefit from an implantable hearing solution are
treated”. Despite being the market leader with a
differentiated product portfolio, the industry has
struggled to increase penetration rates as awareness and
knowledge amongst audiologists, ENT (ear, nose and
throat) specialists and consumers remains low.
Management have developed an improved
understanding of the referral channels through
investments in the Cochlear Provider Network and Sycle
acquisition.
Importantly, they have shown a willingness to invest in
growth, and as market leaders with a long-term focus,
we remain confident on improved cochlear implant
penetration rates going forward. This large total
addressable market also provides a lever for sustainable,
organic earnings growth over the long-term.
Cochlear has a market capitalisation of $14.0b and net
cash of $502m.
Selector High Conviction Equity Fund Quarterly Newsletter #71
22
Domino’s Pizza Enterprises (ASX: DMP) Domino’s Pizza Enterprises has transitioned to the new
COVID-19 world in better shape than most. As a digitally
driven, home based food delivery business, the group’s
global footprint has thrived under the restrictive
lockdown conditions created by the pandemic. Executing
under such fluid conditions is no easy feat, especially
while maintaining exacting health standards.
Domino’s demonstrated strong operational
performance as network sales increased 16.5% to
$1,843m and total same store sales (SSS) grew by 8.5%.
The current climate led to a notable uplift in online
orders, now representing 77% of sales compared to 65%
in the prior comparative period. In total, 131 new stores
were also added during the half, a significant
acceleration from the five year range of 70-85 stores.
The company lifted underlying operating profits (EBIT) by
32.3% to $153m, while underlying net profits rose 32.8%
to $96m. Strong cash conversion of over 90% and lower
capital expenditure saw the business cut net debt by
$70m to $377m, resulting in a healthy leverage ratio of
1.1x, down from 1.5x in June 2020.
Breaking down the geographic regions, the revenues and
EBIT of each are as follows:
• Australia and New Zealand (ANZ): $383m (+11.6%),
$63.7m (+9.8%)
• Europe: $324.8m (+15.6%), $44.4m (+19.2%)
• Japan: $387.3m (+37.5%), $55.5m (+106.6%)
Looking at these numbers, the differing growth rates
across each region are clear. As CEO Don Meij notes, “If
we look at the last decade, a lot of the heavy lifting was
done in that profit growth was from Australia and New
Zealand and the Netherlands, whereas today, whilst
those businesses continue to perform well, the really big
shift in earnings is coming from the Japanese, German
and now even the French business as we're seeing the
increase in store growth.”
As Domino’s expands further into these newer markets,
its recipe for success holds steady; continuing to drive
repeat purchases at affordable prices through its three
core pillars of Product, Service and Image (PSI).
Although the go-to-market proposition differs across
regions, CEO Meij explains, “the core drivers of PSI are
universal across our business. In each market we listen to
the customer to make sure that we're trying to exceed
their expectations using the strengths of food quality,
digital technology and super fast and safe delivery.”
Japan is a perfect example of this, having undergone
significant operational and strategic change in order to
fine tune its local PSI proposition. This included:
1. Half price carry out and no minimum delivery – making their offering more affordable for singles.
2. Back of house dough making – meaning complete dough balls are not being sent to the far ends of Japan, enabling a more efficient supply chain, thereby lowering input costs.
3. National input pricing (similar to Australia) – meaning a store outside the major cities of Japan will now have the same input pricing as a store in Tokyo. In effect, higher volume city stores are now subsidising regional stores who had lower volumes, but higher input costs stemming from freight and supply chain factors.
Japan delivered the standout result for the period,
recording SSS growth of 36.4% and increasing its network
store count by 68 to 742. The opportunity ahead for
Japan is to expand this proven PSI model into new and
existing territories, with management aiming to double
the store count by 2030-2032. The extraordinary levels
of trading from the recently opened stores in Hokkaido,
highlights the unmet demand in Japan, with the region's
population size of 5.2m (equivalent to that of Sydney)
further illustrating the growth runway ahead.
Similar expansion opportunities are also present in
Europe, most notably Germany and France. Overall, the
company plans to double its global store count from
2,795 to 5,550 by FY25-FY33, with a split of around 2,850
stores in Europe, 1,200 stores in ANZ and 1,500 stores in
Japan.
Once scale is achieved, Domino's PSI value proposition
subsequently improves; as more stores open, Domino's
fortressing strategy results in new store being located
physically closer to the customer.
The result is fresher pizzas delivered in less time and
reduced costs for both the franchisee and the corporate
business to advertise nationally. The group has shown
confidence in delivering to this strategy and importantly,
has the balance sheet and team to execute.
We remain confident in the management team and the
Board who have shown an ability to overcome challenges

Selector Funds Management
23
and external pressures to deliver earnings growth for
both its shareholders and franchisees.
Domino's Pizza Enterprises has a market capitalisation of
$8.9b and net debt of $377m.
Flight Centre Travel Group (ASX: FLT) With international borders facing hard lockdowns and
domestic travel in a state of flux, it is no surprise that
Flight Centre Travel Group’s performance was
significantly impaired over the half.
For the half year period, the company reported total
transaction value (TTV) of $1.5b, only 12% of that
reported for the prior corresponding period (pcp). This
resulted in an underlying loss before tax of $247m, a
stark contrast to the $103m profit reported in 2020.
In response, the company has significantly reduced
costs; almost 70% over the past twelve months from
$1.35b to $421m. The impact to the organisation has
been severe with annualised costs now running at
around $840m, compared to the group’s 2019 run-rate
of $2.7b. This has resulted in the group requiring $10b of
TTV sales to achieve breakeven result.
There is no doubt that the events of the past twelve
months have forced management’s hand and led to a
business reset, with the group’s global footprint of land
based stores cut from around 1,500 to the current level
of circa 730.
Employee numbers, which totalled some 20,000, have
been reduced to 4,268 selling staff. These drastic cuts
have allowed management to better control the re-
introduction of fixed and variable costs, as and when
domestic and international travel corridors reopen.
Importantly, the remit to lift spending will fall under the
direct responsibility of the two key executives of
Corporate and Leisure. In short, these executives are
directly accountable to driving profitable, margin
expanding growth.
This will see a positive shift in group profit before tax
margins, with the Leisure business forecast to improve to
2%, while Corporate is set to hit 3%, thereby providing a
group margin in excess of 2%. This also compares to the
1.45% margin achieved in 2019 and is well north of what
market analysts are factoring into future forecasts.
Despite the extremely difficult trading conditions, the
company continued to invest in building out its
technology platform. Co-founder and Managing Director
Graham Turner explained, “with an eye to the future, we
have balanced the short-term need to reduce costs in a
low revenue environment with the long-term need to
invest in and enhance key assets. In this regard, we have
maintained capital expenditure on key leisure and
corporate technology projects at pre-COVID levels and
have now started to deploy a number of important new
products for our customers and our people”.
Flight Centre is well placed for the recovery phase as
vaccine rollouts progress; now operating as a leaner,
more efficient organisation. While the recovery is still in
the early stages, positive signs are evident. A case in
point was the strong and immediate rebound in leisure
and corporate travel as border restrictions eased at the
back end of 2020. As a result, the December month saw
revenue of $33.5m, a record for the COVID-19 period.
Importantly, the group has made significant efforts to
shore up its balance sheet with an extended liquidity
runway of over $1.2b, including a net cash position of
$1.0b.
While the company has not provided guidance due to
continued uncertainty, Flight Centre is targeting a return
to breakeven in both Corporate and Leisure during
calendar year 2021.
Flight Centre has a current market capitalisation of
$3.7b.
Infomedia (ASX: IFM) Infomedia, a leading Software as a Service (SaaS)
provider in parts, service and data insight solutions to the
automotive industry, released its first half FY21 results in
February. A highlight in the half was the launch of the
company’s Next Gen SaaS platform. This step change
sees Infomedia progress from selling single point
solutions to offering a digital, integrated platform that
increases dealer productivity and drives customer
retention. In total, Infomedia services 180,000 users in
186 countries.
Despite the difficult economic backdrop Infomedia
posted a resilient result with revenue holding steady at
$48m. The company's key internal performance metric,
Cash EBITDA, which represents operating profit adjusted
for capitalised cash costs, declined 16% from $11.4m to
$9.5m largely reflecting the sustained investment in the
Next Gen platform rollout.

Selector High Conviction Equity Fund Quarterly Newsletter #71
24
Beneath the headline number, Infomedia's Service
products division, which enables service desks to
accurately quote on work undertaken during scheduled
car servicing, performed well with revenue rising 9% to
from $18.1m $19.8m over the period.
This was offset by Parts, the industry’s leading Electronic
Parts Catalogue platform, with revenues declining 6%
from $28.3m to $26.7m. The decline, was driven by
lower one-off revenue, temporary financial concessions
provided to customers experiencing severe business
challenges, and unfavourable currency fluctuations.
Under the current management team lead by CEO
Jonathan Rubinsztein, significant change across culture,
technology, product delivery and sales are evidence of
material progress in the last five years. That said the
business remains a work in progress. Ongoing internal
rearrangement and accountability for delivery of results
in the U.S. are needed before a true step change in
growth is to be sustained
Infomedia ended the half with net cash of $97m,
bolstered by $84m of new equity proceeds received in
2020. The capital raising aimed to take advantage of
acquisition opportunities during a period of market
disruption. While the market was disappointed by slow
progress, we applauded management and the board for
walking away from an acquisition that did not have
cultural alignment.
Ongoing travel restrictions surrounding COVID-19 have
also impeded the rollout of new contract wins including
Ford Europe, Audi Australia, along with a number
partnership models in the United States.
While “opening” conditions, driven by vaccine programs,
are set to improve, revenue growth over the second half
will likely remain modest with more significant growth
expected in FY22.
Infomedia has a current market capitalisation of $603m.
James Hardie Industries (ASX: JHX) By all measures global fibre cement manufacturer James
Hardie’s third quarter 2021 result was exemplary. For a
second consecutive quarter, the company reported
record levels in net sales, adjusted EBIT and EBIT
margins, adjusted net operating profit after tax, and
operating cash flow.
Since joining the company in 2019, CEO Jack Truong has
spearheaded a significant transformation centred
around:
1. Becoming a world-class manufacturer through the
execution of LEAN manufacturing.
2. Transforming the commercial organisation to be
truly customer focused; and
3. Integrating the supply chain with customers to
capture mutual benefits.
Through LEAN, the manufacturing network is on a
continuous improvement path of becoming more
predictable and with less variations in production,
quality and efficiency. While not only enhancing the
service provided to customers, LEAN has driven
cumulative cost savings of over US$83m in the 21-month
period since inception, including US$61m in North
America.
To be truly customer focused, James Hardie has adapted
its well known pull approach to a push-pull strategy.
Educating builders on Hardie products continues to be
important in driving (or pulling) demand.
But as Truong rightly identified, the company’s true
customers are the dealer groups, those that sell the
product. By partnering with these groups and ensuring
that agreements are mutually beneficial, James Hardie
can both push and pull demand.
In order to execute on the push-pull strategy effectively,
integrating the supply chain with customers has been
essential.
As Truong explains, “This is to ensure that we're able to
continuously service the market seamlessly to our
customers, provide them with the products they want,
when they need them. This integrated approach to
managing the supply chain with our customers have led
to a more optimal working capital for both our customers
and James Hardie”.
The US$90m and US$200m drop in inventory and
working capital respectively over the financial year to
date, is illustrative of management’s step-change
approach.
The effects of this operational transformation are clear
in the results. At a group level, net sales increased 6% to
US$2,102m and adjusted operating profits (EBIT)
increased 25% to US$456m over the past nine months.

Selector Funds Management
25
The group’s largest market, North America, saw volumes
in the exterior business grow 9% over the same period,
resulting in net sales of US$1,485m up 11%. LEAN
manufacturing savings, coupled with improved volumes
resulted in operating profits lifting 24% to US$435m,
while margins improved from 26.1% to 29.3%.
Europe had a difficult start to the year as it battled with
country shutdowns and a lack of sufficient scale to offset
higher production costs due to COVID-19. Volumes
improved however in Q3, with sales up 12% and EBIT
margins making up for lost ground returning to 10%. In
the Asia-Pacific market, margins improved from 23.3% to
28.4% over the financial year to date, as the company
exited the non-profitable James Hardie Systems business
and shifted production from New Zealand to Australia.
The group’s financial discipline was reflected in higher
cash flows, up 72% to US$678m, with capital expenditure
contained to US$77m for the period.
James Hardie ended the period with net debt of
US$864m, down from US$1.0b at the end of FY20. The
company has continued to invest in market leading
technology with a global innovation platform set to be
released in the coming months.
Given the strong operating performance and balance
sheet, James Hardie has announced the payment of a
special dividend of US$0.70 per share and plans to
restart the payment of ordinary dividends sooner than
expected.
In a similar vein the company has also upgraded guidance
for the full year, now expecting net operating profit to be
within the range of US$440m and US$450m. This is a
substantial increase on the previously guided range of
$US380m and US$420m.
James Hardie has a current market capitalisation of
$18.5b.
Megaport (ASX: MP1) Global cloud enabler Megaport reported an improved
half year 2021 result, across a range of operational and
financial metrics.
From a high level, group revenues grew by 39% to $36m
and normalised EBITDA improved by 15% to negative
$8.7m.
Following an initial capital intensive land grab, which
involved the rapid global expansion into physical data
centres across Asia-Pacific, the U.S. and Europe, the
group is now pivoting towards commercialising its vast
ecosystem network.
Products such as Megaport Cloud Router (MCR) and
Megaport Virtual Edge (MVE) are examples of this. Both
solutions are layered on the existing network at low
additional costs, driving incremental revenues at very
high margins. The group is now using this network
solution to extend to a much wider audience, by pivoting
the sourcing of its audience base from a direct sales
channel (in-house) to an indirect partnered model
through global organisations, including Cisco and
VMware.
The business is now at critical scale and on track for
earnings profitability. It is operating in an industry where
cloud service providers such as Microsoft, Google and
Amazon are recording exceptional results and enterprise
data centre players, such as Equinix and Digital Realty,
continue to expand.
However, within this ecosystem the company offers a
differentiated solution and perhaps more importantly,
has positioned itself as an independent player, servicing
all aspects of the cloud market from enterprise to cloud
service provider.
As a global leader in the field, the Megaport offering
provides optionality for customers to expand across 23
countries, 130 cities, 716 data centres and 220 cloud on-
ramps.
Megaport is led by a motivated and capable CEO in
Vincent English and an Innovation Committee comprised
of Founder Bevan Slattery and former Equinix Co-
founder Jay Adelson.
The company is in an enviable financial position, holding
net cash of $128m and expects to be EBITDA breakeven
on an exit run rate by the end of this financial year and
cash flow breakeven on an exit run rate in FY22.
Megaport has a current market capitalisation of $1.9b.
Nanosonics (ASX: NAN) In February, global leader in infection control solutions
Nanosonics reported its first half financial year results for
FY21. Under the leadership of CEO Michael Kavanagh,
Nanosonics is laying the foundations of a long duration
Selector High Conviction Equity Fund Quarterly Newsletter #71
26
business. This is underpinned by its focus on infection
control, the importance of which has become
increasingly apparent throughout the recent pandemic.
The company continues the rollout of trophon2, an
automated high-level disinfection (HLD) unit for
ultrasound probes, with the installed base now reaching
25,100 globally, up 12% over the prior corresponding
period (pcp).
Nanosonics’ revenue comes from both selling trophon
machines and the consumables required to operate a
disinfection cycle. Over the period, consumables and
services contributed $33.7m of revenue, 1% down on the
prior period.
While the result was flat, two distinct periods of
performance were evident: a weaker first quarter
impacted by reduced ultrasound volumes, as hospitals
focused on managing COVID-19 patients and a stronger
second quarter as demand returned, with the primary
distributor, GE Healthcare, recommencing purchases.
The same was also true for capital equipment, however
the bounce back in the second quarter was insufficient
to make up for the shortfall. For the half, capital
equipment sales accounted for $9.4m of revenue, 35%
down on the pcp.
While the recent pandemic has created short-term
complexities in placing units in hospitals, outbreaks of
this nature serve to highlight the importance of infection
control, which lays at the heart of Nanosonics’ offering.
The company believes that as hospitals progress past the
management of the current pandemic, the trophon
offering will become even more compelling. An increase
in enquiries globally is helping validate this hypothesis.
Nanosonics’ strategy to go “wide and deep” refers to its
efforts of not only extending the company's geographic
footprint, but also further penetrating within each
hospital setting.
In the U.S., the installed base sits at 22,120, compared to
an estimated 40,000-unit opportunity. Growing
awareness is expected to drive increasing adoption
across Europe while in the Asia Pacific region, the Japan
strategy continues to progress with five distribution
agreements now in place.
Entry plans into China is underway, whilst regulatory
approvals have been received for both Thailand and
Indonesia, with Malaysia underway.
With total revenue of $43.1m, down 11%, the group
delivered profit before tax of $0.2m, down from $6.7m.
The decline was a result of the impacts of COVID-19 on
revenue, ongoing investment in R&D and the
strengthening Australian dollar. Despite this, the
company's balance sheet remains robust with $88m in
cash and negligible debt, providing an ongoing
foundation for continued investment.
R&D spend has focused primarily on a new technology
platform, along with a solution for further digital
traceability and reporting, which have been under
development for the past few years.
At the last full year result, the company noted that
several opportunities for enhancement to the platform
had led to a delay in the finalisation of that project, which
is now expected in 2022.
Over the period, Nanosonics invested $7.6m in R&D,
representing 18% of total revenue.
While not providing specific guidance due to continued
uncertainty around COVID-19, CEO Michael Kavanagh
commented, “Based on current market improvements
the Company is anticipating ongoing growth in total
revenue and profitability into the second half, driven by
increasing installed base growth and increased usage of
consumables across all regions. With COVID-19
vaccination programs underway, the Company is
optimistic that overall market conditions, in particular
access to hospitals, are likely to continue to improve.”
Nanosonics has a current market capitalisation of $1.7b.
PolyNovo (ASX: PNV) Manufacturer of bio-resorbable polymer solutions,
PolyNovo reported a softer first half 2021 result. This was
largely a consequence of the second wave of COVID,
which disrupted its global sales momentum.
Total revenues increased by 24% to $12.6m, comprising
Novosorb Biodegradable Temporizing Matrix (BTM) sales
of $11.3m up 31.2% and BARDA revenue of $1.4m.
BTM sales were lumpy as a result of reduced hospital
access and elective surgeries. Strong BTM revenue
growth of 75% in the first quarter was offset by the

Selector Funds Management
27
weaker months of October and November, coinciding
with COVID infection rates increasing across the U.S. and
Europe. The first quarter is a better indication of the
growth rates the company is experiencing during normal
operating conditions.
Despite the disruptions, management has maintained its
rollout strategy across multiple markets. PolyNovo
received approvals to enter 10 new countries across Asia
and Europe during the period, with distributors
appointed in these markets.
Of existing regions, PolyNovo is expanding into new
hospitals and territories. In the U.S., 22 new customer
accounts were added, while two U.S. Group Purchasing
Organisations (GPO) and an Integrated Delivery Network
(IDN) were signed.
The GPO and IDN partnerships represent a significant
milestone, as they broaden PolyNovo's access to
hundreds of additional healthcare providers. In Europe,
30 new accounts were signed, with a further 30
evaluations under progress.
In March, PolyNovo announced the execution of its third
U.S. GPO. The company has partnered with Premier Inc,
a major U.S. GPO, to allow Premier member hospitals to
access BTM on special pricing and terms.
Managing Director Paul Brennan explained, “This signing
with Premier, the second largest GPO in the US, is a major
milestone... GPO agreements put our disruptive BTM on
a much larger list of hospitals than our sales team can get
around in the short-term. We will continue expanding our
sales team into new markets to support hospitals and
surgeons but now also to match the geographical
footprint of the GPOs. We look forward to demonstrating
improved health economic benefits for Premier hospital
members and their patients”.
Premier services roughly 4,100 health facilities and
hospital members. Of particular interest to PolyNovo are
the more than 2,000 acute care facilities of which 100 are
designated as trauma centres.
The operational scope and capability at PolyNovo have
clearly grown, only made more apparent through the
growing employee headcount, sitting at 91 compared to
70 in the prior comparative period.
The current focus is on BTM, which has a significant
opportunity to disrupt the wound management market
as an organic, fully resorbable alternative to the
incumbent animal derived applications. This market has
lacked innovation and is ripe for disruption from a
differentiated product with clear regenerative benefits
like BTM.
Beyond BTM, PolyNovo is seeking to leverage its
patented NovoSorb bio-resorbable polymer technology
across alternative applications, including hernia, breast,
muscle repair and diabetes to name a few.
The company has recently brought R&D in-house to
accelerate the development of these products. Hernia is
a near term opportunity, with the factory build and
commissioning of equipment progressing towards
potential product launches across markets in FY22.
As PolyNovo broadens its product portfolio through its
differentiated NovoSorb technology, the use of existing
resources should lead to faster ramp ups and scale
benefits.
CEO Paul Brennan has led PolyNovo's global expansion
efforts in a conservative manner, choosing to reinvest
cash flows while steadily ramping up the sales and
marketing team. Management is confident in its ability
to grow the business using existing cash flows, having
last raised capital in 2017.
PolyNovo currently generates gross margins above 90%,
which reflects the operating leverage potential within
the business.
PolyNovo has a market capitalisation of $1.9b and is in a
net cash position.
REA Group (ASX: REA) Digital real estate advertiser REA Group delivered a
robust half year 2021 result. The company benefited
from an improvement in listing volumes off the back of
higher consumer confidence, propelled by record low
interest rates and increased lending from banks.
This saw the group deliver a modest 2% dip in revenues
to $430.4m, while operating profits increased by 9% to
$290.2m.
Although the macroeconomic picture is positive and
does provide a tailwind, the real value proposition lies in
REA Group's widening audience metrics against its
nearest competitor, Domain Holdings. During the half,
REA Group recorded total average monthly visits of

Selector High Conviction Equity Fund Quarterly Newsletter #71
28
115m, 3.2 times that of Domain's and a unique average
monthly audience of 12.3m, representing some 60% of
the adult population. With these comparative audience
metrics, it is little wonder why it is a popular choice
across the board, from agents to home sellers and home
buyers.
REA Group has leveraged this dominant position by
introducing innovative, value-add (depth) products for
an additional cost. An example is Premiere Listing, which
provides greater ad exposure and has enabled the
company to grow revenues regardless of listing volumes.
Depth penetration and pricing is expected to rise, as the
cost for these products are still only a fraction of a sellers’
actual spend. Management continues to innovate in this
space and REA are also targeting other value-add
products across rent, data and agent match to maintain
its strong growth trajectory.
The domestic business is highly scalable, operating at
67% EBITDA margins. The group is seeking to replicate
this success in other international markets. To date REA
Group has achieved mixed success in investments across
Asia, India and the U.S. However, the increasing
structural shift to digital is translating abroad.
On that note, two important callouts are:
1. News Corporation’s majority owned U.S. based
realty group Move Inc, which REA has a 20%
ownership stake in, reached profitability and
contributed a $9.4m operating profit to the group
during the half.
2. The company took a controlling interest in Elara
Technologies, the leading online real estate
advertiser in India, increasing its stake from 13.5% to
59.65%, with a total expected payment in the range
of US$50m-US$70m.
In March, the company announced the proposed
acquisition of the ASX listed Mortgage Choice (ASX:MOC)
group, a leading Australian mortgage broking business.
Operating through more than 500 brokers and 370
franchises, Mortgage Choice has a current loan book of
$54b and settled $11b worth of loans during 2020.
The acquisition aligns with REA's financial services
strategy as it leverages the company’s digital expertise,
access to its existing property seeker audience and
unique data insights. Importantly it leverages REA's leads
and provides increased choice in property finance.
The combination of Smartline, REA's existing broker
business and Mortgage Choice will deliver increased
scale via a national footprint which is complimentary.
Scale matters in all financial services businesses. This
transaction will see REA move from 2% of mortgage
application submissions to 5%-6% nationally. This gives
REA a larger seat at the table with banks to negotiate
better rates and faster application processing times.
For first half FY21, Mortgage Choice reported revenue of
$22.2m and net profit after tax of $4.2m. The proposed
transaction is expected to be immediately EPS accretive
for the group. Synergies will come from technology
spend, regulatory spend and costs associated with public
company overheads. These will be meaningful in relation
to the Mortgage Choice bottom line.
The full cash offer of $1.95 per share, confers an
enterprise value of $244m, representing a 66% premium
to the Mortgage Choice pre offer share price. The deal
will be debt funded, utilising REA’s existing facilities.
While the deal remains subject to court and shareholder
approval, the board of Mortgage Choice have
unanimously recommended shareholders vote in favour
of the scheme of arrangement.
At the half year the company declared an interim
dividend of 59c per share, representing a payout ratio of
approximately 45%.
REA Group has a market capitalisation of $19.4b and net
debt of $60m.
Reece (ASX: REH) Leading plumbing group Reece delivered a robust first
half result, lifting group revenues by 4% to $3.1b and
normalised operating earnings (EBITDA) by 12% to
$349m. Australia and New Zealand (ANZ) and the U.S.
both performed well, with revenues in each region rising
by 7% in constant currency.
ANZ continues to deliver standout EBITDA margins,
growing 0.80% to 15% for the period. The business
remains a clear market leader across many real-world
metrics. This is neatly evidenced by an employee
engagement score of 82, some eight points above the
industry benchmark.

Selector Funds Management
29
Another noteworthy mention is the group’s proven
capabilities in the digital world, delivering a 70% increase
in online sales in the period. The Reece digital journey
has been 10 years in the making and continues at pace.
The complete roll out of Field Pulse, a digital suite of
administration tools that assist a “tradie” run his or her
business, is evidence of this.
Investment in this ongoing digital transformation will
continue at the expense of margin expansion, which we
expect will moderate as a consequence.
Reece is seeking to translate this success to the U.S.
operations over time. Data driven insights will prevail
here rather than an institutional imperative for growth.
The prize is clear, with the U.S. currently generating
around half the EBITDA margins of ANZ.
While the competitive landscape differs significantly,
there is vast opportunity for growth:
• The business’ cultural base will increase through
training, mentoring and recruitment programs. In
turn improving operating efficiencies and the all-
important customer service and experience levels.
• A fit for purpose eCommerce platform will be
introduced, in addition to new shop formats and a
store rollout program.
• Acquisitions, which are heavily sought after at
present will play a role, with the company noting
there are “plenty of Todd Pipe equivalents out there”.
None of these opportunities will be realised overnight.
The journey is for the rightful owner, the patient long-
term shareholder.
CEO Peter Wilson explains the U.S. strategic rationale
well, “I've been saying this since we did the acquisition
nearly three years ago, this is a very long-term play for
us. We call this a 20 year story and we've bought a
platform in the Sunbelt and we are over the next number
of years looking to build capabilities in lots of different
areas including stores, people, digital supply chains. So
we are balancing how we build that and it's a long-term
journey.”
CEO Wilson also noted the resilience of the business
model, only made more apparent during the COVID
period, and the strength of the leadership teams now
firmly in place in both Australia and the U.S.
It is worth noting here, with a view to long-term real
earnings per share (EPS) growth, that our stock selection
process seeks to identify management teams who think
and act like owners and are willing to invest for the long-
term.
The benefits of scale, which are not achieved overnight,
are testament to these characteristics. The Reece
management team embodies this, having effectively
grown the business since 1969 while not selling a single
share.
The pre-emptive and decisive $642m capital raising in
April 2020 has reduced net debt to $611m. This is under
1x net debt to EBITDA when leases are excluded,
providing management with ample operational flexibility
during these uncertain times.
Reece has a market capitalisation of $11.6b.
ResMed (ASX: RMD) The global pandemic has been an accelerant for change
across various industries, and health care has no doubt
been recognised as a sector ripe for disruption given the
inefficiencies that exist within.
In particular, the areas of digital health, out-of-hospital
care and data analytics have seen positive momentum,
all of which benefit ResMed.
However, this has not always been the case. ResMed
marked its push into the digital space with the US$800m
acquisition of Brightree in 2016, pivoting the company
away from being just a pure manufacturer of medical
products into a software-led company.
The investment, which was recognised as speculative at
the time, has not only led to the integration of cloud
technology in ResMed's devices, known as AirView
Solutions, but also assisted home medical equipment
providers, predominantly in the U.S., transition their
operations online.
By offering an end-to-end digital ecosystem, physicians
and the company can leverage technology, big data and
advanced analytics to improve the outcomes for
patients, while also lowering health care costs for private
payers.
With 13.5m cloud connectable devices, 15m patients on
AirView Solutions and importantly, 8 billion nights of
respiratory medical data in the cloud, ResMed has shown
an ability to scale its technology to support the growth
across its ecosystem.
In another quarter impacted by COVID-19 induced
lockdowns, ResMed recorded high single digit growth,
Selector High Conviction Equity Fund Quarterly Newsletter #71
30
with group revenues up 7% constant currency (cc) to
US$800m and net income up 12% to US$179.5m.
Notably, the company delivered these results with
negligible tailwinds from COVID related ventilator sales
and a benign but improving sleep apnea diagnosis
environment, which has recovered to 70-90% of pre-
COVID levels.
The resilient growth has been underpinned by ResMed's
re-supply program, a by-product of the investments
made across digital solutions, as outlined above.
Despite lower diagnosis levels, Global Devices grew by
5% cc to US$393m, highlighting the greater contribution
of device re-supply sales from existing patients. Global
Masks and other revenue also increased by 9% cc to
US$315.2m, and now represents 45% of total sleep and
respiratory care revenue.
CEO Michael Farrell noted a “modest improvement in
adherence and really good improvement in mask
resupplies”.
From a patient perspective, CEO Farrell explains the
simplicity of the automated re-supply process.
“When they get a text response or an app click and a
chance to say, yes, I want that new mask, I want that new
tubing, I want that humidifier. They're clicking it at much
higher rates and getting closer to, frankly, what they
should have always done, which is keeping respiratory
hygiene at top of mind.”
While other non-essential health care providers may
have struggled, the company’s quick adoption of digital
solutions during COVID has helped drive growth. With
the foundations now in place, CEO Farrell believes this
marks a “permanent shift in the adoption curve for their
broad range of digital solutions.”
The company remains committed to research and
development (R&D) and has increased investments in
digital health technology, as well as hardware, software
and clinical research. R&D spend increased by 10% to
US$55m for the quarter and sits at 7% of group revenues.
Importantly, penetration remains low across a global
opportunity of 936m sleep apnea sufferers, 380m
chronic obstructive pulmonary disease sufferers (COPD)
and over 340m people living with asthma.
To that end, ResMed CEO Farrell reiterated three key
operating priorities, “a, to grow and differentiate our
sleep apnea, COPD and asthma businesses; b, to design,
develop and deliver world-leading medical devices and
digital health solutions; and c, to innovate and grow the
world's best software solutions for care delivered away
from the hospital.”
Financially, ResMed is highly cash generative and
operates a conservative balance sheet. During the
quarter, the company reduced its net debt position to
US$570m.
In terms of capital allocation CFO Brett Sandercock
notes, “our solid cash flow and liquidity provide flexibility
in how we allocate capital. We have focused on paying
down debt as well as ensuring we have cash reserves to
support the company through the uncertainty caused by
the ongoing pandemic. Going forward, we plan to
continue to reinvest for growth through R&D. We will
also likely deploy capital for tuck-in acquisitions, such as
Snap, which was completed during the third quarter of
fiscal year 2020.”
We are more than willing to back this management
team, who have a proven track record of making positive
capital allocation decisions for the long-term success of
the business.
The company declared a quarterly dividend of US39c per
share.
ResMed has a market capitalisation of US$28.5b. SFM
Selector Funds Management
31
BLACK BOX THINKING – BOOK REVIEW
To stay ahead of the competition, is it about the big
picture or the finer details?
“The simple answer, however, is that it has to be both. At
the level of the system and, increasingly, at the level of
the organisation, success is about developing the
capacity to think big and small, to be both imaginative
and disciplined, to immerse oneself in the minutiae of a
problem and to stand beyond it in order to glimpse the
wider vista.”
In his book Black Box Thinking, author Matthew Syed
outlines what separates the great businesses from the
average and how “..the deepest and most overlooked
truth is that innovation cannot happen without failure.
Indeed, aversion to failure is the single largest obstacle to
creative change.”
Most of us often look at the end result of someone’s
endeavour to judge success. The assumption that things
just happened, when in fact what is often required are
dramatic leaps, followed by a series of small steps.
One of the most inspiring examples is that of James
Dyson, the inventor of the Dyson vacuum cleaner. As
Syed writes in the chapter “How failure drives
innovation”, Dyson’s creativity was in many ways a
response to a problem, driven by frustration rather than
a stroke of genius.
“People think of creativity as a mystical process. The idea
is that creative insights emerge from the ether, through
pure contemplation. This model conceived of innovation
as something that happens to people, normally geniuses.
But this could not be more wrong. Creativity is something
that has to be worked at, and it has specific
characteristics. Unless we understand how it happens,
we will not improve our creativity, as a society or as a
world.”
Dyson soon discovered the problem was the bag not the
suction, but it took a curious mindset to throw away the
bag and reinvent the vacuum cleaner. He tried and failed,
triggering new learnings, before trying and failing again,
until slowly the design improved.
“Dyson was not the first to come up with the idea of a
cyclone vacuum cleaner. He was not even the second, or
the third. But he was the only one with the stamina to fail
his concept into a workable solution. And he had the
rigour to create an efficient manufacturing process, so he
could sell a consistent product. His competitors
confronted the same problem and had the same insight.
But they didn’t have the same resilience to make their
idea work, let alone take it on to a working production
line.”
“James Dyson worked his way through 5,127 prototypes,
while his competitors didn’t get through the first 100, not
because he was more intelligent, but because he was
more resilient.”
As Dyson himself noted, “The creative leap may have
been a crucial and a precious thing, but it was only the
start of the creative process. The real hard yards were
done patiently evolving the design via bottom-up
iteration” because “The original idea is only 2 per cent of
the journey. You mustn’t neglect the rest.”
Marginal gains Those marginal gains build over time and create an
enormous barrier for others to jump. As the book notes,
“Trial and error, failure, marginal gains based
on feedback. Syed shows that these are the things
that actually create progress and improvement. He
debunks the myth that great leaps forward come solely
from a single creative spark. Instead they are a
combination of slow, grinding, evolutionary progress, in
combination with the received wisdom of previous
generations.”
The example of the Mercedes Formula One team is an
astonishing application of marginal gains and where
attention to detail is staggering.
As technical leader of the Mercedes F1 Team Paddy Lowe
notes, “When I first started F1, we recorded eight
channels of data. Now we have 16,000 from every single
parameter on the car. And we derive another 50,000
channels from that data.”
Drilling deeper the real action lies in the pit stops, “The
secret to modern F1 is not really to do with big ticket
items; it is about hundreds of thousands of small items,
optimised to the nth degree. People think that things like
engines are based upon high level strategic decisions, but
they are not. What is an engine except many iterations of

Selector High Conviction Equity Fund Quarterly Newsletter #71
32
small components? You start with a sensible design, but
it is the iterative process that guides you to the best
dilution. Success is about creating the most effective
optimisation loop.”
“We make sure we know where we are going wrong, so
we can get things right.”
In summary, it is about breaking down a big problem into
small parts in order to rigorously establish what works
and what doesn’t and knowing how to improve on that.
As author Matthew Syed highlights, it is also an approach
that the aviation industry has fully embraced. The
indestructible 'black box' fitted to all commercial aircraft
contains the flight data that allows investigators to best
determine what went wrong.
It is not perfect but reflects a forensic approach to
identify the reason for the accident, establish new
procedures and introduce necessary changes
immediately so the same air crash never happens again.
Importantly, the aviation industry releases its findings
publicly to promote openness and accountability.
Looking beyond the name, the price-to-earnings ratio, the yield. Once you realise how important the task of getting to the
front is, or even staying there, an investor’s focus quickly
shifts to other matters. Jim Collins, an American
researcher and author of many bestselling books,
including Good to Great, has spent a lifetime on
researching what separates the few great companies
from the host of good ones.
“Winners require innovation and discipline, the
imagination to see the big picture and the focus to
perceive the very small. The great task, rarely achieved is
to blend creative intensity with relentless discipline so as
to amplify the creativity rather than destroy it. When you
marry operating excellence with innovation you multiply
the value of your creativity.”
This combination of operating excellence and innovation
is a tough act. However, those that are prepared to
sacrifice short-term profits, have the temperament to
fail in order to learn, and relentlessly work on extracting
those marginal gains over the long run, have a chance to
create something special.
Reporting season offers an opportunity to look beyond
the raw numbers and consider more deeply whether a
company has the necessary application to shift from
good to great. With this in mind, we highlight below
three investments that remain core to our portfolio.
Cochlear When the world’s leading cochlear implant company
presented its first half result in February, it was not the
profit numbers that stood out, even though they were
incredibly strong during a COVID impacted half, but
rather slide 21 in the appendix section of its presentation
pack.
Shown below in Figure 1, the company’s history of
innovation was on full display, denoted by the year of
product release. This is a powerful illustration of
technology step change as well as eking out those all-
important marginal gains.

Selector Funds Management
33
Figure 1: Innovation pathway
Source: Cochlear Half Year 2021 Results Presentation
Figure 2: Investment pathway
Source: Cochlear Half Year 2021 Results Presentation
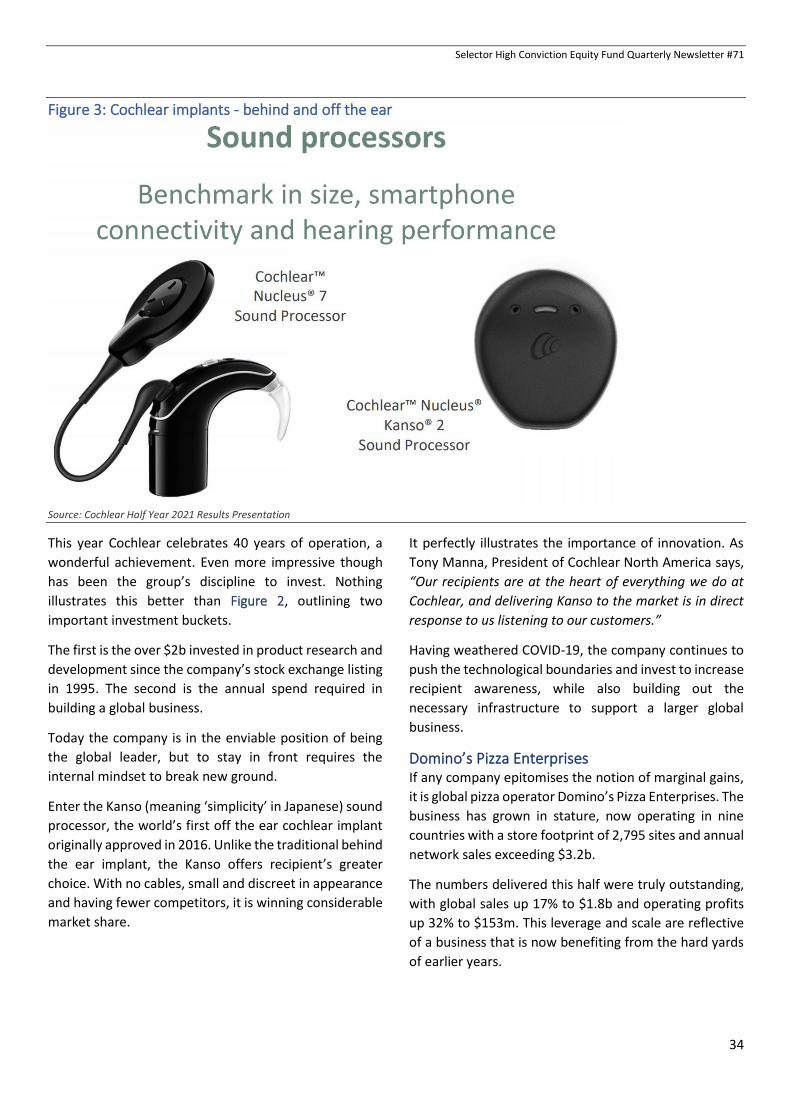
Selector High Conviction Equity Fund Quarterly Newsletter #71
34
Figure 3: Cochlear implants - behind and off the ear
Source: Cochlear Half Year 2021 Results Presentation
This year Cochlear celebrates 40 years of operation, a
wonderful achievement. Even more impressive though
has been the group’s discipline to invest. Nothing
illustrates this better than Figure 2, outlining two
important investment buckets.
The first is the over $2b invested in product research and
development since the company’s stock exchange listing
in 1995. The second is the annual spend required in
building a global business.
Today the company is in the enviable position of being
the global leader, but to stay in front requires the
internal mindset to break new ground.
Enter the Kanso (meaning ‘simplicity’ in Japanese) sound
processor, the world’s first off the ear cochlear implant
originally approved in 2016. Unlike the traditional behind
the ear implant, the Kanso offers recipient’s greater
choice. With no cables, small and discreet in appearance
and having fewer competitors, it is winning considerable
market share.
It perfectly illustrates the importance of innovation. As
Tony Manna, President of Cochlear North America says,
“Our recipients are at the heart of everything we do at
Cochlear, and delivering Kanso to the market is in direct
response to us listening to our customers.”
Having weathered COVID-19, the company continues to
push the technological boundaries and invest to increase
recipient awareness, while also building out the
necessary infrastructure to support a larger global
business.
Domino’s Pizza Enterprises If any company epitomises the notion of marginal gains,
it is global pizza operator Domino’s Pizza Enterprises. The
business has grown in stature, now operating in nine
countries with a store footprint of 2,795 sites and annual
network sales exceeding $3.2b.
The numbers delivered this half were truly outstanding,
with global sales up 17% to $1.8b and operating profits
up 32% to $153m. This leverage and scale are reflective
of a business that is now benefiting from the hard yards
of earlier years.

Selector Funds Management
35
Figure 4: Japan – Dashboard
Source: Domino’s Pizza Enterprises Half Year 2021 Results Presentation
Expanding to new territories, including the likes of
France, Japan and Germany, does not happen without a
disciplined, committed and experienced management
team. Add to this, the business of selling pizza the
Domino’s way is not for the faint hearted. It requires a
franchisee base that embraces operational excellence
and a high volume mentality mindset.
A case in point is Japan, a market that the company first
entered in 2013 through a joint venture arrangement.
Under the leadership of Josh Kilimnik, Japan’s
transformation has been exceptional. Rather than
accepting the status quo and taking a blanket approach,
Kilimnik and the management team revisited what had
worked in other markets and more importantly, how the
Japanese model differed. It really came down to
“challenging the standard stuff” and improving the value
offer until it was right.
It was not rocket science, but it did require a bottom-up
data driven understanding of the local market and the
brand’s proven business formula, gleaned over decades
of operation.
The results, as shown in Figure 4, speak for themselves.
Looking at the progressive half year results from 2016 to
now, it is clear the early years reflect little top line or
store count growth. Yet small gains over a period have
helped create the right formula and the business is now
growing rapidly.
For the half, the Japan market saw a 36% gain in network
sales and 68 new stores opened during the period. The
store count now sits at 742, a big leap from the 432 in
2016. Long-term the company has called out 1,500, but
even this we suspect will prove to be conservative based
on an addressable market that now extends throughout
Japan.
These learnings and the resulting cross pollinations of
ideas are shared amongst all the executives, so that each
region can benefit. It is a core advantage that the
company is prepared to exploit, along with the
opportunity to expand into newer markets.
So, what does Domino’s look like in ten years’ time?
Probably significantly bigger, more profitable and a
geographically larger version of its current self, with a
laser focus on pizza as its core market.

Selector High Conviction Equity Fund Quarterly Newsletter #71
36
Graph 3: U.S. net sales and operating margins track record
Source: James Hardie Industries Q2 2020 Presentation Material
James Hardie Industries We may surprise investors by including a manufacturer
of building materials to our company profiles, but it is
here on merit.
Prior to the appointment of CEO Jack Truong in 2019, the
business was a good but inconsistent performer. Having
established itself in Australia, the company entered the
U.S. market in the 1990s, starting from scratch in selling
its fibre cement siding products.
The U.S. market thus became its clear focus, despite
having a very good local position. It is a credit to previous
management that the company has overcome asbestos
litigation, whilst building a 90% U.S. fibre cement market
share within the overall building materials segment.
Jack Truong is now intent on building on this solid
foundation, one that is underpinned by a strong product
proposition and protected by core intellectual property.
To help set the business up for success though, a few
gaps in its offering, from manufacturing right through to
customer delivery, required greater rigour.
The first big move was the introduction of the Hardie
Manufacturing Operating System (HMOS) in 2019, which
provides management and plant operators
manufacturing visibility.
At its core, HMOS works to standardise processes and
replicate best practices globally. This paved the way for
establishment of LEAN manufacturing principles, which
to-date has driven consistent operating performance
with excellent financial outcomes.
During this formative period, its go-to-market strategy
also came under review, with the company moving away
from its well known pull approach, to a broader push-pull
strategy.
Educating the builders (pull) was always a brand building
approach that drove awareness and demand. But as
Truong rightly identified, the company’s true customer is
the dealer groups, those that sell the product. Combining
the two is an illustration of re-examining, enhancing and
incorporating change that can be built upon. Graph 3
highlights quarterly net sales and operating margins

Selector Funds Management
37
since 2011. The introduction of LEAN in 2019, whilst still
early days, is beginning to bear fruit.
The third important piece added was a focus on
innovation. The company achieved its number one
position by developing a product solution that was
superior to alternatives. Whilst this remains the case, it
has failed to build upon this. Internally, it now sits as a
high priority and the first glimpses of new offerings are
expected to be unveiled during 2021.
Early days yes, but there is a purpose and belief within to
build a world class organisation, or as CEO Truong
describes it, “our strategic transformation from a big,
small company to a small, big company.”
Based on the company’s performance to-date, the signs
are good. Revenues and profits are up, margins are
strong, and reinvestment is underway. The conservative
balance sheet position illustrates the progress made,
with substantial debt repaid following the company's
US$559m 2017 purchase of German based building
materials group Fermacell.
You should never get too carried away with short-term
success, but there is much to like and admire in the way
James Hardie has defined a long run path.
Final comment Black Box Thinking is illustrative of what can be achieved
when failure is accepted as an integral part of the
process. As Dyson points out, “We do not want to know
how to apply the rules; we want to break the rules. We
do that by failing - and learning.”
The learning part is the key; it is the enabler that
encourages action when there is no end point in sight.
Investors would do well to focus less on the here and
now and more on the horizon. If Cochlear management
had really known what was involved and the capital
required so many years ago, they may never have
started.
To that end the truly great businesses do not take short
cuts, they invest up front and continue to do so even
when it comes at a great cost to profits.
Matthew Syed sums it up nicely when he says we forget
or fail to appreciate that progress is often a “combination
of slow, grinding, evolutionary progress, in combination
with the received wisdom of previous generations.” SFM

Selector High Conviction Equity Fund Quarterly Newsletter #71
38
CHINA’S ROADMAP – SCIENCE AND TECHNOLOGY
In March 2021, the Chinese government unveiled its
14th five-year plan. If you count back, the first five-year
plan was announced in 1953 covering the period up to
1957. It was also just after the Chinese Communist Party
(CCP) took control of the country in 1949.
Under the leadership of Chairman Mao Zedong, the CCP
prioritised economic development, focusing on urban
and industrial infrastructure projects.
A nation that lacked infrastructure and economic
wellbeing required a roadmap. At the time, the country’s
climbing birth rate, alongside a population approaching
600m, dictated a focus on production to meet economic
and social demands.
Like all plans the goals were ambitious and the outcomes
not always known.
By the end of 1957 China had delivered some impressive
outcomes:
• Industrial output doubled, driven by an annual
growth rate of 16%.
• Steel production, its main focus, grew from
1.3m tonnes to 5.2m. Coal and petrochemicals
also saw growth.
• The urban population increased from 57m to
100m.
• Life expectancy grew from 38 years to 57 years.
• Urban incomes improved by 40%.
According to Chairman Mao such improvements had
merit, “If China becomes prosperous, just like the
standard of living in the Western world then (people) will
not want a revolution.”
The current five-year plan, which was approved on 11
March, will commence this year and run until 2025. The
country also outlined long range objectives through the
year 2035, marking only its second time setting a 15-year
plan.
The plan acts as a reinforcement of the strong signal sent
to Chinese industry to move away from fossil fuels. The
country is referenced as being the world’s largest emitter
of planet heating gases, responsible for about 28% of
total global emissions.
President Xi Jinping is pushing China towards green
technology and has committed to reach peak emissions
by 2030 and carbon neutrality by 2060.
Perhaps the biggest shift will be a ramp up in green
technology investment, covering the build out of one of
the world’s largest networks of electric vehicle charging
stations, the rise of battery storage and the rollout of
wind and solar farms in remote areas of western China,
to power cities down its more populated east coast.
Breaking from tradition, no formal GDP growth rate was
set, replaced instead by other specific targets. This
includes the urban unemployment rate and annual
research and development (R&D) spend, highlighted in
Figure 5.

Selector Funds Management
39
Figure 5: Key elements of China's five-year plan
Source: Government Work Report 2021
Importantly, the shift in emphasis towards R&D spending
signals the country’s push for greater self-reliance in
areas including technology and science. These
endeavours cover artificial intelligence, clinical medicine
and genomic research, all of which require greater
collaboration with industry and business.
While the country is committed to lifting its current R&D
spend of US$600b (see Graph 4) by more than 7%
annually, a greater portion of this spend will be directed
towards basic research. Following the U.S.-China conflict,
the country is also lagging in the field of semiconductor
manufacturing, a critical component of President Xi
Jinping’s “made in China 2025” ambitions.
This has hastened the need for closer links between the
research community and industry, in order to deliver real
world applications. In a lesson to our own government,
the plan will involve tax cut incentives for the private
sector to invest in more basic research driven science.
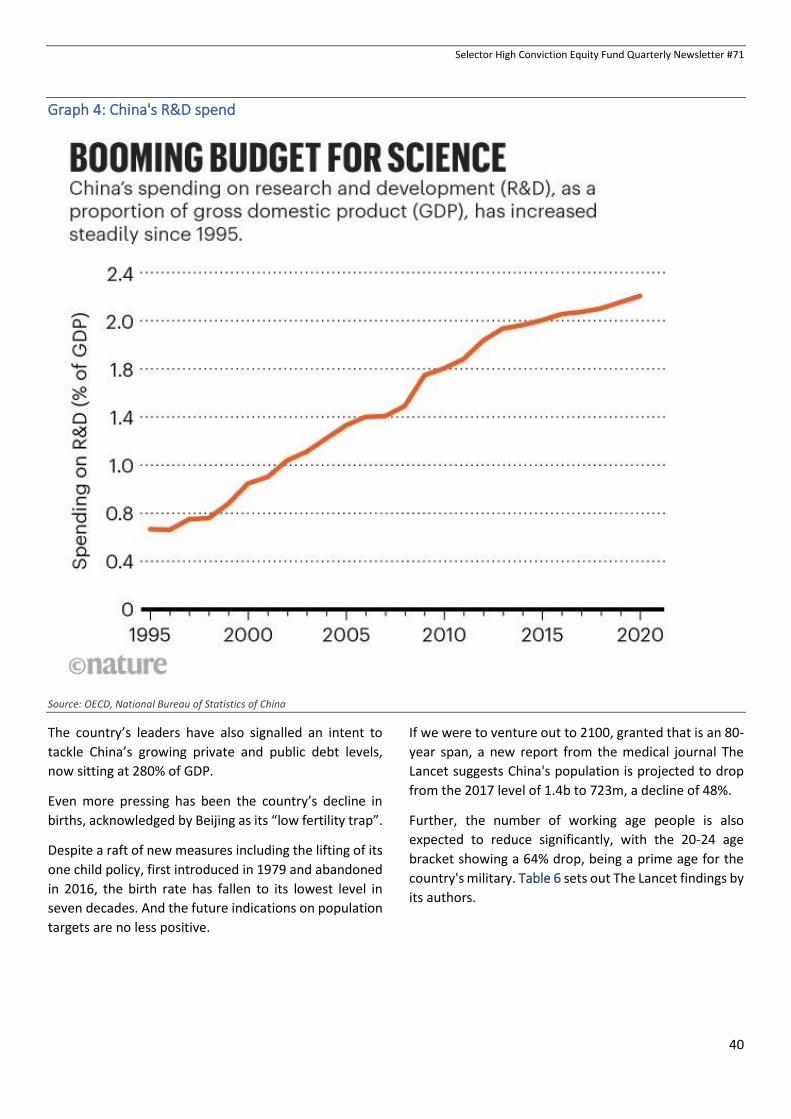
Selector High Conviction Equity Fund Quarterly Newsletter #71
40
Graph 4: China's R&D spend
Source: OECD, National Bureau of Statistics of China
The country’s leaders have also signalled an intent to
tackle China’s growing private and public debt levels,
now sitting at 280% of GDP.
Even more pressing has been the country’s decline in
births, acknowledged by Beijing as its “low fertility trap”.
Despite a raft of new measures including the lifting of its
one child policy, first introduced in 1979 and abandoned
in 2016, the birth rate has fallen to its lowest level in
seven decades. And the future indications on population
targets are no less positive.
If we were to venture out to 2100, granted that is an 80-
year span, a new report from the medical journal The
Lancet suggests China's population is projected to drop
from the 2017 level of 1.4b to 723m, a decline of 48%.
Further, the number of working age people is also
expected to reduce significantly, with the 20-24 age
bracket showing a 64% drop, being a prime age for the
country's military. Table 6 sets out The Lancet findings by
its authors.
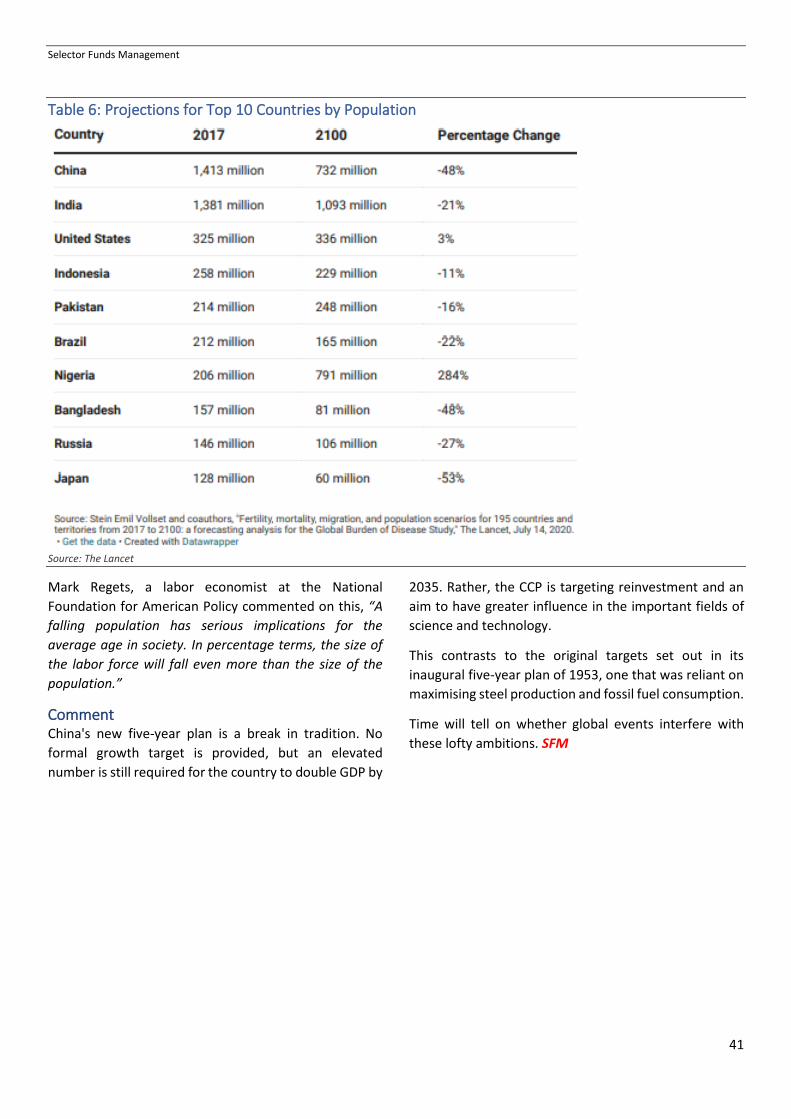
Selector Funds Management
41
Table 6: Projections for Top 10 Countries by Population
Source: The Lancet
Mark Regets, a labor economist at the National
Foundation for American Policy commented on this, “A
falling population has serious implications for the
average age in society. In percentage terms, the size of
the labor force will fall even more than the size of the
population.”
Comment China's new five-year plan is a break in tradition. No
formal growth target is provided, but an elevated
number is still required for the country to double GDP by
2035. Rather, the CCP is targeting reinvestment and an
aim to have greater influence in the important fields of
science and technology.
This contrasts to the original targets set out in its
inaugural five-year plan of 1953, one that was reliant on
maximising steel production and fossil fuel consumption.
Time will tell on whether global events interfere with
these lofty ambitions. SFM

Selector High Conviction Equity Fund Quarterly Newsletter #71
42
REMUNERATION AND WHY WE VOTE THE WAY WE DO
The chart we posted on our cover page this quarter was
an eye opener for us, yet maybe it should not have been.
We do not invest directly in U.S. listed equities, but our
portfolio generates increasing earnings from the U.S. The
chart, which shows a surge in median pay for S&P 500
CEOs in 2020, appeared in the Wall Street Journal (WSJ)
accompanied by the following comments.
“At Norwegian Cruise Line Holdings Ltd.— which
recorded a $4 billion loss last year after sailings
stopped and revenue fell 80%—CEO Frank Del Rio’s pay
doubled to $36.4 million, in part with bonuses tied to a
three-year contract extension, according to the
company’s proxy.
‘We believe these changes were in the best interests of
the company and secured Mr. Del Rio’s continued
invaluable expertise,’ the spokesman said. ‘Our
management team took quick, decisive action to reduce
costs, conserve cash, raise capital’ and is executing a plan
to relaunch its ships.”
In 2019, Norwegian Cruise Line generated record
adjusted earnings per share based on net income of
US$930m. In contrast, Aristocrat Leisure (ALL) reported
net profit after tax and amortisation (NPATA) of
AUD$887m.
Needless to say, this is not a like-for-like comparison by
any means. Nor is Aristocrat’s CEO Trevor Croker’s 2020
total remuneration of AUD$4.5m, including base, short-
term incentive (STI) and long-term incentive (LTI) (2019
AUD$5.6m). In fact, CEO Croker is not even inching close
to the lowest median remuneration on the chart, dating
as far back as 2011.
It is an important comparison to make, however, as CEO
Croker and CFO Julie Cameron Doe are both based full
time in the U.S. As are five other CEOs of businesses we
own, not to mention the U.S. country heads running
business units that are major earnings contributors.
Today, nearly all CEOs are appointed after an “exhaustive
global talent search”. In short, Australian companies are
competing for global talent, either directly or indirectly,
in the same pool represented in the chart. It would not
be a big stretch to suggest that all top C suite executives
based in Australia also cast an eye across the Atlantic
when evaluating remuneration opportunities.
In its 2020 remuneration report Aristocrat stated,
“Aristocrat’s senior leadership is predominantly US
based, and the business must increasingly attract and
retain leaders in US and other markets with technology
and global management skillsets. US market practice (in
particular) places a greater emphasis on at-risk
opportunity, and significant equity grants are more
commonly used for talent attraction and retention (than
in Australia).
The continued expansion of Aristocrat’s digital business,
which now contributes over half of Group revenue,
reinforces the need for Aristocrat’s remuneration
structures to evolve and take into account global pay
philosophies, particularly those in the technology
industry.”
These comments are unlikely to surprise many.
Something lesser known is the blank cheque warfare
undertaken by Scientific Games Corp (SGMS market
capitalisation US$4.1b) and now chaired by former
Aristocrat CEO Jamie Odell. Jamie Odell no doubt has a
strong understanding of both the talent and pay scales
within Aristocrat’s ranks.
In the People & Culture Committee Chair’s Letter,
Kathleen Conlon lays down some home truths.
“In addition, we have continued to see an intensifying
war for talent over the past 12-18 months, with
competitors (and the U.S. market in general) offering
higher STI opportunities and LTI grants at a quantum of
2 to 3 times fixed remuneration, further reinforced by the
fact that in many instances these grants are unhurdled.
Your Board’s view is that it is imperative for shareholders
that Aristocrat secure and attract the critical leadership
it requires to fully execute its medium-term growth
strategy. In the context of a competitive talent
environment where there is a “live” retention risk, the
Board has taken a number of proactive steps. Specifically,
the Board has reworked the at-risk ratios, adjusted fixed
remuneration where it is out of benchmark and provided
special equity grants to address the near-term
substantial gaps in our offer. These special equity grants

Selector Funds Management
43
apply only to senior executives and not to the CEO and
Managing Director. We have put robust strategic hurdles
against these special equity grants (which the Board will
continually test) in order to ensure they are aligned with
shareholder interests and deliver sustainable benefits.”
At the back end of this newsletter, we share our 2021
Voting policy outlining how we vote. This policy is closely
tied to our corporate engagement program, designed to
provide us with cultural insights, an understanding of
management contribution and continuity, along with
access to board and committee members.
Our voting, like our stock selection (bottom-up), is driven
by the individual circumstances and requirements of
each business. We are seeking to achieve strong long-
term outcomes.
Each business differs, as does the CEO’s remuneration.
We have long backed equity alignment in this regard. At
Flight Centre, CEO Graham Turner earned total
remuneration of AUD$675,000 in 2019 and
AUD$600,000 in 2020. This reflects the founder
mentality he has adopted. Important to note here is all
Turner’s direct reports earn more than he does.
CEO Turner, we suspect, would no more than grunt at
Del Rio’s lofty ticket. We do not think he is a flight risk.
SFM

Selector High Conviction Equity Fund Quarterly Newsletter #71
44
ENVIRONMENTAL, SOCIAL AND GOVERNANCE, ESG POLICY 2021
Digital references Carbon Neutral: https://carbonneutral.com.au/yarra-yarra-biodiversity-corridor/
TCFD Task Force on Climate – Related Financial Disclosure: https://www.fsb-tcfd.org/
Gold Standard: https://www.goldstandard.org/impact-quantification/certified-sdg-impacts
Harvard Business Review:
• https://hbr.org/2021/01/esg-impact-is-hard-to-measure-but-its-not-impossible
• https://hbr.org/2021/01/compensation-packages-that-actually-drive-performance
Other references The responsible company, Chouinard & Stanley (2016) Published by Patagonia Works.

Selector Funds Management
45
Introduction Selector Funds Management Limited (SFML)
acknowledges the importance of an integrated and
consistent approach to Environmental, Social and
Governance (ESG) risk factors across each aspect of our
investment decision making process.
We extend this consideration to our own business
activities. We place the highest priority on the wellbeing
of our team – their safety, work life balance and financial
security – the strength of our governance program,
where we complement our internal process with
external oversight and expertise, and finally our
environmental impact, including measuring and
offsetting 100% of the carbon footprint that we generate
each year.
While our carbon footprint is small at 100 tonnes of
carbon emissions in 2019, and vastly lower in 2020 as
COVID-19 restricted our ability to travel, it remains
important to offset all our emissions as a message to our
team, their children, and our stakeholders.
We have achieved this offset through a partnership with
Carbon Neutral to support their Yarra Yarra Biodiversity
Corridor initiative. This Australian Native Reforestation
project aims to restore habitat loss and deforestation in
the Northern Wheatbelt of Western Australia. Carbon
Neutral is certified by The Gold Standard, which ensures
projects achieve genuine outcomes that deliver with as
much impact as possible.
We are planning more ambitious projects for the future.
When we consider our investment process from an
environmental (E) perspective, the research is
compelling. At the extreme, some assets will become
stranded by the impacts of climate change, while other
companies may become uninvestable, due to a set of
business risks that can no longer be quantified.
Yet we believe standardised reporting across our
investment universe remains some way off. For this
reason, SFML is a supporter of the Task Force on Climate-
Related Financial Disclosure (TCFD) Asia Pacific region,
which promotes the pursuit of leadership and
responsibility in this endeavour, across the global
financial community.
Our key environmental climate related agenda at SFML
is promoting transparency and consistency of reporting
on financial targets. We believe that when financial
targets are set, the complex task measurement can start.
SFML seeks to understand the many and varied social (S)
factors affecting a company’s financial performance
from both short and long-term perspectives. Areas of
focus are human capital management and specifically
remuneration and the behaviours it drives. Management
of supply chain risk and end customer relations are areas
of importance that drive or reduce market share. In
assessing these examples and others, we are attempting
to distinguish one off or short-term noise from longer
term structural issues that inevitably erode shareholder
returns.
Corporate governance (G) involves a set of relationships
between a company’s management, board,
shareholders, and external stakeholders. Clearly SFML
has a role to play here. We have a structured process for
voting on each resolution that crosses our table. We
believe this approach means our collective voice
(representing you – our client) is heard over the long
term. Here we can be responsible for meaningful change.
Executive Summary Our confidence in tackling this broad agenda stems from
our belief that Environmental, Social and Governance
consideration is embedded at the centre of each of the
four elements of our stock selection process: people,
business, balance sheet and capital management, a
proxy for real earnings per share (EPS) growth. ESG is not
simply tacked on as a final question before closing a
meeting, or a tick of the box exercise.
Companies with superior cultural behaviours are better
disposed to responsible management of ESG issues. They
increase shareholder wealth through higher staff
engagement and retention (people), they pursue
business leadership through consistent reinvestment
(business), and they are better managers of financial risk
(balance sheet), including cashflows and earnings
(capital management).
In our experience, given time, superior culture drives real
earnings per share growth. This meets our long-term
requirements, while contributing positively to the
development of society and the communities in which
our selected businesses operate. This reflects
responsible* business practice.

Selector High Conviction Equity Fund Quarterly Newsletter #71
46
Conversely, companies unwilling (people or business) or
financially unable (balance sheet or capital
management) to sufficiently support an internal culture
that factors in ESG issues, risk delivering diminished
investment returns over the longer term. If they are lucky
enough to remain a going concern this is irresponsible
business practice.
In this document:
• We explain how our investment process, including our historic focus on culture and sensible financial outcomes, lends itself to strong ESG outcomes. This is based on our belief that strong culture drives strong ESG outcomes.
• We outline our mandate exclusions, or negative screen, which increases the ESG quality of our stock selection process. We also summarise how our investment universe is reflective of our approach to driving better ESG outcomes.
• We discuss how our Roadmaps provide the consistent and repeatable framework used to execute our strong corporate engagement and quantitative programs, both of which we believe drive superior ESG outcomes.
In recent years we have taken progressive steps to better
understand Environmental risk and we are actively
seeking better financial disclosure from the companies
we invest in. This is addressed in our Climate Focus.
Finally, we review our structured approach to voting in
our adjoining voting policy.
Investment Process All research is undertaken in-house by the Portfolio
Managers and investment team. This is an intensive,
granular and in-depth approach to continuous learning.
We seek businesses with leadership qualities, run by
competent management teams, underpinned by strong
balance sheets and with a focus on capital management.
This approach lends itself to strong ESG outcomes. Our
approach is to fully integrate ESG into each of these four
areas.
This is a risk out process. We are trying to take as much
risk off the table as possible before we invest. The key
areas of risk we focus on are board and management
competency and the culture they are responsible for,
business qualities, balance sheet and capital
management. We believe a common-sense approach
holds that a net cash balance sheet carries lower risk and
more optionality than an optimised or extended balance
sheet. We ultimately compare equity risk to a risk-free
rate.
Before we invest, we seek to understand which risks a
business can control verse those outside its control. For
this to be possible, risk must be reported in a consistent
and transparent fashion, so as to avoid any surprises.
Risk sits in each bucket of E, S and G. Our program of
corporate engagement has aided our understanding of
risk in the S and G buckets since inception. In more
recent years we have taken progressive steps to better
understand Environmental risk and today, we are
actively seeking better financial disclosure from the
companies we invest in.
Our conviction in this process generates a concentrated
portfolio of our best ideas, or our highest quality stock
picks. The aim is to capture as much real earnings per
share growth as possible over the long-term.
Our approach has been consistent since inception. It is
framed by our Roadmap, which is both qualitative and
quantitative in nature. Our Roadmap provides a
repeatable framework that drives our corporate
engagement program, our quantitative program of
financial modelling including our stock universe data
screen, and our structured voting program. Each of these
programs are discussed below.
These areas of work however are not rigid, they evolve
over time as we continuously seek to incorporate better
solutions. By way of example, today we employ more
human capital, with more diversity of thought, have
better external and internal business systems, use and
develop more technology and automation, and we have
more robust compliance systems aided by external
expertise, than was the case in the first year of
operations 17 years ago.
This consistent reinvestment in our business, over time,
has driven continuous improvement of the investment
process.
Mandate Exclusions The mandate exclusions or negative screen, which have
been adopted across all our portfolios, include:
• Business generating >10% revenue from thermal
coal;

Selector Funds Management
47
• Business that manufactures or sell munitions or
weapons; and
• Tobacco related businesses.
We are transparent in acknowledging our investments in
the gaming sector. We have high expectations of these
companies in relation to S, social responsibility.
We expect these companies to play a leadership role,
global where possible, in responsible gaming initiatives
including addressing problem gambling. We will divest
when this hurdle is not met.
A Universe that drives better ESG outcomes • In general, we have sought ideas from the ASX
300.
• Our focus is on industrial companies.
• In the past 10 years we have not owned, Real
Estate Investment Trusts (REITs), Banks, General
Insurers, Resources, or Junior Miners.
• We do not own Energy.
• Our universe will typically have a lower capital
intensity and lower carbon footprint as a result.
• While hundreds of models have been built since
inception, +90 models are currently up to date,
per reporting period, and feed our stock
universe data pool.
• Inclusions from outside this index and select
competitors are added (for example, we may
include a business with a capital structure where
the free float may not meet Index
requirements).
• Our universe is subject to change and is
reviewed after each reporting season for
relevance.
• Based on our four areas of focus, (people,
business, balance sheet capital management)
that our universe is a higher quality subset of the
ASX 300.
• We rank our universe by buyout, Roadmap
score, yield.
Figure 6: SFML Roadmap
Source: SFML Research

Selector High Conviction Equity Fund Quarterly Newsletter #71
48
Roadmap The purpose of our Roadmap is to enable us to operate
under a consistent framework that is repeatable.
The Roadmap was developed when SFML was
established, 17 years ago, and is a qualitative and
quantitative business score card. Businesses are scored
on 18 attributes. This score is integrated into our
financial model and is reviewed at the half and full year
results. One of these attributes is the company’s ESG
track record, which directly addresses ESG factors within
a business.
In addition, we consider seven of the remaining 17
roadmap qualities to be directly related to ESG on the
basis that they are measuring cultural elements within
the business. We believe Culture and ESG are
intertwined. We consider them both integral to our
assessment of a business. Ultimately, we are seeking a
higher quality subset of businesses that can deliver real
EPS growth over the long term.
The seven elements include:
• Individuals we can trust – relates to ESG.
• Clear articulation of strategy – relates to ESG.
• Common bond with ordinary shareholders – relates
to ESG.
• Not reacting to share market pressure – relates to
Governance.
• Core business – relates to ESG.
• Free cash flow – relates to ESG.
• Low debt levels – relates to ESG.
ESG 2.0 Roadmap The ESG 1.0 Roadmap, developed in-house in 2019,
defines ESG issues that may impact companies and
applies a score of 1 or 0 for each area under
consideration. The ESG 2.0 Roadmap iteration was
created in 2021, with changes integrated into our
portfolio models thereafter.
Figure 7: SFML ESG 2.0 Roadmap
Source: SFML Research
Selector Funds Management
49
The following is a breakdown of each consideration:
• Climate targets – Assessment of the company’s plans
relating to carbon neutrality, Paris commitments,
scientific targets, or emission targets. “0” rating for
no effort.
• Renewable targets – Assessment of the company’s
documented use of renewables mix or implemented
targets for renewable energy.
• Progress against targets – Measuring progress made
against announced targets. “0” rating for no effort.
• Human Capital Management – “Is there a history of
human rights violations, workplace and IR disputes,
discrimination and harassment claims?”
Rating of the company’s employee engagement,
turnover and productivity. Compare the company’s
work, health and safety (WHS) standards against
peers, including their recording and track record of
incidents.
• Community – Rating of the company’s community
engagement and social licence to operate. Consider
whether the company has a framework on social
issues across its supply chain, including labour
standards, child labour, health & safety,
discrimination, and harassment.
• Best Interests – “Is the company behaving in a
manner that is in the best interests of stakeholders.”
• Board effectiveness – Assessment of the board
including industry experience, independence, age,
diversity, tenure, equity ownership and capacity.
• Shareholder interests – Assessment of the
remuneration structure, shareholder
communication, corporate disclosure, and reliability
of financial statements. Test the factors against the
company’s corporate strategy and whether they are
in line with shareholder interests.
• Risk & Litigation – Rating of the company’s internal
risk and control framework.
Corporate Engagement Program Our Corporate Engagement program is a foundation of
our investment process. We engage with board
members and management teams, attend Annual
General Meetings (AGM), and undertake site visits. Two
Portfolio Managers attend these meetings which can
occur in office, onsite and at interstate or international
locations of interest. In addition, we have the highest
quality technology systems deployed in all conference
areas to aid this program where travel is not permitted.
We engage with management to understand the culture
of a business, the reason it is in existence and its
prospects for the future. We do this because we believe
culture is the most important driver of future business
success.
From these engagements, notes are produced and
recorded. We consider each meeting as a page in the
book of understanding an individual business and its
culture. This work is a key plank of our understanding of
the three categories of ESG.
We believe culture and ESG are intertwined, with the
former driving the latter. We have focused on the culture
that drives the social and governance process within a
business since inception.
This granular approach in understanding the culture of
each business aids our evaluation of the short and long-
term remuneration structures tied to non-financial
outcomes. This is described in our voting policy.
We have extended our Roadmap, in recent years, to
address specifics such as Climate. We support TCFD in
promoting consistency and transparency of financial
reporting in this area. Our ESG Roadmap scoring system
is integrated into our financial models alongside our
original Roadmap.
Climate Focus Around the globe, regulation and legislation is starting to
tackle the large, systemic and structural changes that
limiting climate change will require. The Paris agreement
of 2016, a platform to address and minimise rising global
temperatures, has shifted the conversation to a
fundamental economic and financial risk return
discussion.
SFML believes all companies and organisations have a
responsibility to consider the risks of climate change and
to ensure their business is resilient in a low carbon
future.
Alongside our program of direct corporate engagement,
SFML digests information from annual reports and
climate change statements where available. Not all
companies are reporting and for those who are,
company reporting is often not directly comparable.
Across our portfolio of holdings, we will advocate for the
recognition, establishment and inclusion of Paris based
targets and or science-based climate targets, emissions

Selector High Conviction Equity Fund Quarterly Newsletter #71
50
targets and/or renewable energy targets. Once these
base targets are established, progress can be tracked.
We are also monitoring our companies for no efforts, no
accountability. We are not proposing to exit investments
based on our climate policy, this will not solve problems
as we note in our concluding remarks. We believe we can
have far greater impact via our corporate engagement
program and our voting program.
In 2021, SFML became a supporting party to the Task
Force on Climate Related Financial Disclosure (TCFD) and
its principles, in pursuit of greater transparency on these
important issues. We have adopted the aspects of this
voluntary guideline that make sense within the context
of our investment process. This will enhance and
strengthen our ongoing approach to ESG.
Quantitative Research Program Our quantitative approach is centred on financial
modelling also undertaken in-house. Individual company
models are built using a consistent repeatable template.
Information is taken from multiple annual reports and
other publicly available documents. No information
dumps occur as we prefer the granular approach of
extracting and understanding the individual numbers
behind the multiyear trends that are drawn out of this
work.
While over 50 financial ratios are calculated in addition
to our buy-out ratio, which we compare to a risk-free
rate, it is the longer-term trends that hold our attention.
While hundreds of models have been built since
inception, >90 are continuously up to date, per reporting
period, and feed our stock universe data pool.
This granular approach to understanding financial drivers
of each business aids our evaluation of the short and
long-term remuneration structures tied to specific
financial outcomes.
Decisions about executive pay can have an indelible
impact on a company. When compensation is managed
carefully, it aligns people’s behaviour with the
company’s strategy and generates better performance.
When it is managed poorly, the effects can be
devastating: the loss of key talent, demotivation,
misaligned objectives, and poor shareholder returns.
Given the high stakes, it is critical for boards and
management teams to get compensation right.
This is described in our voting policy.
Selector Funds Management
51
VOTING POLICY 2021
Introduction The depth of our corporate engagement and
quantitative research programs provides the
groundwork for our structured voting program.
Executive Summary SFML has developed a cloud based ESG resource centre,
which collates all the relevant public documents required
by the Portfolio Managers and Head of ESG in reviewing
the activities, processes, targets, and commitments
made by the businesses we own. The centre includes
annual reports, sustainability reports, AGM documents,
corporate governance documents, relevant policies, and
charters. It also includes our working notes.
Through our corporate engagement program, we can
exert influence for change on a business. Undoubtedly
this is stronger when we have an aggregate holding
within the top 20 shareholders of a business. That said,
arguably we have more influence when we have a long-
term professional relationship with a public company, its
management team and board.
Areas we have long championed include, having the
optionality of a strong cash balance sheet, writing off all
R&D in the year it is incurred and a sensible dividend pay-
out ratio that allows ample reinvestment for future
earnings growth. None of this is earth shattering or
rocket science, it is a common-sense approach to
investment and one that we apply to our own business
and which extends to our voting policy.
In relation to voting, we have adopted a structured
program of work that dovetails with our corporate
engagement program. Importantly, we vote as long-term
owners of a business and we attend AGMs in person
where possible.
All resolutions are documented, considered, and
commented on by the Portfolio Managers and Head of
ESG, before votes are submitted. While we do not
subscribe to any proxy services, our continuous dialogue
with clients and the companies we own, enable us to
quickly understand any areas of public interest which
require our consideration. While this can be circular and
time consuming, the granularity of this approach aids our
continuous learning about the businesses and their
stakeholders.
This is a substantial piece of work undertaken by the
Portfolio Managers and the Investment team. Alongside
our corporate engagement program, we believe this
proactive approach to voting drives better insight and a
greater understanding of a business, and the issues and
risks it faces, than would occur if we otherwise
outsourced our voting responsibilities or simply followed
the recommendations of a proxy advisor service.
Voting for Directors Selector employs a qualitative approach to voting for
directors. We do not believe a box ticking approach is
sufficient.
Selector’s votes are based on outcomes from our
corporate engagement program run by our Portfolio
Managers. We want to understand how a board and its
directors are adding value.
This is a detailed research program that occurs across an
entire year, but also benefits from the historic
understanding of a business, its board and management
that comes with long term ownership.
We believe we are further advantaged in this voting
process, by our unique lens, having run our own
businesses across decades.
Voting on Remuneration When voting on remuneration, we take into
consideration both qualitative and quantitative
achievements of the individual business measured
against any strategic goals set by the board and executed
by the management team.
The depth of our corporate engagement program
informs our voting on remuneration. Individually we will
consider leadership, transparency, strategic thinking,
responsible conduct, and other attributes of the
individual being remunerated. This relates to non-
financial components of remuneration.
These non-financial metrics include:
• Reasonable short-term incentive (STI) & long-term incentive (LTI) remuneration structures that are in line with key performance indicators previously outlined by a company.
• Reasonableness of base.

Selector High Conviction Equity Fund Quarterly Newsletter #71
52
• Component of performance award at risk to
non-financial outcomes.
• Culture.
• Business leadership.
• Risk Management and ESG.
The consistency of our quantitative research program
informs and aids our voting on remuneration. We
consider the relevance of each financial metric, gateway
and hurdle that comprises an individual's remuneration
and the behaviours it drives in relation to the financial
outcomes of the business. We evaluate the
reasonableness of the entire remuneration outcome. We
consider relevant market conditions for remuneration,
which vary across industry and geography.
Our views are balanced by the need to retain and
motivate quality leadership. We understand the
disruption and dysfunction that goes hand in glove with
the failure to achieve a positive outcome, at both
management and board levels.
That said it cannot simply be a race to the top in
executive remuneration, where all boards want to be
just above midpoint. This type of thinking means that the
midpoint continues to shift up without alignment to
other stakeholders.
There is no best practice that works in all situations.
The financial metrics include:
• Component of performance award at risk to
financial outcomes.
• Balance sheet optionality.
• Reinvestment.
• Growth in metrics including real EPS and real
DPS.
• Responsible financial conduct of Management.
Voting Procedure SFML’s voting process has been upgraded and
systematised to incorporate digital distribution of AGM
notices, resolutions, and reporting documents. This
process is now cloud-based rather than a manual paper-
based process.
The upgraded process enables all resolutions and
supporting documents, including the annual report to be
reviewed, commented and voted on by both Portfolio
Managers and members of the Investment team. This
can be undertaken from any mobile device at any
location.
Upon notification of a vote, our investment team
prepare the necessary information into our report
format. This is then distributed to the Portfolio Managers
digitally, whereby the respective decisions are made
based upon the above information. The actions are then
recorded and archived before the votes are lodged via an
online proxy portal.
Conclusion SFML believes it is essential to consider the impact of
material ESG risks on the long-term performance of our
investments.
SFML’s aim is to:
1. Understand, measure where possible, and monitor
ESG risk in the context of our equity investments.
2. Make full use of our rights of ownership, on behalf of
our investors, by voting on all relevant resolutions.
We need to be able to justify our votes. This relies
upon our corporate engagement program and our
quantitative research program.
3. Drive common sense changes in business practice
and financial management that benefit all long-term
shareholders and stakeholders.
4. Continue along the pathway of learning across a
diverse range of ESG related topics.
Independent research, and our own experience as a
long-term investor, indicate that positive ESG outcomes
are tied to better financial performance.
We acknowledge significant challenges exist in our ability
to add value across an agenda as broad as ESG.
Therefore, our approach to ESG needs to continue to
evolve and we need to embrace continuous learning as
individuals and as an organisation. We must fight our
own bias in this process and while we continue to focus
on bottom-up stock selection we also need to be mindful
of the bigger picture.
“Unintended consequences…. [can occur if] we fixate on
one small part of a complex system, and in so doing come
up with solutions to the wrong problem. ESG measures

Selector Funds Management
53
can perpetuate this behaviour, especially when the
measures and investor rewards remain tied to individual
firms. At an individual level, for example, BP can take
credit for reducing its emissions by selling its
petrochemicals business. But that business and its
emissions, of course, have not gone away.”4
Following in the footsteps of others, as we learn, we have
tried to use our words carefully in this document. The use
of the word “sustainability” was replaced with
“responsible”, at the end of our twelfth paragraph.*
From The responsible company5 we learnt that
sustainability “is a legitimate term that calls on us not to
take more from nature than we give back…We have no
business applying the word sustainable to business
activity until we learn how to feed, clothe, and enjoy
ourselves – and fuel the effort – without interfering with
nature’s capacity to regenerate”. Obviously with this
context, we cannot make that claim.
Chouinard & Stanley outline some of the key issues that
responsible companies will face over the next 50 years,
in relation to Shareholders, Employees, Customers,
Communities and Environment (Nature). They are
interesting discussion points as we frame our view of the
future.
Shareholders:
Accounting will become more complex. As ESG becomes
mainstream companies will have to financially account
for their impact on the environment. If not, they risk a
shareholder revolt following a sudden rise in the price of
carbon or drop in availability of fresh water. The United
Nations has weighed in with the adoption in 2012 of an
agreed method to account for the ecosystem value of
natural resources like minerals, timber, and fisheries.
Employees:
There has been a fifty-year trend towards automation
(technology), moving jobs offshore, improving wages in
developing countries and a flattening of wages in
advanced countries. The next fifty years will be marked
by pressure to restore the living wage. It was assumed as
late as the 1960’s that the annual pay of one wage earner
(usually male) should support his family. The new more
4 Harvard Business Review: https://hbr.org/2021/01/esg-impact-is-hard-to-measure-but-its-not-impossible?autocomplete=true
modest goal has a worker paid one half of what it takes
to support a family of four. To meet this goal will require
further increases in productivity, most of which will
come from automation (technology), which further
depresses employment rates. More workers will be
better paid, yet more people will be out of work.
Customers:
As things become more expensive, customers will
become choosier and buy less. They will increasingly
demand to know whether products qualify as healthy
and humane. Any gaps will be easily exposed on social
media.
Communities:
Responsible business will be required to accept its supply
chain as part of its own, in relation to improved working
conditions and environmental harm. Third party
verification will become more important, and more
companies will benchmark against social and
environmental standards while working to raise the bar.
Environment:
As customers and clients learn more about the
consequences of taking from the natural world at our
current pace, they will pressure companies to do more,
more quickly. Expenses will rise for natural resources
(especially energy and water) and for waste disposal.
Financial pressures will mount for those with weaker
cashflows and balance sheets. To compete, a company
will have to at least be as responsible as its competitors.
Fifty years out, it will be the leaders in these five
categories of shareholder, employee, customer,
community, and environmental engagement, that will
prevail. These areas align closely with our own views on
the importance that culture and its relationship with ESG
will have on any given business.
We believe that ESG will increasingly be accepted as
mainstream investing. We have confidence that our
investment process, which promotes continuous
learning via our work programs across corporate
engagement, quantitative research and our structured
approach to voting will add value in this space.
5 The responsible company, Chouinard & Stanley (2016) Published by Patagonia Works.

Selector High Conviction Equity Fund Quarterly Newsletter #71
54
The journey at Selector started with extremely humble
foundations, and today we hold on to these roots. It is
just as well, because the reality is that investing itself can
be a very humbling experience. We have long accepted
the challenge of becoming better investors. To achieve
this, we will continue to invest in human capital and our
business, and we will maintain a cash balance sheet that
supports this reinvestment.
On behalf of our team, we look forward to sharing
further developments with our clients, investors,
shareholders, and stakeholders in the future.
Tony Scenna | Portfolio Manager
Corey Vincent | Portfolio Manager
Kari Humphrey | Head of ESG
SFM

Selector Funds Management
55
COMPANY ENGAGEMENTS – MARCH 2021 QUARTER
Date Company Description
13-Jan RMD ResMed JPM Healthcare Conference
23-Jan NHF NIB Holdings JPM Industry insight Call
22-Jan COH Cochlear UBS Industry insight Call
27-Jan COH Cochlear JPM Industry insight Call
27-Jan RWC Reliance Worldwide 1H21 Trading Update
29-Jan RMD ResMed 2Q21 Results Conference Call
1-Feb BKL Blackmores Management Conference Call
2-Feb ART Airtasker Morgans IPO roadshow
2-Feb ALL Aristocrat Leisure Meeting with Chair
15-Feb NEA Nearmap HY21 Results Conference Call
15-Feb MP1 Megaport Management Conference Call
16-Feb ALU Altium HY21 Results Conference Call
16-Feb BRG Breville HY21 Results Conference Call
16-Feb BRG Breville UBS Management Conference Call
16-Feb ALU Altium UBS Management Conference Call
16-Feb BRG Breville Macquarie Management Conference Call
17-Feb CAR Carsales.com HY21 Results Conference Call
17-Feb ARB ARB Corporation UBS Management Conference Call
17-Feb DMP Domino's Pizza Enterprises HY21 Results Conference Call
17-Feb DMP Domino's Pizza Enterprises JPM management Conference call
17-Feb NEA Nearmap Macquarie Management Conference Call
17-Feb BRG Breville JPM management Conference call
17-Feb CAR Carsales.com UBS Management Conference Call
17-Feb NEA Nearmap Citi Management Conference Call
18-Feb ARB ARB Corporation Barrenjoey Management Conference Call
18-Feb IRE IRESS FY20 Results Conference Call
18-Feb CSL CSL HY21 Results Conference Call
18-Feb PME Pro Medicus UBS Management Conference Call
18-Feb CAR Carsales.com GS Management Conference Call
18-Feb NEA Nearmap Management Conference Call
18-Feb NEA Nearmap GS Management Conference Call
19-Feb CAR Carsales.com Management Conference Call
19-Feb COH Cochlear HY21 Results Conference Call
19-Feb DMP Domino's Pizza Enterprises Citi Management Conference Call
19-Feb BRG Breville Barrenjoey Management Conference Call
19-Feb IRE IRESS Management Conference Call
19-Feb CAR Carsales.com Morgans Management Conference Call
19-Feb DMP Domino's Pizza Enterprises Management Meeting
22-Feb RWC Reliance Worldwide HY21 Results Conference Call
22-Feb NHF NIB Holdings HY21 Results Conference Call
22-Feb COH Cochlear Macquarie Management Conference Call

Selector High Conviction Equity Fund Quarterly Newsletter #71
56
Date Company Description
22-Feb IRE IRESS Macquarie Management Conference Call
22-Feb CSL CSL JPM management Conference call
22-Feb REA REA Group Meeting with Investor Relations
23-Feb IRE IRESS Barrenjoey Management Conference Call
23-Feb RWC Reliance Worldwide Macquarie Management Conference Call
23-Feb SEK Seek HY21 Results Conference Call
23-Feb PNV PolyNovo HY21 Results Conference Call
23-Feb TNE TechnologyOne Annual General Meeting
23-Feb JIN Jumbo Interactive HY21 Results Conference Call
23-Feb COH Cochlear Management Conference Call
24-Feb BKL Blackmores HY21 Results Conference Call
24-Feb IFL IOOF Holdings HY21 Results Conference Call
24-Feb APX Appen FY20 Results Conference Call
24-Feb NAN Nanosonics HY21 Results Conference Call
24-Feb SEK Seek UBS Management Conference Call
24-Feb SEK Seek Management Conference Call
24-Feb NAN Nanosonics UBS Management Conference Call
25-Feb FCL FINEOS HY21 Results Conference Call
25-Feb FLT Flight Centre Travel Group HY21 Results Conference Call
25-Feb IFM Infomedia HY21 Results Conference Call
25-Feb PNV PolyNovo UBS Management Conference Call
25-Feb FLT Flight Centre Travel Group UBS Management Conference Call
25-Feb APX Appen Citi Management Conference Call
25-Feb NAN Nanosonics Management Conference Call
25-Feb BKL Blackmores Management Conference Call
26-Feb FCL FINEOS Macquarie Management Conference Call
26-Feb IFM Infomedia UBS Management Conference Call
26-Feb REH Reece HY21 Results Conference Call
26-Feb ALL Aristocrat Leisure Annual General Meeting
26-Feb BKL Blackmores UBS Management Conference Call
26-Feb JIN Jumbo Interactive GS Management Conference Call
26-Feb IFM Infomedia UBS Management Conference Call
26-Feb IFL IOOF Holdings JPM management Conference call
26-Feb PNV PolyNovo Management Conference Call
26-Feb NHF NIB Holdings Management Conference Call
1-Mar NAN Nanosonics JPM management Conference call
1-Mar IFL IOOF Holdings Management Conference Call
1-Mar APX Appen UBS Management Conference Call
1-Mar NHF NIB Holdings Macquarie Management Conference Call
1-Mar REH Reece Management Conference Call
1-Mar NAN Nanosonics Citi Management Conference Call
1-Mar JIN Jumbo Interactive Management Conference Call
2-Mar NXL Nuix UBS Management Conference Call
2-Mar RWC Reliance Worldwide Management Conference Call

Selector Funds Management
57
Date Company Description
2-Mar NXL Nuix Macquarie Management Conference Call
2-Mar TNE TechnologyOne UBS Management Conference Call
3-Mar ALU Altium Management Conference Call
3-Mar APX Appen Management Conference Call
4-Mar PNV PolyNovo JPM management Conference call
4-Mar ARB ARB Corporation Management Conference Call
4-Mar FCL FINEOS Management Conference Call
5-Mar FCL FINEOS UBS Management Conference Call
5-Mar FLT Flight Centre Travel Group Management Conference Call
5-Mar PME Pro Medicus JPM management Conference call
9-Mar FCL FINEOS Citi Management Conference Call
9-Mar TNE TechnologyOne Barrenjoey Industry Insight Call
9-Mar CSL CSL Management Conference Call
10-Mar NEA Nearmap JPM management Conference call
11-Mar MVP Medical Developments International Management Conference Call
12-Mar PME Pro Medicus Barrenjoey Product Demonstration
15-Mar MVP Medical Developments International Taylor Collison Management Conference Call
16-Mar CSL CSL Citi CIDP Industry Insight Call
16-Mar ALL Aristocrat Leisure Management meeting
23-Mar FLT Flight Centre Travel Group JPM management Conference call
23-Mar DOM.LON Domino's Pizza Group PLC Citi Management Conference Call
24-Mar RMD ResMed KeyBanc's Capital Market Conference
30-Mar ALL Aristocrat Leisure Investor Roundtable Conference Call
Selector Funds Management Limited Disclaimer The information contained in this document is general information only. This document has not been prepared taking
into account any particular Investor’s or class of Investors’ investment objectives, financial situation or needs. The
Directors and our associates take no responsibility for error or omission; however, all care is taken in preparing this
document. The Directors and our associates do hold units in the fund and may hold investments in individual
companies mentioned in this document. SFM