optogenetic stimulation and voltage imaging of cultured
TRANSCRIPT

1
Sahlgrenska academy
Optogenetic Stimulation and Voltage Imaging of Cultured Neurons
Degree Project in Medicine
Anders Engström
Programme in Medicine
Gothenburg, Sweden 2019
Institute of Neuroscience and Physiology
Supervisors: Henrik Seth, Johan Tolö, Dzeneta Vislin Hodzic

2
Table of contents
Abstract ...................................................................................................................................... 3
Introduction ................................................................................................................................ 3
Electrophysiology ................................................................................................................... 4
Optogenetics ........................................................................................................................... 5
Cell culturing .......................................................................................................................... 8
Aim ............................................................................................................................................. 9
Methodology ............................................................................................................................ 10
Electrophysiology ................................................................................................................. 10
Cell culturing ........................................................................................................................ 14
Gene delivery ........................................................................................................................ 15
Ethics ........................................................................................................................................ 15
Results ...................................................................................................................................... 16
CheRiff ................................................................................................................................. 16
QuasAr .................................................................................................................................. 17
All-optical recording ............................................................................................................. 17
Spontaneous activity ............................................................................................................. 19
Discussion ................................................................................................................................ 20
Interpretation ........................................................................................................................ 20
Limitations ............................................................................................................................ 21
Optimisation ......................................................................................................................... 23
Conclusions .............................................................................................................................. 24
Acknowledgements .................................................................................................................. 24
Populärvetenskaplig sammanfattning ...................................................................................... 25
References ................................................................................................................................ 27
Supplementary figure ............................................................................................................... 29

3
Abstract
All-optical recording of neural activity is becoming a reality through recent developments in
the field of optogenetics. By pairing light-responsive actuators and fluorescent sensors in the
form of microbial opsins and integrating them into neurons, electrical events can be triggered
by light and visually recorded. This allows for large-scale characterisation of single neurons
with a high temporal resolution of milliseconds. This project aims to realise the concept at our
lab by delivering a construct termed “Optopatch” developed by Cohen et al. at Harvard
University into cultured neurons and testing it, comparing optically recorded data with
simultaneous patch clamp measurements. Different methods of neuronal culture and gene
delivery are assessed. All elements of Optopatch are verified to function on a proof-of-concept
level and the method’s strengths and weaknesses are discussed along with what needs to be
done for the method to have a place in future research carried out at the lab.
Keywords: optogenetics, voltage imaging, channelrhodopsin, GEVI, electrophysiology
Introduction
Electrophysiological recordings yield information about how neurons function and
communicate. Electrical properties such as excitability, synaptic events and the shape and firing
rate of action potentials can be directly measured or calculated by using the patch clamp method
(1, 2). However, manually opening and recording from a cell is a time-consuming task and
usually demands weeks of practice to learn. The concept of voltage imaging (3) can grant
similar information about neurons by observation rather than physical measurement. With fast
and stable voltage-sensitive proteins that emit light, and equipment capable of high-speed video
capture, electrical events can be optically represented. Combining these voltage sensors with
light-sensitive ion channels, all-optical electrophysiology presents a tool with vast possibilities.

4
Electrophysiology
Membrane potential
Movement of ions through channels in the cell membrane is the basis of neural communication.
Ions are actively transported across the membrane to in order to form concentration gradients.
Sodium, calcium and chloride are more plentiful extracellularly while a higher concentration of
potassium exists inside the cell. Along with the difference in ionic concentrations this also
establishes a difference in electrical potential across the membrane—the membrane potential.
A positive change of the membrane potential is termed a depolarisation. A negative change is
a hyperpolarisation. The membrane potential of a neuron at rest lies at approximately -70 mV.
Together, the concentration gradients and the potential difference create a driving force for ionic
currents through membrane channels. A wide variety of ion channels exist. Their quantity,
permeability and kinetics establish the membrane’s electrical properties.
Patch clamp
Traditionally, patch clamping is the standard method for performing electrophysiological
experiments on single cells. The method of “clamping” the membrane potential using
microelectrodes stems from experiments performed by Hodgkin and Huxley in the 1950s (4).
Their findings became the fundament to our understanding of the conducting properties of cell
membranes. The patch clamp was later developed by Neher and Sakmann (5) in the late 1970s,
who received the Nobel Prize for their research on single ion channels. Using a small glass
pipette containing a microelectrode capable of stimulation and recording, a seal is formed onto
the cell membrane. The membrane is then ruptured, and a circuit is established through the cell.
The patch clamp gives the experimenter control of the cell and with the amplifier, voltages and
currents can be modified, stimulating the cell and measuring its properties.

5
Optogenetics
Opsins
Opsins are proteins sensitive to light. Paired with the cofactor retinal they give us vision and,
perhaps surprisingly, provide us with a useful tool for studying the electrical properties of
neurons. The idea of using light to control cell activity originated in the early 2000s (6) and
methods are constantly developing. Optogenetic actuators are light-activated ion channels,
channelrhodopsins. In response to light, channels open to allow a flux of ions through them (7).
Genetically modifying cells to express these opsins, researchers can stimulate cells with light
and observe their behaviour.
Voltage imaging
All-optical recording (AOR) combines optical stimulation with optical imaging (8), which is
allowed by optogenetic sensors: fluorescent proteins sensitive to intracellular events such as
changes in voltage, ion concentration (9) or neurotransmitter release (10). Genetically encoded
voltage indicators (GEVIs) vary their fluorescence properties in response to fluctuations of the
membrane potential (11). In search for a way to stimulate and record the electrical activity of
single cells in real time using only optics, Cohen et al. from Harvard University have been
developing a method termed the Optopatch. Their most recent DNA construct—Optopatch3
(12)—will be assessed in this project. It contains both a channelrhodopsin and a GEVI.
The signal-to-noise ratio (SNR) when capturing images of a GEVI is important. It is the ratio
between the power of the signal (QuasAr fluorescence) and the distorting noise. Improved SNR
means more accurate recordings. It can be achieved by taking measures such as achieving high
protein expression and using sensitive camera equipment.

6
Optopatch
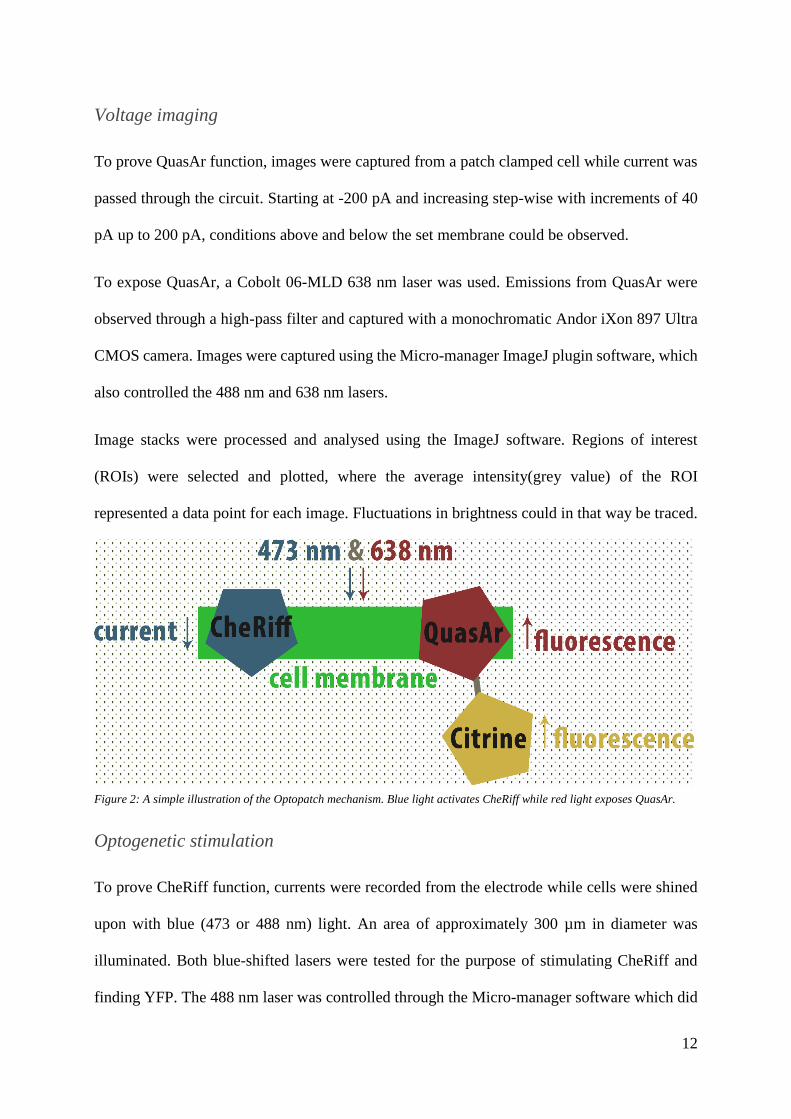
Optopatch3 consists of three elements: an actuator, a sensor and a reporter. The
channelrhodopsin CheRiff opens and depolarises the membrane in response to blue-shifted
light. The archaerhodopsin-based GEVI QuasAr3 fluoresces in the near-infrared spectrum with
in response to depolarisation. Following DNA delivery, the Optopatch protein components can
be produced and expressed in transfected cells.
The fluorescent reporter Citrine is derived from yellow fluorescent protein (YFP) (13) and
functions as a marker, reporting which cells that successfully have been modified to express the
Optopatch construct. With different filters inserted in the microscope, different wavelengths of
light can be observed. The excitation peak of Citrine is at 516 nm and its emission peak is at
529 nm.
QuasAr stems from an opsin originally found in the archaebacteria Halorubrum sodomense
(14). It has been genetically engineered (15) to optimise it for voltage sensing and fluorescence,
among other things. It can be thought of as having two states, with changes in voltage being
responsible for the switch between the non-fluorescent and the “active” fluorescent state. A
positive membrane potential will increase the chance of QuasAr being fluorescent, which
makes QuasAr a voltage sensor.
CheRiff is a photosensitive ion channel, a channelrhodopsin, stemming from one originally
found in the algae Scherffelia dubia (15). It has been engineered to improve properties necessary
for optogenetic stimulation. One such property is membrane trafficking, the transportation and
integration of processed protein into the cell membrane. Another property is kinetics; the
channelrhodopsin needs to respond within milliseconds to changes in illumination by opening
and closing at a fast and repeatable rate. This allows for high-frequency stimulation.

7
Photocurrent
When CheRiff opens, ions travel through it. This is a flow of charges, a current. The current’s
direction is determined by the driving force. CheRiff is a non-specific cation channel and
therefore permeable to both potassium, sodium and calcium. Since potassium exists in high
concentrations intracellularly, opening of the channel will cause a flow of potassium ions
outwards. The opposite is true for sodium and calcium. If, theoretically, no other channels but
CheRiff would be open, ions would flow until repelling charges cause equilibrium to be
reached. The resulting membrane potential is termed the equilibrium potential of said channel
and is dependent on its relative permeability for each ion. The reversal potential of CheRiff has
been calculated to +4 mV (16), similar to that of AMPA and NMDA (17), the excitatory ion
channels of the mammalian brain.
The archaebacterial opsin modified into QuasAr originally produced a photocurrent as well.
This property has been removed for QuasAr to function as a pure sensor.
Fluorescence
For fluorescence to be apparent, QuasAr needs to be excited by red-shifted light. Fluorescence
is the property of certain molecules to emit photons when their electrons—having been excited
by absorption of higher-energy photons—return to their ground state (18). In the context of this
project, retinal functions as such a fluorescent molecule—a fluorophore (19). In the voltage-
induced fluorescent state of QuasAr, retinal can be excited by photons from a 638 nm laser. The
re-emitted photons will have an even lower energy, being in the near-infrared spectrum (20).
Observed through a low-pass filter blocking out other light, this makes QuasAr a light-emitting
voltage sensor. The cell marker Citrine is a fluorescent protein whose fluorescent properties are
intrinsic and thus not dependent on cofactor.

8
Cell culturing
If the right conditions are met, cultured neurons in a cell dish will attach to each other, form
synapses and consequently also communicate (21). Matured neurons will be able to fire action
potentials even in a cell culture. Cultured cells are therefore an excellent alternative when
studying the electrical properties of single cells.
Cell cultures can be used as disease models. A dish of neurons is more accessible than a brain,
which can be beneficial when studying certain genotypes on a cellular level. An advantage of
stem-cell research in comparison to ex vivo experiments on live tissue is the restriction of live
animal expenditure.
Cultured neurons
Induced pluripotent stem cells (iPSC:s) (22) can be created from any healthy cell and are a
promising tool for researching specific disease genotypes (23). In this project, fibroblasts from
a patient with juvenile-onset Huntington’s disease (24) have been converted into neurons.
In contrast to iPSC:s, induced neuronal (iN) cells (25) can be directly converted from other cell
types without going through a pluripotent phase. In this project, induced neurons are created
from human embryonic stem cells (hESC:s). Although hESC:s are clearly pluripotent, the main
benefit and purpose of iN:s is to convert terminally differentiated cells directly into neurons.
On the contrary, primary neurons are matured in the animal and then isolated from its nervous
tissue (26). In this project, the hippocampus is dissected from neonatal mice and cells are
subsequently cultured in growth medium.

9
Gene delivery
Since the genetically engineered opsins don’t exist in mammalian cells, new genetic material
needs to be introduced to the cells. Transfer of genetic material can be achieved in multiple
ways. In this project, two types of genetic vectors—a plasmid and a recombinant virus—will
be assessed. Plasmid delivery will be carried out with the use of both magnet-assisted (27, 28)
and calcium phosphate (29) transfection and the same plasmid will also be utilised to construct
an adeno-associated virus for transduction. With transfection, DNA is attached to small
particles and taken up by cells. In this case, magnetic nanoparticles and calcium phosphate
precipitate will be assessed.
Aim
The purpose of this project is to perform and evaluate all-optical recording of neural activity
using Optopatch. With the traditional patch clamp method, properties of both optogenetic
proteins shall be verified and quantified. Also, as a part of the process, different types of
cultured neurons as well as different methods of gene delivery shall be evaluated.
There will be three main steps to verifying Optopatch function. By patch clamping a cell and
recording currents while illuminating the cell with stimulating light, CheRiff activity can be
measured. By injecting current into the cell through the patch clamp while observing changes
in brightness captured from the camera, QuasAr can be verified. The final step is the removal
of the patch clamp electrode. By observing changes in fluorescence from a neuron while
stimulating it with light in another part of the wavelength spectrum, the goal of all-optical
stimulation can be realised.

10
Methodology
Electrophysiology
The student’s main responsibility was to coordinate the project and to perform experiments.
Growth and transfection of cells were not performed by the student. Therefore, methodology
concerning cell culturing and gene delivery will be described in less detail than the methods of
electrophysiological recordings.
Microscopy
For Optopatch experiments, a Nikon Eclipse Ti2 inverted wide-field microscope was used. It
was mounted on a Newport RS 2000 auto-stabilising table. Cover slips with cells were attached
to a Warner Instruments RC-25 polycarbonate chamber on a PM3 magnetic heated platform,
mounted on the microscope. The chamber was perfused with a bubbled Ringer solution [table
1] containing necessary ions, nutrients and oxygen, flowing through polyethylene tubing.
When searching for candidate cells, the cover slip was illuminated with blue-shifted light to
identify YFP-expressing cells. A Cobolt 06-MLD 488 nm diode laser and a Rapp
OptoElectronic 473 nm diode laser were used for this purpose. Fluorescence from transfected
cells was observed through a filter. Many filters and mirrors were used for different purposes
Figure 1: Same neurons in a different light. LEFT: Regular light microscopy. MIDDLE: Citrine fluorescence. RIGHT: QuasAr
fluorescence.

11
in the set-up. For the purpose of all-optical recording, a combination of three filters was inserted
into the microscope. A Semrock FF01-378/474/554/635-25 bandpass excitation filter let the
laser beams through and cancelled other light. A Semrock Di01-R635-25x36 longpass dichroic
mirror reflected the lasers onto the sample while letting red-shifted light through. A Chroma
ET710/75x bandpass emission filter additionally filtered emissions from the sample to cancel
unwanted wavelenghts.
Patch clamp
A HEKA Elektronik EPC 9 amplifier was used for patch clamp recordings. Small ~5 MΩ
pipettes were pulled from glass tubes using a Sutter Instruments micropipette puller. They were
filled with intracellular solution (Table 2) and inserted over a silver chloride electrode
connected to a Narishige MHW-3 three-axis water hydraulic micromanipulator. After the
pipette was placed on a cell, a slight suction was applied, forming a tight seal. The membrane
was then ruptured and a circuit was established through the cell to the earth electrode placed in
the bath, giving the user control over the membrane potential.
Table 1
Extracellular (bath) solution
NaCl 124 mM
KCl 3 mM
NaHCO3 26 mM
NaPO4 1,25 mM
CaCl2 2 mM
MgCl2 1 mM
D-Glucose 10 mM
Table 2
Intracellular (pipette) solution
K+ gluconate 127 mM
KCl 8 mM
HEPES 10 mM
Phosphocreatine 15 mM
Mg-ATP 4 mM
Na-GTP 0,3 mM
KOH 10 mM
12
Voltage imaging
To prove QuasAr function, images were captured from a patch clamped cell while current was
passed through the circuit. Starting at -200 pA and increasing step-wise with increments of 40
pA up to 200 pA, conditions above and below the set membrane could be observed.
To expose QuasAr, a Cobolt 06-MLD 638 nm laser was used. Emissions from QuasAr were
observed through a high-pass filter and captured with a monochromatic Andor iXon 897 Ultra
CMOS camera. Images were captured using the Micro-manager ImageJ plugin software, which
also controlled the 488 nm and 638 nm lasers.
Image stacks were processed and analysed using the ImageJ software. Regions of interest
(ROIs) were selected and plotted, where the average intensity(grey value) of the ROI
represented a data point for each image. Fluctuations in brightness could in that way be traced.
Optogenetic stimulation
To prove CheRiff function, currents were recorded from the electrode while cells were shined
upon with blue (473 or 488 nm) light. An area of approximately 300 µm in diameter was
illuminated. Both blue-shifted lasers were tested for the purpose of stimulating CheRiff and
finding YFP. The 488 nm laser was controlled through the Micro-manager software which did
Figure 2: A simple illustration of the Optopatch mechanism. Blue light activates CheRiff while red light exposes QuasAr.

13
not allow for continuous stimulation while capturing images. The 473 nm laser was controlled
through a separate digital head unit which allowed for continuous illumination. This gave the
experimenter accessible control of stimulation time, pulse frequency and pulse width.
The 473 nm laser was reflected by a digital multi-mirror device (DMD). The DMD contained
a 640 by 480 px grid of mirrors, with each pixel having a controllable on or off state. Every
mirror was in its on-state for this project, therefore making the DMD function as a regular
mirror.
Figure 3: A simplified model of the set-up in its 473 nm laser configuration.
14
Cell culturing
iPSC-derived neurons
A cell line from an early-onset Huntington’s disease patient with 109 CAG repeats (ND42223,
derived from a 9-year-old patient) was used. Induced pluripotent stem cells were cultured in a
1:1 mixture of a DMEM/F-12 (GIBCO) medium with GlutaMax™ and N-2 supplements and a
Neurobasal-A (GIBCO) medium supplemented with GlutaMax and B17™.
Induced neuronal cells
Human embryonic stem cells (hESC:s) were converted to induced neurons (iN:s) by
sequentially changing growth media to facilitate differentiation. Originally in mTeSR™
(STEMCELL Technologies) medium, hESC:s were then cultured in DMEM/F-12 (GIBCO)
with N-2 supplement to start neural differentiation. They were later re-plated together with glial
cells in Neurobasal-A (GIBCO) medium supplemented with B27™ and GlutaMax™ and
matured for ~25 days.
Primary neurons
Hippocampi were dissected and neurons were harvested from new-born (P0/P1) mouse pups.
They were plated and grown in Neurobasal-A (GIBCO) medium [Table 3] supplemented with
B27™ and HyClone™ (GE Healthcare) fetal bovine serum.

15
Gene delivery
A plasmid denoted YA1529: pAAV_hSyn-QuasAr3-P2A-CheRiff (Supplementary figure 1)
was used to incorporate Optopatch3 into target cells. The plasmid is a gift from Adam Cohen
(RRID: Addgene_107700) (12). It contained the human synapsin 1 promoter to restrict protein
expression to neurons and not glia. The plasmid also contained necessary elements to create a
viral vector for transduction.
Magnet-assisted transfection
For magnet-assisted transfection, Magnetofection™ (OZ Biosciences) kit was used. Plasmid
was isolated and mixed with magnetic nanoparticles in OptiMEM™ (GIBCO) medium. The
mixture was added to the cells and placed on a magnetic plate for 20 minutes.
Adeno-associated virus (AAV)
HEK293 cells were cultured in order to be used to accommodate virus formation. The
Optopatch plasmid contained some necessary elements for AAV formation. It was added along
with two additional plasmids, one for capsid formation (RC-DJ) and one with a helper sequence
to allow for replication. After creation, the virus could be used to transduce neurons.
Ethics
One advantage of stem-cell research is the avoidance of live-animal expenditure. Unfortunately,
as iPSC-derived neurons proved difficult to perform experiments on within the time frame of
this project, primary neurons harvested from mouse pups had to be examined as an alternative.
This was done in accordance with ethical permit 134-2015 from the Gothenburg ethical
committee for animal research. Stem cell-derived neurons remain the targets of future testing.

16
Results
Calcium phosphate transfection and viral transduction were successful. Viral delivery showed
a high yield (10-50% of cells expressed Optopatch) and a higher expression of QuasAr with a
seemingly large signal-to-noise ratio. Calcium phosphate showed a lower yield (1-2%) and a
seemingly lower signal-to-noise ratio. The magnet-assisted transfection method did yield some
transfected cells but resulted in no QuasAr function.
CheRiff
CheRiff could be verified by illuminating it with blue light while measuring currents in a
transfected neuron with the patch clamp electrode. CheRiff function was apparent in both
induced and primary neurons, while expression in iPSC-derived neurons could not be verified.
1
2
Figure 4: Voltage clamp recording on a primary neuron. In [1], the membrane potential (baseline) is kept at -72 mV.
Continuous stimulation with the 473 nm laser yields a large current (1,2 µA) that slowly diminishes over time (1,7 s). In [2],
the membrane potential (baseline) is kept at -22 mV. Pulsating stimulation (10 ms pulses at 10 Hz) with the 473 nm laser.
Spontaneous post-synaptic potentials are also apparent.
17
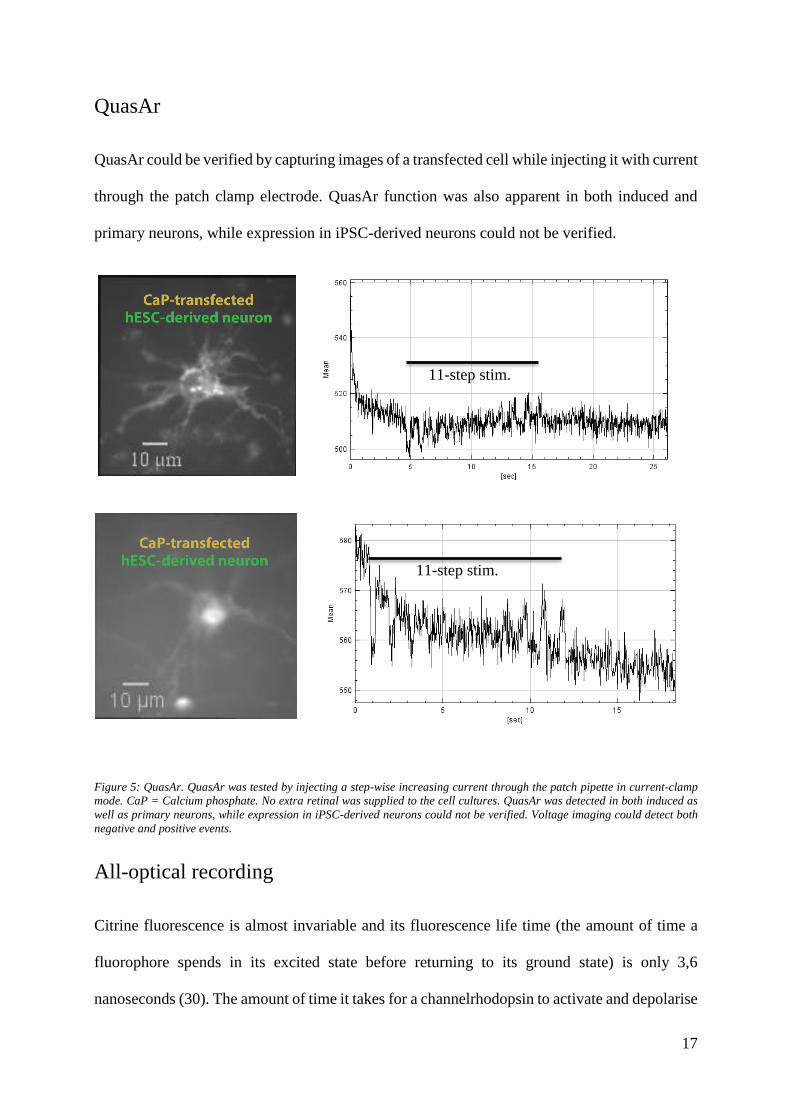
QuasAr
QuasAr could be verified by capturing images of a transfected cell while injecting it with current
through the patch clamp electrode. QuasAr function was also apparent in both induced and
primary neurons, while expression in iPSC-derived neurons could not be verified.
Figure 5: QuasAr. QuasAr was tested by injecting a step-wise increasing current through the patch pipette in current-clamp
mode. CaP = Calcium phosphate. No extra retinal was supplied to the cell cultures. QuasAr was detected in both induced as
well as primary neurons, while expression in iPSC-derived neurons could not be verified. Voltage imaging could detect both
negative and positive events.
All-optical recording
Citrine fluorescence is almost invariable and its fluorescence life time (the amount of time a
fluorophore spends in its excited state before returning to its ground state) is only 3,6
nanoseconds (30). The amount of time it takes for a channelrhodopsin to activate and depolarise
11-step stim.
11-step stim.

18
the cell membrane is on a scale of micro- to milliseconds (31). No control cell line without the
cell marker Citrine was available. Therefore, to eliminate any hypothetical Citrine fluorescence
leakage through the optical filters, the change in intensity from the first recorded frame has been
subtracted from every stimulation. This was done only to prove Optopatch function on a basic
level with certainty, and will not have be done regularly after future optimisations.
stim stim stim
stim
Figure 6: Recording of three second-
long laser stimulations without patch
clamp. ~40 frames per second. [1]
and [2] are traced from the same
recording. In [2], any unwanted
contributions by Citrine has been
mathematically subtracted post-
recording. Much of the QuasAr
response is gone as well but the result
is purely QuasAr and this is sufficient
to prove the AOR concept on a very
basic level.
1
2
Figure 7: Recording from one
five-second-long stimulation. ~40
frames per second. Trace [2] has
been modified in the same way as
in the previous figure.
1
2

19
Spontaneous activity
Figure 8: Observing QusasAr for two and a half minutes without patching or optically stimulating. Here, [1] is plotted from a
seemingly active cell expressing QuasAr while [2] is plotted from autofluorescent material visible in the same images. Both
traces are from the same recording. In [1], what looks like spontaneous neural activity can be seen, while [2] is silent.
Figure 9: An oddly shaped and behaved neuron, recorded for three minutes. A spontaneous periodic activity of
hyperpolarization was observed in this neuron. It could not be confirmed by patch clamping because of technical difficulties.
Also, a slow but steady slope indicating bleaching became apparent when recording for a longer while.
1
2
1
2

20
Discussion
The main goal was achieved, such that the function of CheRiff as well as QuasAr were verified
and that all-optical recordings could be performed on a proof-of-concept level. Viral
transduction seemed to be the favourable way of delivering the Optopatch construct into the
cells.
Before the set-up can be used in future studies, further effort needs to be put into exploring its
limits and standardising the procedure. One main goal is to observe action potentials. This is
achievable on a hardware basis, meaning the camera used can capture images at a high enough
framerate, but this demands a short shutter time and thus more light, creating some obstacles.
Another goal is to expand the field of view, watching neighbouring cells communicate with
each other.
The possibilities with all-optical electrophysiology are vast. The neuronal effects of certain
pharmaceutics, environmental factors, genetic diseases, toxins or other circumstances can with
these methods be examined on a large scale. Since impressive research already has been made
on the subject with recent advancements (12, 32), the intention to implement Optopatch in our
lab is not far-fetched. It is rather a natural step towards future discoveries.
Interpretation
In short, one would like Optopatch to provide traces similar in shape to those achieved by
traditional patch clamp recordings. The optogenetic proteins used are theoretically fast and
dynamic enough (15) to represent the shape and frequency of electrical events well. In order to
achieve interpretable traces, framerate must be increased while noise is kept at a low level.

21
Optopatch cannot physically measure the voltage level, only provide images representing it.
The recorded images contain varying pixel intensities (grey levels) that need to be translated.
Additional effort needs to be put into working out how to treat the data, and how comparable it
is to patch clamp measurements. No specific unit of light intensity is used. When analysing the
traces, ΔF/F0—the change in fluorescence divided by the baseline—will be the output.
The camera sees what the camera sees. Environmental changes like water level fluctuations in
the bath will in some way affect how light scatters and thus must be stable so as not to interfere
with QuasAr emissions. Insoluble particles disturb images. A speck of dust or a loose cell
floating by out of focus will affect recordings and therefore the bath solution needs to be kept
clean and clear.
Limitations
Searching light
Finding cells expressing Optopatch and stimulating them are both achieved by illuminating the
culture with the same laser. The excitation spectrum of Citrine overlaps with that of CheRiff.
This poses a problem. One would want to stimulate cells as little as possible when not
performing measurements, to limit any possible alterations in neuronal functionality and to keep
any dissimilarities between tests at a minimal level. A possible solution to this would be to add
an additional laser to the set-up with its wavelength at the excitation peak of Citrine – 516 nm.
This would allow for a weaker power of the “searching light” which would minimise CheRiff
activity and neural excitation.

22
Calcium influx
CheRiff, like most channelrhodopsins, is a non-specific cation channel (16). Continuous
stimulation will therefore lead to an influx of calcium into the cell, which is problematic.
Calcium in high concentrations is among other things a death signal to the neuron (33),
triggering apoptosis. In lower levels it might also cause intracellular events such as synaptic
alterations (34). Although not characterised in this project, this calcium influx is a potential
disturbing factor when working with Optopatch since it might interfere with the tight
physiological regulation of intracellular calcium levels.
Non-physiological environment
The integration of large amounts of “unnatural” ion channels into the neuronal membrane might
affect the permeability and intrinsic behaviour of cells. One other important aspect to consider
is that the level of Optopatch protein expression must be similar between similar neurons for
the neurons to be compared.
Photobleaching
When shined upon, fluorescent molecules are always bleached to some degree. Photobleaching
is an unwanted transfer of the energy absorbed by the opsin. In a perfect optogenetic set-up,
every fluorescent molecule will absorb the photon and re-emit a photon with a longer
wavelength with the rest of the energy converted into harmless energy forms. However, with a
given risk depending on the strength of the laser and the properties of the chromophore,
sometimes the energy will break covalent bonds (35) or cause the molecule to interact with
other proteins in a harmful manner. Thus, the more light is used to illuminate the culture, the
less the cells will function and the more harm they will take. Measurements over longer periods
of time are therefore difficult. For the experimenter, the only way to avoid photobleaching is to

23
minimise the energy put in to illuminate the cells, in this case the power of the 638 nm laser.
This creates an apparent conflict since stronger illumination leads to an increased signal-to-
noise ratio in the captured images.
Photobleaching can be accounted for when interpreting data. A slow decline in intensity is to
be expected when observing QuasAr, as photobleaching will cause it to fade steadily. By
applying a ΔF/F formula (36) to the diminishing baseline, bleaching can be corrected for.
Events are compared what the baseline was before and after. These calculations have not been
applied to the presented data.
Optimisation
Calibration
In order to interpret data from voltage imaging one needs to know what changes in fluorescence
corresponds to in terms of voltage. By comparing voltage steps with recorded changes in
brightness as well as changes in voltage achieved by different levels of laser stimulation, patch
clamp measurements can be utilised to quantify Optopatch function.
Area of stimulation
Though not utilised in this project, the digital multi-mirror device allows for a considerable
precision when illuminating an area (37). By applying different patterns to the DMD, the size
and shape of the illuminated area can be specified, and several cells can be stimulated
simultaneously. This could also evolve into targeting certain parts of the cell or cell-to-cell
connections. All-optical recordings can in this light be advantageous to traditional patch clamp
recordings that target the whole cell.

24
Retinal
The question arose during the process if and how to add cofactor. Retinal is vital for the function
of opsins since it functions as the chromophore absorbing light. It is also the observable light-
emitting molecule in QuasAr. Retinal is a form of vitamin A and thus cannot be produced by
mammalian cells. Whether or not retinal has to be supplied to cell cultures remains unanswered.
Some laboratories add it (15) while others don’t. It is obvious that cells studied in this project
contained the molecule in some form. The question remains if saturating cells with additional
retinal can boost voltage sensitivity.
Conclusions
The basal concept of all-optical recording was proved to function. Viral transduction with AAV
seemed to be the favourable method of gene delivery while the goal of using iPSC-derived
neurons for these recordings remains to be realised. The kinetics and stability of both CheRiff
and QuasAr were impressive, and neurons seemed to survive for a reasonable amount of time
throughout testing.
Acknowledgements
This project was made possible by the previous efforts of Johan Tolö, who not only built the
set-up, but also devoted invaluable time and knowledge to the project. Helena Delgado and
Dzeneta Vizlin Hodzic tirelessly provided cells and support. Fredrik Sterky, Berta Marcó de la
Cruz and Debora Kaminski contributed massively when time became scarce. Endless gratitude
goes to my main supervisor Henrik Seth who supported, taught, laughed, solved problems and
continuously provided answers to every question.

25
Populärvetenskaplig sammanfattning
Att studera enstaka nervceller och deras elektriska egenskaper har länge begränsats av att
gängse mätmetoder varit tidskrävande och svåra att bemästra. Patch clamp-mätningar har varit
den gyllene standarden sedan början av 80-talet. Med metoden öppnas en cell under stor
försiktighet med hjälp av en liten pipett innehållandes en silverkloridbeklädd elektrod. Denna
metod används för att göra elektriska mätningar och kan även injicera ström i cellen.
Ända sedan optogenetikens inträde i forskningsvärlden kring millennieskiftet har
förhoppningen att heloptiskt kunna avbilda och mäta cellers elektriska aktivitet funnits. Stora
framsteg har gjorts de senaste åren och de optiska metoderna börjar få ordentligt fotfäste inom
neurofysiologin och andra områden. Verktyget "Optopatch" tillåter användaren att både optiskt
stimulera och avbilda nervceller, efter att de modifierats till att uttrycka särskilda optogenetiska
proteiner. För att detta ska ske i vår forskargrupp behöver metoden testas och utvärderas
noggrant för att belysa dess möjligheter och begränsningar. Med heloptiska metoder öppnas
nya dörrar för storskalig karaktärisering på cellulär nivå av sjukdomar drabbande nervsystemet.
Optogenetiken handlar om användandet av ljusproteiner (opsiner) som hjälpmedel vid
studerandet av cellers elektriska aktivitet. Opsiner hämtade från mikroorganismer introduceras
i cellerna på konstgjord väg. Optopatch-konstruktet innehåller två modifierade opsiner som
tillåter mätningar. Ett ”kanalrodopsin” vid namn CheRiff fungerar som ett ställdon. Det är en
ljuskänslig jonkanal som aktiveras och då tillåter införsel av positiva joner genom
cellmembranet (depolariserar) när den belyses med blått ljus. Det andra opsinet—QuasAr—
fungerar som en spänningssensor och självlyser (fluorescerar) i rött när cellmembranet
depolariseras. Genom att fånga upp fluorescensen med en höghastighetskamera kopplad till
mikroskopet kan elektrisk aktivitet fångas på bild och nervcellerna kan därmed både stimuleras

26
och avbildas med optiska metoder. Detta möjliggör storskaliga undersökningar av enstaka
nervceller.
Målet med projektet var att få metoden att fungera. Optopatch kunde uttryckas i odlade
nervceller och båda komponenternas funktioner bevisades med hjälp av simultana patch clamp-
mätningar. Opsinerna verkade vara synnerligen stabila. Kvarstår gör ytterligare testning och
utökade experiment för att i forskargruppen kunna utnyttja Optopatch för robusta, storskaliga
mätningar i framtida studier.

27
References
1. Forsberg M, Seth H, Bjorefeldt A, Lyckenvik T, Andersson M, Wasling P, et al. Ionized
calcium in human cerebrospinal fluid and its influence on intrinsic and synaptic excitability of
hippocampal pyramidal neurons in the rat. J Neurochem. 2019;149(4):452-70.
2. Mi Z, Yang J, He Q, Zhang X, Xiao Y, Shu Y. Alterations of Electrophysiological
Properties and Ion Channel Expression in Prefrontal Cortex of a Mouse Model of
Schizophrenia. Front Cell Neurosci. 2019;13:554.
3. Knopfel T, Song C. Optical voltage imaging in neurons: moving from technology
development to practical tool. Nat Rev Neurosci. 2019;20(12):719-27.
4. Hodgkin AL, Huxley AF. A quantitative description of membrane current and its
application to conduction and excitation in nerve. J Physiol. 1952;117(4):500-44.
5. Hamill OP, Marty A, Neher E, Sakmann B, Sigworth FJ. Improved patch-clamp
techniques for high-resolution current recording from cells and cell-free membrane patches.
Pflügers Archiv. 1981;391(2):85-100.
6. Zemelman BV, Nesnas N, Lee GA, Miesenbock G. Photochemical gating of
heterologous ion channels: remote control over genetically designated populations of neurons.
Proc Natl Acad Sci U S A. 2003;100(3):1352-7.
7. Nagel G, Ollig D, Fuhrmann M, Kateriya S, Musti AM, Bamberg E, et al.
Channelrhodopsin-1: a light-gated proton channel in green algae. Science.
2002;296(5577):2395-8.
8. Kiskinis E, Kralj JM, Zou P, Weinstein EN, Zhang H, Tsioras K, et al. All-Optical
Electrophysiology for High-Throughput Functional Characterization of a Human iPSC-Derived
Motor Neuron Model of ALS. Stem Cell Reports. 2018;10(6):1991-2004.
9. Yang HH, St-Pierre F, Sun X, Ding X, Lin MZ, Clandinin TR. Subcellular Imaging of
Voltage and Calcium Signals Reveals Neural Processing In Vivo. Cell. 2016;166(1):245-57.
10. Marvin JS, Borghuis BG, Tian L, Cichon J, Harnett MT, Akerboom J, et al. An
optimized fluorescent probe for visualizing glutamate neurotransmission. Nat Methods.
2013;10(2):162-70.
11. Xu Y, Zou P, Cohen AE. Voltage imaging with genetically encoded indicators. Curr
Opin Chem Biol. 2017;39:1-10.
12. Adam Y, Kim JJ, Lou S, Zhao Y, Xie ME, Brinks D, et al. Voltage imaging and
optogenetics reveal behaviour-dependent changes in hippocampal dynamics. Nature.
2019;569(7756):413-7.
13. Griesbeck O, Baird GS, Campbell RE, Zacharias DA, Tsien RY. Reducing the
environmental sensitivity of yellow fluorescent protein. Mechanism and applications. J Biol
Chem. 2001;276(31):29188-94.
14. Penzkofer A, Silapetere A, Hegemann P. Photocycle Dynamics of the Archaerhodopsin
3 Based Fluorescent Voltage Sensor QuasAr1. Int J Mol Sci. 2019;21(1).
15. Hochbaum DR, Zhao Y, Farhi SL, Klapoetke N, Werley CA, Kapoor V, et al. All-
optical electrophysiology in mammalian neurons using engineered microbial rhodopsins. Nat
Methods. 2014;11(8):825-33.
16. Zhang H, Reichert E, Cohen AE. Optical electrophysiology for probing function and
pharmacology of voltage-gated ion channels. Elife. 2016;5.
17. Purves D AG, Fitzpatrick D, et al., editors. Neuroscience. 2nd ed. Sunderland (MA):
Sinauer Associates; 2001.
18. Mondal PP. Temporal resolution in fluorescence imaging. Front Mol Biosci. 2014;1:11.
28
19. Loguinova MY, Zagidullin VE, Feldman TB, Rostovtseva YV, Paschenko VZ, Rubin
AB, et al. Spectral characteristics of fluorophores formed via interaction between all-trans-
retinal with rhodopsin and lipids in photoreceptor membrane of retina rod outer segments.
Biochemistry (Moscow) Supplement Series A: Membrane and Cell Biology. 2009;3(2):134-43.
20. Werley CA, Brookings T, Upadhyay H, Williams LA, McManus OB, Dempsey GT.
All-Optical Electrophysiology for Disease Modeling and Pharmacological Characterization of
Neurons. Curr Protoc Pharmacol. 2017;78:11 20 1-11 20 4.
21. Meijer M, Rehbach K, Brunner JW, Classen JA, Lammertse HCA, van Linge LA, et al.
A Single-Cell Model for Synaptic Transmission and Plasticity in Human iPSC-Derived
Neurons. Cell Rep. 2019;27(7):2199-211 e6.
22. Takahashi K, Yamanaka S. Induction of pluripotent stem cells from mouse embryonic
and adult fibroblast cultures by defined factors. Cell. 2006;126(4):663-76.
23. Beyene R, Boockvar JA. Disease-specific induced pluripotent stem cells. Neurosurgery.
2008;63(6):12.
24. Mehta SR, Tom CM, Wang Y, Bresee C, Rushton D, Mathkar PP, et al. Human
Huntington's Disease iPSC-Derived Cortical Neurons Display Altered Transcriptomics,
Morphology, and Maturation. Cell Rep. 2018;25(4):1081-96 e6.
25. Yang N, Ng Yi H, Pang Zhiping P, Südhof Thomas C, Wernig M. Induced Neuronal
Cells: How to Make and Define a Neuron. Cell Stem Cell. 2011;9(6):517-25.
26. Ray J, Peterson DA, Schinstine M, Gage FH. Proliferation, differentiation, and long-
term culture of primary hippocampal neurons. Proc Natl Acad Sci U S A. 1993;90(8):3602-6.
27. Plank C, Scherer F, Schillinger U, Bergemann C, Anton M. Magnetofection: enhancing
and targeting gene delivery with superparamagnetic nanoparticles and magnetic fields. J
Liposome Res. 2003;13(1):29-32.
28. Prosen L, Prijic S, Music B, Lavrencak J, Cemazar M, Sersa G. Magnetofection: a
reproducible method for gene delivery to melanoma cells. Biomed Res Int. 2013;2013:209452.
29. Chen Y. Calcium Phosphate Transfection of Eukaryotic Cells. Bio-protocol.
2012;2(3):e86.
30. Sands B, Jenkins P, Peria WJ, Naivar M, Houston JP, Brent R. Measuring and sorting
cell populations expressing isospectral fluorescent proteins with different fluorescence
lifetimes. PLoS One. 2014;9(10):e109940.
31. Ferenczi EA, Tan X, Huang CL-H. Principles of Optogenetic Methods and Their
Application to Cardiac Experimental Systems. Frontiers in Physiology. 2019;10(1096).
32. Williams LA, Joshi V, Murphy M, Ferrante J, Werley CA, Brookings T, et al. Scalable
Measurements of Intrinsic Excitability in Human iPS Cell-Derived Excitatory Neurons Using
All-Optical Electrophysiology. Neurochem Res. 2019;44(3):714-25.
33. Granatiero V, Pacifici M, Raffaello A, De Stefani D, Rizzuto R. Overexpression of
Mitochondrial Calcium Uniporter Causes Neuronal Death. Oxid Med Cell Longev.
2019;2019:1681254.
34. Kornijcuk V, Kim D, Kim G, Jeong DS. Simplified calcium signaling cascade for
synaptic plasticity. Neural Netw. 2019;123:38-51.
35. Kefalov VJ, Estevez ME, Kono M, Goletz PW, Crouch RK, Cornwall MC, et al.
Breaking the covalent bond--a pigment property that contributes to desensitization in cones.
Neuron. 2005;46(6):879-90.
36. Lou S, Adam Y, Weinstein EN, Williams E, Williams K, Parot V, et al. Genetically
Targeted All-Optical Electrophysiology with a Transgenic Cre-Dependent Optopatch Mouse. J
Neurosci. 2016;36(43):11059-73.
37. Farhi SL, Parot VJ, Grama A, Yamagata M, Abdelfattah AS, Adam Y, et al. Wide-Area
All-Optical Neurophysiology in Acute Brain Slices. J Neurosci. 2019;39(25):4889-908.

29
Supplementary figure
Supplementary figure 1: The plasmid