optimizing nutrition in the critically ill patient€¦ · optimizing nutrition in the ... deficit...
TRANSCRIPT

4/5/2012
1
Optimizing Nutrition in the Critically Ill Patient
Nutrition and Critical Care What Do We KnowMark H DeLegge, MD
Medical University of SC
Critical Care and Nutrition
Malnutrition in critical care patients
Nutrition interventions (enteral and parenteral) Protein and the ICU
Lipids and the ICU
Compounded versus pre-mixed PN
Supplemental PN
Malnutrition

4/5/2012
2
Characteristics of Critical Care Patients
• Heterogeneous population1-3
– Age range and prior health status– Diagnosis and severity of disease– Metabolic requirements and catabolic stress status– Gastrointestinal function
• Surgical, medical, trauma, transplant, burn, and septic patients with long-term intensive care unit (ICU) stay1,2,4
• Inflammatory response with organ function support orfailure1,4
• Worsening oxidative stress, which further promotes inflammation and organ failure3
1. Kreymann KG, et al. Clin Nutr. 2006;25(2):210-223.2. McClave SA, et al. JPEN J Parenter Enteral Nutr. 2009;33(3):277-316.
3. Abilés J, et al. Crit Care. 2006;10(5):R146.4. Singer P, et al. Clin Nutr. 2009;28(4):387-400.
Malnutrition in the ICU• Approximately 40% of ICU patients are
malnourished1,2
– High catabolic stress leads to increased metabolic needs2,3
• Malnutrition is associated with poorer outcomes4
Variable F P value
Relationship Between Cumulative Energy Deficit and Clinical Outcome
1. Heyland DK, et al. JPEN J Parenter Enteral Nutr. 2003;27(5):355-373.2. Singer P, et al. Clin Nutr. 2009;28(4):387-400.
3. Griffiths RD, Bongers T. Postgrad Med J. 2005;81(960):629-636.4. Villet S, et al. Clin Nutr. 2005;24(4):502-509.
Length of stay 25.18 0.0001
Complications 15.15 0.0003
Infections 9.14 0.0042
Days on antibiotics 17.48 0.0003
Days of mechanical ventilation
17.12 0.0002
Malnutrition in Critically III Patients
• Excess costs for Patients with a likelihood of malnutrition1
– $5,575 per Surgery Patient
– $2,477 per Medical Patient• Elderly represent 12.4% of
Population, but 36% of healthExcess
Excess Cost $
e($
)
Increased Costs for Patients With a Likelihood of Malnutrition
care costs2
• Those malnourished at admission had hospital charges that were double patients without malnutrition3
• Average LOS was 5.6 days longer than patients without malnutrition3
Source: 1. Reilly JJ, Jr., Hull SF, Albert N, et al. JPEN. 1988;12:371-376; 2. AHRQ: Research In Action, June 2006, Issue 19; 3. Robinson G, Goldstein M, and Levine GM. JPEN. 1987;11:49-51.
Excess Cost $
Tota
l Ch
arg
e
(n= (n=
P<.P<.01

4/5/2012
3
Nutritional Needs of Critical Care Patients
• Carbohydrates: 3 - 5 g/kg/day (minimum 2 g/kg/day)1-3
– Based on blood glucose concentrations3
• Lipids: 1 to 2 g/kg/day2
– Provide a high-density energy source and essential fatty acids (FA)2
• Protein: 1.2 to 1.5 g/kg/day1-5 (True??)– Target non-protein calorie/nitrogen ratio4 of 70:1 to 100:1
– Administration of 0.2 to 0.5 g/kg/day of L-glutamine2,4
• Supplemental multivitamins and trace elements1-4
1. Kreymann KG, et al. Clin Nutr. 2006;25(2):210-223.2. Singer P, et al. Clin Nutr. 2009;28(4):387-400.3. Chan S, et al. Chest. 1999;115(5 suppl):145S-148S.
4. McClave SA, et al. JPEN J Parenter Enteral Nutr. 2009;33(3):277-316.5. Griffiths DK, Bongers T. Postgrad Med J. 2005;81(960):629-636.
Critical Care and Nutrition
Malnutrition in critical care patients
Nutrition interventions (enteral and parenteral) Protein and the ICU
Lipids and the ICU
Compounded versus pre-mixed PN
Supplemental PN
• Prospective, observational study of 50 ICU patients
– Criteria >96 h of mechanical ventilation
– Indirect calorimetry (IC) used to assess daily energy balance
• Cumulative negative energy balance was 4 767 kcal for
Negative Energy Balance Has Been Correlated With Complications
Correlation of Total Complications to Negative Energy Balance
7
8
9
10
Source: Dvir D, et al. Clin Nutr. 2006;25:37-44
balance was 4,767 kcal for ICU stay
– 22% had a negative caloric balance >10,000 kcal
– 30% had a negative caloric balance of 4000-10,000 kcal
• Negative energy balance correlated with complications in the ICU (P<0.01)
– ARDS, sepsis, renal failure, renal replacement therapy
Tota
l Co
mp
licat
ion
s
0
1
2
3
4
5
6
7
0-2
000
-400
0
-600
0
-800
0
-100
00
-120
00
-140
00
-160
00
-180
00
-200
00
Max Negative Energy Balance (kcal)

4/5/2012
4
Positive Nutrition Balance Is Associated With Better Outcome Proper nutritional support can improve clinical
outcomes in critical care patients1,2
Figure is from Bartlett RH, et al. Surgery. 1982;92(4):771-779.1. Singer P, et al. Clin Nutr. 2009;28(4):387-400.2. McClave SA, et al. JPEN J Parenter Enteral Nutr. 2009;33(3):277-
316.
Caloric balance (kcal)
ACCEPT Trial: Improved Survival is Associated with Increased Nutrition• Cluster randomized trial of
499 patients (1998), in 14 hospitals, intervention (protocol) versus control
• Interventions include evidence based 35
40
InterventionControl
Appropriately Randomized Hospitals
37
P= 0.058P= 0.003
Martin CM, Doig GS, Heyland DK, et al. CMAJ. 2004;170:197-204.
e de ce basedalgorithms to improve nutritional support and its effort on patient outcomes
• Intervention group had significantly lower hospital LOS and trend in reduced mortality
0
5
10
15
20
25
30
Mortality% LOS hospital(days)
LOS ICU (days)
P= 0.7
Early Feeding Improves Outcomes
CharacteristicEarly feeding*
(n = 374)Late feeding*
(n = 835) P value
Mean age ± SD, y 59.3 ± 17.2 61.2 ± 17.5 0.07
Gender, male/female 235/139 525/307 0.2
Mortality, ICU, n (%) 50 (13.4) 155 (18.6) 0.026
Mortality, hospital, n (%) 70 (18.7) 202 (24.2) 0.035y, p , (%) ( ) ( )
Mean ICU length of stay ± SD, days 13.8 ± 12.5 13.3 ± 11.4 0.49
Mean hospital length of stay ± SD, days 33.4 ± 34.0 32.2 ± 26.7 0.52
Sepsis, n (%) 92 (24.6) 250 (29.9) 0.056
Acute kidney failure, n (%) 38 (10) 120 (14.4) 0.044
Mean mechanical ventilation ± SD, days 10.3 ± 10.5 9.5 ± 10.0 0.22
Mean NPG energy ± SD, kcal/days 2732 ± 1136 499 ± 458 0.001
Pichard C, et al. Clin Nutr Suppl. 2008;3:7.
SD, standard deviation; ICU, intensive care unit; NPG, non-parenteral glucose*Early feeding: >1500 kcal (besides parenteral glucose) on Days 1-3; late feeding: <1500 kcal(besides parenteral glucose) on Days 1-3.

4/5/2012
5
• Retrospective analysis of 4049 patients prospectively collected large multi-institutional ICU database requiring mechanical ventilation for >2 days
– Early feed group: n = 2537 (63%)
Effects of Early Enteral Feeding in Critically Ill Patients
Survival Curve Comparing Early and Late Feeding Groups in Matched Analysis
Early Feeding
Artinian V, Krayem H and DiGiovine B. Chest. 2006;129:960-967
– Late feed group: n = 1512 (37%)
• Early feeding significantly reduces ICU and hospital based mortality
– Early feed had significantly higher rate of survival (p=.001)
Early Feeding
Late Feeding
Days Post-Intubation
Per
cent
Sur
viva
l
Enteral Nutrition is Preferred to Parenteral Nutrition
• Gut stimulation of immune system
• Enteral vs parenteral meta-analysis and infections
General Beliefs:
• Protection of gut mucosa
• Avoidance of bacterial translocation
• Reduced associated complications
– Infections
• Cost
Early Feeding Improves ICU Mortality• Artificial nutrition (EN and/or PN) should be initiated
early in patients with critical illness– Early EN versus PN: no difference in effect on mortality
– Delayed EN versus PN: significant mortality benefit with PNMeta-analysis of the Effect of EN Versus PN on Mortality
Figure created using data from Simpson F, Doig GS. Intensive Care Med. 2005;31(1):12-23.
TPN, total parenteral nutrition; EN, enteral nutrition.*Early EN defined as 24 hours post-ICU admission or injury.Values shown are the odds ratios with their associated 95% confidence interval.

4/5/2012
6
How Important is Protein?
Retrospective Review of 53 Papers: Total Protein Loss
Normals
Patients
Kreyman et al. Clin Nutr 2012
Modell:v17=a*v18**b
y=(101.617)*x**(-.86525)
1.6
1.8
2.0
2.2
2.4
2.6
2.8
3.0
3.2
otal protein lo
ss (g/kg)
Protein Loss and E/N Ratio
ss(g/kg)
50 100 150 200 250 300 350 400 450
E/N ratio
0.4
0.6
0.8
1.0
1.2
1.4
to
E/N ratio (kcal/g)
total proteinlos
Kreyman et al. Clin Nutr 2012

4/5/2012
7
Protein Content of Nutrition and Survival Rate of Sepsis
Peck MD et al. 1989
Annals of Surgery*Correlated with Survival
Key Guidelines for Critical Care Patients• Patients who are not expected to be on a full oral diet within
3 days should receive supplemental nutrition1,2
• Enteral nutrition (EN) is preferred whenever possible1-3
• Initiate PN within 24 to 48 hours if EN is contraindicated or
not well tolerated1,2not well tolerated• 10% to 20% of ICU patients have very limited tolerance or a
contraindication to EN2
• Examples: bowel obstruction, short bowel syndrome, abdominal compartment syndrome, mesenteric ischemia2
• Supplementation with parenteral nutrition (PN) is important
if EN alone is insufficient1-3
1. Kreymann KG, et al. Clin Nutr. 2006;25(2):210-223.2. Singer P, et al. Clin Nutr. 2009;28(4):387-400.3. McClave SA, et al. JPEN J Parenter Enteral Nutr. 2009;33(3):277-316.
Algorithm for Selecting a Feeding Route
Adequate nutrition status?
Oral diet; reassess nutrition status regularly.Simple IV to maintain hydration if necessary
Withhold major treatments that are not necessary; select feeding route
Yes No
Functional GI tract?
Appetite satisfactory and physically able to eat? Parenteral nutrition
Oral diet supplement as necessary
Enteral nutrition by feeding tube
NoYes
Yes No
If status changes
If intake is inadequate
Figure reproduced with permission from Rolfes SR, et al. In: Understanding Normal and Clinical Nutrition, 7th ed. Belmont, CA: Wadsworth; 2006:676.
If intake is inadequate, supplement with parenteral nutrition

4/5/2012
8
Is There a Paradox?
Nutrition is important in the critically ill patient
Enteral nutrition is economical and stimulates the gut’s immune system leadingstimulates the gut s immune system leading to better outcomes
Parenteral nutrition is associated with many complications and should be reserved to be used as the “last resort.”
Inadequate Delivery of Enteral Nutrition Is Common
• Frequent problems are associated with the delivery and tolerance of EN
% of Nutritional Goal* Met by Enterally Fed Patients
Cleveland, OHNashville, TNChicago, ILBaltimore. MD
Study Site
52%129
5955
39
# Patients
50-70%64%
50%
% of Goal
• Discrepancies exist between the delivered vs. prescribed EN
1. Krishnan JA, Parce PB, Martinez A, et al. Chest. 2003;124:297-305.; 2 . Elpern EH, Stutz L, Peterson S, et al. Am J Crit Care. 2004;13:221-227.; 3. Rice TW, Swope T, Bozeman S, et al. Nutrition. 2005;21:786-792.; 4. O'Leary-Kelley CM, Puntillo KA, Barr J, et al. Am J Crit Care. 2005;14:222-231.; 5. Higgins PA, Daly BJ, Lipson AR, et al. Am J Crit Care. 2006;15:166-176.; 6. Hise ME, Halterman K, Gajewski BJ, et al. J Am Diet Assoc. 2007;107:458-465.; 7. O'Meara D, Mireles-Cabodevila E, Frame F, et al. Am J Crit Care. 2008;17:53-61.
Kansas City, KS
Cleveland, OH
Palo Alto, CA
Study Site
77
360
60# Patients
44-50%
14%
32%% Patients
% Enterally Fed Patients Meeting Nutritional Goal*
Complications Related to Upper Digestive Intolerance
4341
40
45
50Tolerated EN Upper Digestive Intolerance
GI Intolerance Has Been Associated
With Complications in EN Patients• Prospective, observational
study of 153 ICU patients on EN (NG tube)
• 46% patients developed GI intolerance– Median intolerance 2 days
Mentec H, Dupont H, Bocchetti M, et al. Crit Care Med. 2001;29:1955-1961.
24
15
2523
0
5
10
15
20
25
30
35
Pneumonia (%) ICU LOS (Days) ICU Mortality (%)
y
– ↓ Nutritional intakes
– ↑ In patients receiving sedation or catecholamines
• GI intolerance during EN was associated with– ↑ Nosocomial pneumonia
– ↑ ICU stay
– ↑ ICU mortality
4/5/2012
9
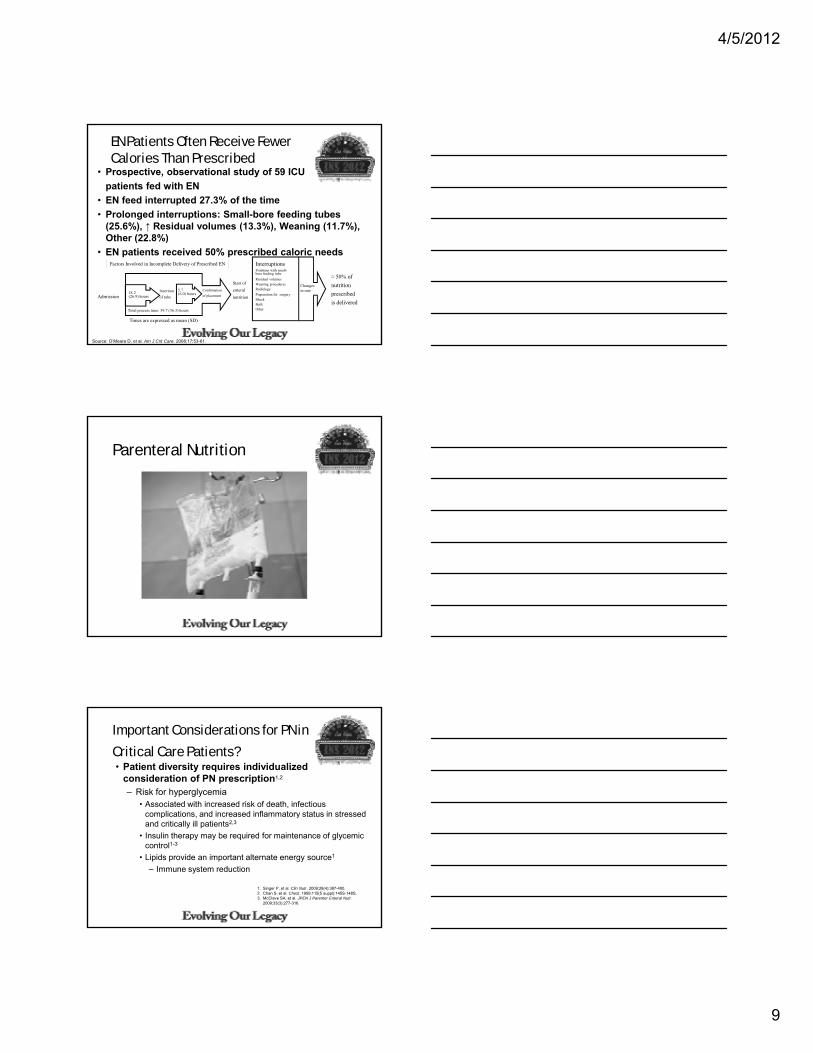
EN Patients Often Receive Fewer Calories Than Prescribed
• Prospective, observational study of 59 ICU
patients fed with EN
• EN feed interrupted 27.3% of the time
• Prolonged interruptions: Small-bore feeding tubes (25.6%), ↑ Residual volumes (13.3%), Weaning (11.7%), Oth (22 8%)
Source: O’Meara D, et al. Am J Crit Care. 2008;17:53-61.
Other (22.8%)
• EN patients received 50% prescribed caloric needs
Total process time: 39.7 (36.3) hours
Start of
enteral
nutrition
InterruptionsProblems with small-bore feeding tube
Residual volumesWeaning proceduresRadiology
Preparation for surgeryShockBathOther
Changes in rate
≈ 50% of
nutrition
prescribed
is deliveredAdmission
(26.9) hours
6.0) hours
Insertion
of tube
Confirmation
of placement
Factors Involved in Incomplete Delivery of Prescribed EN
Times are expressed as mean (SD)
Parenteral Nutrition
Important Considerations for PN in
Critical Care Patients?• Patient diversity requires individualized
consideration of PN prescription1,2
– Risk for hyperglycemia• Associated with increased risk of death, infectious
complications, and increased inflammatory status in stressed p , yand critically ill patients2,3
• Insulin therapy may be required for maintenance of glycemic control1-3
• Lipids provide an important alternate energy source1
– Immune system reduction
1. Singer P, et al. Clin Nutr. 2009;28(4):387-400.2. Chan S, et al. Chest. 1999;115(5 suppl):145S-148S.3. McClave SA, et al. JPEN J Parenter Enteral Nutr.
2009;33(3):277-316.
4/5/2012
10
Benefits of Hyperglycemic Control
• Critically ill patients often develop hyperglycemia,
which may lead to infection, polyneuropathy, and other serious complications
• In a large, prospective, randomized, controlled trial, tight glucose control (≤110 mg/dL) with intensive insulin therapy decreased ICU and hospital mortality versus conventional t t ttreatment
Reprinted with permission from Van den Berghe G, et al. N Engl J Med. 2001;345(19):1359-1367.
Critical Care and Nutrition
Malnutrition in critical care patients
Nutrition interventions (enteral and parenteral) Protein and the ICU
Lipids and the ICU
Compounded versus pre-mixed PN
Supplemental PN
Important Considerations for PN in Critical Care (cont)
• Biological effects of lipid emulsions (LEs) depend on the composition and quantity of FA1
– Polyunsaturated FA (PUFA; -6 and -3) are preferential targets for free radical attack and oxidative damage2
– High content of -6 PUFA may exacerbate the elevated g yinflammatory status of critically ill patients1,3
– -6 PUFA may also be immunosuppressive, increasing the risk of infection3
– Partial substitution with other FA has demonstrated better tolerability and potential clinical benefits in critically ill patients1
• Medium chain triglycerides• -9 monounsaturated fatty acids (MUFA)• -3 PUFA
1. Singer P, et al. Clin Nutr. 2009;28(4):387-400.2. Eritsland J. Am J Clin Nutr. 2000;71(suppl):197S-201S.3. McClave SA, et al. JPEN J Parenter Enteral Nutr. 2009;33(3):277-316.

4/5/2012
11
Why Parenteral Lipids?
• Lipids are a dense (9 kcal/g) source of calories1
– Meet caloric intake requirements with limited volume
• Lipids provide essential FA, which are important for recovery from critical illness1
R d th d f l d i i t ti• Reduces the need for glucose administration, thereby avoiding potential morbidity and mortality associated with hyperglycemia2
• Lipids provide other FA important to immune and other biological functions3
1. Wanten GJA, Calder PC. Am J Clin Nutr. 2007;85(5):1171-1184.2. Vanhorebeek I, et al. Chest. 2007;132(1):268-278.3. Carpentier YA, Dupont IE. World J Surg. 2000;24(12):1493-1497.
FA Classification: Saturation
SFA PUFA MUFA• Most FA in coconut oil1
• Increased risk of CV disease2
• Acute adverse effects include endothelial toxicity,
t i d
• Primary FA in soybean oil (linoleic acid) and fish oil (EPA and DHA)1
• Include essential FA (linoleic and linolenic acid)1
• Include oleic acid, the primary FA in olive oil1
• Olive oil is associated with favorable effects on risk factors for CV disease9
SFA, saturated fatty acid; PUFA, polyunsaturated fatty acid; MUFA, monounsaturated fatty acid; FA, fatty acid; CV, cardiovascular; EPA, eicosapentaenoic acid; DHA, docosahexaenoic acid.
1. Wanten GJA, Calder PC. Am J Clin Nutr. 2007;85(5):1171-1184.2. Hu FB, et al. J Am Coll Nutr. 2001;20(1):5-19.3. Zaloga GP, et al. Clin Nutr Suppl. 2008;3(suppl 1):219 .
Abstract LB029.4. Staiger K, et al. Diabetes. 2006;55(11):3121-3126.5. Kris-Etherton PM. J Nutr. 1999;129(12):2280-2284.
apoptosis, and inflammation3,4
• Should be restricted in the diet5,6
and -linolenic acid)1
• Important for cell membrane structure and function7
• Primary FA that is oxidized8
• Should be restricted in the diet5,6
factors for CV disease9
• Require supplementation with a source of essential FA1
• Should be a predominant FA in the diet (~50% of FA intake)5,6
6. World Health Organization. Diet, Nutrition and the Prevention of Chronic Disease. Geneva, Switzerland: World Health Organization; 2002. WHO Technical Report Series 916.
7. Calder PC. Braz J Med Biol Res. 2003;36(4):433-446.8. Eritsland J. Am J Clin Nutr. 2000;71(suppl 1):197S-201S.9. López-Miranda J, et al. Nutr Rev. 2006;64(10 suppl 4):S2-S12.
Which Parenteral Lipid for Which Patient?
High MUFA LE (Olive Oil)High PUFA LEs (soybean oil– and fish oil–based LEs)
Minimally interferes with intrinsic immune response1,2
Immunosuppressive3-5
1. Cury-Boaventura MF, et al. Life Sci. 2006;78(13):1448-1456.2. Granato D, et al. JPEN J Parenter Enteral Nutr. 2000;24(2):113-118.3. Nordenstrom J, et al. Am J Clin Nutr. 1979;32(12):2416-2422.4. Sedman PC, et al. Br J Surg. 1991;78(11):1396-1399.5. Battistella FD, et al. J Trauma. 1997;43(1):52-58.6. Buenestado A, et al. JPEN J Parenter Enteral Nutr. 2006;30(4):286-296.
Does not increase patient inflammatory response6
Proinflammatory/antiinflamatory7
Improves resistance to oxidative stress8,9 Preferential targets for lipid peroxidation, leading to oxidative stress10
Best physical stability in total nutrient admixtures11,12
Limited stability in total nutrient admixtures11,12
7. Calder PC. Braz J Med Biol Res. 2003;36(4):433-446.8. Fuhrman B, et al. Nutrition. 2006;22(9):922-930.9. Goulet O, et al. Am J Clin Nutr. 1999;70(3):338-345.10. Hardy G, Allwood MC. Nutrition. 1997;13(3):230.11. Driscoll DF. Am J Health Syst Pharm. 2007;64(19):2032-2036.12. Driscoll DF, et al. Clin Nutr. 2001;20(2):151-157.

4/5/2012
12
Effect of LE on Immune Response
100
120
on
ClinOleic IvelipIntralipid
Oleic acid (MUFA)
Arachidonic acid (-6 PUFA)EPAEPA ((--3 3 PUFAPUFA))
DHA (-3PUFA)
Olive oil causes minimal interference of lymphocyte
proliferation, supporting intrinsic host immune responses
Granato D, et al. Nutr Clin Metabol. 1996.;10:49S-52S.
0.0300.0200.0100.000
0
20
40
60
80
Emulsion concentration (% v/v)
Thy
mid
ine
inco
rpor
ati
(% o
f co
ntro
l)
*P 0.05 versus control. **P 0.005 versus control.
Figure created using data from Soyland E, et al. Eur J Clin Invest. 1993;23(2):112-121.
What Is Oxidative Stress?• Normally, the production of ROS is balanced by
the consumption of these species by anti-oxidants (eg, vitamins E and C, selenium, glutathione)
• Oxidative damage occurs when there is a dysequilibrium between ROS production and anti-oxidant systems in favor of ROS (pro oxidants)oxidant systems in favor of ROS (pro-oxidants).This results in oxidative stress
AOX, anti-oxidant; ROS, reactive oxygen species.
Sies H. Am J Med. 1991;91(3C):31S-38S.
AOX
ROS Oxidative stress
Oxidative damage
Parenteral Lipids and Oxidative Stress: Clinical Findings (cont)
TBARS, thiobarbituric acid-reactive substances; MCT, medium-chain triglycerides; LCT, long-chain triglycerides; LDL, low-density lipoprotein.*P 0.05. **P 0.001.
Figure was created using data from Demirer S, et al. Poster presented at: the 28th European Society for Clinical Nutrition and Metabolism (ESPEN) Congress; October 19-22, 2006; Istanbul, Turkey.

4/5/2012
13
Critical Care and Nutrition
Malnutrition in critical care patients
Nutrition interventions (enteral and parenteral) Protein and the ICU
Lipids and the ICU
Compounded versus pre-mixed PN
Supplemental PN
Compounded Versus Pre-Mixed PN
Pre-Mixed PNCommercially mixed and terminally sterilized
Set content (protein, carbohydrates, fats, electrolytes, vitamins and minerals)electrolytes, vitamins and minerals)
CompoundedEach component placed into bag by manual or
automated compounder
No routine sterilization methods
Clinical Outcomes Using Premix Parenteral Nutrition Formulations
• Premier multi-hospital database (n=197); Adults > 18 years
• Multi-chamber bag (MCB); n=4,669
• Compounded bag (COM) 64 401
(COM); n=64,401• Hospital compounded
(HCOM); n=979• Adjusted for age,
diagnosis, PN days, co-morbidities, surgery, ICU stay, severity, hospital
• *p<0.001Cost per BSI = $18,251Savings per patient = $857

4/5/2012
14
Clinical Outcomes Using Premix Parenteral Nutrition Formulations
• Premier multi-hospital database (n=197)
• Adults > 18 years
• Multi-chamber bag
g(MCB); n=2643
• Compounded bag (COM); n=64,401
• Hospital compounded (HCOM); n=979
• *p<0.001
EPICOS: JPEN 2009 (Pontes-Arruda et al)
• PRDBCT, multicenter:– n=400, Critically ill, Require PN
– 28 day follow-up
• Exclusions: < 18 years, survival < 28 days from incurable disease need for dialysis GCS 25
30
35
40
45
Percent BSI
disease, need for dialysis, GCS < 5, HIV
• OliClinomel, Olive 3CB (n=108)
• Compounding– CO (n=41)
– MCT/LCT (n=54)
• Primary: BSI
• Similar APACHE2
Olive-oil based PN group had lower IL-6, IL-8, TNFa, lymphocyte apoptosis, procalcitonin, & resistin levels
0
5
10
15
20
25
OliClinomel CO MCT/LCT
Critical Care and Nutrition
Malnutrition in critical care patients
Nutrition interventions (enteral and parenteral) Protein and the ICU
Lipids and the ICU
Compounded versus pre-mixed PN
Supplemental PN

4/5/2012
15
Supplementary Nutrition
Enteral + Parenteral Nutrition May Improve Patient Outcomes
Enteral Nutrition Parenteral Nutrition
Source: Merritt R, ed. A.S.P.E.N. Nutrition Support Practice Manual, 2nd Ed., 2005.
Improved Energy Balance
Improved Patient Outcomes
20
25
30EN+PN EN
EN+PN Has Been Associated With Lower Hospital LOS
• RCT with 120 ICU patients– 60 EN+PN (Treatment)– 60 EN+placebo (Control) – No difference in severity of illness
• PN and placebo administered only during 1st 4-7 days
Comparison of Caloric Intake Day 1-7 of Feed
0
5
10
15
20
D1 D2 D3 D4 D5 D6 D7Days
• Goal of 25 total kcal/kg/day– Use of commercially prepared
PN adjusted to meet goal
• EN+PN met 98% goal vs. 57% for EN– Positive energy balance in first 3 days
• No difference in infections, ICU LOS, and mortality
• EN+PN associated with ↓ hospital LOS vs. EN– 31.2 vs. 33.7 days;– P=0.0022)
Source: Bauer P, et al. Intensive Care Med. 2000;26:893-900.

4/5/2012
16
Late Versus Early Supplemental PNCasaer MP et al NEJM 2011; 365: 506
• New Infections: 22.8 vs 26.2*
• Highest CRP: 191 vs 160 mg/l*
• Mechanical ventilation: 2 vs 2 days (median)*
• Tracheostomy: 5.5 vs 7.0 %Tracheostomy: 5.5 vs 7.0 %
• Renal replacement therapy: 8.6 vs 8.9%
• Hemodynamic support: 82.6 vs 83%
• Bilirubin > 3 mg/dl: 14.5 vs 12.9%
• Hospital stay (median days): 14 vs 18*
• 6 min walk, ADL: similar
Supplementing EN with PN is Associated with Improved Clinical Outcomes in High Risk Patients
TICACOS TrialStudy Group
(n = 65)Control Group
(n = 65)P value
Nutrition parameters
Mean energy delivered/day (kcal/day) 2086 ± 460 1480 ± 356 0.01
Per protocol group (n=112)TICACOS = Tight Calorie Control Study Singer P, et al. Inten Care Med. 2011;37(4):601-9.
( y)from enteralfrom parenteral
1515 ± 756571 ± 754
1316 ± 456164 ± 294
0.090.001
Hospital mortality, n (%) 21 (32.3%) 31 (47.7) 0.058
ICU mortality 24.6% 26.2% 1.0
Duration ventilation (days, mean) 16.1 ± 14.7 10.5 ± 8.3 0.03
ICU stay (days, mean) 17.2 ± 14.6 11.7 ± 8.4 0.04
60-day survival* 57.9 ± 9.9% 48.1 ± 7.6% 0.023
Conclusions: PN in Critical Care
• Malnutrition is common
• Nutrition intervention is an important component of the care of the critically ill patient
• EN versus PN intervention may need another looky
• Lipid emulsions are an important part of regimen
• EN+PN approach should be considered– When to supplement
– Be vigilant for underfeeding where EN used as sole nutrition source

4/5/2012
17
Charleston, SC