optimizing energy and performance for server-class file
TRANSCRIPT
Optimizing Energy and Performance for Server-Class FileSystem Workloads
A Thesis Presentedby
Priya Sehgal
to
The Graduate School
in Partial Fulfillment of the
Requirements
for the Degree of
Master of Science
in
Computer Science
Stony Brook University
Technical Report FSL-10-01May 2010
Stony Brook University
The Graduate School
Priya Sehgal
We, the thesis committee for the above candidate for the
Master of Science degree, hereby recommend
acceptance of this thesis.
Dr. Erez Zadok, Thesis AdvisorAssociate Professor, Computer Science
Dr. Rob Johnson, Thesis Committee ChairAssistant Professor, Computer Science
Dr. Jennifer WongAssistant Professor, Computer Science
This thesis is accepted by the Graduate School
Lawrence MartinDean of the Graduate School
ii
Abstract of the Thesis
Optimizing Energy and Performance for Server-Class File System Workloads
by
Priya Sehgal
Master of Science
in
Computer Science
Stony Brook University
2010
Recently, power has emerged as a critical factor in designing components of storage systems,especially for power-hungry data centers. While there is some research into power-aware storagestack components, there are no systematic studies evaluating each component’s impact separately.Various factors like workloads, hardware configurations, and software configurations impact theperformance and energy efficiency of the system. This thesisevaluates the file system’s impacton energy consumption and performance. We studied several popular Linux file systems, withvarious mount and format options, using the FileBench workload generator to emulate four serverworkloads: Web, database, mail, and file server, on two different hardware configurations. Thefile system design, implementation, and available featureshave a significant effect on CPU/diskutilization, and hence on performance and power. We discovered that default file system optionsare often suboptimal, and even poor. In this thesis we show that a careful matching of expectedworkloads and hardware configuration to a single software configuration—the file system—canimprove power-performance efficiency by a factor ranging from 1.05 to 9.4 times.
iii

To my parents and my brother and sister.
Contents
List of Figures vii
List of Tables viii
Acknowledgments ix
1 Introduction 1
2 Related Work 32.1 File system studies . . . . . . . . . . . . . . . . . . . . . . . . . . . . . . .. . 32.2 Lower-level storage studies . . . . . . . . . . . . . . . . . . . . . . .. . . . . . 32.3 Benchmarks and systematic studies . . . . . . . . . . . . . . . . . .. . . . . . . 4
3 Methodology 53.1 Experimental Setup . . . . . . . . . . . . . . . . . . . . . . . . . . . . . . .. . 53.2 Software Tools and Benchmarks . . . . . . . . . . . . . . . . . . . . . .. . . . 63.3 Workload Categories . . . . . . . . . . . . . . . . . . . . . . . . . . . . . .. . 73.4 File System and Properties . . . . . . . . . . . . . . . . . . . . . . . . .. . . . 8
3.4.1 Ext2 and Ext3 . . . . . . . . . . . . . . . . . . . . . . . . . . . . . . . . 93.4.2 XFS . . . . . . . . . . . . . . . . . . . . . . . . . . . . . . . . . . . . . 93.4.3 Reiserfs . . . . . . . . . . . . . . . . . . . . . . . . . . . . . . . . . . . 10
3.5 Energy Breakdown . . . . . . . . . . . . . . . . . . . . . . . . . . . . . . . . .10
4 Evaluation 124.1 Overview . . . . . . . . . . . . . . . . . . . . . . . . . . . . . . . . . . . . . . 134.2 Machine 1 Results . . . . . . . . . . . . . . . . . . . . . . . . . . . . . . . . .. 14
4.2.1 Webserver Workload . . . . . . . . . . . . . . . . . . . . . . . . . . . . 144.2.2 File Server Workload . . . . . . . . . . . . . . . . . . . . . . . . . . . .164.2.3 Mail Server . . . . . . . . . . . . . . . . . . . . . . . . . . . . . . . . . 184.2.4 Database Server Workload (OLTP) . . . . . . . . . . . . . . . . . .. . 194.2.5 Summary and Recommendations for Machine 1 . . . . . . . . . .. . . . 20
4.3 Machine 2 Results . . . . . . . . . . . . . . . . . . . . . . . . . . . . . . . . .. 224.3.1 Webserver Workload . . . . . . . . . . . . . . . . . . . . . . . . . . . . 234.3.2 File Server Workload . . . . . . . . . . . . . . . . . . . . . . . . . . . .24
v
4.3.3 Mail Server . . . . . . . . . . . . . . . . . . . . . . . . . . . . . . . . . 254.3.4 Database Server Workload (OLTP) . . . . . . . . . . . . . . . . . .. . 264.3.5 Summary and Recommendations for Machine 2 . . . . . . . . . .. . . . 26
4.4 File System Feature Selection Guide . . . . . . . . . . . . . . . . .. . . . . . . 28
5 Conclusions 29
6 Future Work 30
Bibliography 31
vi

List of Figures
3.1 WattsUP Pro ES power meter . . . . . . . . . . . . . . . . . . . . . . . . . .. . 6
4.1 Webserver: Mean power consumption by four file system at different load levels . 124.2 Average CPU utilization for the Webserver workload . . . .. . . . . . . . . . . 134.3 Webserver results on Machine 1 . . . . . . . . . . . . . . . . . . . . . .. . . . 144.4 Fileserver results on Machine 1 . . . . . . . . . . . . . . . . . . . . .. . . . . . 164.5 Varmail results on Machine 1 . . . . . . . . . . . . . . . . . . . . . . . .. . . . 184.6 OLTP results on Machine 1 . . . . . . . . . . . . . . . . . . . . . . . . . . .. . 194.7 Webserver results on Machine 2 . . . . . . . . . . . . . . . . . . . . . .. . . . 234.8 Fileserver results on Machine 2 . . . . . . . . . . . . . . . . . . . . .. . . . . . 244.9 Varmail results on Machine 2 . . . . . . . . . . . . . . . . . . . . . . . .. . . . 254.10 OLTP results on Machine 2 . . . . . . . . . . . . . . . . . . . . . . . . . .. . . 26
vii
List of Tables
3.1 Testbed Setup . . . . . . . . . . . . . . . . . . . . . . . . . . . . . . . . . . . .53.2 FileBench workload characteristics . . . . . . . . . . . . . . . .. . . . . . . . . 7
4.1 File systems’ performance and power, varying options, relative to the default onesfor each file system for machine 1 . . . . . . . . . . . . . . . . . . . . . . . .. 21
4.2 Recommended File system for Machine 1 . . . . . . . . . . . . . . . .. . . . . 224.3 File systems’ performance and power, varying options, relative to the default ones
for each file system for machine 2 . . . . . . . . . . . . . . . . . . . . . . . .. 274.4 Recommended File system for Machine 2 . . . . . . . . . . . . . . . .. . . . . 27
viii
AcknowledgmentsMy immense gratitude to my advisor, Dr. Erez Zadok, for constant guidance and motivation. I
thank Dr. Rob Johnson and Dr. Jennifer Wong for being on my defense committee, and providingvaluable suggestions. I am also thankful to the anonymous USENIX FAST reviewers and theshepherd for their valuable comments. I am thankful to everyone at the File Systems and StorageLab (FSL), for making it a great learning experience. I also want to specially thank Vasily Tarasovand Saumitra Bhanage, for their help through the project.
This thesis was made possible in part thanks to NSF awards CCF-0621463 and CCF-0937854,2008 IBM Faculty award, and 2009 NetApp gift.
Chapter 1
Introduction
Performance has a long tradition in storage research. Recently, power consumption has become agrowing concern. Recent studies show that the energy used inside all U.S. data centers is 1–2% oftotal U.S. energy consumption [45], with more spent by otherIT infrastructures outside the datacenters [47]. Storage stacks have grown more complex with the addition of virtualization layers(RAID, LVM), stackable drivers and file systems, virtual machines, and network-based storageand file system protocols. It is challenging today to understand the behavior of storage layers,especially when using complex applications.
Performance and energy use have a non-trivial, poorly understood relationship: sometimesthey are opposites (e.g., spinning a disk faster costs more power but improves performance); butat other times they go hand in hand (e.g., localizing writes into adjacent sectors can improveperformance while reducing the energy). Worse, the growingnumber of storage layers furtherperturb access patterns each time applications’ requests traverse the layers, further obfuscatingthese relationships.
Traditional energy-saving techniques useright-sizing. These techniques adjust node’s compu-tational power to fit the current load. Examples include spinning disks down [12, 29, 32], reduc-ing CPU frequencies and voltages [48], shutting down individual CPU cores, and putting entiremachines into lower power states [14, 34]. Less work has beendone onworkload-reductiontech-niques: better algorithms and data-structures to improve power/performance [16, 19, 25]. A fewefforts focused on energy-performance tradeoffs in parts of the storage stack [8, 18, 30]. However,they were limited to one problem domain or a specific workloadscenario.
Many factors affect power and performance in the storage stack, especially workloads andhardware configuration. Traditional file systems and I/O schedulers were designed for general-ity, which is ill-suited for today’s specialized servers with long-running services (Web, database,email). We believe that to improve performance and reduce energy use, custom storage layersare needed for specialized workloads. But before that, thorough systematic studies are needed torecognize the features affecting power-performance underspecific workloads and hardware con-figurations.
This thesis studies the impact of server workloads on both power and performance. We usedthe FileBench [40] workload generator due to its flexibility, accuracy, and ability to scale andstress any server. We selected FileBench’s Web, database, email, and file server workloads as they
1
represent most common server workloads, yet they differ from each other. Modern storage stacksconsist of multiple layers. Each layer independently affects the performance and power consump-tion of a system, and together the layers make such interaction rather complex. Here, we focusedon the file system layer only; to make this study a useful stepping stone towards understanding theentire storage stack, we did not use LVM, RAID, or virtualization. We experimented with Linux’sfour most popular and stable local file systems: Ext2, Ext3, XFS, and Reiserfs; and we variedseveral common format- and mount-time options to evaluate their impact on power/performance.
We ran many experiments on two server-class machines differing in their age, collected de-tailed performance and power measurements, and analyzed them. We found that different work-loads and hardware configurations, not too surprisingly, have a large impact on system behavior.No single file system worked best for all workloads. Moreover, default file system format andmount options were often suboptimal. Some file system features helped power/performance andothers hurt it. Our experiments revealed a strong linearitybetween the power efficiency and perfor-mance of a file system. Overall, we found significant variations in the amount of useful work thatcan be accomplished per unit time or unit energy, with possible improvements over default con-figurations ranging from 5% to 9.4×. We conclude that long-running servers should be carefullyconfigured at installation time. For busy servers this can yield significant performance and powersavings over time. We hope this study will inspire other studies (e.g., distributed file systems), andlead to novel storage layer designs.
The rest of this thesis is organized as follows. Chapter 2 surveys related work. Chapter 3introduces our experimental methodology. The bulk of our evaluation and analysis is in Chapter 4.We conclude in Chapter 5 and describe future directions in Chapter 6.
2
Chapter 2
Related Work
Past power-conservation research for storage focused on portable battery-operated computers [12,26]. Recently, researchers investigated data centers [9, 29, 46]. As our focus is file systems’power and performance, we discuss three areas of related work that mainly cover both power andperformance: file system studies, lower-level storage studies, and benchmarks commonly used toevaluate systems’ power efficiency.
2.1 File system studies
Disk-head seeks consume a large portion of hard-disk energy[1]. A popular approach to opti-mize file system power-performance is to localize on-disk data to incur fewer head movements.Huang et al. replicated data on disk and picked the closest replica to the head’s position at run-time [19]. The Energy-Efficient File System (EEFS) groups files with high temporal access local-ity [25]. Essary and Amer developed predictive data grouping and replication schemes to reducehead movements [16].
Some suggested other file-system—level techniques to reduce power consumption without de-grading performance. BlueFS is an energy-efficient distributed file system for mobile devices [30].When applications request data, BlueFS chooses a replica that best optimizes energy and perfor-mance. GreenFS is a stackable file system that combines a remote network disk and a localflash-based memory buffer to keep the local disk idling for aslong as possible [20]. Kothiyal etal. examined file compression to improve power and performance [23].
These studies propose new designs for storage software, which limit their applicability toexisting systems. Also, they often focus on narrow problem domains. We, however, focus onservers, several common workloads, and use existing unmodified software.
2.2 Lower-level storage studies
A disk drive’s platters usually keep spinning even if there are no incoming I/O requests. Turningthe spindle motor off during idle periods can reduce disk energy use by 60% [29]. Several stud-ies suggest ways to predict or prolong idle periods and shut the disk down appropriately [10, 12].Unlike laptop and desktop systems, idle periods in server workloads are commonly too short,
3
making such approaches ineffective. This was addressed using I/O off-loading [29], power-aware(sometimes flash-based) caches [5, 51], prefetching [27, 32], and a combination of these tech-niques [11, 46]. Massive Array of Idle Disks (MAID) augmentsRAID technology with automaticshut down of idle disks [9]. Pinheiro and Bianchini used the fact that regularly only a small subsetof data is accessed by a system, and migrated frequently accessed data to a small number of activedisks, keeping the remaining disks off [33]. Other approaches dynamically control the platters’rotation speed [37] or combine low- and high-speed disks [8]. Similarscale-downtechniques havebeen applied to distributed processing frameworks like Hadoop [24].
There have been a few studies that focus on improving the energy-efficiency of the sys-tem through the use of low-powered hardware, without degrading performance. For example,FAWN [3] is a low-powered cluster architecture targeted towards data-intensive workloads. TheFAWN architecture consists of low-powered embedded CPUs coupled with local flash storage,which is accessed through a log-structured data store. Theybalance computation and I/O capabil-ities for efficient, massively parallel access to data.
Few of these approaches depend primarily on having or prolonging idle periods, which is lesslikely on busy servers. For those, aggressive use of shutdown, slowdown, or spin-down techniquescan have adverse effects on performance and energy use (e.g., disk spin-up is slow and costs en-ergy); such aggressive techniques can also hurt hardware reliability. Whereas idle-time techniquesare complementary to our study, we examine file systems’ features that increase performance andreduce energy use inactivesystems.
2.3 Benchmarks and systematic studies
Researchers use a wide range of benchmarks to evaluate the performance of computer systems [41,44] and file systems specifically [7, 22, 40, 43]. Far fewer benchmarks exist to determine sys-tem power efficiency. The Standard Performance Evaluation Corporation (SPEC) proposed theSPECpowerssj benchmark to evaluate the energy efficiency of systems [42]. SPECpowerssjstresses a Java server with standardized workload at different load levels. It combines results andreports the number of Java operations per second per watt. Rivoire et al. used a large sorting prob-lem (guaranteed to exceed main memory) to evaluate a system’s power efficiency [36]; they reportthe number of sorted records per joule. We use similar metrics, but applied for file systems.
Our goal was to conduct a systematic power-performance study of file systems. Gurumurthiet al. carried out a similar study for various RAID configurations [18], but focused on databaseworkloads alone. They noted that tuning RAID parameters affected power and performance morethan many traditional optimization techniques. We observed similar trends, but for file systems.In 2002, Bryant et al. evaluated Linux file system performance [6], focusing on scalability andconcurrency. However, that study was conducted on an older Linux 2.4 system. As hardwareand software change so rapidly, it is difficult to extrapolate from such older studies—anothermotivation for our study here.
4
Chapter 3
Methodology
This chapter details the experimental hardware and software setup for our evaluations. We describeour testbed in Section 3.1. In Section 3.2 we describe our benchmarks and tools used. Sections 3.3and 3.4 motivate our selection of workloads and file systems,respectively. Section 3.5 explainsenergy-related concepts and assumptions we made in the restof the thesis.
3.1 Experimental Setup
SpecificationMachine type
Machine 1 Machine 2Machine age 3 yrs < 1 yrCPU model Intel Xeon Intel Nehalem (E5530)CPU speed 2.8 GHz 2.4 GHz
No. of CPUs 2 dual core 1 quad coreCPU DVFS support No Yes
L1 cache size 16K 128KL2 cache size 2M 1ML3 cache size No 8M
FSB speed 800 MHz 1066 MHzRAM size (actual) 2GB 24GB
RAM type DIMM DIMMDisk RPM 15000 7200Disk Type SCSI SATA
Average Seek Time (ms) 3.2/3.6ms 10.5/12.5msDisk cache 8MB 16MB
Average Idle Power 218W 94W
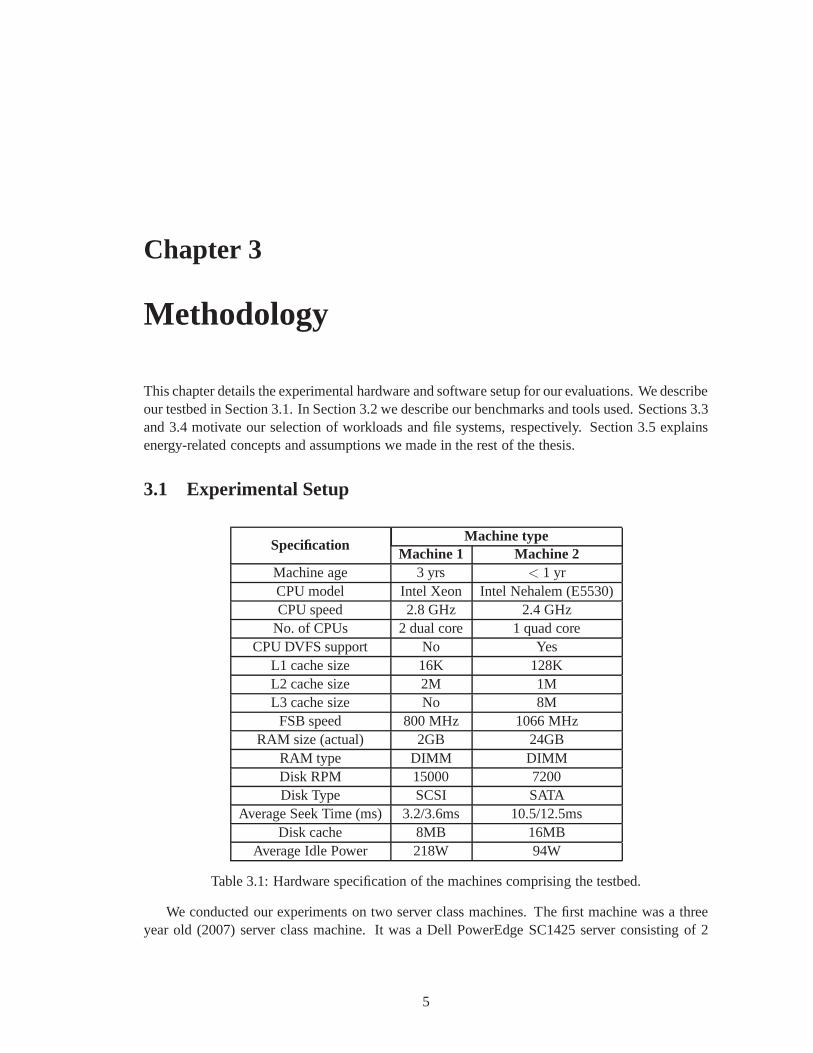
Table 3.1: Hardware specification of the machines comprising the testbed.
We conducted our experiments on two server class machines. The first machine was a threeyear old (2007) server class machine. It was a Dell PowerEdgeSC1425 server consisting of 2
5
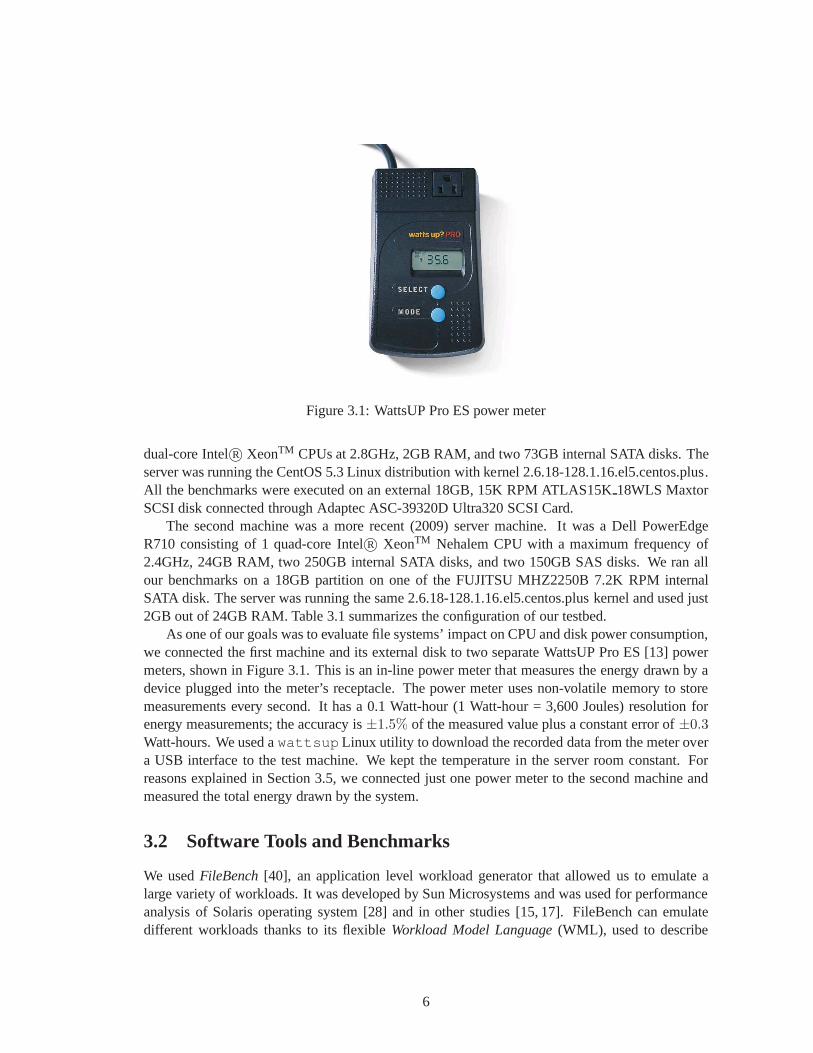
Figure 3.1: WattsUP Pro ES power meter
dual-core IntelR© XeonTM CPUs at 2.8GHz, 2GB RAM, and two 73GB internal SATA disks. Theserver was running the CentOS 5.3 Linux distribution with kernel 2.6.18-128.1.16.el5.centos.plus.All the benchmarks were executed on an external 18GB, 15K RPMATLAS15K 18WLS MaxtorSCSI disk connected through Adaptec ASC-39320D Ultra320 SCSI Card.
The second machine was a more recent (2009) server machine. It was a Dell PowerEdgeR710 consisting of 1 quad-core IntelR© XeonTM Nehalem CPU with a maximum frequency of2.4GHz, 24GB RAM, two 250GB internal SATA disks, and two 150GB SAS disks. We ran allour benchmarks on a 18GB partition on one of the FUJITSU MHZ2250B 7.2K RPM internalSATA disk. The server was running the same 2.6.18-128.1.16.el5.centos.plus kernel and used just2GB out of 24GB RAM. Table 3.1 summarizes the configuration ofour testbed.
As one of our goals was to evaluate file systems’ impact on CPU and disk power consumption,we connected the first machine and its external disk to two separate WattsUP Pro ES [13] powermeters, shown in Figure 3.1. This is an in-line power meter that measures the energy drawn by adevice plugged into the meter’s receptacle. The power meteruses non-volatile memory to storemeasurements every second. It has a 0.1 Watt-hour (1 Watt-hour = 3,600 Joules) resolution forenergy measurements; the accuracy is±1.5% of the measured value plus a constant error of±0.3
Watt-hours. We used awattsup Linux utility to download the recorded data from the meter overa USB interface to the test machine. We kept the temperature in the server room constant. Forreasons explained in Section 3.5, we connected just one power meter to the second machine andmeasured the total energy drawn by the system.
3.2 Software Tools and Benchmarks
We usedFileBench[40], an application level workload generator that allowedus to emulate alarge variety of workloads. It was developed by Sun Microsystems and was used for performanceanalysis of Solaris operating system [28] and in other studies [15, 17]. FileBench can emulatedifferent workloads thanks to its flexibleWorkload Model Language(WML), used to describe
6
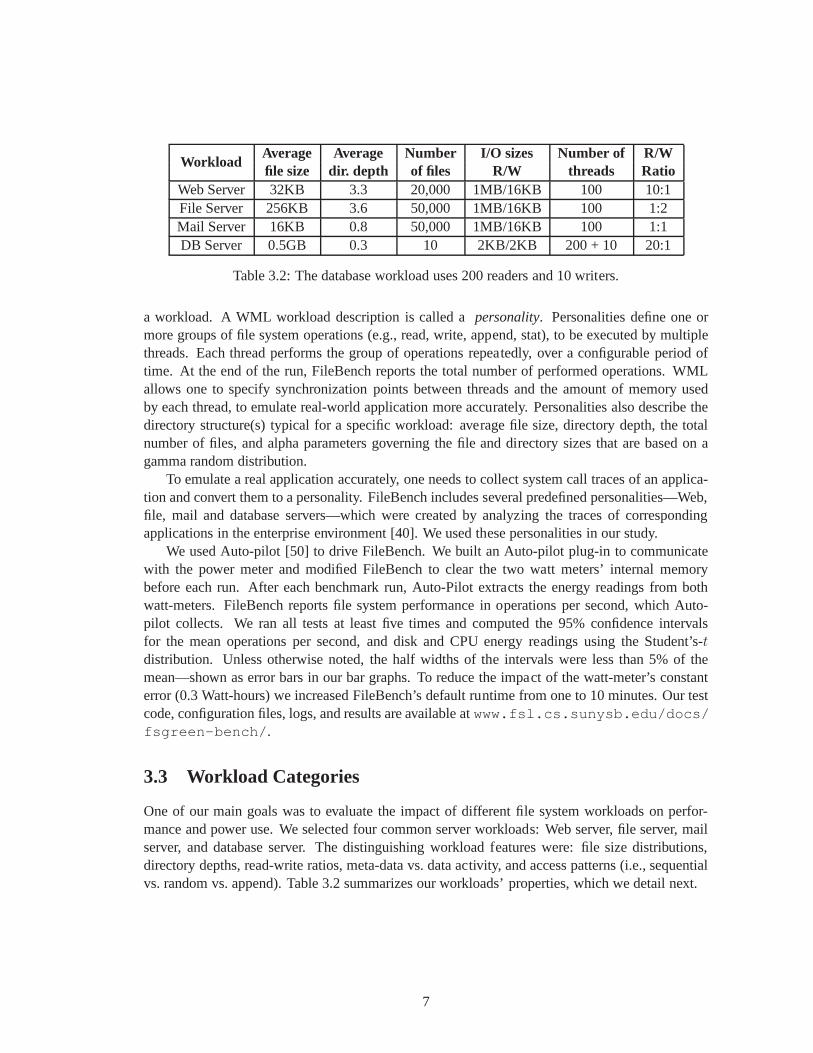
WorkloadAverage Average Number I/O sizes Number of R/Wfile size dir. depth of files R/W threads Ratio
Web Server 32KB 3.3 20,000 1MB/16KB 100 10:1File Server 256KB 3.6 50,000 1MB/16KB 100 1:2Mail Server 16KB 0.8 50,000 1MB/16KB 100 1:1DB Server 0.5GB 0.3 10 2KB/2KB 200 + 10 20:1
Table 3.2: The database workload uses 200 readers and 10 writers.
a workload. A WML workload description is called apersonality. Personalities define one ormore groups of file system operations (e.g., read, write, append, stat), to be executed by multiplethreads. Each thread performs the group of operations repeatedly, over a configurable period oftime. At the end of the run, FileBench reports the total number of performed operations. WMLallows one to specify synchronization points between threads and the amount of memory usedby each thread, to emulate real-world application more accurately. Personalities also describe thedirectory structure(s) typical for a specific workload: average file size, directory depth, the totalnumber of files, and alpha parameters governing the file and directory sizes that are based on agamma random distribution.
To emulate a real application accurately, one needs to collect system call traces of an applica-tion and convert them to a personality. FileBench includes several predefined personalities—Web,file, mail and database servers—which were created by analyzing the traces of correspondingapplications in the enterprise environment [40]. We used these personalities in our study.
We used Auto-pilot [50] to drive FileBench. We built an Auto-pilot plug-in to communicatewith the power meter and modified FileBench to clear the two watt meters’ internal memorybefore each run. After each benchmark run, Auto-Pilot extracts the energy readings from bothwatt-meters. FileBench reports file system performance in operations per second, which Auto-pilot collects. We ran all tests at least five times and computed the 95% confidence intervalsfor the mean operations per second, and disk and CPU energy readings using the Student’s-t
distribution. Unless otherwise noted, the half widths of the intervals were less than 5% of themean—shown as error bars in our bar graphs. To reduce the impact of the watt-meter’s constanterror (0.3 Watt-hours) we increased FileBench’s default runtime from one to 10 minutes. Our testcode, configuration files, logs, and results are available atwww.fsl.cs.sunysb.edu/docs/fsgreen-bench/.
3.3 Workload Categories
One of our main goals was to evaluate the impact of different file system workloads on perfor-mance and power use. We selected four common server workloads: Web server, file server, mailserver, and database server. The distinguishing workload features were: file size distributions,directory depths, read-write ratios, meta-data vs. data activity, and access patterns (i.e., sequentialvs. random vs. append). Table 3.2 summarizes our workloads’properties, which we detail next.
7
Web Server The Web server workload uses a read-write ratio of 10:1, and reads entire filessequentially by multiple threads, as if reading Web pages. All the threads append 16KB to acommon Web log, thereby contending for that common resource. This workload not only exercisesfast lookups and sequential reads of small-sized files, but it also considers concurrent data andmeta-data updates into a single, growing Web log.
File Server The file server workload emulates a server that hosts home directories of multipleusers (threads). Users are assumed to access files and directories belonging only to their respectivehome directories. Each thread picks up a different set of files based on its thread id. Each threadperforms a sequence of create, delete, append, read, write,and stat operations, exercising both themeta-data and data paths of the file system.
Mail Server The mail server workload (varmail) emulates an electronic mail server, similar toPostmark [22], but it is multi-threaded. FileBench performs a sequence of operations to mimicreading mails (open, read whole file, and close), composing (open/create, append, close, andfsync) and deleting mails. Unlike the file server and Web server workloads, the mail server work-load uses a flat directory structure, with all the files in one directory. This exercises large directorysupport and fast lookups. The average file size for this workload is 16KB, which is the smallestamongst all other workloads. This initial file size, however, grows later due to appends.
Database Server This workload targets a specific class of systems, calledonline transactionprocessing(OLTP). OLTP databases handle real-time transaction-oriented applications (e.g., e-commerce). The database emulator performs random asynchronous writes, random synchronousreads, and moderate (256KB) synchronous writes to the log file. It launches 200 reader processes,10 asynchronous writers, and a single log writer. This workload exercises large file management,extensive concurrency, and random reads/writes. This leads to frequent cache misses and on-diskfile access, thereby exploring the storage stack’s efficiency for caching, paging, and I/O.
3.4 File System and Properties
We ran our workloads on four different file systems: Ext2, Ext3, Reiserfs, and XFS. We evaluatedboth the default and variants of mount and format options foreach file system. We selectedthese file systems for their widespread use on Linux servers and the variation in their features.Distinguishing file system features were:
• B+/S+ Tree vs. linear fixed sized data structures
• Fixed block size vs. variable-sized extent
• Different allocation strategies
• Different journal modes
• Other specialized features (e.g., tail packing)
8
For each file system, we tested the impact of various format and mount options that are be-lieved to affect performance. We considered two common format options: block size and inodesize. Large block sizes improve I/O performance of applications using large files due to fewernumber of indirections, but they increase fragmentation for small files. We tested block sizes of1KB, 2KB, and 4KB. We excluded 8KB block sizes due to lack of full support [31, 49]. Largerinodes can improve data locality by embedding as much data aspossible inside the inode. Forexample, large enough inodes can hold small directory entries and small files directly, avoidingthe need for disk block indirections. Moreover, larger inodes help storing the extent file maps. Wetested the default (256B and 128B for XFS and Ext2/Ext3, respectively) and 1KB inode size forall file systems except Reiserfs, as it does not explicitly have an inode object.
We evaluated various mount options:noatime, journal vs. no journal, and different jour-nalling modes. Thenoatime option improves performance in read-intensive workloads,as itskips updating an inode’s last access time. Journalling provides reliability, but incurs an extracost in logging information. Some file systems support different journalling modes: data, ordered,and writeback. The data journalling mode logs both data and meta-data. This is the safest butslowest mode. Ordered mode (default in Ext3 and Reiserfs) logs only meta-data, but ensures thatdata blocks are written before meta-data. The writeback mode logs meta-data without orderingdata/meta-data writes. Ext3 and Reiserfs support all threemodes, whereas XFS supports only thewriteback mode. We also assessed a few file-system specific mount and format options, describednext.
3.4.1 Ext2 and Ext3
Ext2 [4] and Ext3 [49] have been the default file systems on most Linux distributions for years.Ext2 divides the disk partition into fixed sized blocks, which are further grouped into similar-sizedblock groups. Each block group manages its own set of inodes, a free data block bitmap, and theactual files’ data. The block groups can reduce file fragmentation and increase reference localityby keeping files in the same parent directory and their data inthe same block group. The maximumblock group size is constrained by the block size. Ext3 has anidentical on-disk structure as Ext2,but adds journalling. Whereas journalling might degrade performance due to extra writes, wefound certain cases where Ext3 outperforms Ext2. One of Ext2and Ext3’s major limitations istheir poor scalability to large files and file systems becauseof the fixed number of inodes, fixedblock sizes, and their simple array-indexing mechanism [6].
3.4.2 XFS
XFS [39] was designed for scalability: supporting terabytesized files on 64-bit systems, an unlim-ited number of files, and large directories. XFS employs B+ trees to manage dynamic allocationof inodes, free space, and to map the data and meta-data of files/directories. XFS stores all dataand meta-data in variable sized, contiguousextents. Further, XFS’s partition is divided into fixed-sized regions calledallocation groups(AGs), which are similar to block groups in Ext2/3, but aredesigned for scalability and parallelism. Each AG manages the free space and inodes of its groupindependently; increasing the number of allocation groupsscales up the number of parallel filesystem requests, but too many AGs also increases fragmentation. The default AG count value is
9
16. XFS creates a cluster of inodes in an AG as needed, thus notlimiting the maximum num-ber of files. XFS uses a delayed allocation policy that helps in getting large contiguous extents,and increases the performance of applications using large-sized files (e.g., databases). However,this increases memory utilization. XFS tracks AG free spaceusing two B+ trees: the first B+tree tracks free space by block number and the second tracks by the size of the free space block.XFS supports only meta-data journalling (writeback). Although XFS was designed for scalability,we evaluate all file systems using different file sizes and directory depths. Apart from evaluatingXFS’s common format and mount options, we also varied its AG count.
3.4.3 Reiserfs
The Reiserfs partition is divided into blocks of fixed size. Reiserfs uses abalanced S+ tree[35] tooptimize lookups, reference locality, and space-efficientpacking. The S+ tree consists of internalnodes, formatted leaf nodes, and unformatted nodes. Each internal node consists of key-pointerpairs to its children. The formatted nodes pack objects tightly, calleditems; each item is referencedthrough a unique key (akin to an inode number). These items include: stat items(file meta-data),directory items(directory entries),indirect items(similar to inode block lists), anddirect items(tails of files less than 4K). A formatted node accommodates items of different files and directories.Unformatted nodes contain raw data and do not assist in tree lookup. The direct items and thepointers inside indirect items point to these unformatted nodes. The internal and formatted nodesare sorted according to their keys. As a file’s meta-data and data is searched through the combinedS+ tree using keys, Reiserfs scales well for a large and deep file system hierarchy. Reiserfs hasa unique feature we evaluated calledtail packing, intended to reduce internal fragmentation andoptimize the I/O performance of small sized files (less than 4K). Tail-packing support is enabledby default, and groups different files in the same node. Theseare referenced using direct pointers,called the tail of the file. Although the tail option looks attractive in terms of space efficiencyand performance, it incurs an extra cost during reads if the tail is spread across different nodes.Similarly, additional appends to existing tail objects lead to unnecessary copy and movement ofthe tail data, hurting performance. We evaluated all three journalling modes of Reiserfs.
3.5 Energy Breakdown
Active vs. passive energy Even when a server does not perform any work, it consumes someenergy. We call this energyidle or passive. The file system selection alone cannot reduce idlepower, but combined with right-sizing techniques, it can improve power efficiency by prolongingidle periods. Theactive power of a node is an additional power drawn by the system whenitperforms useful work. Different file systems exercise the system’s resources differently, directlyaffecting active power. Although file systems affect activeenergy only, users often care about totalenergy used. Therefore, we report only total power used.
Hard disk vs. node power On machine 1, we collected power consumption readings for theexternal disk drive and the test node separately. We measured our hard disk’s idle power to be 7watts, matching its specification. We wrote a tool that constantly performs direct I/O to distant
10
disk tracks to maximize its power consumption, and measureda maximum power of 22 watts.However, the average disk power consumed for our experiments was only 14 watts with littlevariations. This is because the workloads exhibited high locality, heavy CPU/memory use, andmany I/O requests were satisfied from caches. Whenever the workloads did exercise the disk, itspower consumption was still small relative to the total power. Therefore, on machine 2 we onlycollected total energy consumed by the system and did not segregate the energy consumed by thedisk. For the rest of this thesis, we report only total systempower consumption (disk included).
A node’s power consumption consists of its components’ power. The idle-to-peak power formachine 1 was 214–279W. The CPU tends to be a major contributor, in our case from 86–165W(i.e., Intel’s SpeedStep technology). However, the behavior of power consumption within a com-puter is complex due to thermal effects and feedback loops. For example, our CPU’s core poweruse can drop to a mere 27W if its temperature is cooled to50 ◦C, whereas it consumes 165W at anormal temperature of76 ◦C. Motherboards today include dynamic system and CPU fans whichturn on/off or change their speeds; while they reduce power elsewhere, the fans consume somepower themselves. For simplicity, our thesis reports only total system power consumption.
FS vs. other software power consumption It is reasonable to question how much energy does afile system consume compared to other software components. According to Almeida et al., a Webserver saturated by client requests spends 90% of the time inkernel space, invoking mostly filesystem related system calls [2]. In general, if a user-spaceprogram is not computationally inten-sive, it frequently invokes system calls and spends a lot of time in kernel space. Therefore, it makessense to focus the efforts on analyzing energy efficiency of file systems. Moreover, our results inChapter 4 support this fact: changing only the file system type can increase power/performancenumbers up to a factor of 9.
11

Chapter 4
Evaluation
In this chapter, we detail our results and analysis. We abbreviated the terms Ext2, Ext3, Reis-erfs, and XFS ase2, e3, r, andx, respectively. File systems formatted with block size of 1Kand 2K are denotedblk1k andblk2k, respectively;isz1k denotes 1K inode sizes;bg16kdenotes 16K block group sizes;dtlg andwrbck denote data and writeback journal modes, re-spectively;nolog denotes Reiserfs’s no-logging feature; allocation group count is abbreviated asagc followed by number of groups (8, 32, etc.), no-atime is denoted asnoatm.
Section 4.1 provides and overview of our metrics and terms. We provide details about theWeb, File, Mail, and DB workload results on machine 1 and 2 in Sections 4.2 and 4.3, respec-tively. Section 4.4 provides recommendations for selecting file system features that best suit theworkloads.
220
240
260
280
300
320
0 10 20 30 40 50 60 70
Ave
rage
Pow
er (
Wat
ts)
Load (1000 ops/sec)
Ext2Ext3XFS
Reiserfs
Figure 4.1: Webserver: Mean power consumption by Ext2, Ext3, Reiserfs, and XFS at differentload levels on machine 1. They-axis scale starts at 220 Watts. Ext2 does not scale above 10,000ops/sec.
12
4.1 Overview
In all our tests, we collected two raw metrics: performance (from FileBench), and the averagepower of the machine and disk (from watt-meters). FileBenchreports file system performanceunder different workloads in units ofoperations per second(ops/sec). As each workload targetsa different application domain, this metric is not comparable across workloads: A Web server’sops/sec are not the same as, say, the database server’s. Their magnitude also varies: the Webserver’s rates numbers are two orders of magnitude larger than other workloads. Therefore, wereport Web server performance in 1,000 ops/sec, and just ops/sec for the rest.
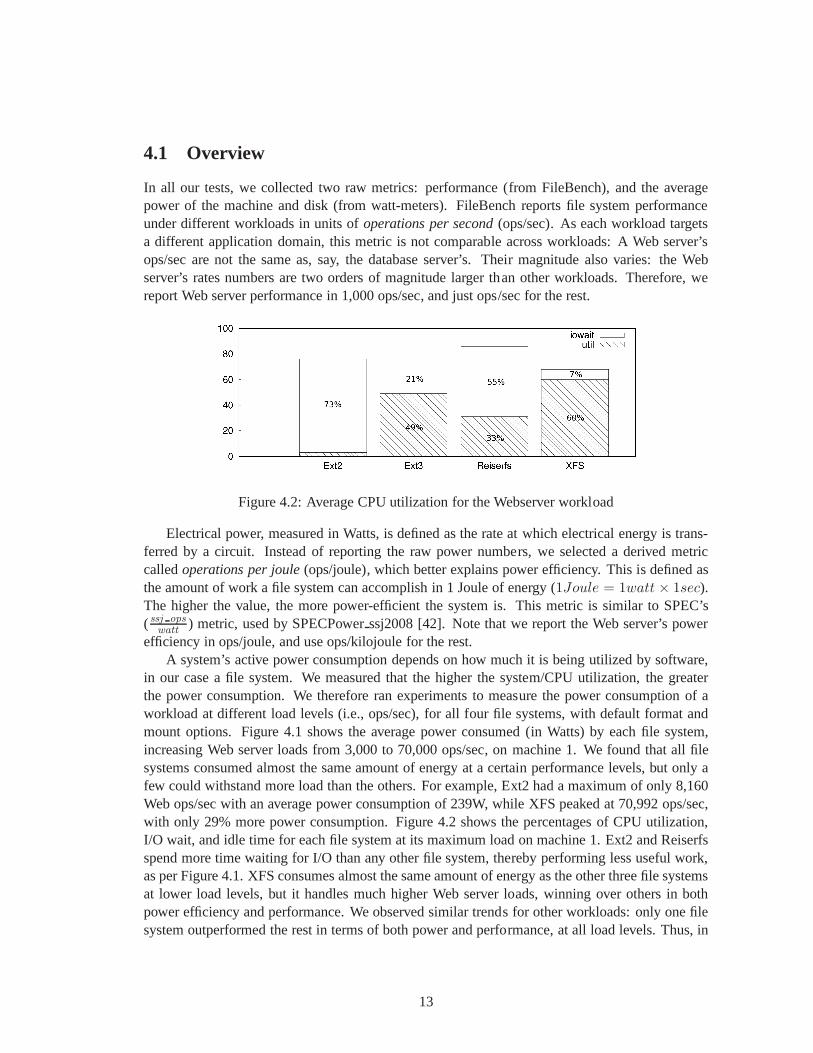
Figure 4.2: Average CPU utilization for the Webserver workload
Electrical power, measured in Watts, is defined as the rate atwhich electrical energy is trans-ferred by a circuit. Instead of reporting the raw power numbers, we selected a derived metriccalledoperations per joule(ops/joule), which better explains power efficiency. This is defined asthe amount of work a file system can accomplish in 1 Joule of energy (1Joule = 1watt × 1sec).The higher the value, the more power-efficient the system is.This metric is similar to SPEC’s( ssj ops
watt) metric, used by SPECPowerssj2008 [42]. Note that we report the Web server’s power
efficiency in ops/joule, and use ops/kilojoule for the rest.A system’s active power consumption depends on how much it isbeing utilized by software,
in our case a file system. We measured that the higher the system/CPU utilization, the greaterthe power consumption. We therefore ran experiments to measure the power consumption of aworkload at different load levels (i.e., ops/sec), for all four file systems, with default format andmount options. Figure 4.1 shows the average power consumed (in Watts) by each file system,increasing Web server loads from 3,000 to 70,000 ops/sec, onmachine 1. We found that all filesystems consumed almost the same amount of energy at a certain performance levels, but only afew could withstand more load than the others. For example, Ext2 had a maximum of only 8,160Web ops/sec with an average power consumption of 239W, whileXFS peaked at 70,992 ops/sec,with only 29% more power consumption. Figure 4.2 shows the percentages of CPU utilization,I/O wait, and idle time for each file system at its maximum loadon machine 1. Ext2 and Reiserfsspend more time waiting for I/O than any other file system, thereby performing less useful work,as per Figure 4.1. XFS consumes almost the same amount of energy as the other three file systemsat lower load levels, but it handles much higher Web server loads, winning over others in bothpower efficiency and performance. We observed similar trends for other workloads: only one filesystem outperformed the rest in terms of both power and performance, at all load levels. Thus, in
13

the rest of this thesis we report only peak performance figures.
4.2 Machine 1 Results
This section details the results on machine 1, which is a three year old machine as describedin Table 3.1. We first analyze the results for the Web, File, Mail and Database servers in Sec-tions 4.2.1–4.2.4. Section 4.2.5 provides recommendations for selecting the optimal file systemfor machines that match the configuration of machine 1.
4.2.1 Webserver Workload
0
20
40
60
80
e3-dtlg
e3-wrbck
r-dtlgr-wrbck
r-nolog
r-notail
r-noatm
x-noatm
e3-noatm
e2-noatm
x-agc128
x-agc64
x-agc32
x-agc8
e3-bg16k
e2-bg16k
x-isz1k
e3-isz1k
e2-isz1k
x-blk2k
x-blk1k
r-blk2k
r-blk1k
e3-blk2k
e3-blk1k
e2-blk2k
e2-blk1k
x-def
r-defe3-def
e2-def
Pe
rfo
rma
nce
(1
00
0 o
ps/s
ec)
8.2
58.4
29.6
71.0
2.9 2.9
38.751.5
8.114.4
69.5 70.8
5.4
58.3
76.8
13.1
57.1
71.2 71.4 71.8 71.8
5.2
60.8
71.0 73.867.6
30.1 27.620.1
21.9
42.7
(a) File system Webserver workload performance (in 1000 ops/sec)
0
50
100
150
200
250
e3-dtlg
e3-wrbck
r-dtlgr-wrbck
r-nolog
r-notail
r-noatm
x-noatm
e3-noatm
e2-noatm
x-agc128
x-agc64
x-agc32
x-agc8
e3-bg16k
e2-bg16k
x-isz1k
e3-isz1k
e2-isz1k
x-blk2k
x-blk1k
r-blk2k
r-blk1k
e3-blk2k
e3-blk1k
e2-blk2k
e2-blk1k
x-def
r-defe3-def
e2-def
En
erg
y E
ffic
ien
cy (
op
s/jo
ule
)
32
196
109
229
11 11
137174
3358
223 227
21
191
242
49
190
230 230 232 231
21
205230 239
215
111 10278
83
151
(b) File system energy efficiency for Webserver workload (inops/joule)
Figure 4.3:Webserver results on Machine 1
As we see in Figures 4.3(a) and 4.3(b), XFS proved to be the most power- and performance-efficient file system. XFS performed 9 times better than Ext2,as well as 2 times better thanReiserfs, in terms of both power and performance. Ext3 lagged behind XFS by 22%. XFS winsover all the other file systems as it handles concurrent updates to a single file efficiently, withoutincurring a lot of I/O wait (Figure 4.2), thanks to its journal design. XFS maintains an active itemlist, which it uses to prevent meta-data buffers from being written multiple times if they belong tomultiple transactions. XFS pins a meta-data buffer to prevent it from being written to the disk untilthe log is committed. As XFS batches multiple updates to a common inode together, it utilizes theCPU better. We observed a linear relationship between power-efficiency and performance for theWeb server workload, so we report below on the basis of performance alone.
Ext2 performed the worst and exhibited inconsistent behavior. Its standard deviation was ashigh as 80%, even after 30 runs. We plotted the performance values on a histogram and ob-
14
served that Ext2 had a non-Gaussian (long-tailed) distribution. Out of 30 runs, 21 runs (70%)consumed less than 25% of the CPU, while the remaining ones used up to 50%, 75%, and 100%of the CPU (three runs in each bucket). We wrote a micro-benchmark which ran for a fixed timeperiod and appended to 3 common files shared between 100 threads. We found that Ext3 per-formed 13% fewer appends than XFS, while Ext2 was 2.5 times slower than XFS. We then ran amodified Web server workload withonly reads and no log appends. In this case, Ext2 and Ext3performed the same, with XFS lagging behind by 11%. This is because XFS’slookup operationtakes more time than other file systems for deeper hierarchy (see Section 4.2.2). As XFS handlesconcurrent writes better than the others, it overcomes the performance degradation due to slowlookups and outperforms in the Web server workload. OSprof results [21] revealed that the aver-age latency ofwrite super for Ext2 was 6 times larger than Ext3. Analyzing the file systems’source code helped explain this inconsistency. First, as Ext2 does not have a journal, it com-mits superblock and inode changes to the on-disk image immediately, without batching changes.Second, Ext2 takes the global kernel lock (aka BKL) while calling ext2 write super andext2 write inode, which further reduce parallelism: all processes using Ext2 which try tosync an inode or the superblock to disk will contend with eachother, increasing wait times signif-icantly. On the contrary, Ext3 batches all updates to the inodes in the journal and only when theJBD layer callsjournal commit transaction are all the metadata updates actually syncedto the disk (after committing the data). Although journalling was designed primarily for reliabilityreasons, we conclude that a careful journal design can help some concurrent-write workloads akinto LFS [38].
Reiserfs exhibits poor performance for different reasons than Ext2 and Ext3. As Figures 4.3(a)and 4.3(b) show, Reiserfs (default) performed worse than both XFS and Ext3, but Reiserfs withthenotailmount option outperformed Ext3 by 15% and the default Reiserfs by 2.25 times. Thereason is that by default thetail option is enabled in Reiserfs, which tries to pack all files lessthan 4KB in one block. As the Web server has an average file sizeof just 32KB, it has many filessmaller than 4KB. We confirmed this by runningdebugreiserfs on the Reiserfs partition:it showed that many small files had their data spread across the different blocks (packed alongwith other files’ data). This resulted in more than one data block access for each file read, therebyincreasing I/O, as seen in Figure 4.2. We concluded that unlike Ext2 and Ext3, the default Reiserfsexperienced a performance hit due to its small file read design, rather than concurrent appends.This demonstrates that even simple Web server workload can still exercise different parts of filesystems’ code.
An interesting observation was that thenoatimemount option improved the performance ofReiserfs by a factor of 2.5 times. In other file systems, this option did not have such a significantimpact. The reason is that thereiserfs dirty inode function, which updates the accesstime field, acquires the BKL and then searches for the stat item corresponding to the inode in itsS+ tree to update theatime. As the BKL is held while updating each inode’s access time inapath, it hurts parallelism and reduces performance significantly. Also,noatime boosts Reiserfs’sperformance by this muchonly in the read-intensive Web server workload.
Reducing the block-size during format generally hurt performance, except in XFS. XFS wasunaffected thanks to its delayed allocation policy that allocates a large contiguous extent, irre-spective of the block size; this suggests that modern file systems should try to pre-allocate largecontiguous extents in anticipation of files’ growth. Reiserfs observed a drastic degradation of 2–
15
3× after decreasing the block size from 4KB (default) to 2KB and1KB, respectively. We foundfrom debugreiserfs that this led to an increase in the number of internal and formatted nodesused to manage the file system namespace and objects. Also, the height of the S+ tree grew from 4to 5, in case of 1KB. As the internal and formatted nodes depend on the block size, a smaller blocksize reduces the number of entries packed inside each of these nodes, thereby increasing the num-ber of nodes, and increasing I/O times to fetch these nodes from the disk during lookup. Ext2 andExt3 saw a degradation of 2× and 12%, respectively, because of the extra indirections needed toreference a single file. Note that Ext2’s 2× degradation was coupled with a high standard variationof 20–49%, for the same reasons explained above.
Quadrupling the XFS inode size from 256B to 1KB improved performance by only 8%. Wefound usingxfs db that a large inode allowed XFS to embed more extent information and direc-tory entries inside the inode itself, speeding lookups. As expected, the data journalling mode hurtperformance for both Reiserfs and Ext3 by 32% and 27%, respectively. The writeback journallingmode of Ext3 and Reiserfs degraded performance by 2× and 7%, respectively, compared to theirdefault ordered journalling mode. Increasing the block group count of Ext3 and the allocationgroup count of XFS had a negligible impact. The reason is thatthe Web server is a read-intensiveworkload, and does not need to update the different group’s metadata as frequently as a write-intensive workload would.
4.2.2 File Server Workload
0
100
200
300
400
e3-dtlg
e3-wrbck
r-dtlgr-wrbck
r-nolog
r-notail
r-noatm
x-noatm
e3-noatm
e2-noatm
x-agc128
x-agc64
x-agc32
x-agc8
e3-bg16k
e2-bg16k
x-isz1k
e3-isz1k
e2-isz1k
x-blk2k
x-blk1k
r-blk2k
r-blk1k
e3-blk2k
e3-blk1k
e2-blk2k
e2-blk1k
x-def
r-defe3-def
e2-def
Pe
rfo
rma
nce
(o
ps/s
ec)
325 310
443
232 215
298
225
301
115
242275 269
321 320
227
332 307
222 234
285 298321 311
233
445 443 442 423
254285 279
(a) Performance of file systems for the file server workload (in ops/sec)
0
500
1000
1500
2000
e3-dtlg
e3-wrbck
r-dtlgr-wrbck
r-nolog
r-notail
r-noatm
x-noatm
e3-noatm
e2-noatm
x-agc128
x-agc64
x-agc32
x-agc8
e3-bg16k
e2-bg16k
x-isz1k
e3-isz1k
e2-isz1k
x-blk2k
x-blk1k
r-blk2k
r-blk1k
e3-blk2k
e3-blk1k
e2-blk2k
e2-blk1k
x-def
r-defe3-def
e2-def
En
erg
y E
ffic
ien
cy (
op
s/k
ilojo
ule
)
1314 1235
1846
938 853
1202
894
1207
482
10191100 1078
1297 1259
937
13291223
890 951
11731005
1297 1241
937
1819 1850 18481711
1064 1126 1169
(b) Energy efficiency of file systems for the file server workload (in ops/kilojoule)
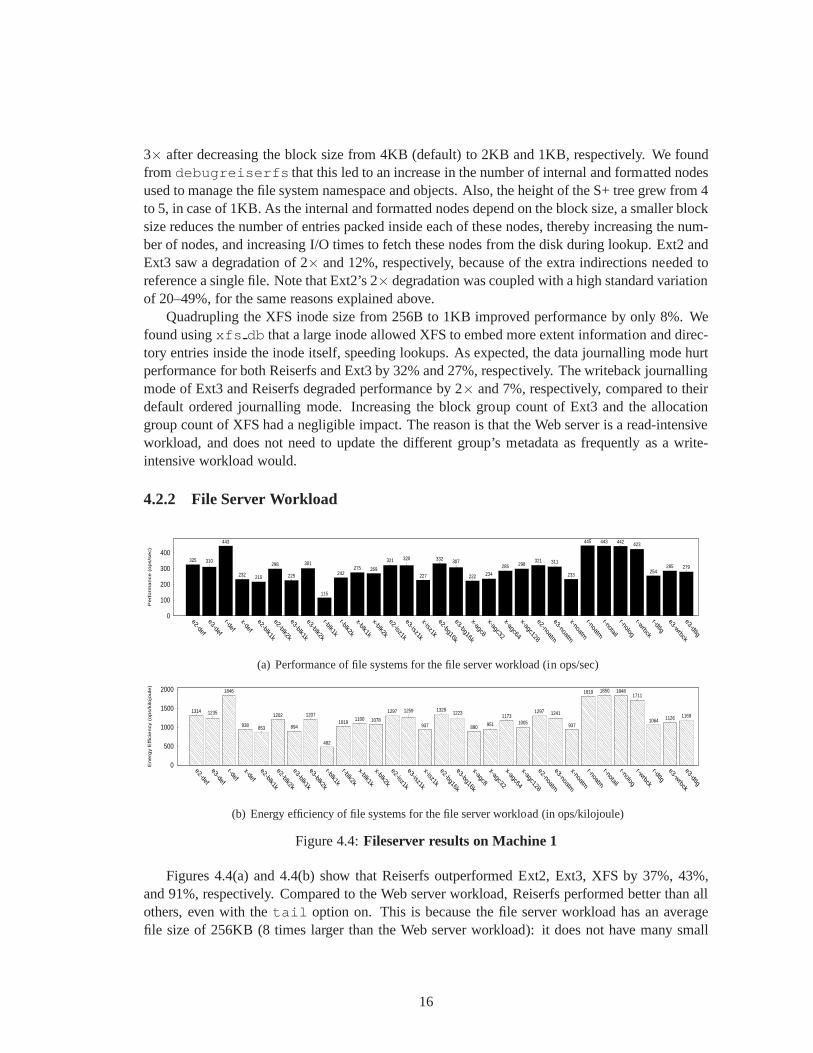
Figure 4.4:Fileserver results on Machine 1
Figures 4.4(a) and 4.4(b) show that Reiserfs outperformed Ext2, Ext3, XFS by 37%, 43%,and 91%, respectively. Compared to the Web server workload,Reiserfs performed better than allothers, even with thetail option on. This is because the file server workload has an averagefile size of 256KB (8 times larger than the Web server workload): it does not have many small
16
files spread across different nodes, thereby showing no difference between Reiserfs’s (tail) andno-tail options.
Analyzing using OSprof revealed that XFS consumed 14% and 12% more time inlookupandcreate, respectively, than Reiserfs. Ext2 and Ext3 spent 6% more time in bothlookup andcreate than Reiserfs. To exercise only the lookup path, we executeda simple micro-benchmarkthat only performed open and close operations on 50,000 filesby 100 threads, and we used thesame fileset parameters as that of the file server workload (see Table 3.2). We found that XFSperformed 5% fewer operations than Reiserfs, while Ext2 andExt3 performed close to Reiserfs.As Reiserfs packs data and meta-data all in one node and maintains a balanced tree, it has fasterlookups thanks to improved spatial locality. Moreover, Reiserfs stores objects by sorted keys,further speeding lookup times. Although XFS uses B+ trees tomaintain its file system objects,its spatial locality is worse than that of Reiserfs, as XFS has to perform more hops between treenodes.
Unlike the Web server results, Ext2 performed better than Ext3, and did not show high standarddeviations. This was because in a file server workload, each thread works on an independent setof files, with little contention to update a common inode.
We discovered an interesting result when varying XFS’s allocation group (AG) count from 8to 128, in powers of two (default is 16). XFS’s performance increased from 4% to 34% (comparedto AG of 8). But, XFS’s power efficiency increased linearly only until the AG count hit 64, afterwhich the ops/kilojoule count dropped by 14% (for AG count of128). Therefore, XFS’ AG countexhibited anon-linearrelationship between power-efficiency and performance. Asthe number ofAGs increases, XFS’s parallelism improves too, boosting performance even when dirtying eachAG at a faster rate. However, all AGs share a common journal: as the number of AGs increases,updating the AG descriptors in the log becomes a bottleneck;we see diminishing returns beyondAG count of 64. Another interesting observation is that AG count increases had a negligible effectof only 1% improvement for the Web server, but a significant impact in file server workload. Thisis because the file server has a greater number of meta-data activities and writes than the Webserver (see Chapter 3), thereby accessing/modifying the AGdescriptors frequently. We concludethat the AG count is sensitive to the workload, especially read-write and meta-data update ratios.Lastly, the block group count increase in Ext2 and Ext3 had a small impact of less than 1%.
Reducing the block size from 4KB to 2KB improved the performance of XFS by 16%, whilea further reduction to 1KB improved the performance by 18%. Ext2, Ext3, and Reiserfs sawa drop in performance, for the reasons explained in Section 4.2.1. Ext2 and Ext3 experienceda performance drop of 8% and 3%, respectively, when going from 4KB to 2KB; reducing theblock size from 2KB to 1KB degraded their performance further by 34% and 27%, respectively.Reiserfs’s performance declined by a 45% and 75% when we reduced the block size to 2KB and1KB, respectively. This is due to the increased number of internal node lookups, which increasedisk I/O as discussed in Section 4.2.1.
The no-atime options did not affect performance or power efficiency of anyfile systembecause this workload is not read-intensive and had a ratio of two writes for each read. Changingthe inode size did not have an effect on Ext2, Ext3, or XFS. As expected, data journalling reducedthe performance of Ext3 and Reiserfs by 10% and 43%, respectively. Writeback-mode journallingalso showed a performance reduction by 8% and 4% for Ext3 and Reiserfs, respectively.
17
0
500
1000
1500
2000
e3-dtlg
e3-wrbck
r-dtlgr-wrbck
r-nolog
r-notail
r-noatm
x-noatm
e3-noatm
e2-noatm
x-agc128
x-agc64
x-agc32
x-agc8
e3-bg16k
e2-bg16k
x-isz1k
e3-isz1k
e2-isz1k
x-blk2k
x-blk1k
r-blk2k
r-blk1k
e3-blk2k
e3-blk1k
e2-blk2k
e2-blk1k
x-def
r-defe3-def
e2-def
Pe
rfo
rma
nce
(o
ps/s
ec)
946
13501446
319
554
781638
940
597
1223
406 377
971
1462
307
1002
1300
326 328 326 329
966
1360
312
1518
1858
13261448
11571274
1384
(a) Performance of file systems under the varmail workload (in ops/sec)
0
2000
4000
6000
8000
e3-dtlg
e3-wrbck
r-dtlgr-wrbck
r-nolog
r-notail
r-noatm
x-noatm
e3-noatm
e2-noatm
x-agc128
x-agc64
x-agc32
x-agc8
e3-bg16k
e2-bg16k
x-isz1k
e3-isz1k
e2-isz1k
x-blk2k
x-blk1k
r-blk2k
r-blk1k
e3-blk2k
e3-blk1k
e2-blk2k
e2-blk1k
x-def
r-defe3-def
e2-def
En
erg
y E
ffic
ien
cy (
op
s/k
ilojo
ule
)
4003
5797 6047
1366
2348
33002699
4009
2560
5110
1725 1602
4089
6250
1312
4219
5507
1397 1397 1392 1408
3979
5813
1305
6339
7716
5573 6037
47815470 5722
(b) Energy efficiency of file systems under the varmail workload (in ops/kilojoule)
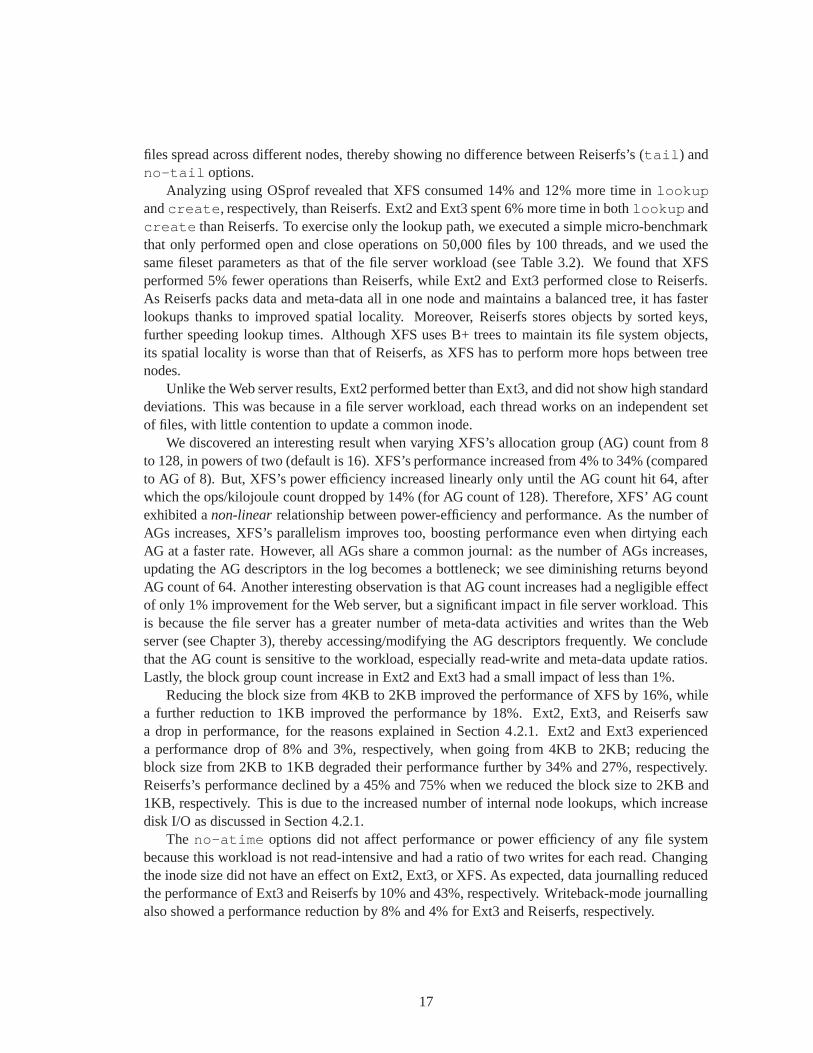
Figure 4.5:Varmail results on Machine 1
4.2.3 Mail Server
As seen in Figures 4.5(a) and 4.5(b), Reiserfs performed thebest amongst all, followed by Ext3which differed by 7%. Reiserfs beats Ext2 and XFS by 43% and 4×, respectively. Although themail server’s personality in FileBench is similar to the fileserver’s, we observed differences intheir results, because the mail server workload callsfsync after each append, which is not in-voked in the file server workload. Thefsync operation hurts the non-journalling version of filesystems: hurting Ext2 by 30% and Reiserfs-nolog by 8% as compared to Ext3 and default Reis-erfs, respectively. We confirmed this by running a micro-benchmark in FileBench which createdthe same directory structure as the mail server workload andperformed the following sequenceof operations: create, append, fsync, open, append, and fsync. This showed that Ext2 was 29%slower than Ext3. When we repeated this after removing all fsync calls, Ext2 and Ext3 performedthe same. Ext2’s poor performance with fsync calls is because itsext2 sync file call ulti-mately invokesext2 write inode, which exhibits a larger latency than thewrite inodefunction of other file systems. XFS’s poor performance was due to its slowerlookup operations.
Figure 4.5(a) shows that Reiserfs withno-tail beats all the variants of mount and formatoptions, improving over default Reiserfs by 29%. As the average file size here was 16KB, theno-tail option boosted the performance similar to the Web server workload.
As in the Web server workload, when the block size was reducedfrom 4KB to 1KB, theperformance of Ext2 and Ext3 dropped by 41% and 53%, respectively. Reiserfs’s performancedropped by 59% and 15% for 1KB and 2KB, respectively. Although the performance of Reiserfsdecreased upon reducing the block size, the percentage degradation was less than seen in the Weband file server. The flat hierarchy of the mail server attributed to this reduction in degradation; asall files resided in one large directory, the spatial locality of the meta data of these files increases,helping performance a bit even with smaller block sizes. Similar to the file server workload,
18
0 50
100 150 200 250 300 350 400 450
e3-dtlg
e3-wrbck
r-dtlgr-wrbck
r-nolog
r-notail
r-noatm
x-noatm
e3-noatm
e2-noatm
x-agc128
x-agc64
x-agc32
x-agc8
e3-bg16k
e2-bg16k
x-isz1k
e3-isz1k
e2-isz1k
x-blk2k
x-blk1k
r-blk2k
r-blk1k
e3-blk2k
e3-blk1k
e2-blk2k
e2-blk1k
x-def
r-defe3-def
e2-def
Pe
rfo
rma
nce
(o
ps/s
ec)
182217 209 220
361
429392
429
377402
442 442
210 213 217194 199 215 215 217 220
182216 218 205 207 206 206
271
207 194
(a) Performance of file systems for the OLTP workload (in ops/sec)
0
200
400
600
800
1000
1200
1400
e3-dtlg
e3-wrbck
r-dtlgr-wrbck
r-nolog
r-notail
r-noatm
x-noatm
e3-noatm
e2-noatm
x-agc128
x-agc64
x-agc32
x-agc8
e3-bg16k
e2-bg16k
x-isz1k
e3-isz1k
e2-isz1k
x-blk2k
x-blk1k
r-blk2k
r-blk1k
e3-blk2k
e3-blk1k
e2-blk2k
e2-blk1k
x-def
r-defe3-def
e2-def
En
erg
y E
ffic
ien
cy (
op
s/k
ilojo
ule
)
525630 611 641
1048
12451138
1242
10971167
1279 1277
609 620 628560 575 622 622 629 637
527628 632 594 603 602 602
787
601 547
(b) Energy efficiency of file systems for the OLTP workload (inops/kilojoule)
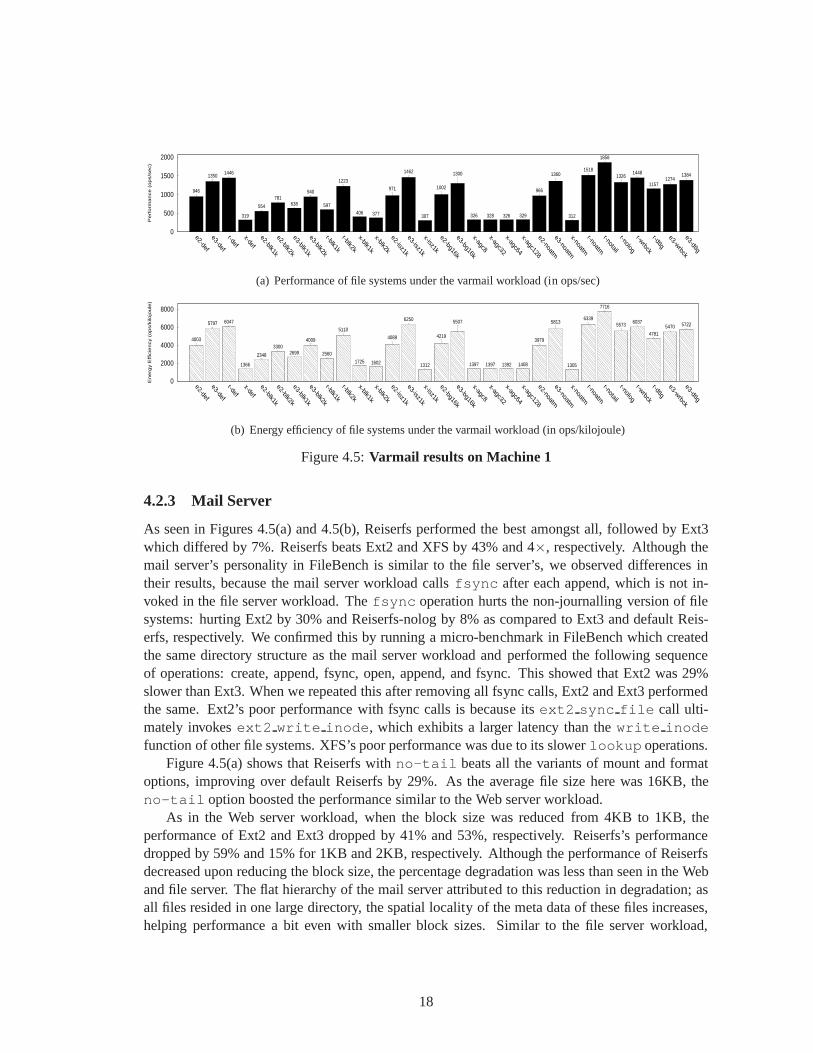
Figure 4.6:OLTP results on Machine 1
reduction in block size increased the overall performance of XFS.XFS’s allocation group (AG) count and the block group count of Ext2 and Ext3 had minimal
effect within the confidence interval. Similarly, theno-atime option and inode size did notimpact the efficiency of file server significantly. The data journalling mode decreased Reiserfs’sperformance by 20%, but had a minimal effect on Ext3. Finally, the writeback journal modedecreased Ext3’s performance by 6%.
4.2.4 Database Server Workload (OLTP)
Figures 4.6(a) and 4.6(b) show that all four file systems perform equally well in terms of bothperformance and power-efficiency with the default mount/format options, except for Ext2. Itexperiences a performance degradation of about 20% as compared to XFS. As explained in Sec-tion 4.2.1, Ext2’s lack of a journal makes its random write performance worse than any otherjournalled file system, as they batch inode updates.
In contrast to other workloads, the performance ofall file systems increases by a factor ofaround 2× if we decrease the block size of the file system from the default 4KB to 2KB. Thisis because the 2KB block size better matches the I/O size of OLTP workload (see Table 3.2), soevery OLTP write request fits perfectly into the file system’sblock size. But, a file-system blocksize of 4KB turns a 2KB write into a read-modify-write sequence, requiring an extra read perI/O request. This proves an important point that keeping thefile system block size close to theworkload’s I/O size can impact the efficiency of the system significantly. OLTP’s performancealso increased when using a 1KB block size, but was slightly lower than that obtained by 2KBblock size, due to an increased number of I/O requests.
An interesting observation was that on decreasing the number of blocks per group from 32KB(default) to 16KB, Ext2’s performance improved by 7%. Moreover, increasing the inode size
19
up to 1KB improved performance by 15% as compared to the default configuration. Enlargingthe inode size in Ext2 has an indirect effect on the blocks pergroup: the larger the inode size,the fewer the number of blocks per group. A 1KB inode size resulted in 8KB blocks per group,thereby doubling the number of block groups and increasing the performance as compared to thee2-bg16K case. Varying the AG count had a negligible effect on XFS’s numbers. Unlike Ext2,the inode size increase did not affect any other file system.
Interestingly, we observed that the performance of Reiserfs increased by 30% on switchingfrom the default ordered mode to the data journalling mode. In data journalling mode as allthe data is first written to the log, random writes become logically sequential and achieve betterperformance than the other journalling modes.
In contrast to the Web server workload, theno-atime option does not have any effect onthe performance of Reiserfs, although the read-write ratiois 20:1. This is because the databaseworkload consists of only 10 large files and hence the meta-data of these small number of files (i.e.,stat items) accommodate in a few formatted nodes as comparedto the Web server workload whichconsists of 20,000 files with their meta-data scattered across multiple formatted nodes. Reiserfs’no-tail option had no effect on the OLTP workload due to the large sizeof its files.
4.2.5 Summary and Recommendations for Machine 1
We now summarize the combined results of our study on machine1. We then offer advice toserver operators, as well as designers of future systems.
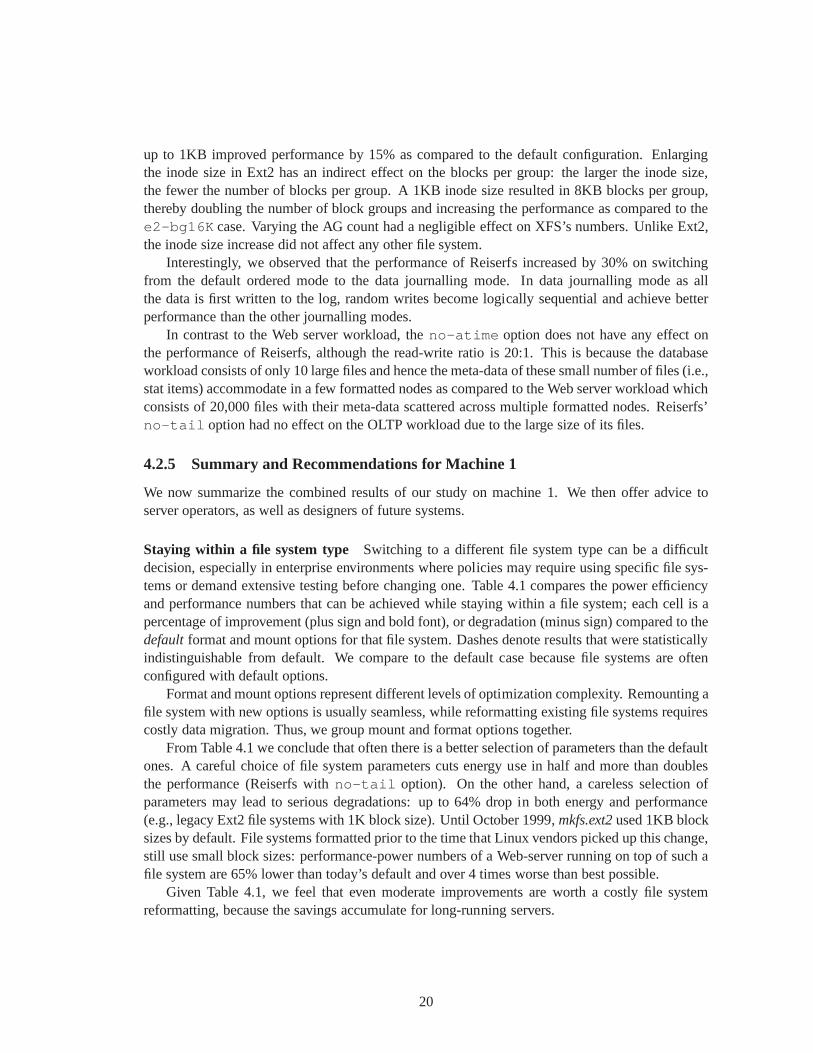
Staying within a file system type Switching to a different file system type can be a difficultdecision, especially in enterprise environments where policies may require using specific file sys-tems or demand extensive testing before changing one. Table4.1 compares the power efficiencyand performance numbers that can be achieved while staying within a file system; each cell is apercentage of improvement (plus sign and bold font), or degradation (minus sign) compared to thedefaultformat and mount options for that file system. Dashes denote results that were statisticallyindistinguishable from default. We compare to the default case because file systems are oftenconfigured with default options.
Format and mount options represent different levels of optimization complexity. Remounting afile system with new options is usually seamless, while reformatting existing file systems requirescostly data migration. Thus, we group mount and format options together.
From Table 4.1 we conclude that often there is a better selection of parameters than the defaultones. A careful choice of file system parameters cuts energy use in half and more than doublesthe performance (Reiserfs withno-tail option). On the other hand, a careless selection ofparameters may lead to serious degradations: up to 64% drop in both energy and performance(e.g., legacy Ext2 file systems with 1K block size). Until October 1999,mkfs.ext2used 1KB blocksizes by default. File systems formatted prior to the time that Linux vendors picked up this change,still use small block sizes: performance-power numbers of aWeb-server running on top of such afile system are 65% lower than today’s default and over 4 timesworse than best possible.
Given Table 4.1, we feel that even moderate improvements areworth a costly file systemreformatting, because the savings accumulate for long-running servers.
20
FSOption Webserver Fileserver Varmail Database
Type Name Perf. Pow. Perf. Pow. Perf. Pow. Perf. Pow.
Ext2
mount noatime -37%† -35% - - - - - -format blk1k -64%† -65% -34% -35% -41% -41% +98% +100%
blk2k -65% -65% -8% -9% -17% -18% +136% +137%isz1k -34%† -35% - - - - +15% +16%bg16k +60% † +53% - - +6% +5% +7% +7%
Ext3
mount noatime +4% +5% - - - - - -dtlg -27% -23% -10% -5% - - -11% -13%
wrbck -63% -57% -8% -9% -6% -5% -5% -5%format blk1k -34% -30% -27% -28% -53% -53% +81% +81%
blk2k -12% -11% - - -30% -31% +98% +97%isz1k - - - - +8% +8% - -bg16k - - - - -4% -5% -8% -9%
Reiser
mount noatime +149% +119% - - +5% +5% - -notail +128% +96% - - +29% +28% - -nolog - - - - -8% -8% - -wrbck -7% -7% -4% -7% - - - -dtlg -32% -29% -43% -42% -20% -21% +30% +29%
format blk1k -73% -70% -74% -74% -59% -58% +80% +80%blk2k -51% -47% -45% -45% -15% -16% +92% +91%
XFS
mount noatime - - - - - - - -format blk1k - - +18% +17% +27% +17% +101% +100%
blk2k - - +16% +15% +18% +17% +101% +99%isz1k +8% +6% - - - - - -agcnt8 - - -4% -5% - - - -agcnt32 - - - - - - - -agcnt64 - - +23% +25% - - - -agcnt128 - - +29% +8% - - - -
Table 4.1: File systems’ performance and power, varying options, relative to the default onesfor each file system for machine 1:Improvements are highlighted in bold. A† denotes the resultswith coefficient of variation over 40%. A dash signifies statistically indistinguishable results.
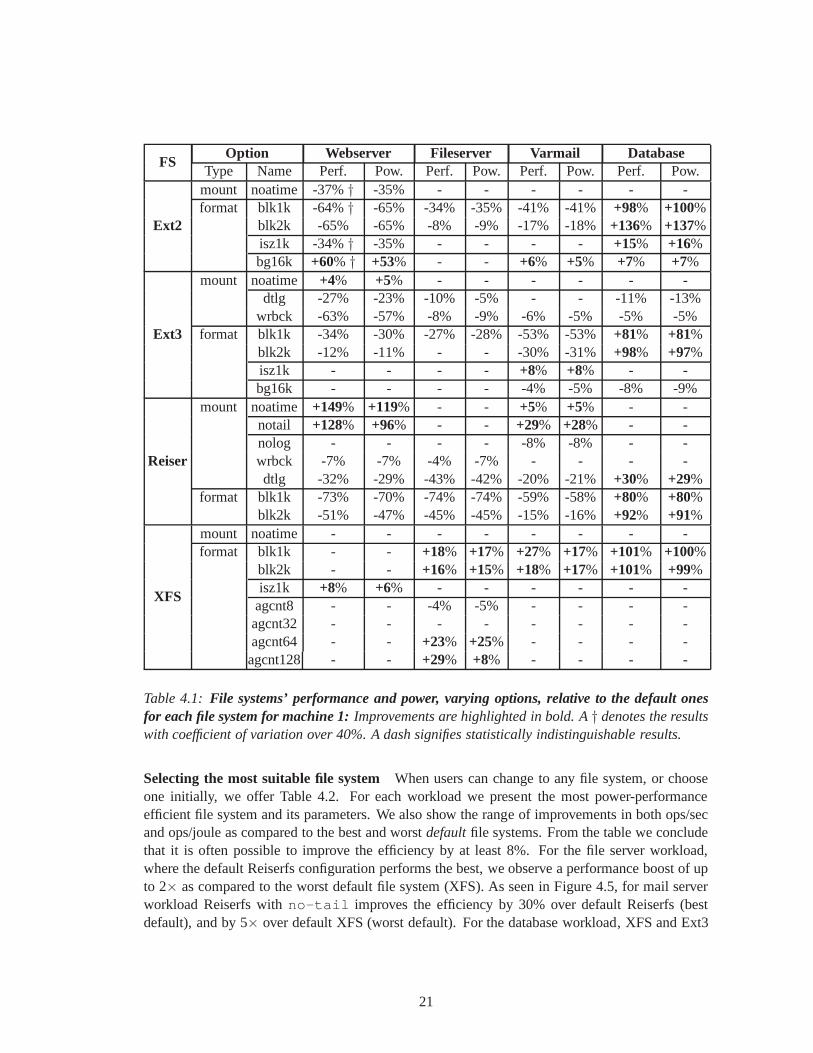
Selecting the most suitable file system When users can change to any file system, or chooseone initially, we offer Table 4.2. For each workload we present the most power-performanceefficient file system and its parameters. We also show the range of improvements in both ops/secand ops/joule as compared to the best and worstdefaultfile systems. From the table we concludethat it is often possible to improve the efficiency by at least8%. For the file server workload,where the default Reiserfs configuration performs the best,we observe a performance boost of upto 2× as compared to the worst default file system (XFS). As seen in Figure 4.5, for mail serverworkload Reiserfs withno-tail improves the efficiency by 30% over default Reiserfs (bestdefault), and by 5× over default XFS (worst default). For the database workload, XFS and Ext3
21
Server Recom. FS Ops/Sec Ops/JouleWeb x-isz1k 1.08–9.4× 1.06–7.5×File r-def 1.0–1.9× 1.0–2.0×Mail r-notail 1.3–5.8× 1.3–5.7×DB x/e3-blk2k 2–2.4× 2–2.4×
Table 4.2:Recommended file systems for machine 1:We provide the range of performance andpower-efficiency improvements achieved compared to the best and the worst default configuredfile systems.
with a block size of 2KB improved the efficiency of the system by at least two-fold. Whereas inmost cases, performance and energy improved by nearly the same factor, in XFS they did not: forthe Webserver workload, XFS with 1K inode sizes increased performance by a factor of 9.4 andenergy improved by a factor of 7.5.
Some file system parameters listed in Table 4.1 can be combined, possibly yielding cumula-tive improvements. We analyzed several such combinations and concluded that each case requirescareful investigation. For example, Reiserfs’snotail andnoatime options, independently,improved the Webserver’s performance by 149% and 128%, respectively; but their combined ef-fect only improved performance by 155%. The reason for this was that both parameters affectedthe same performance component—wait time—either by reducing BKL contention slightly or byreducing I/O wait time. However, the CPU’s utilization remained high and dominated overallperformance. On the other hand, XFS’sblk2k andagcnt64 format options, which improvedperformance by 18% and 23%, respectively—combined together to yield a cumulative improve-ment of 41%. The reason here is that these were options which affected different code pathswithout having other limiting factors.
4.3 Machine 2 Results
This section details the results on machine 2, which is a recent machine as described in Table 3.1.As machine 2 was equipped with a slower RPM disk (i.e., half the speed of that of machine 1),the performance of the disk intensive workloads like OLTP and File server degraded from 7% to86% compared to machine 1. On the contrary, Mail server, which is a more memory-intensiveworkload, experienced a performance improvement of 35% to 3x on machine 2. This is becausemachine 2 had a more powerful CPU, faster FSB, larger L1/L2 caches, and more disk cache ascompared to machine 1. But, in both cases machine 2 turned outto be equally or sometimes evenmore energy efficient (i.e., ops/joule) than machine 1. Thisis because the average idle power ofmachine 2 is almost half that of machine 1, resulting in more energy-efficiency.
Although the CPU on machine 2 supported Dynamic Voltage and Frequency (DVFS), weobserved a linear relationship between performance and energy efficiency for all the workloads.This is because we ran all the workloads at peak levels, whichresulted in the maximum utilizationof the CPU, thereby ignoring the power saving feature of DVFS.
We observed a few different behaviors in the workloads as compared to the results on machine1. Some of the file system configurations which did not look appealing on machine 1, turned
22
to be a good choice for machine 2. This is because the file systems that were bottlenecked bythe slow speed/capacity of a certain hardware on machine 1, benefited on an improved hardwareconfiguration. We discuss a few of the interesting results inthe subsections below.
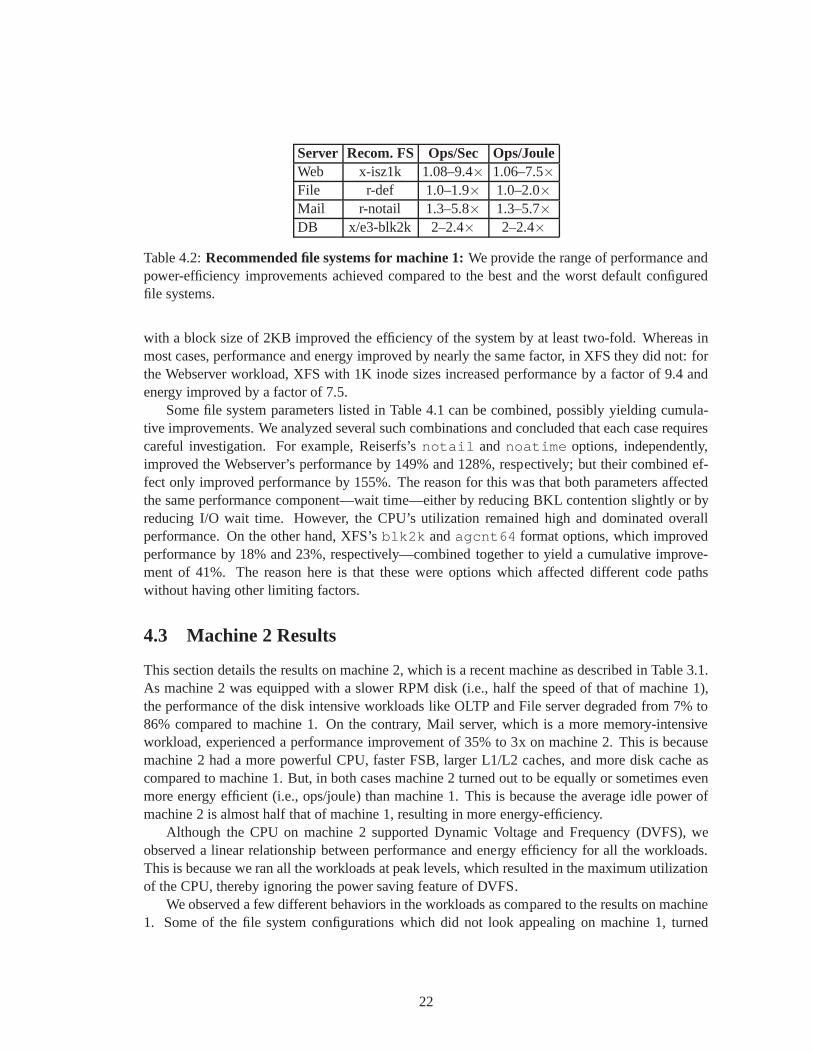
4.3.1 Webserver Workload
0
5
10
15
e3-dtlg
e3-wrbck
r-dtlgr-wrbck
r-nolog
r-notail
r-noatm
x-noatm
e3-noatm
e2-noatm
x-agc128
x-agc64
x-agc32
x-agc8
e3-bg16k
e2-bg16k
x-isz1k
e3-isz1k
e2-isz1k
x-blk2k
x-blk1k
r-blk2k
r-blk1k
e3-blk2k
e3-blk1k
e2-blk2k
e2-blk1k
x-def
r-defe3-def
e2-def
Pe
rfo
rma
nce
(1
00
0 o
ps/s
ec) 15
14 1413
14 14
1314 14
14
13 13
15 14
13
1514
1313 13 14
1514
1314 14 14 14 14
13 13
(a) File system Webserver workload performance (in 1000 ops/sec)
0
50
100
e3-dtlg
e3-wrbck
r-dtlgr-wrbck
r-nolog
r-notail
r-noatm
x-noatm
e3-noatm
e2-noatm
x-agc128
x-agc64
x-agc32
x-agc8
e3-bg16k
e2-bg16k
x-isz1k
e3-isz1k
e2-isz1k
x-blk2k
x-blk1k
r-blk2k
r-blk1k
e3-blk2k
e3-blk1k
e2-blk2k
e2-blk1k
x-def
r-defe3-def
e2-def
En
erg
y E
ffic
ien
cy (
op
s/jo
ule
) 122115 116
112116 118
108 113 114122
111 112121 117
113121 116
112 114 114 116121
116 111 115 117 116 117 116 111 112
(b) File system energy efficiency for Webserver workload (inops/joule)
Figure 4.7:Webserver results on Machine 2
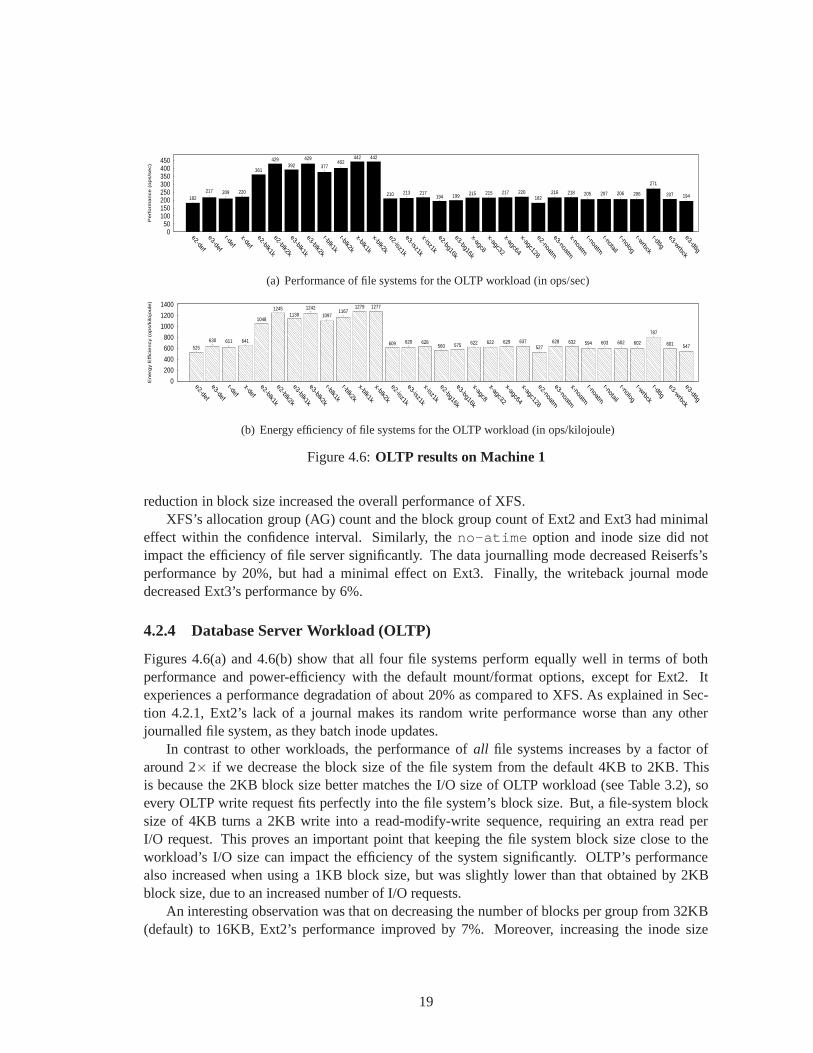
As seen in Figures 4.7(a) and 4.7(b), all the default configurations of the file systems performequally well on machine 2. This is in contrast to the observation on machine 1, which experienceda variation in performance ranging from 8% to as much as 9 times. This clearly shows howmodifications in the hardware can have a significant impact onthe software configuration choices.
If we compare the file system performance numbers across machine 1 and 2 (Figures 4.3(a)and 4.7(a)), we find that machine 1 performed much better thanmachine 2 in most of the file sys-tem configurations, ranging from 20% to as much as 5× (in different variants of XFS). Althoughmost of the working set of the Web server resides in memory, its append operation results in amemory pressure leading to evicting some of the useful page cache pages, which would be refer-enced in the near future. This results in fetching the files from the slower disk, causing a drop inperformance. The energy-efficiency of machine 1 was also better than that of machine 2 except ina few cases: all the configuration of Ext2 and Reiserfs with a block size of 1KB and 2KB.
23
4.3.2 File Server Workload
0
100
200
e3-dtlg
e3-wrbck
r-dtlgr-wrbck
r-nolog
r-notail
r-noatm
x-noatm
e3-noatm
e2-noatm
x-agc128
x-agc64
x-agc32
x-agc8
e3-bg16k
e2-bg16k
x-isz1k
e3-isz1k
e2-isz1k
x-blk2k
x-blk1k
r-blk2k
r-blk1k
e3-blk2k
e3-blk1k
e2-blk2k
e2-blk1k
x-def
r-defe3-def
e2-def
Pe
rfo
rma
nce
(o
ps/s
ec)
199 189
262236
171
202
166190
151
207
245 243
198192 203 200 191
237 234 238 234
199 190
235261 259 260
234 227
185 183
(a) Performance of file systems under the fileserver workload(in ops/sec)
0
500
1000
1500
2000
2500
e3-dtlg
e3-wrbck
r-dtlgr-wrbck
r-nolog
r-notail
r-noatm
x-noatm
e3-noatm
e2-noatm
x-agc128
x-agc64
x-agc32
x-agc8
e3-bg16k
e2-bg16k
x-isz1k
e3-isz1k
e2-isz1k
x-blk2k
x-blk1k
r-blk2k
r-blk1k
e3-blk2k
e3-blk1k
e2-blk2k
e2-blk1k
x-def
r-defe3-def
e2-def
En
erg
y E
ffic
ien
cy (
op
s/k
ilojo
ule
)
1913 1833
2626
2215
1618
1949
15741831
1516
20932348 2323
18901863 2028 1924 1820
2265 2252 2297 2291
1907 1850
2252
2620 2603 2612
2294 2294
1762 1842
(b) Energy efficiency of file systems under the fileserver workload (in ops/kilojoule)
Figure 4.8:Fileserver results on Machine 2
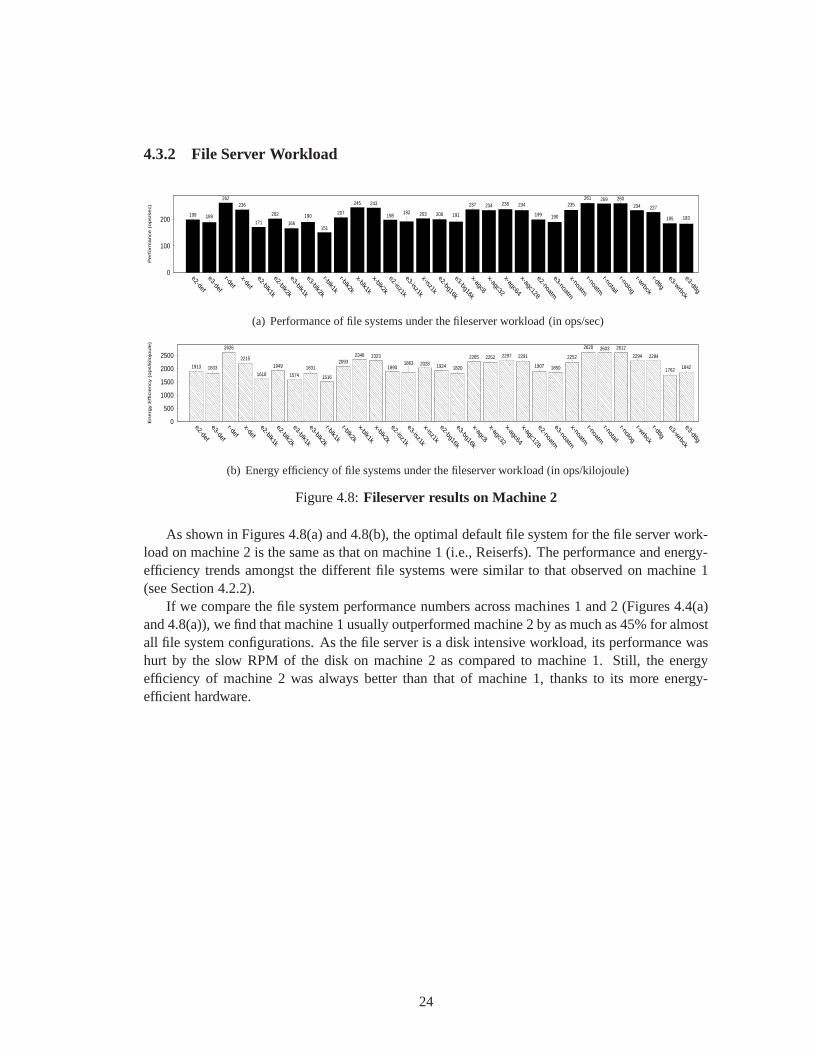
As shown in Figures 4.8(a) and 4.8(b), the optimal default file system for the file server work-load on machine 2 is the same as that on machine 1 (i.e., Reiserfs). The performance and energy-efficiency trends amongst the different file systems were similar to that observed on machine 1(see Section 4.2.2).
If we compare the file system performance numbers across machines 1 and 2 (Figures 4.4(a)and 4.8(a)), we find that machine 1 usually outperformed machine 2 by as much as 45% for almostall file system configurations. As the file server is a disk intensive workload, its performance washurt by the slow RPM of the disk on machine 2 as compared to machine 1. Still, the energyefficiency of machine 2 was always better than that of machine1, thanks to its more energy-efficient hardware.
24

4.3.3 Mail Server
0
500
1000
1500
2000
e3-dtlg
e3-wrbck
r-dtlgr-wrbck
r-nolog
r-notail
r-noatm
x-noatm
e3-noatm
e2-noatm
x-agc128
x-agc64
x-agc32
x-agc8
e3-bg16k
e2-bg16k
x-isz1k
e3-isz1k
e2-isz1k
x-blk2k
x-blk1k
r-blk2k
r-blk1k
e3-blk2k
e3-blk1k
e2-blk2k
e2-blk1k
x-def
r-defe3-def
e2-def
Pe
rfo
rma
nce
(o
ps/s
ec)
1788 1825
1248 1246
676
1101
675
1088
675
1151
738
1034
18531680
832
18051856
1230 1182 1114 1118
1817 1887
1245 1217
1624
1215 1294
969
1671 1670
(a) Performance of file systems under the varmail workload (in ops/sec)
0
4000
8000
12000
16000
20000
e3-dtlg
e3-wrbck
r-dtlgr-wrbck
r-nolog
r-notail
r-noatm
x-noatm
e3-noatm
e2-noatm
x-agc128
x-agc64
x-agc32
x-agc8
e3-bg16k
e2-bg16k
x-isz1k
e3-isz1k
e2-isz1k
x-blk2k
x-blk1k
r-blk2k
r-blk1k
e3-blk2k
e3-blk1k
e2-blk2k
e2-blk1k
x-def
r-defe3-def
e2-def
En
erg
y E
ffic
ien
cy (
op
s/k
ilojo
ule
)
1745318458
12608 12301
6714
10936
6795
11016
6819
11623
7406
10282
1809817005
8317
1764718786
12160 11687 11045 11044
1776419064
12307 12315
16408
12271 13067
9766
16878 16603
(b) Energy efficiency of file systems under the varmail workload (in ops/kilojoule)
Figure 4.9:Varmail results on Machine 2
Figures 4.9(a) and 4.9(b) show the performance and energy efficiency of the mail server work-load when executed on machine 2. Contrary to the Web and file server, if we compare the perfor-mance of the mail server on machines 1 and 2 (Figures 4.9(a) and 4.9(a)), then we observe thatmachine 2 performed usually better than machine 1, ranging from 35% to 3×. This is because themail server workload is a more memory intensive workload with a few synchronous disk requests(e.g.,fsync calls). As machine 2 has a more powerful CPU, faster memory speed, larger size ofcaches and 3 levels of cache, compared to machine 1, it is benefited in terms of both performanceand energy efficiency. Furthermore, thefsync call, although synchronous, returns as soon as thedata is written to the disk cache, thereby not being affectedby the slower disk speed. Interest-ingly, the performance offsync is boosted because of a larger (double) disk cache as comparedto machine 1, as seen in case of Ext2 (described below).
Optimal default file system trends on machine 2 varied as compared to machine 1. On machine2, we observed that Ext2 and Ext3 performed the best amongst the four default file systems by30%. This is in contrast to the observation on machine 1, where Ext2 experienced a performancedegradation of almost 43% as compared to Reiserfs (optimal file system on machine 1). As dis-cussed in Section 4.2.3, Ext2 performed sub-optimally on machine 1 because it was bottleneckedby thefsync call, whereas on machine 2 Ext2 overcomes this bottleneck because of a larger diskcache as compared to machine 1, as discussed above.
As we observed trends similar to machine 1, on most of the non-default file systems configu-rations, we do not discuss them here.
25
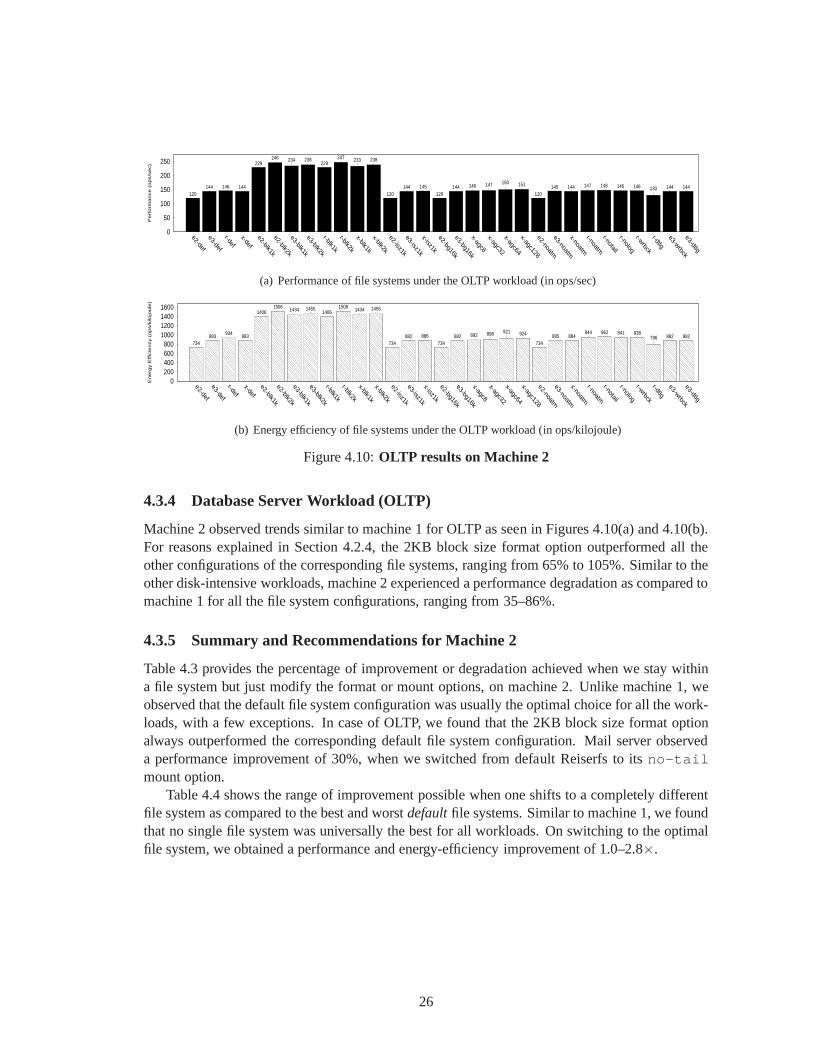
0
50
100
150
200
250
e3-dtlg
e3-wrbck
r-dtlgr-wrbck
r-nolog
r-notail
r-noatm
x-noatm
e3-noatm
e2-noatm
x-agc128
x-agc64
x-agc32
x-agc8
e3-bg16k
e2-bg16k
x-isz1k
e3-isz1k
e2-isz1k
x-blk2k
x-blk1k
r-blk2k
r-blk1k
e3-blk2k
e3-blk1k
e2-blk2k
e2-blk1k
x-def
r-defe3-def
e2-def
Pe
rfo
rma
nce
(o
ps/s
ec)
120144 146 144
229246 234 238
229247 233 238
120144 145
120144 146 147 150 151
120145 144 147 148 146 146 130 144 144
(a) Performance of file systems under the OLTP workload (in ops/sec)
0 200 400 600 800
1000 1200 1400 1600
e3-dtlg
e3-wrbck
r-dtlgr-wrbck
r-nolog
r-notail
r-noatm
x-noatm
e3-noatm
e2-noatm
x-agc128
x-agc64
x-agc32
x-agc8
e3-bg16k
e2-bg16k
x-isz1k
e3-isz1k
e2-isz1k
x-blk2k
x-blk1k
r-blk2k
r-blk1k
e3-blk2k
e3-blk1k
e2-blk2k
e2-blk1k
x-def
r-defe3-def
e2-def
En
erg
y E
ffic
ien
cy (
op
s/k
ilojo
ule
)
734883
934883
14061506 1434 1455
14061508 1434 1455
734882 886
734882 892 898 921 924
734885 884
944 962 941 938796 882 882
(b) Energy efficiency of file systems under the OLTP workload (in ops/kilojoule)
Figure 4.10:OLTP results on Machine 2
4.3.4 Database Server Workload (OLTP)
Machine 2 observed trends similar to machine 1 for OLTP as seen in Figures 4.10(a) and 4.10(b).For reasons explained in Section 4.2.4, the 2KB block size format option outperformed all theother configurations of the corresponding file systems, ranging from 65% to 105%. Similar to theother disk-intensive workloads, machine 2 experienced a performance degradation as compared tomachine 1 for all the file system configurations, ranging from35–86%.
4.3.5 Summary and Recommendations for Machine 2
Table 4.3 provides the percentage of improvement or degradation achieved when we stay withina file system but just modify the format or mount options, on machine 2. Unlike machine 1, weobserved that the default file system configuration was usually the optimal choice for all the work-loads, with a few exceptions. In case of OLTP, we found that the 2KB block size format optionalways outperformed the corresponding default file system configuration. Mail server observeda performance improvement of 30%, when we switched from default Reiserfs to itsno-tailmount option.
Table 4.4 shows the range of improvement possible when one shifts to a completely differentfile system as compared to the best and worstdefaultfile systems. Similar to machine 1, we foundthat no single file system was universally the best for all workloads. On switching to the optimalfile system, we obtained a performance and energy-efficiencyimprovement of 1.0–2.8×.
26
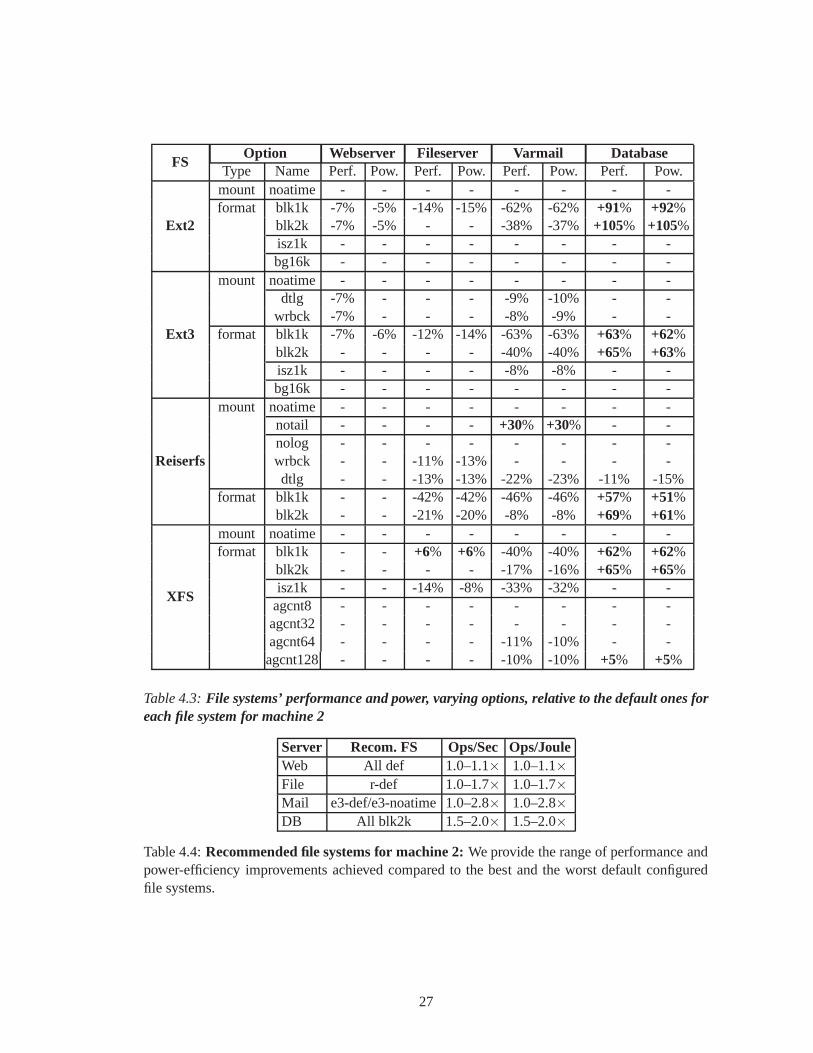
FSOption Webserver Fileserver Varmail Database
Type Name Perf. Pow. Perf. Pow. Perf. Pow. Perf. Pow.
Ext2
mount noatime - - - - - - - -format blk1k -7% -5% -14% -15% -62% -62% +91% +92%
blk2k -7% -5% - - -38% -37% +105% +105%isz1k - - - - - - - -bg16k - - - - - - - -
Ext3
mount noatime - - - - - - - -dtlg -7% - - - -9% -10% - -
wrbck -7% - - - -8% -9% - -format blk1k -7% -6% -12% -14% -63% -63% +63% +62%
blk2k - - - - -40% -40% +65% +63%isz1k - - - - -8% -8% - -bg16k - - - - - - - -
Reiserfs
mount noatime - - - - - - - -notail - - - - +30% +30% - -nolog - - - - - - - -wrbck - - -11% -13% - - - -dtlg - - -13% -13% -22% -23% -11% -15%
format blk1k - - -42% -42% -46% -46% +57% +51%blk2k - - -21% -20% -8% -8% +69% +61%
XFS
mount noatime - - - - - - - -format blk1k - - +6% +6% -40% -40% +62% +62%
blk2k - - - - -17% -16% +65% +65%isz1k - - -14% -8% -33% -32% - -agcnt8 - - - - - - - -agcnt32 - - - - - - - -agcnt64 - - - - -11% -10% - -agcnt128 - - - - -10% -10% +5% +5%
Table 4.3:File systems’ performance and power, varying options, relative to the default ones foreach file system for machine 2
Server Recom. FS Ops/Sec Ops/JouleWeb All def 1.0–1.1× 1.0–1.1×File r-def 1.0–1.7× 1.0–1.7×Mail e3-def/e3-noatime1.0–2.8× 1.0–2.8×DB All blk2k 1.5–2.0× 1.5–2.0×
Table 4.4:Recommended file systems for machine 2:We provide the range of performance andpower-efficiency improvements achieved compared to the best and the worst default configuredfile systems.
27
4.4 File System Feature Selection Guide
We offer recommendations to assist in selecting the best filesystem feature(s) for specific work-loads. These guideline can also help future file system designers. Some of the workload featuresthat can help decide the file system are:
• File size: If the workload generates or uses files with an average file size of a few 100KB,we recommend to use fixed sized data blocks, addressed by a balanced tree (e.g., Reiserfs).Large sized files (GB, TB) would benefit from extent-based balanced trees with delayed al-location (e.g., XFS). Packing small files together in one block (e.g., Reiserfs’s tail-packing)is not recommended, as it often degrades performance.
• Directory depth: Workloads using a deep directory structure should focus on faster lookupsusing intelligent data structures and mechanisms. One recommendation is to localize asmuch data together with inodes and directories, embedding data into large inodes (XFS).Another is to sort all inodes/names and provide efficient balanced trees (e.g., XFS or Reis-erfs).
• Access pattern and parallelism: If the workload has a mix of read, write, and metadataoperations, it is recommended to use at least 64 allocation groups, each managing theirown group and free data allocation independently, to increase parallelism (e.g., XFS). Forworkloads having multiple concurrent writes to the same file(s), we recommend to switchon journalling, so that updates to the same file system objects can be batched together. Werecommend turning offatime updates for read-intensive operations, if the workload doesnot care about access-times.
• I/O size: If the file system’s block size matches the workload’s I/O size, it improves theperformance significantly. Thus, we recommend to format thefile system with a block sizekeeping in mind the I/O size of the workload.
28
Chapter 5
Conclusions
Proper benchmarking and analysis are tedious, time-consuming tasks. Yet their results can beinvaluable for years to come. We conducted a comprehensive study of file systems on modernsystems, evaluated popular server workloads, and varied many parameters. We collected andanalyzed performance and power metrics on two different server class machines.
We discovered and explained significant variations in both performance and energy use. Wefound that there are no universally good configurations for all workloads, and we explained com-plex behavior that go against common conventions. We concluded that both hardware configura-tion and file system configuration impact system performanceand overall energy efficiency. Weconcluded that the default file system types and options are often suboptimal. On machine 1, wefound that simple changes within a file system, like mount options, can improve power/performancefrom 5% to 149%; and changing format options can boost the efficiency from 6% to 136%.Switching to a different file system can result in improvements ranging from 2 to 9 times. Chang-ing the hardware to a more advanced and powerful one, with thecombination of a slower disk,yielded different results. With the improvement in the hardware, the bottlenecks observed by a filesystem under a certain workload either disappeared or shifted to another hardware/software com-ponent. On machine 2, we found that the default file system configuration was optimal for almostall the workloads with a few exceptions. No single file systembest suited all the workloads; weachieved an improvement ranging from 1.0–2.8× when we switched to a different file system.
We recommend that servers be reconfigured, tested and optimized for expected workloadsbefore used in production. Energy technologies lag far behind computing speed improvements.Given the long-running nature of busy Internet servers, software-based optimization and optimalreconfiguration techniques can have significant, cumulative long-term benefits.
29
Chapter 6
Future Work
We plan to expand our study to include less mature file systems(e.g., Ext4, Reiser4, and BTRFS),as we believe they have greater optimization opportunities. We also plan to evaluate the impactof aging on file system performance and energy-efficiency. Weare currently evaluating power-performance of network-based and distributed file systems (e.g., NFS, CIFS, and Lustre). Thoserepresent additional complexity: protocol design, clientvs. server implementations, and networksoftware and hardware efficiency. Early experiments comparing NFSv4 client/server OS imple-mentations revealed performance variations as high as 3×.
Computer hardware changes constantly—e.g., adding more cores, and supporting more energy-saving features. As energy consumption outside of the data center exceeds that inside [47], we arecontinually repeating our studies on a range of computers spanning several years of age. We alsoplan to conduct a similar study on faster solid-state disks.
Our long-term goals include developing custom file systems that best match a given workloadand building auto-configuration tools. The custom file systems could be beneficial because manyapplication designers and administrators know their data set and access patterns ahead of time,allowing storage stacks designs with better cache behaviorand minimal I/O latencies. The auto-configuration tool will configure the different layers in thestorage/software stack cognizant withthe workload and hardware characteristics, so as to achievethe optimal performance and energy-efficiency.
30

Bibliography
[1] M. Allalouf, Y. Arbitman, M. Factor, R. I. Kat, K. Meth, and D. Naor. Storage Modeling for PowerEstimation. InProceedings of the Israeli Experimental Systems Conference (SYSTOR ’09), Haifa,Israel, May 2009. ACM.
[2] J. Almeida, V. Almeida, and D. Yates. Measuring the Behavior of a World-Wide Web Server. Tech-nical report, Boston University, Boston, MA, USA, 1996.
[3] D. G Andersen, J. Franklin, M. Kaminsky, A. Phanishayee,L. Tan, and V. Vasudevan. FAWN: AFast Array of Wimpy Nodes. InProceedings of the 22nd ACM Symposium on Operating SystemsPrinciples (SOSP ’2009), pages 1–14. ACM SIGOPS, October 2009.
[4] R. Appleton. A Non-Technical Look Inside the Ext2 File System.Linux Journal, August 1997.
[5] T. Bisson, S.A. Brandt, and D.D.E. Long. A Hybrid Disk-Aware Spin-Down Algorithm with I/OSubsystem Support. InIEEE 2007 Performance, Computing, and Communications Conference, 2007.
[6] R. Bryant, R. Forester, and J. Hawkes. Filesystem Performance and Scalability in Linux 2.4.17. InProceedings of the Annual USENIX Technical Conference, FREENIX Track, pages 259–274, Mon-terey, CA, June 2002. USENIX Association.
[7] D. Capps. IOzone Filesystem Benchmark.www.iozone.org/, July 2008.
[8] E. Carrera, E. Pinheiro, and R. Bianchini. Conserving Disk Energy in Network Servers. In17thInternational Conference on Supercomputing, 2003.
[9] D. Colarelli and D. Grunwald. Massive Arrays of Idle Disks for Storage Archives. InProceedings ofthe 2002 ACM/IEEE conference on Supercomputing, pages 1–11, 2002.
[10] M. Craven and A. Amer. Predictive Reduction of Power andLatency (PuRPLe). InProceedings of the22nd IEEE/13th NASA Goddard Conference on Mass Storage Systems and Technologies (MSST’05),pages 237–244, Washington, DC, USA, 2005. IEEE Computer Society.
[11] Y. Deng and F. Helian. EED: Energy Efficient Disk Drive Architecture.Information Sciences, 2008.
[12] F. Douglis, P. Krishnan, and B. Marsh. Thwarting the Power-Hungry Disk. InProceedings of the1994 Winter USENIX Conference, pages 293–306, 1994.
[13] Watts up? PRO ES Power Meter.www.wattsupmeters.com/secure/products.php.
[14] E. N. Elnozahy, M. Kistler, and R. Rajamony. Energy-Efficient Server Clusters. InProceedings ofthe 2nd Workshop on Power-Aware Computing Systems, pages 179–196, 2002.
[15] A. Ermolinskiy and R. Tewari. C2Cfs: A Collective Caching Architecture for Distributed File Access.Technical Report UCB/EECS-2009-40, University of California, Berkeley, 2009.
[16] D. Essary and A. Amer. Predictive Data Grouping: Defining the Bounds of Energy and LatencyReduction through Predictive Data Grouping and Replication. ACM Transactions on Storage (TOS),4(1):1–23, May 2008.
[17] A. Gulati, M. Naik, and R. Tewari. Nache: Design and Implementation of a Caching Proxy forNFSv4. InProceedings of the Fifth USENIX Conference on File and Storage Technologies (FAST’07), pages 199–214, San Jose, CA, February 2007. USENIX Association.
31
[18] S. Gurumurthi, J. Zhang, A. Sivasubramaniam, M. Kandemir, H. Franke, N. Vijaykrishnan, and M. J.Irwin. Interplay of Energy and Performance for Disk Arrays Running Transaction Processing Work-loads. InIEEE International Symposium on Performance Analysis of Systems and Software, pages123–132, 2003.
[19] H. Huang, W. Hung, and K. Shin. FS2: Dynamic Data Replication in Free Disk Space for Improv-ing Disk Performance and Energy Consumption. InProceedings of the 20th ACM Symposium onOperating Systems Principles (SOSP ’05), pages 263–276, Brighton, UK, October 2005. ACM Press.
[20] N. Joukov and J. Sipek. GreenFS: Making Enterprise Computers Greener by Protecting Them Better.In Proceedings of the 3rd ACM SIGOPS/EuroSys European Conference on Computer Systems 2008(EuroSys 2008), Glasgow, Scotland, April 2008. ACM.
[21] N. Joukov, A. Traeger, R. Iyer, C. P. Wright, and E. Zadok. Operating System Profiling via LatencyAnalysis. InProceedings of the 7th Symposium on Operating Systems Design and Implementation(OSDI 2006), pages 89–102, Seattle, WA, November 2006. ACM SIGOPS.
[22] J. Katcher. PostMark: A New Filesystem Benchmark. Technical Report TR3022, Network Appliance,1997.www.netapp.com/tech_library/3022.html.
[23] R. Kothiyal, V. Tarasov, P. Sehgal, and E. Zadok. Energyand Performance Evaluation of Lossless FileData Compression on Server Systems. InProceedings of the Israeli Experimental Systems Conference(ACM SYSTOR ’09), Haifa, Israel, May 2009. ACM.
[24] J. Leverich and C. Kozyrakis. On the energy (in)efficiency of hadoop clusters. InHotPower ’09:Workshop on Power Aware Computing and Systems. ACM, 2009.
[25] D. Li. High Performance Energy Efficient File Storage System. PhD thesis, Computer Science De-partment, University of Nebraska, Lincoln, 2006.
[26] K. Li, R. Kumpf, P. Horton, and T. Anderson. A Quantitative Analysis of Disk Drive Power Manage-ment in Portable Computers. InProceedings of the 1994 Winter USENIX Conference, pages 279–291,1994.
[27] A. Manzanares, K. Bellam, and X. Qin. A Prefetching Scheme for Energy Conservation in ParallelDisk Systems. InProceedings of the IEEE International Symposium on Parallel and DistributedProcessing (IPDPS 2008), pages 1–5, April 2008.
[28] R. McDougall, J. Mauro, and B. Gregg.Solaris Performance and Tools. Prentice Hall, New Jersey,2007.
[29] D. Narayanan, A. Donnelly, and A. Rowstron. Write off-loading: practical power management forenterprise storage. InProceedings of the 6th USENIX Conference on File and StorageTechnologies(FAST 2008), 2008.
[30] E. B. Nightingale and J. Flinn. Energy-Efficiency and Storage Flexibility in the Blue File System. InProceedings of the 6th Symposium on Operating Systems Design and Implementation (OSDI 2004),pages 363–378, San Francisco, CA, December 2004. ACM SIGOPS.
[31] Message about XFS block size limit. http://osdir.com/ml/file-systems.xfs.general/2002-06/msg00071.html.
[32] A. E. Papathanasiou and M. L. Scott. Increasing Disk Burstiness for Energy Efficiency. TechnicalReport 792, University of Rochester, 2002.
[33] E. Pinheiro and R. Bianchini. Energy Conservation Techniques for Disk Array-Based Servers. InProceedings of the 18th International Conference on Supercomputing (ICS 2004), pages 68–78, 2004.
[34] E. Pinheiro, R. Bianchini, E. Carrera, and T. Heath. Load Balancing and Unbalancing for Power andPerformance in Cluster-Based Systems. InInternational Conference on Parallel Architectures andCompilation Techniques, Barcelona, Spain, 2001.
[35] H. Reiser. ReiserFS v.3 Whitepaper.http://web.archive.org/web/20031015041320/http://namesys.com/.
32
[36] S. Rivoire, M. A. Shah, P. Ranganathan, and C. Kozyrakis. JouleSort: A Balanced Energy-EfficiencyBenchmark. InProceedings of the ACM SIGMOD International Conference on Management of Data(SIGMOD), Beijing, China, June 2007.
[37] S. Gurumurthi and A. Sivasubramaniam and M. Kandemir and H. Franke. DRPM: Dynamic SpeedControl for Power Management in Server Class Disks. InProceedings of the 30th annual interna-tional symposium on Computer architecture, pages 169–181, 2003.
[38] M. I. Seltzer. Transaction Support in a Log-StructuredFile System. InProceedings of the NinthInternational Conference on Data Engineering, pages 503–510, Vienna, Austria, April 1993.
[39] SGI. XFS Filesystem Structure.http://oss.sgi.com/projects/xfs/papers/xfs_filesystem_structure.pdf.
[40] FileBench, July 2008.www.solarisinternals.com/wiki/index.php/FileBench.
[41] SPEC. SPECweb99.www.spec.org/web99, October 2005.
[42] SPEC. SPECpowerssj2008 v1.01.www.spec.org/power_ssj2008/, 2008.
[43] SPEC. SPECsfs2008.www.spec.org/sfs2008, July 2008.
[44] The Standard Performance Evaluation Corporation. SPEC HPC Suite. www.spec.org/hpc2002/, August 2004.
[45] U.S. EPA. Report to Congress on Server and Data Center Energy Efficiency. Public Law 109-431,August 2007.
[46] J. Wang, H. Zhu, and Dong Li. eRAID: Conserving Energy inConventional Disk-Based RAIDSystem.IEEE Transactions on Computers, 57(3):359–374, March 2008.
[47] D. Washburn. More Energy Is Consumed Outside Of The DataCenter, 2008.www.forrester.com/Role/Research/Workbook/0,9126,47980,00.html.
[48] M. Weiser, B. Welch, A. Demers, and S. Shenker. Scheduling for reduced CPU energy. InProceed-ings of the 1st USENIX conference on Operating Systems Design and Implementation, 1994.
[49] Ext3. http://en.wikipedia.org/wiki/Ext3.
[50] C. P. Wright, N. Joukov, D. Kulkarni, Y. Miretskiy, and E. Zadok. Auto-pilot: A Platform for SystemSoftware Benchmarking. InProceedings of the Annual USENIX Technical Conference, FREENIXTrack, pages 175–187, Anaheim, CA, April 2005. USENIX Association.
[51] Q. Zhu, F. M. David, C. F. Devaraj, Z. Li, Y. Zhou, and P. Cao. Reducing Energy Consumptionof Disk Storage Using Power-Aware Cache Management. InProceedings of the 10th InternationalSymposium on High-Performance Computer Architecture, pages 118–129, 2004.
33