optimized signal-to-noise ratio with shot noise limited
TRANSCRIPT
J. Eur. Opt. Soc.-Rapid 10, 15022 (2015) www.jeos.org
Optimized signal-to-noise ratio with shot noise limiteddetection in Stimulated Raman Scattering microscopy
M. J. B. Moester Institute for Lasers, Life and Biophotonics Amsterdam, Department of Physics and Astronomy, VUUniversity Amsterdam, The Netherlands
F. Ariese Institute for Lasers, Life and Biophotonics Amsterdam, Department of Physics and Astronomy, VUUniversity Amsterdam, The NetherlandsIndian Institute of Science, Department of Inorganic and Physical Chemistry, Bangalore 560012, India
J. F. de [email protected]
Institute for Lasers, Life and Biophotonics Amsterdam, Department of Physics and Astronomy, VUUniversity Amsterdam, The Netherlands
We describe our set-up for Stimulated Raman Scattering (SRS) microscopy with shot noise limited detection for a broad window of biologicallyrelevant laser powers. This set-up is used to demonstrate that the highest signal-to-noise ratio (SNR) in SRS with shot noise limited detectionis achieved with a time-averaged laser power ratio of 1:2 of the unmodulated and modulated beam. In SRS, two different coloured laserbeams are incident on a sample. If the energy difference between them matches a molecular vibration of a molecule, energy can betransferred from one beam to the other. By applying amplitude modulation to one of the beams, the modulation transfer to the other beamcan be measured. The efficiency of this process is a direct measure for the number of molecules of interest in the focal volume. Combinedwith laser scanning microscopy, this technique allows for fast and sensitive imaging with sub-micrometre resolution. Recent technologicaladvances have resulted in an improvement of the sensitivity of SRS applications, but few show shot noise limited detection.The dominant noise source in this SRS microscope is the shot noise of the unmodulated, detected beam. Under the assumption thatphotodamage is linear with the total laser power, the optimal SNR shifts away from equal beam powers, where the most signal isgenerated, to a 1:2 power ratio. Under these conditions the SNR is maximized and the total laser power that could induce photodamage isminimized. Compared to using a 1:1 laser power ratio, we show improved image quality and a signal-to-noise ratio improvement of 8 % inpolystyrene beads and C. Elegans worms. Including a non-linear damage mechanism in the analysis, we find that the optimal power ratioconverges to a 1:1 ratio with increasing order of the non-linear damage mechanism.[DOI: http://dx.doi.org/10.2971/jeos.2015.15022]
Keywords: Nonlinear Raman microscopy, shot noise limited detection, signal-to-noise ratio
1 INTRODUCTIONIn recent years, coherent Raman scattering microscopy hasfound many applications in biomedical imaging. This groupof sensitive imaging techniques based on intrinsic chemicalcontrast has advantages over fluorescence microscopy, mainlybecause it is a label-free technique. This allows imaging ofsmall molecules or easily disturbed systems without perturb-ing their biological function [1]–[3]. In particular StimulatedRaman Scattering (SRS) microscopy has shown great promisein this field. Technological developments have improved sen-sitivity [4]–[6] and imaging speed [7, 8] and brought this froma concept to a promising technique for biomedical imaging [9].
In SRS, two different coloured laser beams are incident ona sample. If the energy difference between them matches amolecular vibration of a molecule, energy can be transferredfrom one beam to the other. By applying amplitude modu-lation to one of the beams, the modulation transfer to theother beam can be measured. The efficiency of this processis a direct measure for the number of molecules of interest inthe focal volume. Combined with laser scanning microscopy,this technique allows for fast and sensitive imaging with sub-micrometre resolution [1].
The first demonstrations of SRS microscopy showed poor de-tection limits, requiring many thousands of molecules withlarge Raman scattering cross sections in the focal volume. Im-provements in the detection of the small signals have low-ered the limit of detection. By resonant amplification of thesignal [10], using chemical labelling [11, 12], or implementinga different detection geometry [5, 6, 13], the sensitivity can bepushed close to the shot noise limit. This has allowed imagingnot only in the CH-stretch region but also in the fingerprintregion, where Raman signals are often weaker [14].
Because signal levels in SRS microscopy are measured as asmall change on a high background intensity, care must betaken to optimize the imaging parameters to achieve the bestsignal-to-noise ratio (SNR) for the applied laser power. Thebest attainable situation is realized when shot noise dominatesthe noise contributions, because the shot noise is an intrinsicproperty of the detected light.
In this paper, we show shot noise limited detection for abroad range of laser powers with an experimental set-upbased mainly on commercial components. This system is usedto demonstrate the validity of the theoretical prediction that
Received March 03, 2015; revised ms. received April 10, 2015; published April 22, 2015 ISSN 1990-2573
J. Eur. Opt. Soc.-Rapid 10, 15022 (2015) M. J. B. Moester, et al.
the highest SNR can be achieved with a time-averaged laserpower ratio of 1:2 of the unmodulated and modulated beams.An SNR improvement of 9 % is attainable compared to themore commonly used 1:1 laser power ratio, without anychanges to the sample or set-up. While small, this increase canenhance the image quality without sacrificing signal by sim-ply tuning the laser power appropriately.
2 THEORY
The amount of signal generated in SRS is described by
S ∝ [c]σIpump IStokes (1)
where [c] is the concentration of scatterers, σ the scatteringcross section and Ipump and IStokes the laser power densities ofthe pump and Stokes beam, respectively [6, 15]. For picosec-ond SRS, the power density of both beams is linear with thelaser intensity, as the pulse duration and focusing conditionsare the same. In Stimulated Raman Loss (SRL), the amplitudeof the Stokes beam is modulated to provide the frequency forlock-in detection. The time-averaged intensity of this modu-lated beam is half the intensity during ’on’ time. The total laserpower density Itotal is defined as the sum of Ipump and IStokes;
Itotal = Ipump +12
IStokes (2)
In any application, the photodamage caused to the samplesets an upper limit on the total power applied. In our set-up,both Ipump and IStokes have an 8 picosecond pulse length andwavelengths in the near IR, therefore mechanisms of photo-damage are expected to be similar for both colours [16]. Inthe case of a linear dependence of photodamage on the to-tal power, any division of power between the two beams isassumed to result in the same amount of exposure and photo-damage. The distribution of this total power between the twocolours determines the amount of SRS signal and the resultingSNR, and should be carefully considered.
By combining Eqs. (1) and (2) and evaluating the derivativeas a function of Ipump, it is found that the maximum sig-nal is obtained when the time-averaged intensities of pumpand Stokes beam are equal. This is also the optimal exper-imental choice when the noise is independent of the laserpowers in non-shot noise limited implementations and forrelated coherent Raman methods where the signal is mea-sured against a dark background, such as in Coherent Anti-Stokes Raman Scattering (CARS) and Raman Induced KerrEffect Spectroscopy (RIKES). However, when the dominantnoise source is shot noise, as in our implementation of SRSmicroscopy, the noise level only depends on the intensity ofthe detected beam and the SNR is given by
SNR ∝S√
Ipump(3)
The maximum SNR is found when the derivative of Eq. (3)with respect to Ipump is equal to zero, resulting in a ratio of1:2 of the time-averaged intensities of the pump and Stokesbeams. In this case, the peak power of the Stokes beam dur-ing the ’on’ phase of the modulation is four times that of thepump beam. This 1:2 power ratio would result in a theoreti-cal improvement of the SNR of 9 % compared to a 1:1 power
ratio. The same principle applies to Stimulated Raman Gain(SRG), but in that case the ratio is reversed because the Stokesbeam is detected. The validity of this argument also extends toother coherent Raman methods where the signal is measuredas an increase of the detected beam, such as optically hetero-dyne detected RIKES [17] and heterodyne CARS [18]. Here thetime-averaged intensity of the detected, unmodulated beamshould also be half the intensity of the modulated beam to re-alize the highest SNR.
3 EXPERIMENTAL SET-UP
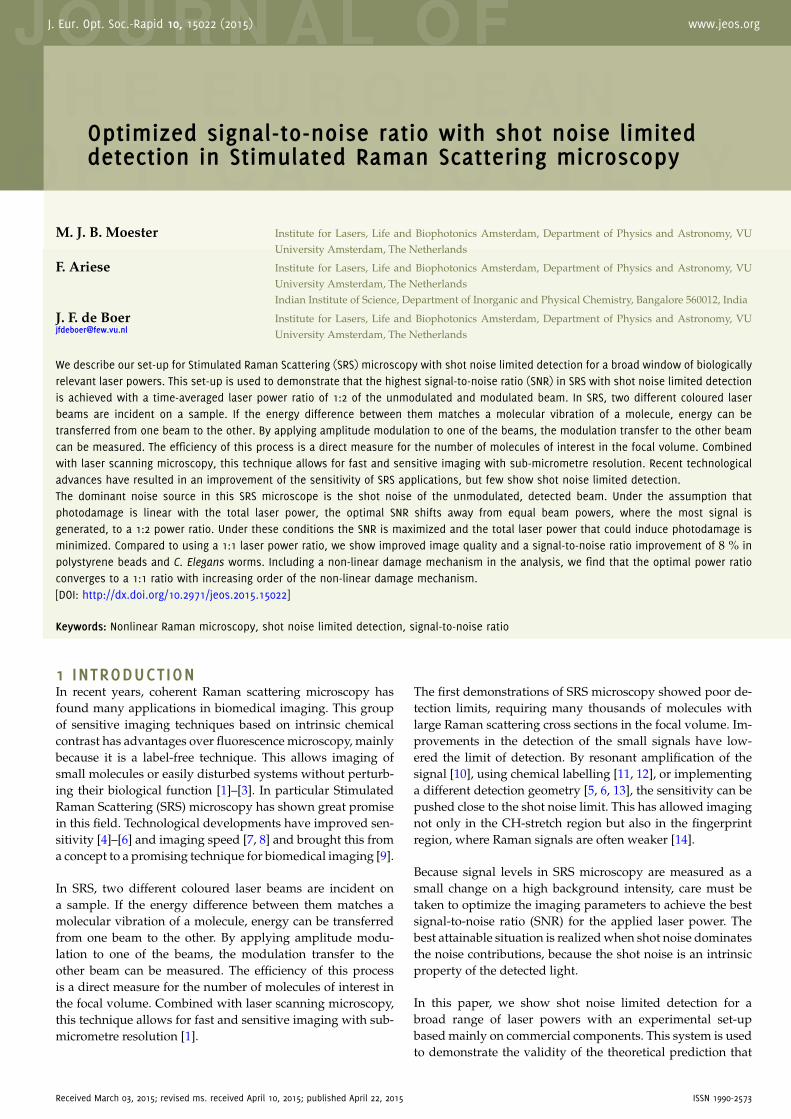
We have built a flexible imaging set-up for Stimulated Ra-man Loss microscopy (Figure 1(a)). An 80 MHz laser (LumeraPlecter Duo) with 8 ps pulses at 532 nm is used to pump anOptical Parametric Oscillator (OPO) (APE Levante Emerald)with a wavelength output range of 775 − 990 nm. This out-put is overlapped in space and time with the 1064 nm fun-damental laser line. A combination of a half–wave plate anda polarizing beamsplitter in each beam is used to control thepolarization state and laser intensity. An acousto–optic mod-ulator (Crystal Technology 3080194) is used for 3.636 MHz si-nusoidal intensity modulation of the 1064 nm Stokes beam.A Zeiss laser scanning microscope (type LSM 7MP) with32× objective (C-Achroplan W, NA= 0.85) is used to imagesamples with non–descanned detection in forward scatteringmode. Optical filters reject the 1064 nm modulated Stokesbeam and the pump beam light is collected on a Si photodi-ode (Thorlabs DET36A). The signal is amplified with a home-built transimpedance amplifier (using a Texas InstrumentsOPA656) before demodulation in a lock-in amplifier (StanfordResearch Systems SR844). The amplifier generates an 86 dBtransimpedance gain on the photodiode current and includesa 3.636 MHz bandpass filter.
Shot noise limited detection is achieved when the shot noise isequal to or larger than any other noise source. In our case, atthe lower end, this is at 75 µW of pump power on the detector(Figure 1(b)), where the shot noise is equal to the measuredthermal or Johnson–Nyquist noise of 71 nV/
√Hz. The upper
limit of 10 mW is defined by the saturation current of the pho-todiode (5 mA) which is well before the relative intensity noiseof the laser becomes significant. The effective shot noise win-dow with a collection efficiency of 50 % and a 1:2 power ratiois from 0.45− 60 mW of total power on the sample, which cor-responds well with biologically acceptable intensities.
4 RESULTS AND DISCUSSION
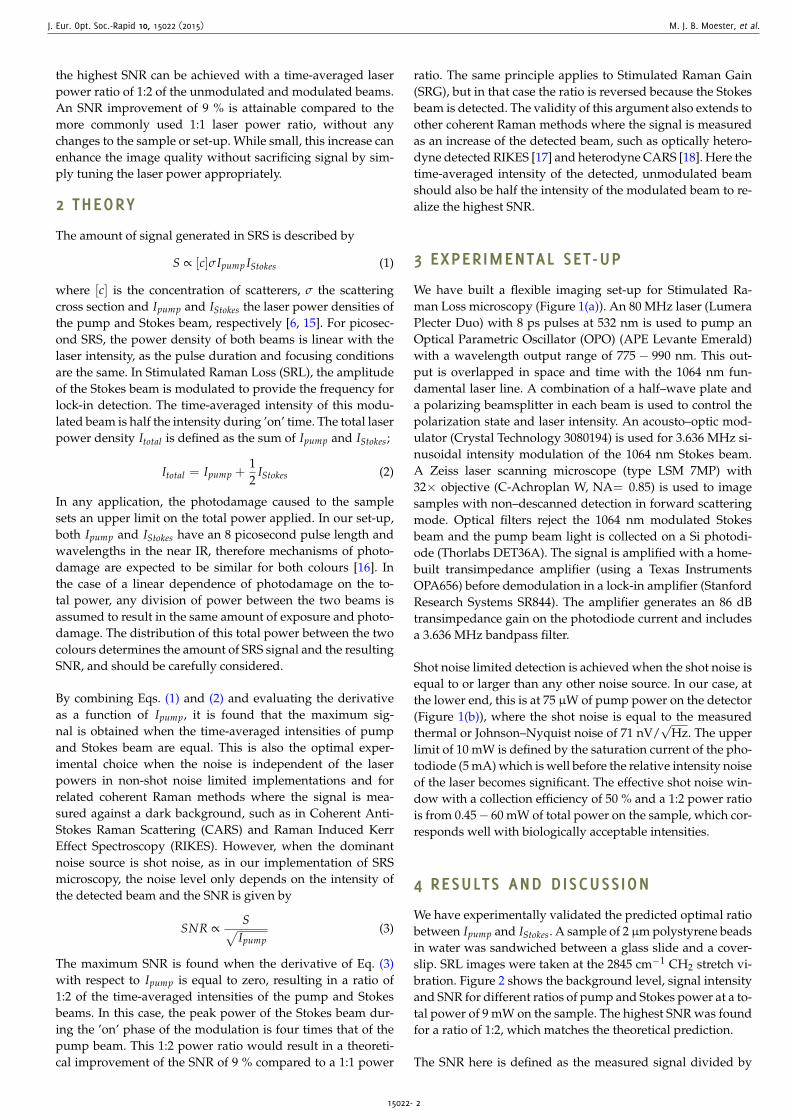
We have experimentally validated the predicted optimal ratiobetween Ipump and IStokes. A sample of 2 µm polystyrene beadsin water was sandwiched between a glass slide and a cover-slip. SRL images were taken at the 2845 cm−1 CH2 stretch vi-bration. Figure 2 shows the background level, signal intensityand SNR for different ratios of pump and Stokes power at a to-tal power of 9 mW on the sample. The highest SNR was foundfor a ratio of 1:2, which matches the theoretical prediction.
The SNR here is defined as the measured signal divided by
15022- 2
J. Eur. Opt. Soc.-Rapid 10, 15022 (2015) M. J. B. Moester, et al.
FIG. 1 (a) Experimental set-up for SRS microscopy, showing the pump beam at 816.7 nm
and the Stokes beam at 1064 nm. PBS: polarizing beamsplitter, HWP: half–wave plate,
AOM: acousto–optic modulator; (b) Noise characteristics of the detection system as a
function of Ipump on the detector. Measured data points (black squares) match the
sum of theoretical shot noise (blue line) and measured electronic noise (Johnson–
Nyquist noise level, grey line). Shot noise limited detection is achieved from 75 µW
to 10 mW on the detector.
FIG. 2 The SRL signal intensity (black circles, left y-axis), background intensity (red
squares, left y-axis) and SNR (blue diamonds, right y-axis) as a function of the Ipump
intensity. Intensities were measured at six regions of interest of Ø2 µm on and off
beads; error bars represent one standard deviation of the mean value of six regions.
The total laser intensity on the sample is constant at 9 mW. Ipump:IStokes ratios of 1:2
and 1:1 are indicated.
the sum of the noise contributions, which consist of electronicnoise and shot noise. At the laser powers used, the relative in-tensity noise of the laser at this modulation frequency is verysmall and does not contribute. The background level (the am-plitude measured at a location where no Raman vibration isaccessible) is equal to the sum of the constant electronic noiseand the shot noise and consistent with the theory (grey dashedline in Figure 1(b)). Other contributions that could have been
expected are related to non-resonant background caused bythe Raman-induced refractive index change (Kerr effect). Asthe measured background correlates exactly to the theoreti-cal shot noise, these effects are negligible here. This is reason-able because the large Raman cross-section of the CH2-stretchallows low laser powers to be used. Furthermore, the non-resonant medium is spatially uniform, eliminating the mainsource of Raman-induced refractive index changes [19].
Data points were measured as the mean intensity of six re-gions of interest of Ø1 µm in the images on and off the beadsfor signal and background respectively. Error bars representone standard deviation of the mean value of those regions.The dashed line through the background data points is thesum of measured electronic noise and theoretical shot noise.The fitted line through the signal data points is based on thetheory described above, with the only free parameter beingthe amplitude of the curve. This is a function of concentra-tion and scattering cross section and includes the detectionparameters (collection efficiency, spectral sensitivity of the de-tector, transimpedance gain). This amplitude, combined withthe theory described above, is used to determine the dashedline through the SNR data points. The measured electronicnoise is included in the predicted SNR by adding it to the shotnoise in the denominator of Eq. (3). This primarily has an ef-fect for low pump powers, as at a 1:2 ratio, the shot noise isalready 4.5 times as large as the electronic noise. In this con-figuration, with the current collection efficiency and appliedmaximal power, the maximal SNR was found for a 1:1.9 ratio,so the effect of the electronic noise is minimal. The contribu-tion of electronic noise lowers the maximum improvement inSNR from 9 % to 8 % compared to using a 1:1 laser powerratio. This improvement is relative to the same set-up, chang-ing only the laser powers of the excitation beams. While theenhancement is small, it does not require any new hardwareand can be implemented on any system.
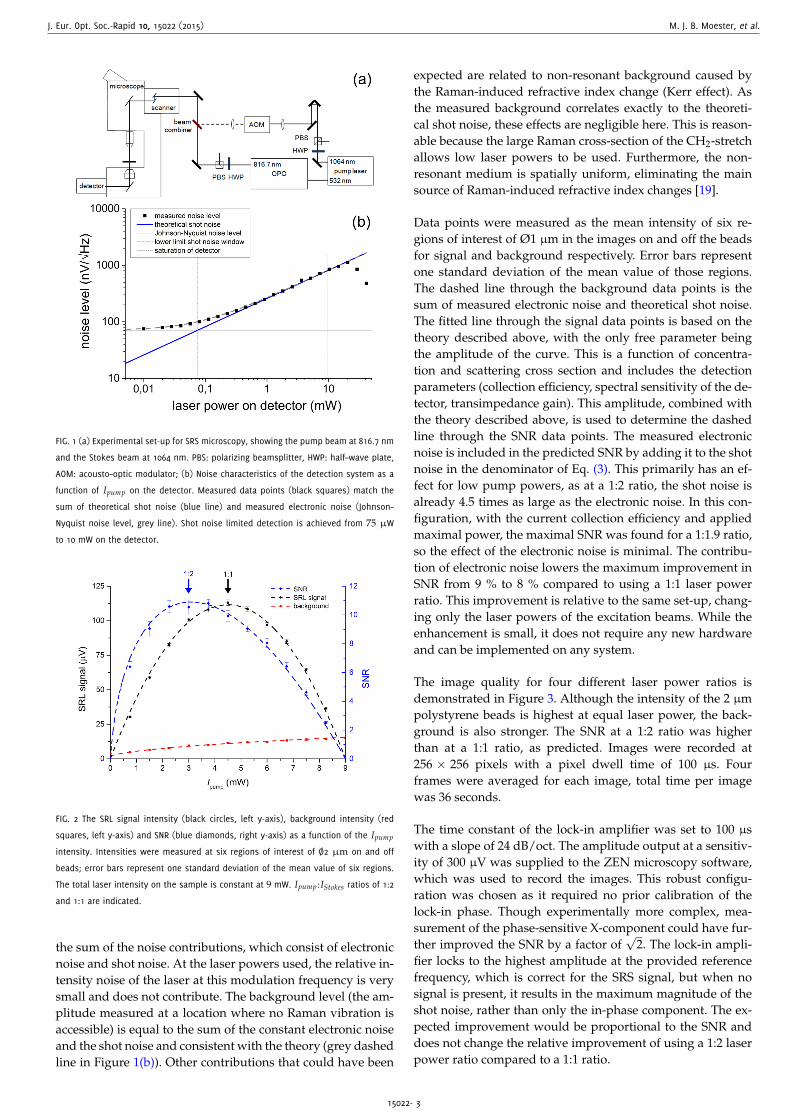
The image quality for four different laser power ratios isdemonstrated in Figure 3. Although the intensity of the 2 µmpolystyrene beads is highest at equal laser power, the back-ground is also stronger. The SNR at a 1:2 ratio was higherthan at a 1:1 ratio, as predicted. Images were recorded at256 × 256 pixels with a pixel dwell time of 100 µs. Fourframes were averaged for each image, total time per imagewas 36 seconds.
The time constant of the lock-in amplifier was set to 100 µswith a slope of 24 dB/oct. The amplitude output at a sensitiv-ity of 300 µV was supplied to the ZEN microscopy software,which was used to record the images. This robust configu-ration was chosen as it required no prior calibration of thelock-in phase. Though experimentally more complex, mea-surement of the phase-sensitive X-component could have fur-ther improved the SNR by a factor of
√2. The lock-in ampli-
fier locks to the highest amplitude at the provided referencefrequency, which is correct for the SRS signal, but when nosignal is present, it results in the maximum magnitude of theshot noise, rather than only the in-phase component. The ex-pected improvement would be proportional to the SNR anddoes not change the relative improvement of using a 1:2 laserpower ratio compared to a 1:1 ratio.
15022- 3

J. Eur. Opt. Soc.-Rapid 10, 15022 (2015) M. J. B. Moester, et al.
FIG. 3 Microscopy images at different power ratios of Ipump to IStokes with a constant
total power. (a–d) SRL images at 2845 cm−1 on 2 µm polystyrene beads showing the
imaging quality at 2:1, 1:1, 1:2 and 1:3 Ipump:IStokes laser power ratio. Total power
on the sample was 9 mW. Cross sectional traces along the arrow are shown adjacent.
Scale bar is 5 µm.
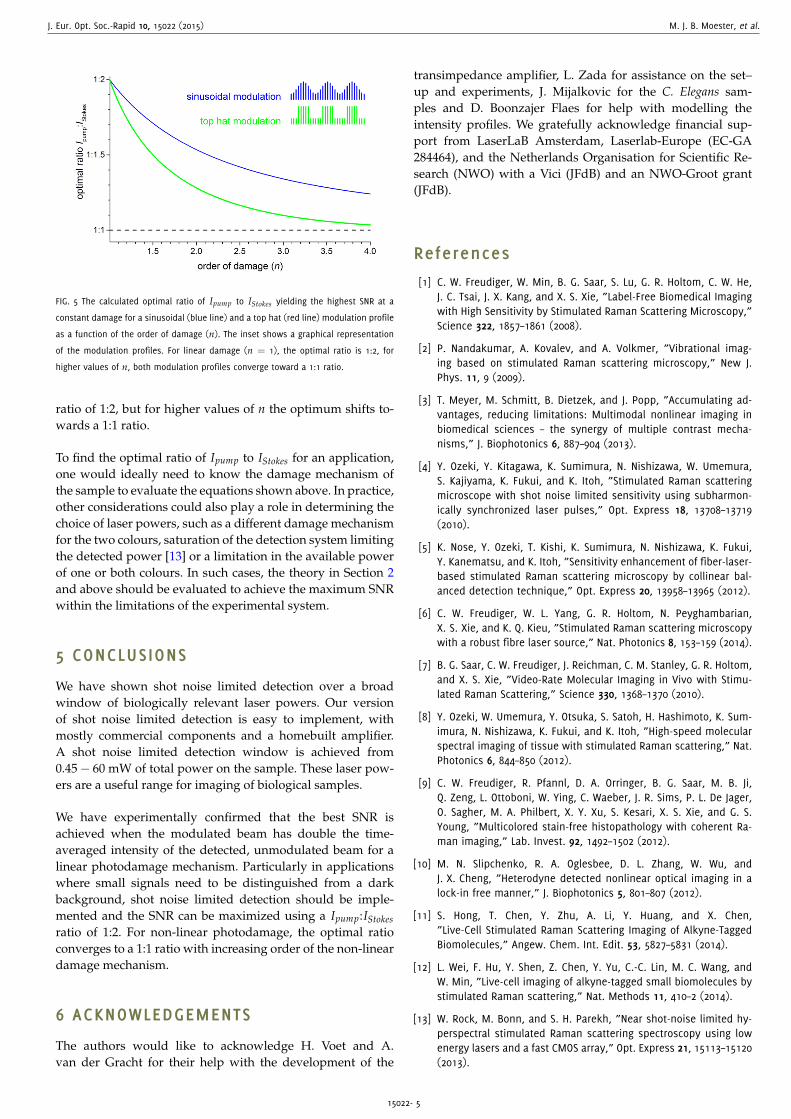
FIG. 4 Microscopy images of the head end of an adult C. Elegans roundworm. (a) White
light camera image, scale bar is 100 µm; (b) Detail of (a) at the worm mouth, scale
bar is 10 µm; (c-d) SRL images at 2845 cm−1 at Ipump:IStokes ratios of 1:2 and 1:1
respectively. Total power on the sample was constant at 9 mW. The SNR improvement
is 8± 2 %. Scale bar is 10 µm.
The SNR improvement of 8 % is small, but the effect couldbe important at lower signal levels, as are encountered inreal biological samples. In Figure 4 the results of imaging thehead end of an adult C. Elegans roundworm at 2845 cm−1
are shown. Mature Bristol N2 wildtype animals were anaes-thetized with 5 mM levamisole dissolved in M9 buffer andmounted on a thin agarose film on a glass slide and cov-ered with a coverslip. The SRL signal originates from CH2-
stretches in the cellular membranes and the intracellular lipiddroplets that are abundant in these animals [20]. Imagesshown are single recordings of 1024× 1024 pixels with a pixeldwell time of 100 µs. The time constant of the lock-in ampli-fier was set to 100 µs with a slope of 24 dB/oct and 300 µVsensitivity. The improvement in SNR was calculated from sixØ3 µm regions of interest on the worm compared to the back-ground outside the worm body. An average improvement inthe SNR of 8± 2 % was found for a 1:2 power ratio comparedto a 1:1 ratio. Even though the CH2-stretch has a large Ramancross-section, the signal level is still low at regions of low con-centration. The improvement in SNR results in an improve-ment of contrast compared to the background. In Figure 4,this effect can be appreciated from the enhanced contrast inregions of low signal, such as at the outer membranes of theworm.
We have shown that the optimal laser power ratio for shotnoise limited applications of SRS is a 1:2 ratio of the unmod-ulated and modulated beams, for the situation with a givenmaximum combined average power of pump and Stokes laserbeams. In the case of a non-linear damage mechanism, not justthe total time-averaged power defines the amount of dam-age, but the time-dependent intensity profile of the modulatedbeam becomes important. The amount of damage is describedas proportional to the intensity of the applied laser power,raised to the power of the damage order:
D ∝ I(t)n (4)
Where D symbolizes the amount of damage, I(t) the inten-sity profile in time and n is the order of the damage mecha-nism [21]. The value of n has been determined for the typicallaser parameters of power, wavelength, pulse length and rep-etition rate used in coherent Raman scattering microscopy. Fordense structures such as protein clusters, it is near 1, while fora less dense environment such as a cell, values of n above 2 arefound [16, 22]. Two types of modulation profile are commonlyused in SRS; sinusoidal modulation and top hat modulation(inset Figure 5). The damage caused by these modulation pro-files can be expressed as:
Dsin = 〈[Ipump +12(1 + sin(ωt)IStokes)]
n〉 (5)
Dtophat =12[Ipump]
n +12[Ipump + IStokes]
n (6)
Here, ω is the modulation frequency and the chevrons indi-cate a time average over an integer number of modulation cy-cles. The time averaging is included in the top hat modulationprofile by the factors of 1
2 . The same signal level is achievedwith these different modulation profiles, but the higher in-stantaneous peak powers of top hat modulation will resultin more damage to the sample for non-linear damage mech-anisms. This indicates the choice for a sinusoidal modulationprofile is usually beneficial.
We evaluated the optimum by finding the ratio giving thehighest SNR for a constant amount of damage for these mod-ulation profiles. Figure 5 shows this optimal ratio of Ipump toIStokes as a function of the order of the damage mechanism.The optimal ratio is independent of pixel dwell time and totalamount of damage. For a value of n = 1, we find an optimal
15022- 4
J. Eur. Opt. Soc.-Rapid 10, 15022 (2015) M. J. B. Moester, et al.
FIG. 5 The calculated optimal ratio of Ipump to IStokes yielding the highest SNR at a
constant damage for a sinusoidal (blue line) and a top hat (red line) modulation profile
as a function of the order of damage (n). The inset shows a graphical representation
of the modulation profiles. For linear damage (n = 1), the optimal ratio is 1:2, for
higher values of n, both modulation profiles converge toward a 1:1 ratio.
ratio of 1:2, but for higher values of n the optimum shifts to-wards a 1:1 ratio.
To find the optimal ratio of Ipump to IStokes for an application,one would ideally need to know the damage mechanism ofthe sample to evaluate the equations shown above. In practice,other considerations could also play a role in determining thechoice of laser powers, such as a different damage mechanismfor the two colours, saturation of the detection system limitingthe detected power [13] or a limitation in the available powerof one or both colours. In such cases, the theory in Section 2and above should be evaluated to achieve the maximum SNRwithin the limitations of the experimental system.
5 CONCLUSIONS
We have shown shot noise limited detection over a broadwindow of biologically relevant laser powers. Our versionof shot noise limited detection is easy to implement, withmostly commercial components and a homebuilt amplifier.A shot noise limited detection window is achieved from0.45− 60 mW of total power on the sample. These laser pow-ers are a useful range for imaging of biological samples.
We have experimentally confirmed that the best SNR isachieved when the modulated beam has double the time-averaged intensity of the detected, unmodulated beam for alinear photodamage mechanism. Particularly in applicationswhere small signals need to be distinguished from a darkbackground, shot noise limited detection should be imple-mented and the SNR can be maximized using a Ipump:IStokesratio of 1:2. For non-linear photodamage, the optimal ratioconverges to a 1:1 ratio with increasing order of the non-lineardamage mechanism.
6 ACKNOWLEDGEMENTS
The authors would like to acknowledge H. Voet and A.van der Gracht for their help with the development of the
transimpedance amplifier, L. Zada for assistance on the set–up and experiments, J. Mijalkovic for the C. Elegans sam-ples and D. Boonzajer Flaes for help with modelling theintensity profiles. We gratefully acknowledge financial sup-port from LaserLaB Amsterdam, Laserlab-Europe (EC-GA284464), and the Netherlands Organisation for Scientific Re-search (NWO) with a Vici (JFdB) and an NWO-Groot grant(JFdB).
References
[1] C. W. Freudiger, W. Min, B. G. Saar, S. Lu, G. R. Holtom, C. W. He,J. C. Tsai, J. X. Kang, and X. S. Xie, ”Label-Free Biomedical Imagingwith High Sensitivity by Stimulated Raman Scattering Microscopy,”Science 322, 1857–1861 (2008).
[2] P. Nandakumar, A. Kovalev, and A. Volkmer, ”Vibrational imag-ing based on stimulated Raman scattering microscopy,” New J.Phys. 11, 9 (2009).
[3] T. Meyer, M. Schmitt, B. Dietzek, and J. Popp, ”Accumulating ad-vantages, reducing limitations: Multimodal nonlinear imaging inbiomedical sciences – the synergy of multiple contrast mecha-nisms,” J. Biophotonics 6, 887–904 (2013).
[4] Y. Ozeki, Y. Kitagawa, K. Sumimura, N. Nishizawa, W. Umemura,S. Kajiyama, K. Fukui, and K. Itoh, ”Stimulated Raman scatteringmicroscope with shot noise limited sensitivity using subharmon-ically synchronized laser pulses,” Opt. Express 18, 13708–13719(2010).
[5] K. Nose, Y. Ozeki, T. Kishi, K. Sumimura, N. Nishizawa, K. Fukui,Y. Kanematsu, and K. Itoh, ”Sensitivity enhancement of fiber-laser-based stimulated Raman scattering microscopy by collinear bal-anced detection technique,” Opt. Express 20, 13958–13965 (2012).
[6] C. W. Freudiger, W. L. Yang, G. R. Holtom, N. Peyghambarian,X. S. Xie, and K. Q. Kieu, ”Stimulated Raman scattering microscopywith a robust fibre laser source,” Nat. Photonics 8, 153–159 (2014).
[7] B. G. Saar, C. W. Freudiger, J. Reichman, C. M. Stanley, G. R. Holtom,and X. S. Xie, ”Video-Rate Molecular Imaging in Vivo with Stimu-lated Raman Scattering,” Science 330, 1368–1370 (2010).
[8] Y. Ozeki, W. Umemura, Y. Otsuka, S. Satoh, H. Hashimoto, K. Sum-imura, N. Nishizawa, K. Fukui, and K. Itoh, ”High-speed molecularspectral imaging of tissue with stimulated Raman scattering,” Nat.Photonics 6, 844–850 (2012).
[9] C. W. Freudiger, R. Pfannl, D. A. Orringer, B. G. Saar, M. B. Ji,Q. Zeng, L. Ottoboni, W. Ying, C. Waeber, J. R. Sims, P. L. De Jager,O. Sagher, M. A. Philbert, X. Y. Xu, S. Kesari, X. S. Xie, and G. S.Young, ”Multicolored stain-free histopathology with coherent Ra-man imaging,” Lab. Invest. 92, 1492–1502 (2012).
[10] M. N. Slipchenko, R. A. Oglesbee, D. L. Zhang, W. Wu, andJ. X. Cheng, ”Heterodyne detected nonlinear optical imaging in alock-in free manner,” J. Biophotonics 5, 801–807 (2012).
[11] S. Hong, T. Chen, Y. Zhu, A. Li, Y. Huang, and X. Chen,”Live-Cell Stimulated Raman Scattering Imaging of Alkyne-TaggedBiomolecules,” Angew. Chem. Int. Edit. 53, 5827–5831 (2014).
[12] L. Wei, F. Hu, Y. Shen, Z. Chen, Y. Yu, C.-C. Lin, M. C. Wang, andW. Min, ”Live-cell imaging of alkyne-tagged small biomolecules bystimulated Raman scattering,” Nat. Methods 11, 410–2 (2014).
[13] W. Rock, M. Bonn, and S. H. Parekh, ”Near shot-noise limited hy-perspectral stimulated Raman scattering spectroscopy using lowenergy lasers and a fast CMOS array,” Opt. Express 21, 15113–15120(2013).
15022- 5
J. Eur. Opt. Soc.-Rapid 10, 15022 (2015) M. J. B. Moester, et al.
[14] X. Zhang, M. B. J. Roeffaers, S. Basu, J. R. Daniele, D. Fu,C. W. Freudiger, G. R. Holtom, and X. S. Xie, ”Label-Free Live-CellImaging of Nucleic Acids Using Stimulated Raman Scattering Mi-croscopy,” Chemphyschem 13, 1054–1059 (2012).
[15] Y. Ozeki, F. Dake, S. Kajiyama, K. Fukui, and K. Itoh, ”Analysis andexperimental assessment of the sensitivity of stimulated Ramanscattering microscopy,” Opt. Express 17, 3651–3658 (2009).
[16] Y. Fu, H. F. Wang, R. Y. Shi, and J. X. Cheng, ”Characterizationof photodamage in coherent anti-Stokes Raman scattering mi-croscopy,” Opt. Express 14, 3942–3951 (2006).
[17] C. W. Freudiger, M. B. J. Roeffaers, X. Zhang, B. G. Saar, W. Min,and X. S. Xie, ”Optical Heterodyne-Detected Raman-Induced KerrEffect (OHD-RIKE) Microscopy,” J. Phys. Chem. B 115, 5574–5581(2011).
[18] E. O. Potma, C. L. Evans, and X. S. Xie, ”Heterodyne coherent anti-Stokes Raman scattering (CARS) imaging,” Opt. Lett. 31, 241–243(2006).
[19] K. I. Popov, A. F. Pegoraro, A. Stolow, and L. Ramunno, ”Image for-mation in CARS and SRS: effect of an inhomogeneous nonresonantbackground medium,” Opt. Lett. 37, 473–475 (2012).
[20] T. Hellerer, C. Axäng, C. Brackmann, P. Hillertz, M. Pilon, andA. Enejder, ”Monitoring of lipid storage in Caenorhabditis elegansusing coherent anti-Stokes Raman scattering (CARS) microscopy,”Proc. Natl. Acad. Sci. U S A 104, 14658–14663 (2007).
[21] A. Hopt and E. Neher, ”Highly nonlinear photodamage in two-photon fluorescence microscopy,” Biophys. J. 80, 2029–2036(2001).
[22] K. König, T. W. Becker, P. Fischer, I. Riemann, and K. J. Halbhuber,”Pulse-length dependence of cellular response to intense near-infrared laser pulses in multiphoton microscopes,” Opt. Lett. 24,113–115 (1999).
15022- 6