optimized off-design performance of flexible wings with
TRANSCRIPT
Optimized Off-Design Performance of Flexible Wings with Continuous Trailing-Edge Flaps
David L. Rodriguez *
Science & Technology Corp., Moffett Field, CA 94035
Michael J. Aftosmis †
NASA Ames Research Center, Moffett Field, CA 94035
Marian Nemec ‡
Science & Technology Corp., Moffett Field, CA 94035
George R. Anderson §
Stanford University, Stanford, CA, 94305
This work assesses the potential aerodynamic performance benefits of a variable-camber, continuous-trailing-edge flap system on a generic transport aircraft at off-design conditions. A process to optimize transport wings while addressing static aeroelastic effects is presented. To establish a proper baseline, a transport wing is first aerodynamically optimized at a mid-cruise flight condition using an inviscid, aeroelastic analysis tool. The optimized wing is then analyzed at off-design cruise conditions. The optimization is repeated at these off-design conditions to determine how much performance is lost by the wing optimized solely for the mid-cruise condition. The full-span flap system is then adapted to improve performance of the mid-cruise-optimized wing at these off-design conditions. The measured improvement is quantified by a comparison with wings designed specifically for the off-design conditions. To evaluate the effects of aeroelasticity on the effectiveness of the flap system, this entire process is performed on both a conventionally stiff wing and a modern, more flexible wing. The results indicate that the flap system allows for recovery of near-optimal performance throughout cruise. The flap system is found to be advantageous even for modern wings with increased flexibility.
I. Introduction The weight of an aircraft varies a great deal throughout the cruise segment of a typical flight mission due to
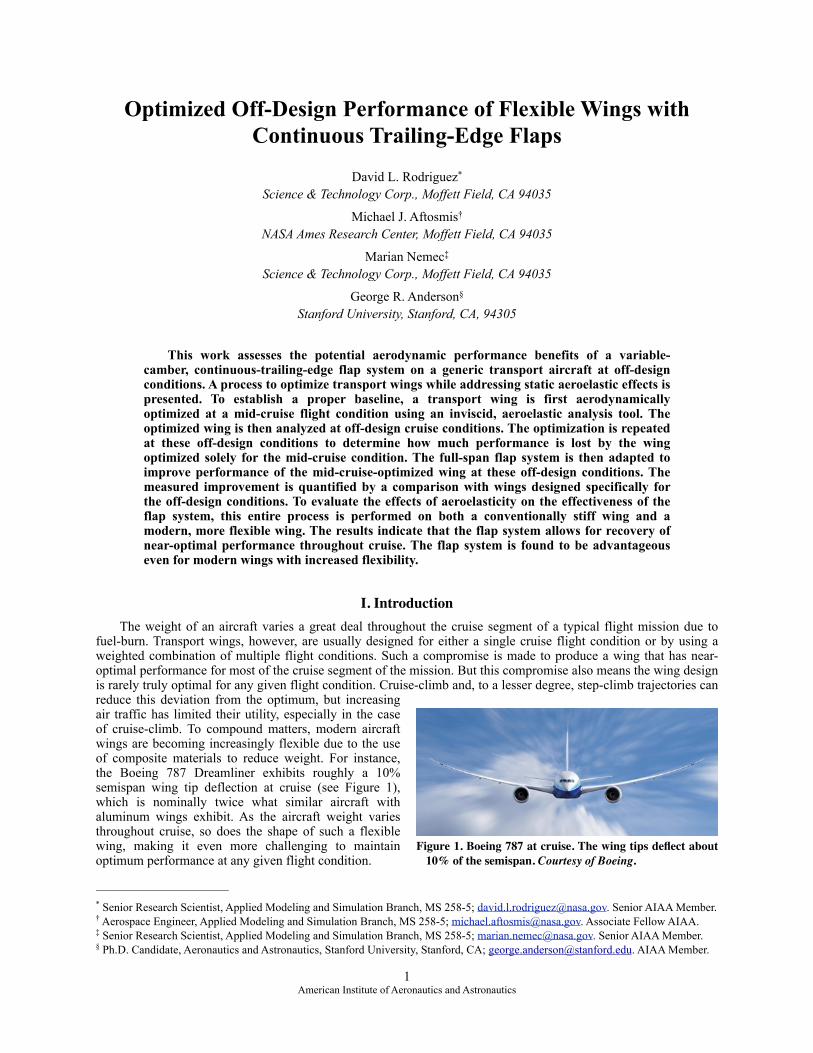
fuel-burn. Transport wings, however, are usually designed for either a single cruise flight condition or by using a weighted combination of multiple flight conditions. Such a compromise is made to produce a wing that has near-optimal performance for most of the cruise segment of the mission. But this compromise also means the wing design is rarely truly optimal for any given flight condition. Cruise-climb and, to a lesser degree, step-climb trajectories can reduce this deviation from the optimum, but increasing air traffic has limited their utility, especially in the case of cruise-climb. To compound matters, modern aircraft wings are becoming increasingly flexible due to the use of composite materials to reduce weight. For instance, the Boeing 787 Dreamliner exhibits roughly a 10% semispan wing tip deflection at cruise (see Figure 1), which is nominally twice what similar aircraft with aluminum wings exhibit. As the aircraft weight varies throughout cruise, so does the shape of such a flexible wing, making it even more challenging to maintain optimum performance at any given flight condition.
! 1American Institute of Aeronautics and Astronautics
Figure 1. Boeing 787 at cruise. The wing tips deflect about 10% of the semispan. Courtesy of Boeing.
Senior Research Scientist, Applied Modeling and Simulation Branch, MS 258-5; [email protected]. Senior AIAA Member.*
Aerospace Engineer, Applied Modeling and Simulation Branch, MS 258-5; [email protected]. Associate Fellow AIAA.†
Senior Research Scientist, Applied Modeling and Simulation Branch, MS 258-5; [email protected]. Senior AIAA Member.‡
Ph.D. Candidate, Aeronautics and Astronautics, Stanford University, Stanford, CA; [email protected]. AIAA Member.§
Throughout the history of human flight, active reshaping of a wing has been used to improve performance or as a control mechanism. The Wright brothers would actively warp the wings of their flyers as a method of steering.1 In the late 1970’s, Rockwell, NASA, and the Air Force worked on the HiMAT aircraft design which was the first airplane to fly with aeroelastically tailored lifting surfaces.2 In the early 1980’s, a Rockwell concept known as the Active Flexible Wing employed both leading and trailing edge control surfaces to reshape the wing in flight for improved performance and maneuverability.2 NASA Langley has been working with smart structures to actively reshape the trailing edge of a wing for improved aerodynamic performance since the 1990’s.3 In fact, there have been many conceptual and production aircraft that employ some sort of wing-morphing to improve performance.4
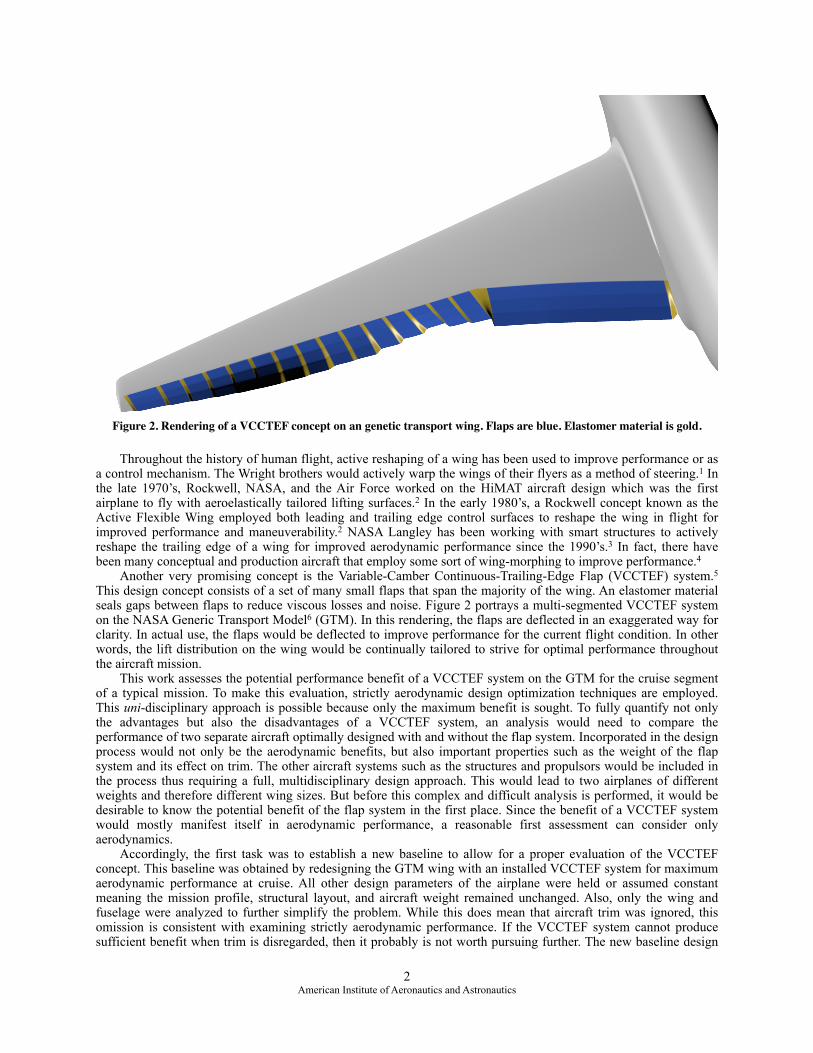
Another very promising concept is the Variable-Camber Continuous-Trailing-Edge Flap (VCCTEF) system.5 This design concept consists of a set of many small flaps that span the majority of the wing. An elastomer material seals gaps between flaps to reduce viscous losses and noise. Figure 2 portrays a multi-segmented VCCTEF system on the NASA Generic Transport Model6 (GTM). In this rendering, the flaps are deflected in an exaggerated way for clarity. In actual use, the flaps would be deflected to improve performance for the current flight condition. In other words, the lift distribution on the wing would be continually tailored to strive for optimal performance throughout the aircraft mission.
This work assesses the potential performance benefit of a VCCTEF system on the GTM for the cruise segment of a typical mission. To make this evaluation, strictly aerodynamic design optimization techniques are employed. This uni-disciplinary approach is possible because only the maximum benefit is sought. To fully quantify not only the advantages but also the disadvantages of a VCCTEF system, an analysis would need to compare the performance of two separate aircraft optimally designed with and without the flap system. Incorporated in the design process would not only be the aerodynamic benefits, but also important properties such as the weight of the flap system and its effect on trim. The other aircraft systems such as the structures and propulsors would be included in the process thus requiring a full, multidisciplinary design approach. This would lead to two airplanes of different weights and therefore different wing sizes. But before this complex and difficult analysis is performed, it would be desirable to know the potential benefit of the flap system in the first place. Since the benefit of a VCCTEF system would mostly manifest itself in aerodynamic performance, a reasonable first assessment can consider only aerodynamics.
Accordingly, the first task was to establish a new baseline to allow for a proper evaluation of the VCCTEF concept. This baseline was obtained by redesigning the GTM wing with an installed VCCTEF system for maximum aerodynamic performance at cruise. All other design parameters of the airplane were held or assumed constant meaning the mission profile, structural layout, and aircraft weight remained unchanged. Also, only the wing and fuselage were analyzed to further simplify the problem. While this does mean that aircraft trim was ignored, this omission is consistent with examining strictly aerodynamic performance. If the VCCTEF system cannot produce sufficient benefit when trim is disregarded, then it probably is not worth pursuing further. The new baseline design
! 2American Institute of Aeronautics and Astronautics
Figure 2. Rendering of a VCCTEF concept on an genetic transport wing. Flaps are blue. Elastomer material is gold.
was generated by re-twisting the wing and deflecting the VCCTEF system to produce a more optimal lift distribution for minimum induced drag and to reduce wave drag where possible. Viscous drag was assumed constant since the wetted area of the aircraft remained essentially unchanged and no significant regions of flow separation are expected at cruise conditions. Any other inviscid-viscous interactions were assumed to be minimal. Finally, any engine installation effects are neglected.
The redesign was conducted at the mid-cruise flight condition to produce a wing that should perform reasonably well throughout the entire cruise segment of the GTM mission profile. The performance of this new baseline design was evaluated at two off-design conditions. The wing twist and flap deflections were also re-designed to establish the best possible aerodynamic performance at both of these off-design conditions. The baseline wing was then adapted to the off-design conditions by optimizing only the flap deflections as would occur in actual flight. By comparing the performance of these adapted wings to the best possible performance, the aerodynamic benefits of the VCCTEF system could be quantified.
The GTM wing design uses a conventional, relatively stiff aluminum structure while modern transport wings are built using composite materials. Composite wings are not only lighter but also much more flexible. Can a VCCTEF system be successful on a modern, highly flexible wing? To address this question, two wing designs with considerably different structural stiffnesses were optimized and analyzed to evaluate the effects of varying levels of flexibility on the potential performance benefits of a VCCTEF system.
The predominant aeroelastic effect on a transport wing is, of course, bending under aerodynamic load, which effectively washes out the wing twist of a swept wing. In addition to this primary effect, deflecting any flap will apply an additional local torque and thus change the local twist of a wing. A deflected flap also alters the local camber and hence the local lift and drag forces which further change the shape of the wing. Because flap deflections can have a significant effect on wing shape and thus performance, it is necessary to account for all of these aeroelastic effects in any design process. Consequently, a static aeroelastic analysis method7 was used in this work to compute aerodynamic performance. Using an aeroelastic analysis tool allowed for all changes in wing shape to be properly modeled, particularly on flexible wings. This aeroelastic analysis method was also implemented within an aerodynamic design optimization framework, which allowed for a better assessment of the benefits of a VCCTEF system.
II. Methodology The aerodynamic analysis and design tools necessary to complete the evaluation of the VCCTEF system are
presented in this section. The static aeroelastic analysis method, which was previously developed by the authors,3 is summarized. This method is then incorporated within a proven optimization framework to allow for aerodynamic design that addresses aeroelastic effects. The methods used to model the geometrically complex VCCTEF system are also presented.
A. Static Aeroelastic Analysis A classic, loosely-coupled, iterative technique was used to perform static aeroelastic analysis of transport wings.
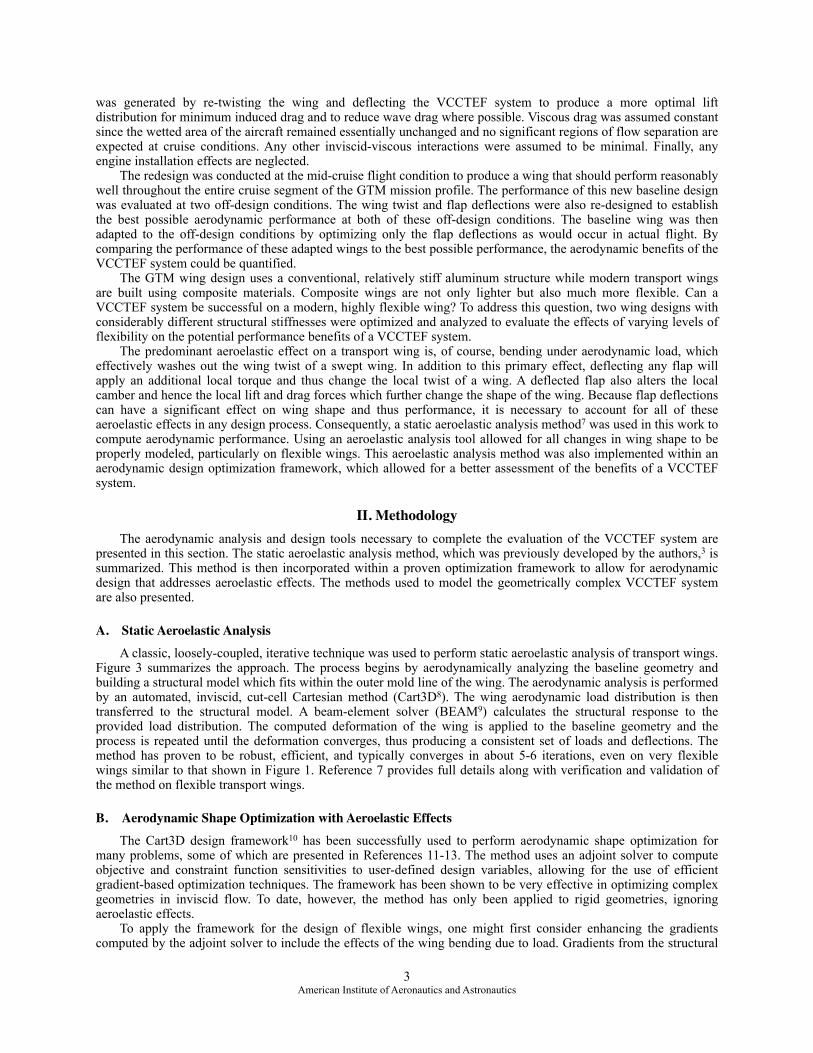
Figure 3 summarizes the approach. The process begins by aerodynamically analyzing the baseline geometry and building a structural model which fits within the outer mold line of the wing. The aerodynamic analysis is performed by an automated, inviscid, cut-cell Cartesian method (Cart3D8). The wing aerodynamic load distribution is then transferred to the structural model. A beam-element solver (BEAM9) calculates the structural response to the provided load distribution. The computed deformation of the wing is applied to the baseline geometry and the process is repeated until the deformation converges, thus producing a consistent set of loads and deflections. The method has proven to be robust, efficient, and typically converges in about 5-6 iterations, even on very flexible wings similar to that shown in Figure 1. Reference 7 provides full details along with verification and validation of the method on flexible transport wings.
B. Aerodynamic Shape Optimization with Aeroelastic Effects The Cart3D design framework10 has been successfully used to perform aerodynamic shape optimization for
many problems, some of which are presented in References 11-13. The method uses an adjoint solver to compute objective and constraint function sensitivities to user-defined design variables, allowing for the use of efficient gradient-based optimization techniques. The framework has been shown to be very effective in optimizing complex geometries in inviscid flow. To date, however, the method has only been applied to rigid geometries, ignoring aeroelastic effects.
To apply the framework for the design of flexible wings, one might first consider enhancing the gradients computed by the adjoint solver to include the effects of the wing bending due to load. Gradients from the structural
! 3American Institute of Aeronautics and Astronautics
model could be computed and combined with those from the flow solver to compute the full aeroelastic sensitivities to the design variables. Because the aeroelastic analysis method is loosely-coupled, the aeroelastic gradient computation would also need to use an iterative procedure which could prove expensive. But as mentioned earlier, the goal of this work requires only aerodynamic shape optimization; the structural model itself remains constant. This feature of the design problem can be leveraged to simplify and speed up the process. Instead of iterating between the adjoints of the flow and structural solvers within each gradient computation, the iteration can be moved entirely outside the aerodynamic optimization process as described below.
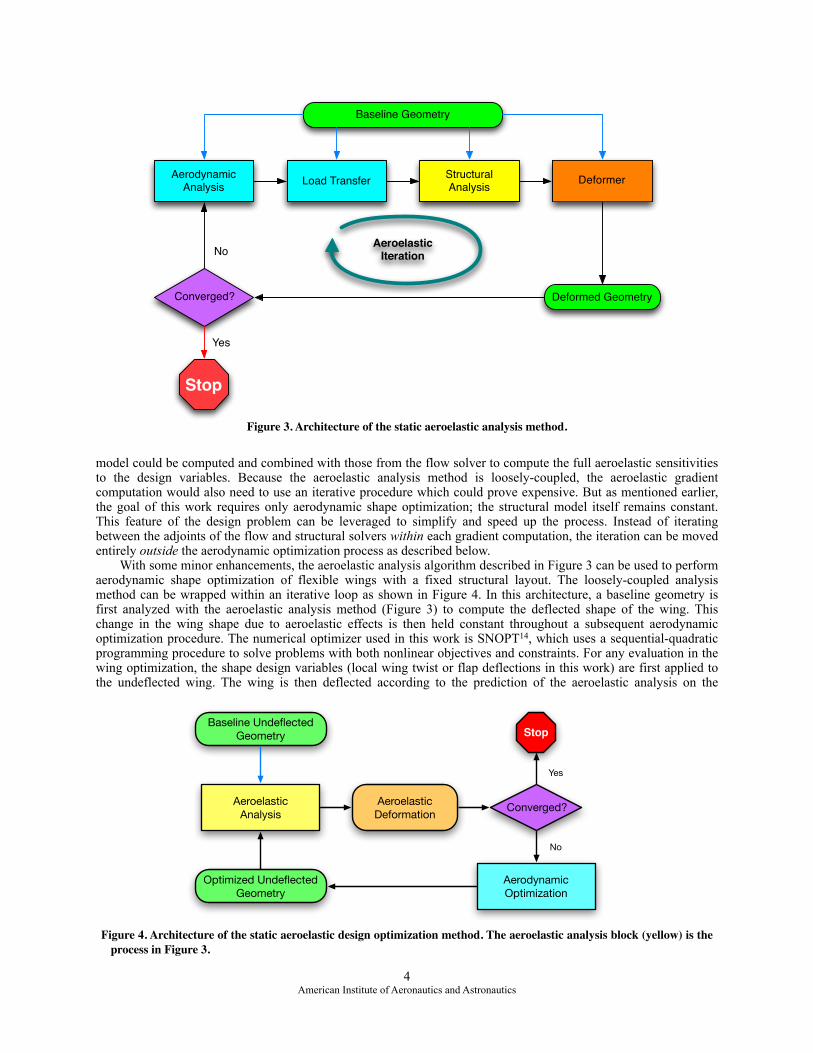
With some minor enhancements, the aeroelastic analysis algorithm described in Figure 3 can be used to perform aerodynamic shape optimization of flexible wings with a fixed structural layout. The loosely-coupled analysis method can be wrapped within an iterative loop as shown in Figure 4. In this architecture, a baseline geometry is first analyzed with the aeroelastic analysis method (Figure 3) to compute the deflected shape of the wing. This change in the wing shape due to aeroelastic effects is then held constant throughout a subsequent aerodynamic optimization procedure. The numerical optimizer used in this work is SNOPT14, which uses a sequential-quadratic programming procedure to solve problems with both nonlinear objectives and constraints. For any evaluation in the wing optimization, the shape design variables (local wing twist or flap deflections in this work) are first applied to the undeflected wing. The wing is then deflected according to the prediction of the aeroelastic analysis on the
! 4American Institute of Aeronautics and Astronautics
Aerodynamic Analysis Load Transfer Structural
Analysis Deform Geometry
Deformed GeometryConverged?
Stop
Yes
No
Baseline Geometry
AeroelasticIteration
Deformer
Figure 3. Architecture of the static aeroelastic analysis method.
AeroelasticAnalysis
Aeroelastic Deformation Converged?
Stop
Optimized Undeflected Geometry
Aerodynamic Optimization
Baseline Undeflected Geometry
Yes
No
Figure 4. Architecture of the static aeroelastic design optimization method. The aeroelastic analysis block (yellow) is the process in Figure 3.
unoptimized wing. In other words, in each design iteration, the twist distribution and flap deflections of the wing are optimized while assuming the aeroelastic effects are constant.
Of course, once the wing is optimized, the spanwise load distribution is altered which modifies the deflected shape. The optimized wing is then analyzed again with the aeroelastic analysis tool, generating an updated deflected shape. This outer loop repeats until the deflected shape and the aircraft drag converges, thereby producing a wing design with optimal aerodynamic performance while modeling aeroelastic effects at the design flight condition. As will be shown later, this process has been observed to converge in just 3-4 outer loop iterations, resulting in a very efficient design tool for flexible wings.
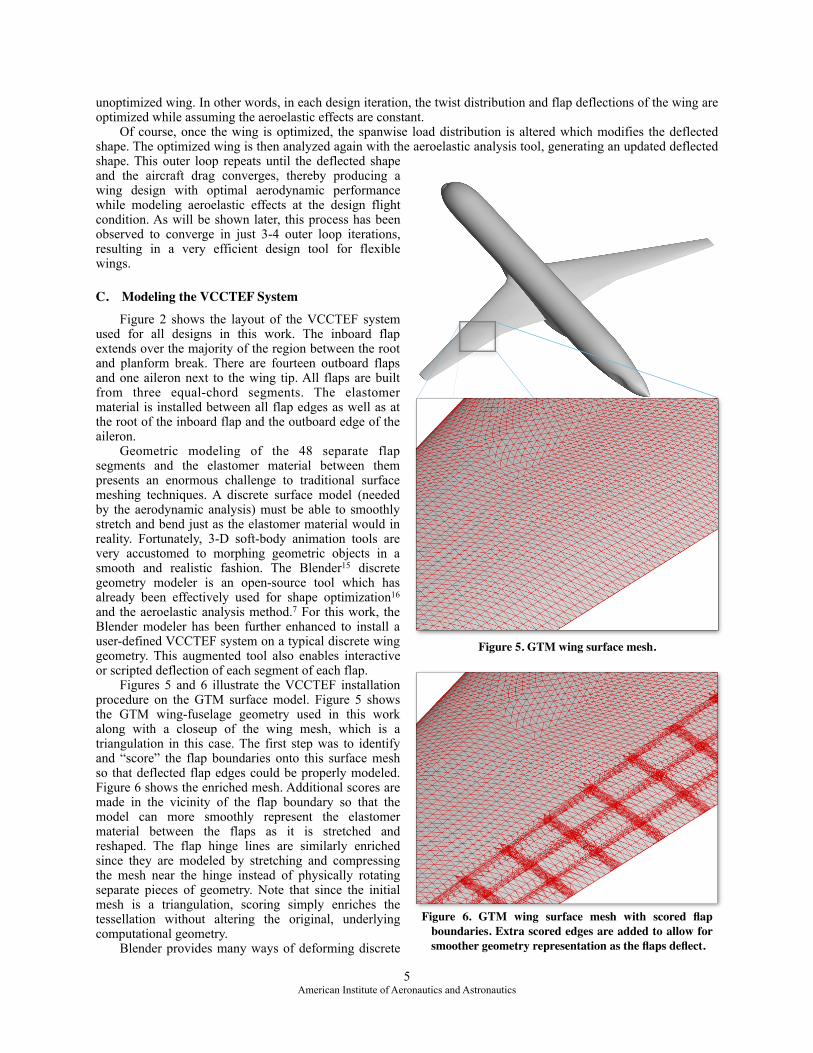
C. Modeling the VCCTEF System Figure 2 shows the layout of the VCCTEF system
used for all designs in this work. The inboard flap extends over the majority of the region between the root and planform break. There are fourteen outboard flaps and one aileron next to the wing tip. All flaps are built from three equal-chord segments. The elastomer material is installed between all flap edges as well as at the root of the inboard flap and the outboard edge of the aileron.
Geometric modeling of the 48 separate flap segments and the elastomer material between them presents an enormous challenge to traditional surface meshing techniques. A discrete surface model (needed by the aerodynamic analysis) must be able to smoothly stretch and bend just as the elastomer material would in reality. Fortunately, 3-D soft-body animation tools are very accustomed to morphing geometric objects in a smooth and realistic fashion. The Blender15 discrete geometry modeler is an open-source tool which has already been effectively used for shape optimization16 and the aeroelastic analysis method.7 For this work, the Blender modeler has been further enhanced to install a user-defined VCCTEF system on a typical discrete wing geometry. This augmented tool also enables interactive or scripted deflection of each segment of each flap.
Figures 5 and 6 illustrate the VCCTEF installation procedure on the GTM surface model. Figure 5 shows the GTM wing-fuselage geometry used in this work along with a closeup of the wing mesh, which is a triangulation in this case. The first step was to identify and “score” the flap boundaries onto this surface mesh so that deflected flap edges could be properly modeled. Figure 6 shows the enriched mesh. Additional scores are made in the vicinity of the flap boundary so that the model can more smoothly represent the elastomer material between the flaps as it is stretched and reshaped. The flap hinge lines are similarly enriched since they are modeled by stretching and compressing the mesh near the hinge instead of physically rotating separate pieces of geometry. Note that since the initial mesh is a triangulation, scoring simply enriches the tessellation without altering the original, underlying computational geometry.
Blender provides many ways of deforming discrete
! 5American Institute of Aeronautics and Astronautics
Figure 5. GTM wing surface mesh.
Figure 6. GTM wing surface mesh with scored flap boundaries. Extra scored edges are added to allow for smoother geometry representation as the flaps deflect.
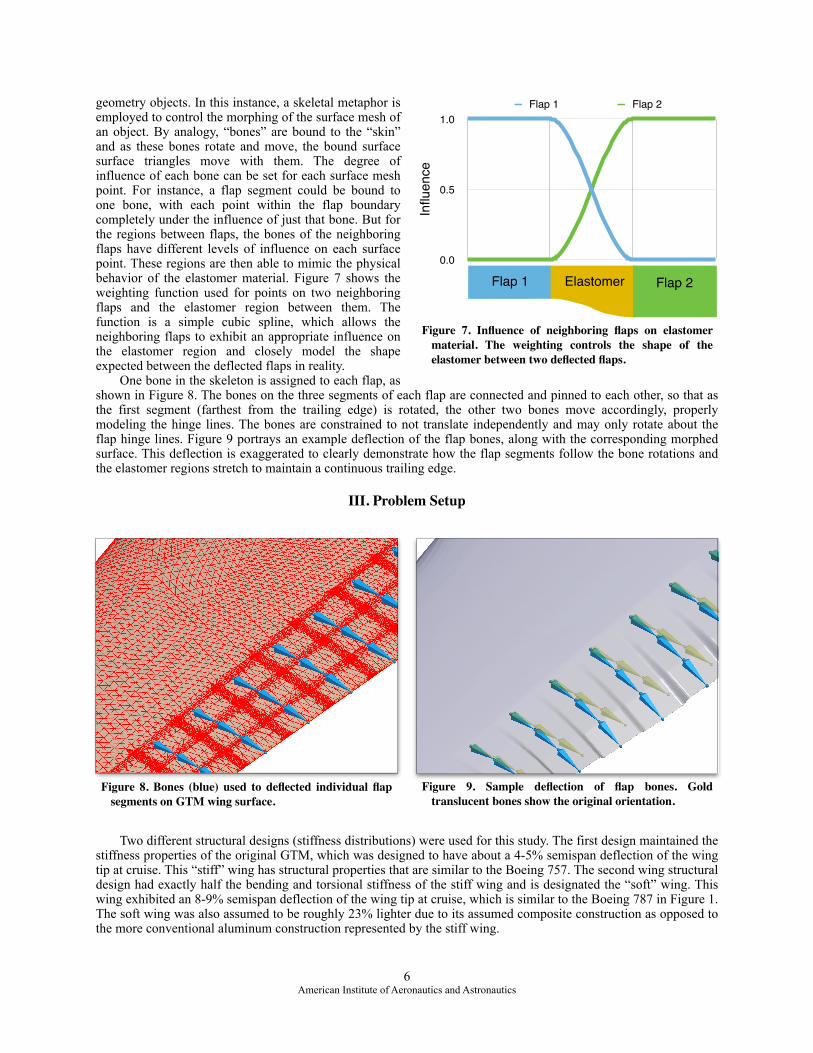
geometry objects. In this instance, a skeletal metaphor is employed to control the morphing of the surface mesh of an object. By analogy, “bones” are bound to the “skin” and as these bones rotate and move, the bound surface surface triangles move with them. The degree of influence of each bone can be set for each surface mesh point. For instance, a flap segment could be bound to one bone, with each point within the flap boundary completely under the influence of just that bone. But for the regions between flaps, the bones of the neighboring flaps have different levels of influence on each surface point. These regions are then able to mimic the physical behavior of the elastomer material. Figure 7 shows the weighting function used for points on two neighboring flaps and the elastomer region between them. The function is a simple cubic spline, which allows the neighboring flaps to exhibit an appropriate influence on the elastomer region and closely model the shape expected between the deflected flaps in reality.
One bone in the skeleton is assigned to each flap, as shown in Figure 8. The bones on the three segments of each flap are connected and pinned to each other, so that as the first segment (farthest from the trailing edge) is rotated, the other two bones move accordingly, properly modeling the hinge lines. The bones are constrained to not translate independently and may only rotate about the flap hinge lines. Figure 9 portrays an example deflection of the flap bones, along with the corresponding morphed surface. This deflection is exaggerated to clearly demonstrate how the flap segments follow the bone rotations and the elastomer regions stretch to maintain a continuous trailing edge.
III. Problem Setup
Two different structural designs (stiffness distributions) were used for this study. The first design maintained the stiffness properties of the original GTM, which was designed to have about a 4-5% semispan deflection of the wing tip at cruise. This “stiff” wing has structural properties that are similar to the Boeing 757. The second wing structural design had exactly half the bending and torsional stiffness of the stiff wing and is designated the “soft” wing. This wing exhibited an 8-9% semispan deflection of the wing tip at cruise, which is similar to the Boeing 787 in Figure 1. The soft wing was also assumed to be roughly 23% lighter due to its assumed composite construction as opposed to the more conventional aluminum construction represented by the stiff wing.
! 6American Institute of Aeronautics and Astronautics
Figure 9. Sample deflection of flap bones. Gold translucent bones show the original orientation.
Figure 8. Bones (blue) used to deflected individual flap segments on GTM wing surface.
Influ
ence
0.0
0.5
1.0Flap 1 Flap 2
Flap 1 Elastomer Flap 2
Figure 7. Influence of neighboring flaps on elastomer material. The weighting controls the shape of the elastomer between two deflected flaps.
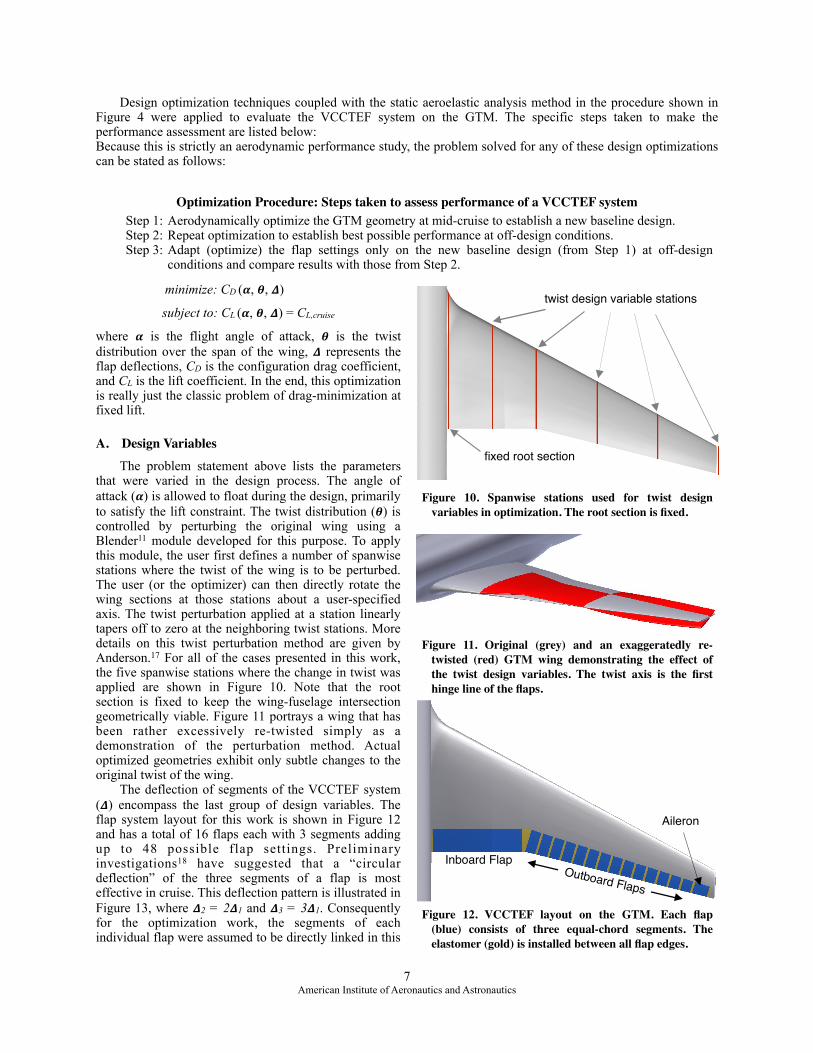
Design optimization techniques coupled with the static aeroelastic analysis method in the procedure shown in Figure 4 were applied to evaluate the VCCTEF system on the GTM. The specific steps taken to make the performance assessment are listed below: Because this is strictly an aerodynamic performance study, the problem solved for any of these design optimizations can be stated as follows:
minimize: CD (𝜶, 𝜽, 𝜟)
subject to: CL (𝜶, 𝜽, 𝜟) = CL,cruise
where 𝜶 is the flight angle of attack, 𝜽 is the twist distribution over the span of the wing, 𝜟 represents the flap deflections, CD is the configuration drag coefficient, and CL is the lift coefficient. In the end, this optimization is really just the classic problem of drag-minimization at fixed lift.
A. Design Variables The problem statement above lists the parameters
that were varied in the design process. The angle of attack (𝜶) is allowed to float during the design, primarily to satisfy the lift constraint. The twist distribution (𝜽) is controlled by perturbing the original wing using a Blender11 module developed for this purpose. To apply this module, the user first defines a number of spanwise stations where the twist of the wing is to be perturbed. The user (or the optimizer) can then directly rotate the wing sections at those stations about a user-specified axis. The twist perturbation applied at a station linearly tapers off to zero at the neighboring twist stations. More details on this twist perturbation method are given by Anderson.17 For all of the cases presented in this work, the five spanwise stations where the change in twist was applied are shown in Figure 10. Note that the root section is fixed to keep the wing-fuselage intersection geometrically viable. Figure 11 portrays a wing that has been rather excessively re-twisted simply as a demonstration of the perturbation method. Actual optimized geometries exhibit only subtle changes to the original twist of the wing.
The deflection of segments of the VCCTEF system (𝜟) encompass the last group of design variables. The flap system layout for this work is shown in Figure 12 and has a total of 16 flaps each with 3 segments adding up to 48 possible flap settings. Preliminary investigations18 have suggested that a “circular deflection” of the three segments of a flap is most effective in cruise. This deflection pattern is illustrated in Figure 13, where 𝜟2 = 2𝜟1 and 𝜟3 = 3𝜟1. Consequently for the optimization work, the segments of each individual flap were assumed to be directly linked in this
! 7American Institute of Aeronautics and Astronautics
Figure 12. VCCTEF layout on the GTM. Each flap (blue) consists of three equal-chord segments. The elastomer (gold) is installed between all flap edges.
Inboard Flap
Aileron
Outboard Flaps
Figure 11. Original (grey) and an exaggeratedly re-twisted (red) GTM wing demonstrating the effect of the twist design variables. The twist axis is the first hinge line of the flaps.
fixed root section
twist design variable stations
Figure 10. Spanwise stations used for twist design variables in optimization. The root section is fixed.
Optimization Procedure: Steps taken to assess performance of a VCCTEF system Step 1: Aerodynamically optimize the GTM geometry at mid-cruise to establish a new baseline design. Step 2: Repeat optimization to establish best possible performance at off-design conditions. Step 3: Adapt (optimize) the flap settings only on the new baseline design (from Step 1) at off-design
conditions and compare results with those from Step 2.
circular fashion. This linking of the flap segments models a camber change while mostly utilizing all three segments of any flap.
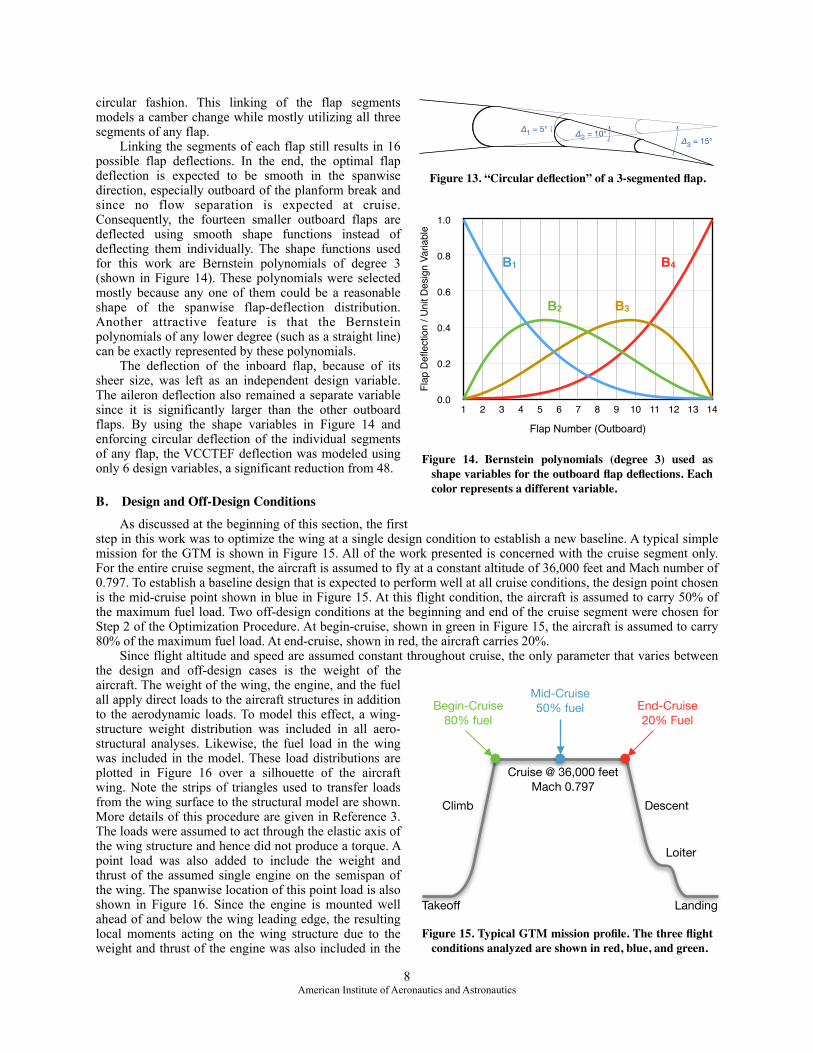
Linking the segments of each flap still results in 16 possible flap deflections. In the end, the optimal flap deflection is expected to be smooth in the spanwise direction, especially outboard of the planform break and since no flow separation is expected at cruise. Consequently, the fourteen smaller outboard flaps are deflected using smooth shape functions instead of deflecting them individually. The shape functions used for this work are Bernstein polynomials of degree 3 (shown in Figure 14). These polynomials were selected mostly because any one of them could be a reasonable shape of the spanwise flap-deflection distribution. Another attractive feature is that the Bernstein polynomials of any lower degree (such as a straight line) can be exactly represented by these polynomials.
The deflection of the inboard flap, because of its sheer size, was left as an independent design variable. The aileron deflection also remained a separate variable since it is significantly larger than the other outboard flaps. By using the shape variables in Figure 14 and enforcing circular deflection of the individual segments of any flap, the VCCTEF deflection was modeled using only 6 design variables, a significant reduction from 48.
B. Design and Off-Design Conditions As discussed at the beginning of this section, the first
step in this work was to optimize the wing at a single design condition to establish a new baseline. A typical simple mission for the GTM is shown in Figure 15. All of the work presented is concerned with the cruise segment only. For the entire cruise segment, the aircraft is assumed to fly at a constant altitude of 36,000 feet and Mach number of 0.797. To establish a baseline design that is expected to perform well at all cruise conditions, the design point chosen is the mid-cruise point shown in blue in Figure 15. At this flight condition, the aircraft is assumed to carry 50% of the maximum fuel load. Two off-design conditions at the beginning and end of the cruise segment were chosen for Step 2 of the Optimization Procedure. At begin-cruise, shown in green in Figure 15, the aircraft is assumed to carry 80% of the maximum fuel load. At end-cruise, shown in red, the aircraft carries 20%.
Since flight altitude and speed are assumed constant throughout cruise, the only parameter that varies between the design and off-design cases is the weight of the aircraft. The weight of the wing, the engine, and the fuel all apply direct loads to the aircraft structures in addition to the aerodynamic loads. To model this effect, a wing-structure weight distribution was included in all aero-structural analyses. Likewise, the fuel load in the wing was included in the model. These load distributions are plotted in Figure 16 over a silhouette of the aircraft wing. Note the strips of triangles used to transfer loads from the wing surface to the structural model are shown. More details of this procedure are given in Reference 3. The loads were assumed to act through the elastic axis of the wing structure and hence did not produce a torque. A point load was also added to include the weight and thrust of the assumed single engine on the semispan of the wing. The spanwise location of this point load is also shown in Figure 16. Since the engine is mounted well ahead of and below the wing leading edge, the resulting local moments acting on the wing structure due to the weight and thrust of the engine was also included in the
! 8American Institute of Aeronautics and Astronautics
∆3 = 15°∆2 = 10°∆1 = 5°
Figure 13. “Circular deflection” of a 3-segmented flap.
Takeoff Landing
Climb Descent
Cruise @ 36,000 feetMach 0.797
Loiter
Mid-Cruise50% fuelBegin-Cruise
80% fuelEnd-Cruise20% Fuel
Figure 15. Typical GTM mission profile. The three flight conditions analyzed are shown in red, blue, and green.
Figure 14. Bernstein polynomials (degree 3) used as shape variables for the outboard flap deflections. Each color represents a different variable.
Flap
Defl
ectio
n / U
nit D
esig
n Va
riabl
e
0.0
0.2
0.4
0.6
0.8
1.0
Flap Number (Outboard)
1 2 3 4 5 6 7 8 9 10 11 12 13 14
B1
B2 B3
B4
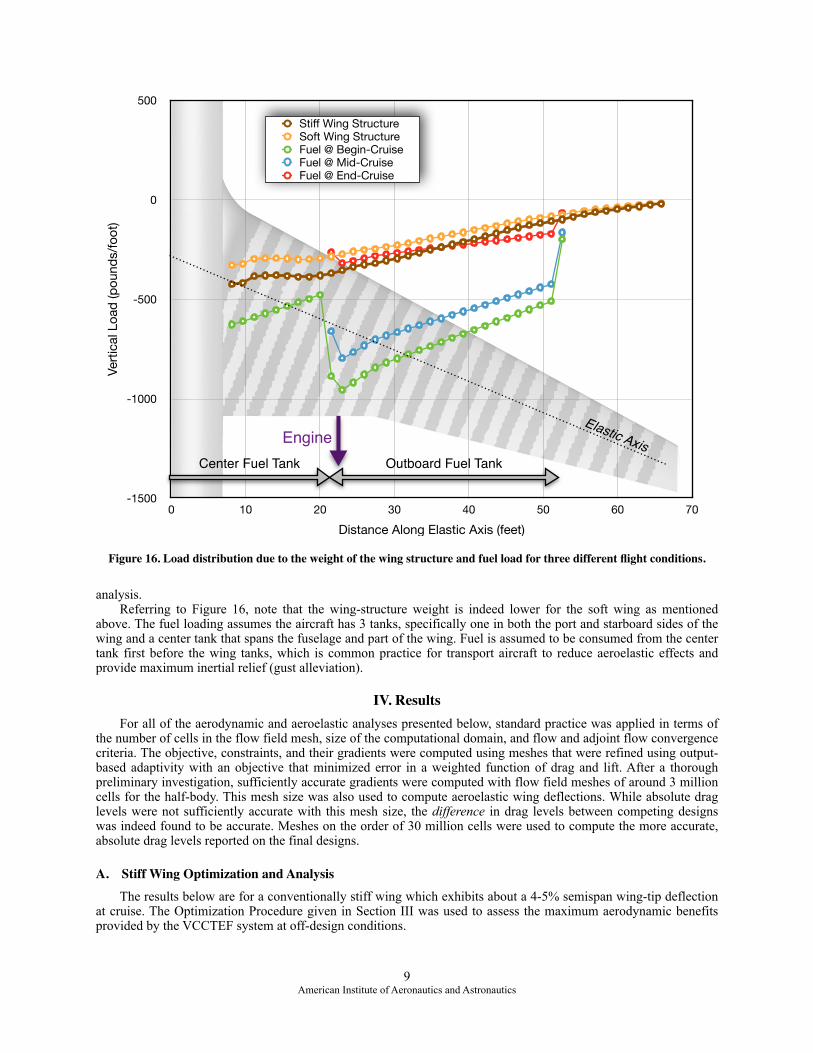
analysis. Referring to Figure 16, note that the wing-structure weight is indeed lower for the soft wing as mentioned
above. The fuel loading assumes the aircraft has 3 tanks, specifically one in both the port and starboard sides of the wing and a center tank that spans the fuselage and part of the wing. Fuel is assumed to be consumed from the center tank first before the wing tanks, which is common practice for transport aircraft to reduce aeroelastic effects and provide maximum inertial relief (gust alleviation).
IV. Results For all of the aerodynamic and aeroelastic analyses presented below, standard practice was applied in terms of
the number of cells in the flow field mesh, size of the computational domain, and flow and adjoint flow convergence criteria. The objective, constraints, and their gradients were computed using meshes that were refined using output-based adaptivity with an objective that minimized error in a weighted function of drag and lift. After a thorough preliminary investigation, sufficiently accurate gradients were computed with flow field meshes of around 3 million cells for the half-body. This mesh size was also used to compute aeroelastic wing deflections. While absolute drag levels were not sufficiently accurate with this mesh size, the difference in drag levels between competing designs was indeed found to be accurate. Meshes on the order of 30 million cells were used to compute the more accurate, absolute drag levels reported on the final designs.
A. Stiff Wing Optimization and Analysis The results below are for a conventionally stiff wing which exhibits about a 4-5% semispan wing-tip deflection
at cruise. The Optimization Procedure given in Section III was used to assess the maximum aerodynamic benefits provided by the VCCTEF system at off-design conditions.
! 9American Institute of Aeronautics and Astronautics
Verti
cal L
oad
(pou
nds/
foot
)
-1500
-1000
-500
0
500
Distance Along Elastic Axis (feet)0 10 20 30 40 50 60 70
Stiff Wing StructureSoft Wing StructureFuel @ Begin-CruiseFuel @ Mid-CruiseFuel @ End-Cruise
Center Fuel Tank Outboard Fuel Tank
EngineElastic Axis
Figure 16. Load distribution due to the weight of the wing structure and fuel load for three different flight conditions.
Step 1: Establishing a New Baseline Design
The first step was to identify a new baseline geometry that exhibits optimal aerodynamic performance at mid-cruise while including aeroelastic effects. This design became the new benchmark against which all other optimized designs with the VCCTEF system would be compared. The wing re-design was conducted in stages, successively adding design variables to the problem. The first optimization stage modified just the twist of the wing. As expected, the result was a spanwise lift distribution that minimized induced drag.
The second design stage perturbed the segments of the VCCTEF system while retaining the optimized twist from the previous stage. The cruise speed is transonic, and thus the flaps can have a significant effect on the wave drag of the aircraft. Also, because the root of the inboard flap is so close to the wing-fuselage junction, it effectively controls the wing incidence at the root. Combined with the other flaps and the flight angle of attack, the fuselage incidence to the oncoming flow can be controlled mostly by the deflection of this large flap. This degree of freedom allows for a reduction in drag produced by too much or even too little fuselage incidence.
The final stage of the wing optimization included all of the design variables from the first two stages and was essentially a fine-tuning of the design. To reiterate, the design variables used in this stage include the flight angle of attack, the 5 twist variables (Figure 10), the inboard flap deflection, the aileron deflection, and the 4 Bernstein polynomials (Figure 14) that control the deflection of the 14 outboard flaps (Figure 12). Using this staged approach, the effectiveness of the twist and flap design variables on aerodynamic performance could be somewhat isolated, thus providing more insight into the potential advantage of the VCCTEF system.
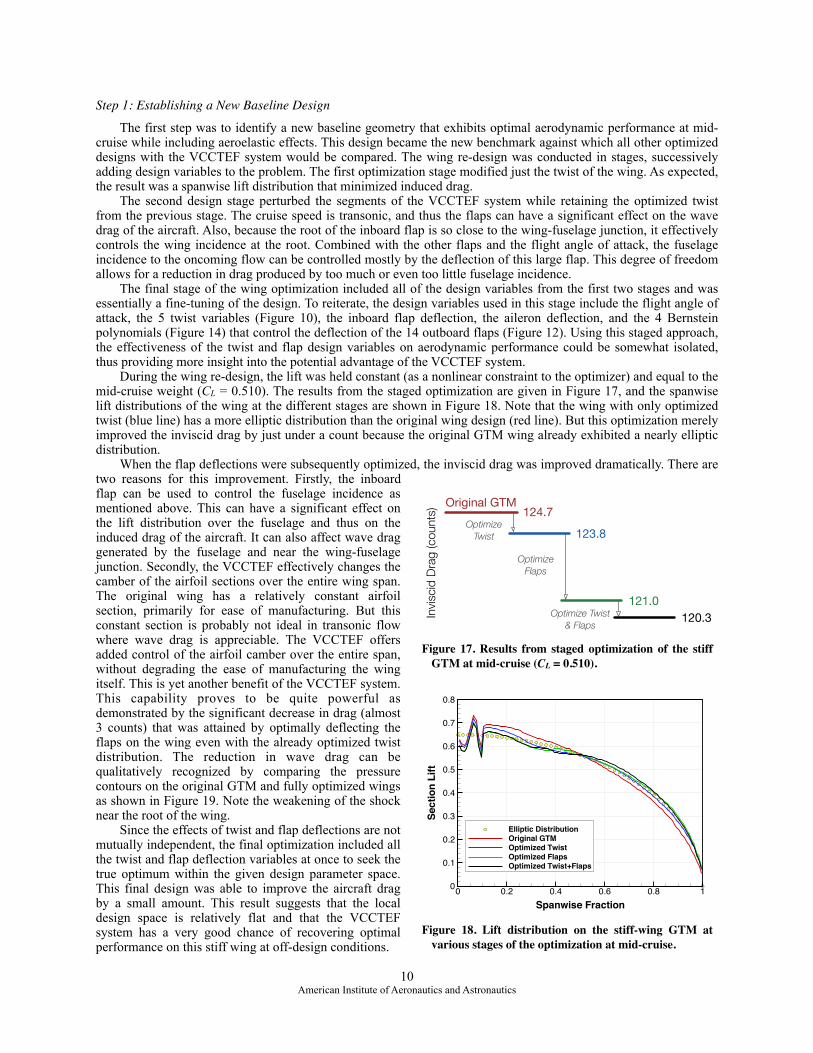
During the wing re-design, the lift was held constant (as a nonlinear constraint to the optimizer) and equal to the mid-cruise weight (CL = 0.510). The results from the staged optimization are given in Figure 17, and the spanwise lift distributions of the wing at the different stages are shown in Figure 18. Note that the wing with only optimized twist (blue line) has a more elliptic distribution than the original wing design (red line). But this optimization merely improved the inviscid drag by just under a count because the original GTM wing already exhibited a nearly elliptic distribution.
When the flap deflections were subsequently optimized, the inviscid drag was improved dramatically. There are two reasons for this improvement. Firstly, the inboard flap can be used to control the fuselage incidence as mentioned above. This can have a significant effect on the lift distribution over the fuselage and thus on the induced drag of the aircraft. It can also affect wave drag generated by the fuselage and near the wing-fuselage junction. Secondly, the VCCTEF effectively changes the camber of the airfoil sections over the entire wing span. The original wing has a relatively constant airfoil section, primarily for ease of manufacturing. But this constant section is probably not ideal in transonic flow where wave drag is appreciable. The VCCTEF offers added control of the airfoil camber over the entire span, without degrading the ease of manufacturing the wing itself. This is yet another benefit of the VCCTEF system. This capability proves to be quite powerful as demonstrated by the significant decrease in drag (almost 3 counts) that was attained by optimally deflecting the flaps on the wing even with the already optimized twist distribution. The reduction in wave drag can be qualitatively recognized by comparing the pressure contours on the original GTM and fully optimized wings as shown in Figure 19. Note the weakening of the shock near the root of the wing.
Since the effects of twist and flap deflections are not mutually independent, the final optimization included all the twist and flap deflection variables at once to seek the true optimum within the given design parameter space. This final design was able to improve the aircraft drag by a small amount. This result suggests that the local design space is relatively flat and that the VCCTEF system has a very good chance of recovering optimal performance on this stiff wing at off-design conditions.
! 10American Institute of Aeronautics and Astronautics
Spanwise Fraction
Sect
ion
Lift
0 0.2 0.4 0.6 0.8 10
0.1
0.2
0.3
0.4
0.5
0.6
0.7
0.8
Elliptic DistributionOriginal GTMOptimized TwistOptimized FlapsOptimized Twist+Flaps
Figure 18. Lift distribution on the stiff-wing GTM at various stages of the optimization at mid-cruise.
Invi
scid
Dra
g (counts
) Original GTM
121.0
Optimize Twist
124.7123.8
120.3
Optimize Flaps
Optimize Twist & Flaps
Figure 17. Results from staged optimization of the stiff GTM at mid-cruise (CL = 0.510).
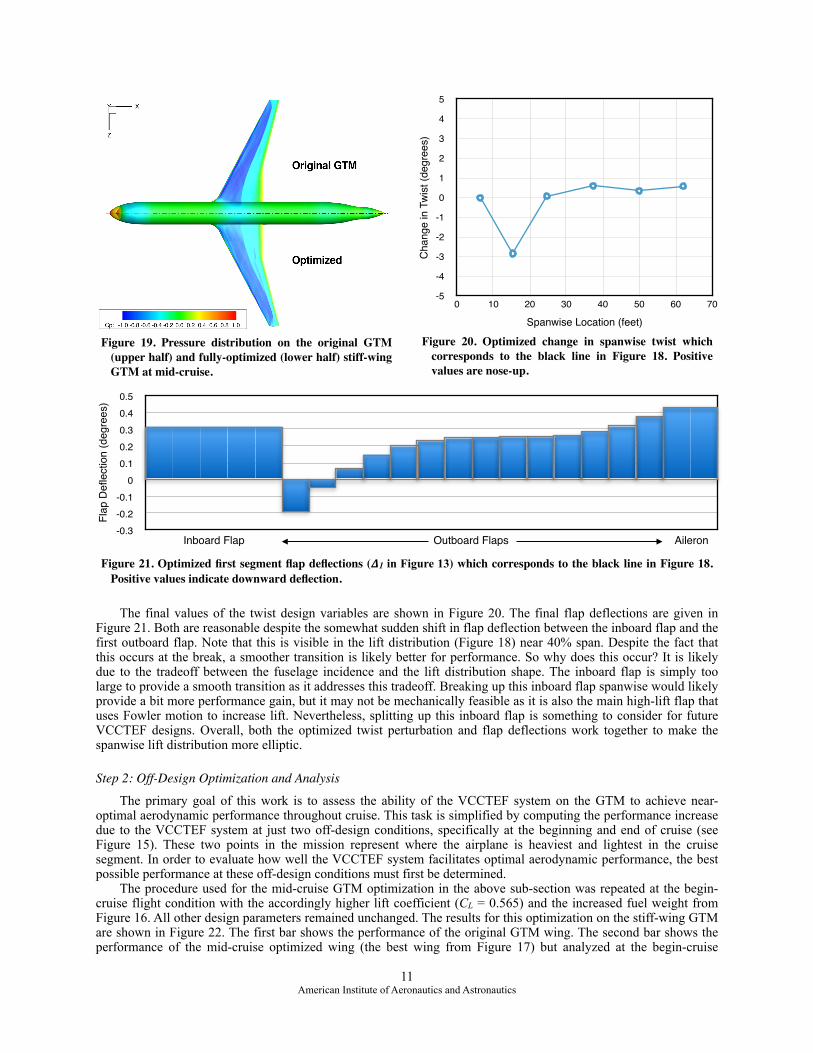
The final values of the twist design variables are shown in Figure 20. The final flap deflections are given in Figure 21. Both are reasonable despite the somewhat sudden shift in flap deflection between the inboard flap and the first outboard flap. Note that this is visible in the lift distribution (Figure 18) near 40% span. Despite the fact that this occurs at the break, a smoother transition is likely better for performance. So why does this occur? It is likely due to the tradeoff between the fuselage incidence and the lift distribution shape. The inboard flap is simply too large to provide a smooth transition as it addresses this tradeoff. Breaking up this inboard flap spanwise would likely provide a bit more performance gain, but it may not be mechanically feasible as it is also the main high-lift flap that uses Fowler motion to increase lift. Nevertheless, splitting up this inboard flap is something to consider for future VCCTEF designs. Overall, both the optimized twist perturbation and flap deflections work together to make the spanwise lift distribution more elliptic.
Step 2: Off-Design Optimization and Analysis
The primary goal of this work is to assess the ability of the VCCTEF system on the GTM to achieve near-optimal aerodynamic performance throughout cruise. This task is simplified by computing the performance increase due to the VCCTEF system at just two off-design conditions, specifically at the beginning and end of cruise (see Figure 15). These two points in the mission represent where the airplane is heaviest and lightest in the cruise segment. In order to evaluate how well the VCCTEF system facilitates optimal aerodynamic performance, the best possible performance at these off-design conditions must first be determined.
The procedure used for the mid-cruise GTM optimization in the above sub-section was repeated at the begin-cruise flight condition with the accordingly higher lift coefficient (CL = 0.565) and the increased fuel weight from Figure 16. All other design parameters remained unchanged. The results for this optimization on the stiff-wing GTM are shown in Figure 22. The first bar shows the performance of the original GTM wing. The second bar shows the performance of the mid-cruise optimized wing (the best wing from Figure 17) but analyzed at the begin-cruise
! 11American Institute of Aeronautics and Astronautics
Flap
Defl
ectio
n (d
egre
es)
-0.3-0.2-0.1
00.10.20.30.40.5
Inboard Flap Outboard Flaps Aileron
Figure 21. Optimized first segment flap deflections (𝜟1 in Figure 13) which corresponds to the black line in Figure 18. Positive values indicate downward deflection.
Cha
nge
in T
wis
t (de
gree
s)
-5
-4
-3
-2
-1
0
1
2
3
4
5
Spanwise Location (feet)0 10 20 30 40 50 60 70
Figure 20. Optimized change in spanwise twist which corresponds to the black line in Figure 18. Positive values are nose-up.
Figure 19. Pressure distribution on the original GTM (upper half) and fully-optimized (lower half) stiff-wing GTM at mid-cruise.
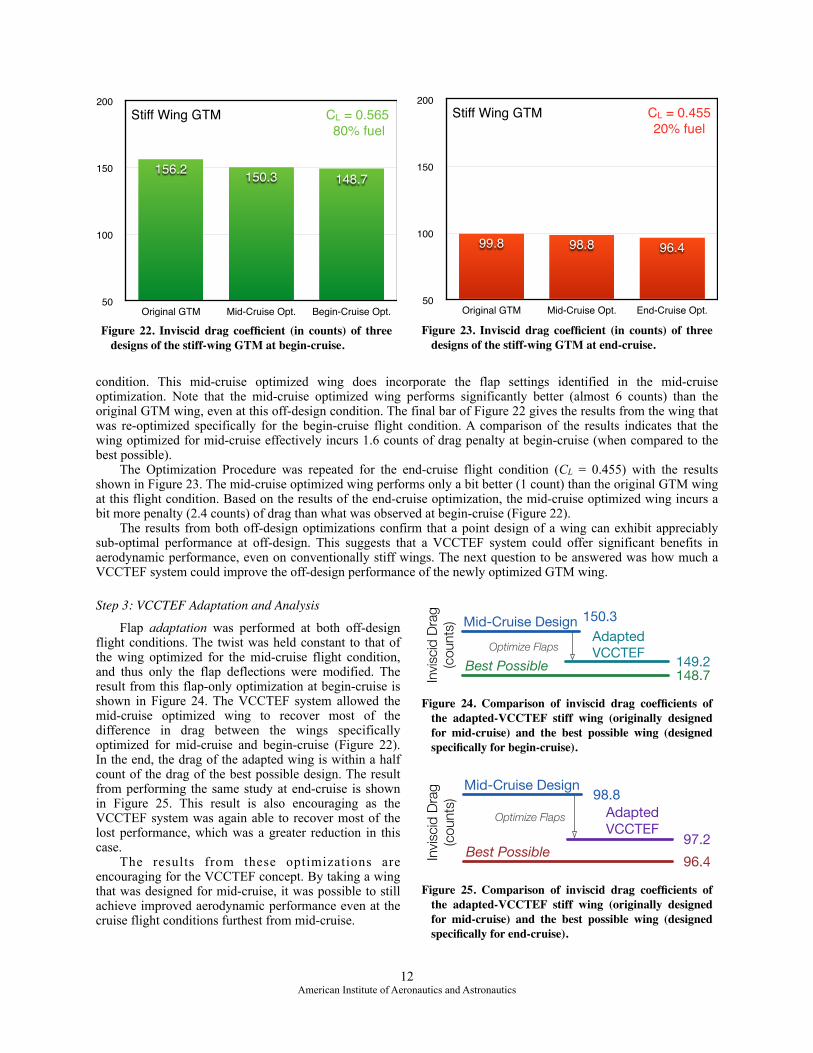
condition. This mid-cruise optimized wing does incorporate the flap settings identified in the mid-cruise optimization. Note that the mid-cruise optimized wing performs significantly better (almost 6 counts) than the original GTM wing, even at this off-design condition. The final bar of Figure 22 gives the results from the wing that was re-optimized specifically for the begin-cruise flight condition. A comparison of the results indicates that the wing optimized for mid-cruise effectively incurs 1.6 counts of drag penalty at begin-cruise (when compared to the best possible).
The Optimization Procedure was repeated for the end-cruise flight condition (CL = 0.455) with the results shown in Figure 23. The mid-cruise optimized wing performs only a bit better (1 count) than the original GTM wing at this flight condition. Based on the results of the end-cruise optimization, the mid-cruise optimized wing incurs a bit more penalty (2.4 counts) of drag than what was observed at begin-cruise (Figure 22).
The results from both off-design optimizations confirm that a point design of a wing can exhibit appreciably sub-optimal performance at off-design. This suggests that a VCCTEF system could offer significant benefits in aerodynamic performance, even on conventionally stiff wings. The next question to be answered was how much a VCCTEF system could improve the off-design performance of the newly optimized GTM wing.
Step 3: VCCTEF Adaptation and Analysis
Flap adaptation was performed at both off-design flight conditions. The twist was held constant to that of the wing optimized for the mid-cruise flight condition, and thus only the flap deflections were modified. The result from this flap-only optimization at begin-cruise is shown in Figure 24. The VCCTEF system allowed the mid-cruise optimized wing to recover most of the difference in drag between the wings specifically optimized for mid-cruise and begin-cruise (Figure 22). In the end, the drag of the adapted wing is within a half count of the drag of the best possible design. The result from performing the same study at end-cruise is shown in Figure 25. This result is also encouraging as the VCCTEF system was again able to recover most of the lost performance, which was a greater reduction in this case.
The results from these optimizations are encouraging for the VCCTEF concept. By taking a wing that was designed for mid-cruise, it was possible to still achieve improved aerodynamic performance even at the cruise flight conditions furthest from mid-cruise.
! 12American Institute of Aeronautics and Astronautics
Invi
scid
Dra
g
(co
unts
)
Optimize Flaps
Mid-Cruise Design 98.8
96.4Best Possible97.2
AdaptedVCCTEF
Figure 25. Comparison of inviscid drag coefficients of the adapted-VCCTEF stiff wing (originally designed for mid-cruise) and the best possible wing (designed specifically for end-cruise).
50
100
150
200
Original GTM Mid-Cruise Opt. Begin-Cruise Opt.
148.7150.3156.2
Figure 22. Inviscid drag coefficient (in counts) of three designs of the stiff-wing GTM at begin-cruise.
Stiff Wing GTM CL = 0.565!80% fuel
50
100
150
200
Original GTM Mid-Cruise Opt. End-Cruise Opt.
96.498.899.8
Figure 23. Inviscid drag coefficient (in counts) of three designs of the stiff-wing GTM at end-cruise.
Stiff Wing GTM CL = 0.455!20% fuel
Mid-Cruise Design
Invi
scid
Dra
g
(counts
)
148.7
150.3
149.2Optimize Flaps
Best Possible
AdaptedVCCTEF
Figure 24. Comparison of inviscid drag coefficients of the adapted-VCCTEF stiff wing (originally designed for mid-cruise) and the best possible wing (designed specifically for begin-cruise).
B. Soft Wing Optimization and Analysis The results from the study performed on the stiff
GTM wing in the section above were quite promising. However, modern wings will be much more flexible, such as the wing shown in Figure 1. Increased flexibility also means a potentially increased variation in drag throughout cruise. This section presents results from repeating the stiff wing design process on the soft wing.
The soft wing structure was created by simply halving the bending and torsional rigidity of the stiff wing. This means that for the same loading, the soft wing deflects twice as much as the stiff wing. Recall that the soft wing is also assumed to be structurally lighter, and therefore the cruise lift is a bit lower than for the stiff wing. Presented below are the results of applying the Optimization Procedure discussed in Section II on this soft wing design.
Step 1: Establishing a New Baseline Design
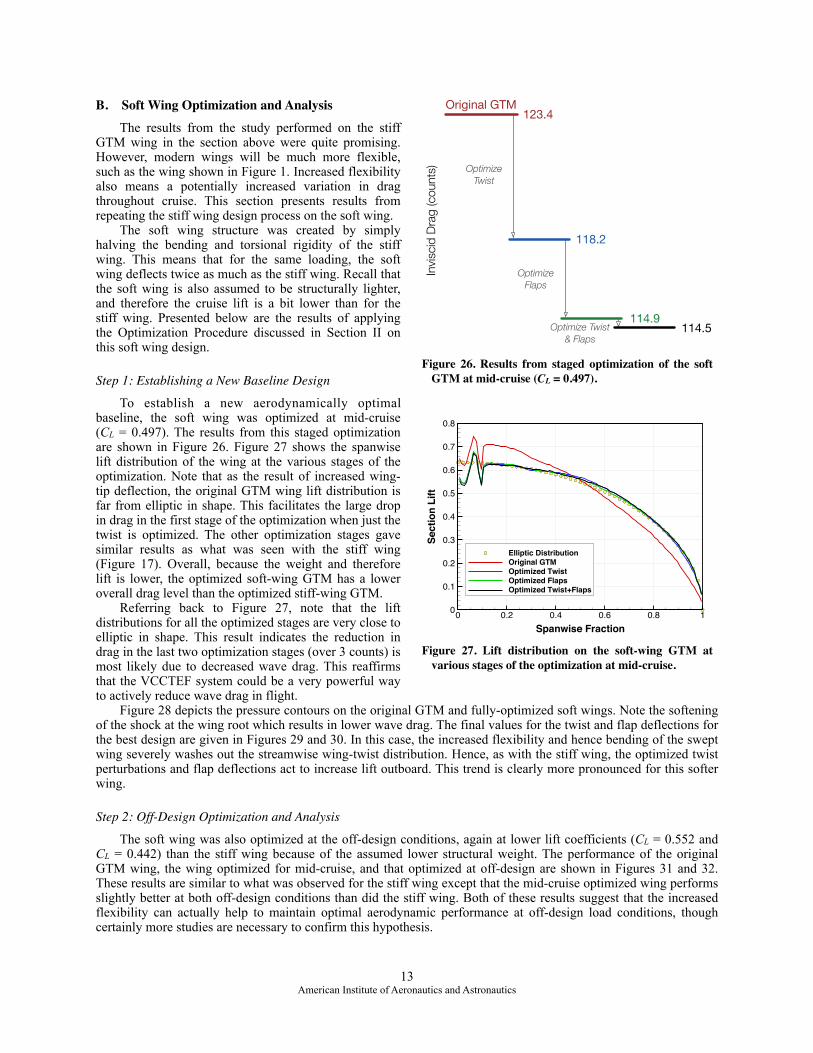
To establish a new aerodynamically optimal baseline, the soft wing was optimized at mid-cruise (CL = 0.497). The results from this staged optimization are shown in Figure 26. Figure 27 shows the spanwise lift distribution of the wing at the various stages of the optimization. Note that as the result of increased wing-tip deflection, the original GTM wing lift distribution is far from elliptic in shape. This facilitates the large drop in drag in the first stage of the optimization when just the twist is optimized. The other optimization stages gave similar results as what was seen with the stiff wing (Figure 17). Overall, because the weight and therefore lift is lower, the optimized soft-wing GTM has a lower overall drag level than the optimized stiff-wing GTM.
Referring back to Figure 27, note that the lift distributions for all the optimized stages are very close to elliptic in shape. This result indicates the reduction in drag in the last two optimization stages (over 3 counts) is most likely due to decreased wave drag. This reaffirms that the VCCTEF system could be a very powerful way to actively reduce wave drag in flight.
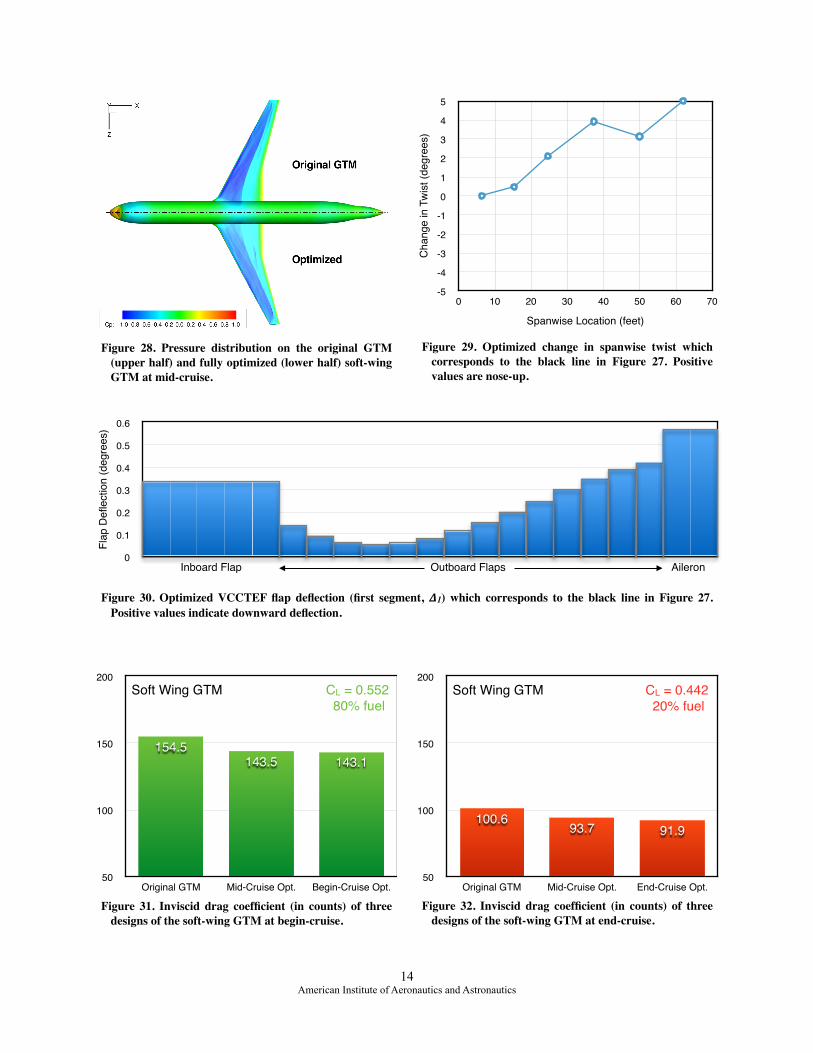
Figure 28 depicts the pressure contours on the original GTM and fully-optimized soft wings. Note the softening of the shock at the wing root which results in lower wave drag. The final values for the twist and flap deflections for the best design are given in Figures 29 and 30. In this case, the increased flexibility and hence bending of the swept wing severely washes out the streamwise wing-twist distribution. Hence, as with the stiff wing, the optimized twist perturbations and flap deflections act to increase lift outboard. This trend is clearly more pronounced for this softer wing.
Step 2: Off-Design Optimization and Analysis
The soft wing was also optimized at the off-design conditions, again at lower lift coefficients (CL = 0.552 and CL = 0.442) than the stiff wing because of the assumed lower structural weight. The performance of the original GTM wing, the wing optimized for mid-cruise, and that optimized at off-design are shown in Figures 31 and 32. These results are similar to what was observed for the stiff wing except that the mid-cruise optimized wing performs slightly better at both off-design conditions than did the stiff wing. Both of these results suggest that the increased flexibility can actually help to maintain optimal aerodynamic performance at off-design load conditions, though certainly more studies are necessary to confirm this hypothesis.
! 13American Institute of Aeronautics and Astronautics
Invi
scid
Dra
g (co
unts
)
Optimize Twist & Flaps
Original GTM
114.9
Optimize Twist
123.4
118.2
114.5
Optimize Flaps
Figure 26. Results from staged optimization of the soft GTM at mid-cruise (CL = 0.497).
Spanwise Fraction
Sect
ion
Lift
0 0.2 0.4 0.6 0.8 10
0.1
0.2
0.3
0.4
0.5
0.6
0.7
0.8
Elliptic DistributionOriginal GTMOptimized TwistOptimized FlapsOptimized Twist+Flaps
Figure 27. Lift distribution on the soft-wing GTM at various stages of the optimization at mid-cruise.
! 14American Institute of Aeronautics and Astronautics
50
100
150
200
Original GTM Mid-Cruise Opt. Begin-Cruise Opt.
143.1143.5154.5
Figure 31. Inviscid drag coefficient (in counts) of three designs of the soft-wing GTM at begin-cruise.
Soft Wing GTM CL = 0.552!80% fuel
50
100
150
200
Original GTM Mid-Cruise Opt. End-Cruise Opt.
91.993.7100.6
Figure 32. Inviscid drag coefficient (in counts) of three designs of the soft-wing GTM at end-cruise.
Soft Wing GTM CL = 0.442!20% fuel
Figure 30. Optimized VCCTEF flap deflection (first segment, 𝜟1) which corresponds to the black line in Figure 27. Positive values indicate downward deflection.
Flap
Defl
ectio
n (d
egre
es)
0
0.1
0.2
0.3
0.4
0.5
0.6
Inboard Flap Outboard Flaps Aileron
Cha
nge
in T
wis
t (de
gree
s)
-5
-4
-3
-2
-1
0
1
2
3
4
5
Spanwise Location (feet)
0 10 20 30 40 50 60 70
Figure 29. Optimized change in spanwise twist which corresponds to the black line in Figure 27. Positive values are nose-up.
Figure 28. Pressure distribution on the original GTM (upper half) and fully optimized (lower half) soft-wing GTM at mid-cruise.
Step 3: VCCTEF Adaptation and Analysis
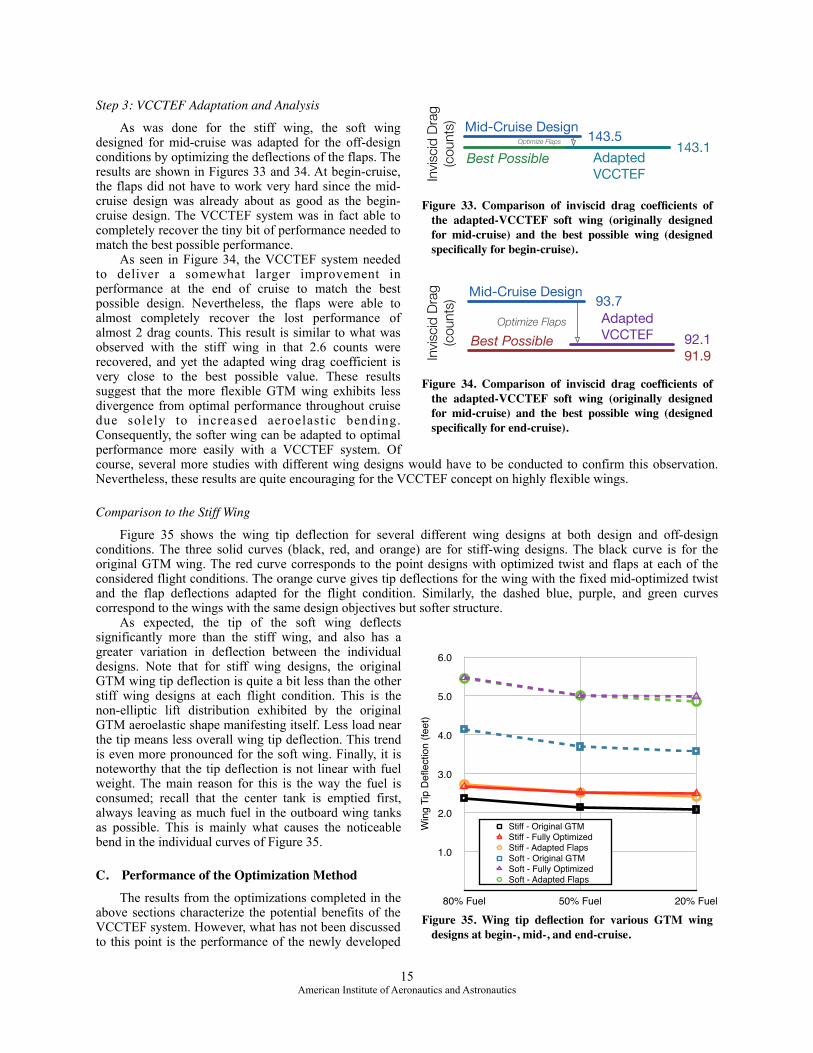
As was done for the stiff wing, the soft wing designed for mid-cruise was adapted for the off-design conditions by optimizing the deflections of the flaps. The results are shown in Figures 33 and 34. At begin-cruise, the flaps did not have to work very hard since the mid-cruise design was already about as good as the begin-cruise design. The VCCTEF system was in fact able to completely recover the tiny bit of performance needed to match the best possible performance.
As seen in Figure 34, the VCCTEF system needed to deliver a somewhat larger improvement in performance at the end of cruise to match the best possible design. Nevertheless, the flaps were able to almost completely recover the lost performance of almost 2 drag counts. This result is similar to what was observed with the stiff wing in that 2.6 counts were recovered, and yet the adapted wing drag coefficient is very close to the best possible value. These results suggest that the more flexible GTM wing exhibits less divergence from optimal performance throughout cruise due solely to increased aeroelastic bending. Consequently, the softer wing can be adapted to optimal performance more easily with a VCCTEF system. Of course, several more studies with different wing designs would have to be conducted to confirm this observation. Nevertheless, these results are quite encouraging for the VCCTEF concept on highly flexible wings.
Comparison to the Stiff Wing
Figure 35 shows the wing tip deflection for several different wing designs at both design and off-design conditions. The three solid curves (black, red, and orange) are for stiff-wing designs. The black curve is for the original GTM wing. The red curve corresponds to the point designs with optimized twist and flaps at each of the considered flight conditions. The orange curve gives tip deflections for the wing with the fixed mid-optimized twist and the flap deflections adapted for the flight condition. Similarly, the dashed blue, purple, and green curves correspond to the wings with the same design objectives but softer structure.
As expected, the tip of the soft wing deflects significantly more than the stiff wing, and also has a greater variation in deflection between the individual designs. Note that for stiff wing designs, the original GTM wing tip deflection is quite a bit less than the other stiff wing designs at each flight condition. This is the non-elliptic lift distribution exhibited by the original GTM aeroelastic shape manifesting itself. Less load near the tip means less overall wing tip deflection. This trend is even more pronounced for the soft wing. Finally, it is noteworthy that the tip deflection is not linear with fuel weight. The main reason for this is the way the fuel is consumed; recall that the center tank is emptied first, always leaving as much fuel in the outboard wing tanks as possible. This is mainly what causes the noticeable bend in the individual curves of Figure 35.
C. Performance of the Optimization Method The results from the optimizations completed in the
above sections characterize the potential benefits of the VCCTEF system. However, what has not been discussed to this point is the performance of the newly developed
! 15American Institute of Aeronautics and Astronautics
Invi
scid
Dra
g
(counts
)
Optimize Flaps
Mid-Cruise Design 143.5Best Possible
143.1AdaptedVCCTEF
Figure 33. Comparison of inviscid drag coefficients of the adapted-VCCTEF soft wing (originally designed for mid-cruise) and the best possible wing (designed specifically for begin-cruise).
Win
g Ti
p D
eflec
tion
(feet
)
1.0
2.0
3.0
4.0
5.0
6.0
80% Fuel 50% Fuel 20% Fuel
Stiff - Original GTMStiff - Fully OptimizedStiff - Adapted FlapsSoft - Original GTMSoft - Fully OptimizedSoft - Adapted Flaps
Figure 35. Wing tip deflection for various GTM wing designs at begin-, mid-, and end-cruise.
Invi
scid
Dra
g
(counts
)
Optimize Flaps
Mid-Cruise Design 93.7
91.9Best Possible 92.1
AdaptedVCCTEF
Figure 34. Comparison of inviscid drag coefficients of the adapted-VCCTEF soft wing (originally designed for mid-cruise) and the best possible wing (designed specifically for end-cruise).
design procedure that was used to obtain these results (Figure 4). This iterative procedure is not completely automated because each design optimization needs to be monitored separately for convergence; going from optimized geometry back to the aeroelastic analysis requires some user intervention. However, the aeroelastic analysis is fully automated (Reference 3) and thus the entire process amounts to running two separate procedures several times.
The aeroelastic analyses each required about 5 iterations to fully converge and compute the deflected wing shape. With this fixed shape, most of the optimizations required on the order of 50 objective function evaluations to obtain an optimal solution. Usually about half of these evaluations were accepted by the line search of the optimizer, though this number varied greatly between optimizations. Using 64 processors on the current state-of-the-art, shared-memory machines at NASA Ames, each optimization required about a day of wall-clock time. On the same machine, the aeroelastic analyses required just a couple hours of wall-clock time, as did the final fine mesh solutions for computing absolute drag levels.
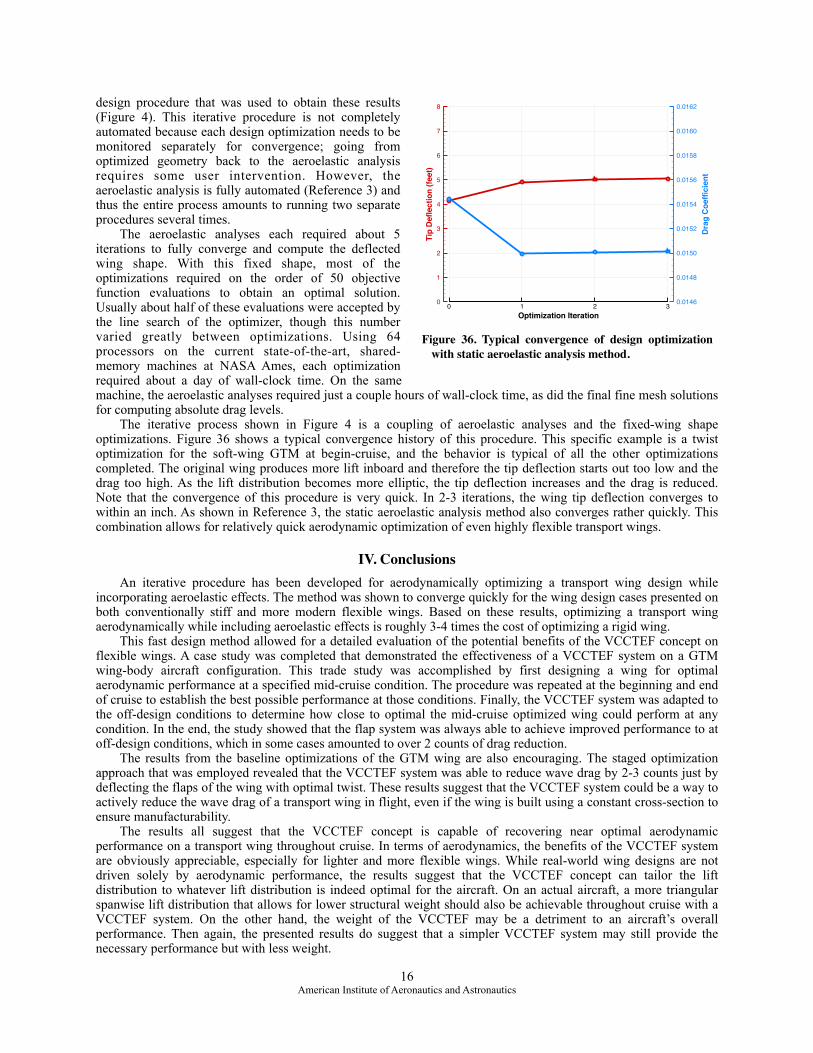
The iterative process shown in Figure 4 is a coupling of aeroelastic analyses and the fixed-wing shape optimizations. Figure 36 shows a typical convergence history of this procedure. This specific example is a twist optimization for the soft-wing GTM at begin-cruise, and the behavior is typical of all the other optimizations completed. The original wing produces more lift inboard and therefore the tip deflection starts out too low and the drag too high. As the lift distribution becomes more elliptic, the tip deflection increases and the drag is reduced. Note that the convergence of this procedure is very quick. In 2-3 iterations, the wing tip deflection converges to within an inch. As shown in Reference 3, the static aeroelastic analysis method also converges rather quickly. This combination allows for relatively quick aerodynamic optimization of even highly flexible transport wings.
IV. Conclusions An iterative procedure has been developed for aerodynamically optimizing a transport wing design while
incorporating aeroelastic effects. The method was shown to converge quickly for the wing design cases presented on both conventionally stiff and more modern flexible wings. Based on these results, optimizing a transport wing aerodynamically while including aeroelastic effects is roughly 3-4 times the cost of optimizing a rigid wing.
This fast design method allowed for a detailed evaluation of the potential benefits of the VCCTEF concept on flexible wings. A case study was completed that demonstrated the effectiveness of a VCCTEF system on a GTM wing-body aircraft configuration. This trade study was accomplished by first designing a wing for optimal aerodynamic performance at a specified mid-cruise condition. The procedure was repeated at the beginning and end of cruise to establish the best possible performance at those conditions. Finally, the VCCTEF system was adapted to the off-design conditions to determine how close to optimal the mid-cruise optimized wing could perform at any condition. In the end, the study showed that the flap system was always able to achieve improved performance to at off-design conditions, which in some cases amounted to over 2 counts of drag reduction.
The results from the baseline optimizations of the GTM wing are also encouraging. The staged optimization approach that was employed revealed that the VCCTEF system was able to reduce wave drag by 2-3 counts just by deflecting the flaps of the wing with optimal twist. These results suggest that the VCCTEF system could be a way to actively reduce the wave drag of a transport wing in flight, even if the wing is built using a constant cross-section to ensure manufacturability.
The results all suggest that the VCCTEF concept is capable of recovering near optimal aerodynamic performance on a transport wing throughout cruise. In terms of aerodynamics, the benefits of the VCCTEF system are obviously appreciable, especially for lighter and more flexible wings. While real-world wing designs are not driven solely by aerodynamic performance, the results suggest that the VCCTEF concept can tailor the lift distribution to whatever lift distribution is indeed optimal for the aircraft. On an actual aircraft, a more triangular spanwise lift distribution that allows for lower structural weight should also be achievable throughout cruise with a VCCTEF system. On the other hand, the weight of the VCCTEF may be a detriment to an aircraft’s overall performance. Then again, the presented results do suggest that a simpler VCCTEF system may still provide the necessary performance but with less weight.
! 16American Institute of Aeronautics and Astronautics
Optimization Iteration
Tip
Defle
ctio
n (fe
et)
Drag
Coe
ffici
ent
0 1 2 30
1
2
3
4
5
6
7
8
0.0146
0.0148
0.0150
0.0152
0.0154
0.0156
0.0158
0.0160
0.0162
Figure 36. Typical convergence of design optimization with static aeroelastic analysis method.
As in any trade study, simplifications were made in this work to achieve the initial goal, which in this case was to determine the maximum potential benefit of a VCCTEF system on a transport wing. Nevertheless, the results strongly suggest that incorporating a VCCTEF concept in an actual aircraft would allow the designer to assume optimal performance throughout the cruise segment of the mission profile, even at constant altitude and speed.
V. Future Work The promising results from the VCCTEF design work were generated using 48-segments on 16-flaps, and yet
only 6 design variables were used to describe the actual flap deflections in each of the optimizations. This would suggest that the flap system may be more complex than necessary. It is possible that fewer spanwise flaps with only two segments each would be enough to attain a comparable level of performance. It also appears that breaking up the inboard flap spanwise may also be advantageous. Future trade studies are planned to address these hypotheses. Additional trade studies are also underway with viscous aerodynamic solvers to determine the best way to deflect the segments of any individual flap. The VCCTEF concept will also be studied on different aircraft configurations such as the Truss-Braced-Wing19 and the Common Research Model.20
In terms of the optimization procedure presented, the current method uses an inviscid flow solver. The very fast convergence of the method suggests that even a more expensive viscous solver would be a feasible tool for design optimization with aeroelastic effects. Work is currently underway to eventually explore this possibility with a steady Navier-Stokes solver.
VI. Acknowledgments This work was supported by the Advanced Air Transportation Technologies Project under the Fundamental
Aeronautics Program of NASA’s Aeronautics Research Mission Directorate. The authors would also like to acknowledge Eric Ting, Sonia Lebofsky, and Nhan Nguyen of the Intelligent Systems Division at NASA Ames. They provided guidance and many helpful discussions.
References 1Hallion, Richard P., Test Pilots: The Frontiersmen of Flight, Washington, DC: Smithsonian Institution Press, 1988. 2Harris, T. M. and Huttsell, L. J.,“Aeroelasticity Research at Wright-Patterson Air Force Base (Wright Field) from
1953-1993,” Journal of Aircraft, Vol. 40, No. 5 (September–October 2003), pp. 813–819. 3McGowan, A. R., Wilkie, W. K., Moses, R. W., Lake, R. C., Florance, J. P., Wieseman, C. D., Reaves, M. C., Taleghani,
B. K., Mirick, P. H., and Wilbur, M. L., “Aeroservoelastic structural dynamics research on smart structures conducted at NASA Langley Research Center,” 5th SPIE International Symposium on Smart Structures and Materials, San Diego, CA, 1998.
4Barbarino, S., Bilgen, O., Ajaj, R. M., Friswell, M. I., and Inman, D. J., “A Review of Morphing Aircraft,” Journal of Intelligent Material Systems and Structures, Vol. 22, No. 9 (June 2011), pp. 823-877.
5Urnes, J., Nguyen, N., Ippolito, C., Totah, J., Trihn, K., and Ting, E., “A Mission-Adaptive Variable Camber Flap Control System to Optimize High Lift and Cruise Lift-to-Drag Ratios of Future N+3 Transport Aircraft,” AIAA 2013-0214, January 2013.
6Thomas, J., Langford, W., Belcastro, C., Foster, J., Shah, G., Howland, G., and Kidd, R., “Development of a Dynamically Scaled Generic Transport Model Testbed for Flight Research Experiments,” AUVSI Unmanned Unlimited, Arlington, VA, 2004.
7Rodriguez, D. L., Aftosmis, M. J., Nemec, M., “Static Aeroelastic Analysis with an Inviscid Cartesian Method,” AIAA 2014-0836, January 2014.
8Aftosmis, M. J., Berger, M. J., and Adomavicius, G., “A Parallel Multilevel Method for Adaptively Refined Cartesian Grids with Embedded Boundaries,” AIAA 2000-0808, January 2000.
9Gallman, J. W. and Kroo, I. M., “Structural Optimization for Joined-Wing Synthesis,” Journal of Aircraft, Vol. 33, No. 1 (January-February 1996), pp. 214-223.
10Nemec, M., Aftosmis, M. J., “Parallel Adjoint Framework for Aerodynamic Shape Optimization of Component-Based Geometry,” AIAA 2011-1249, January 2011.
11Aftosmis, M. J., Nemec, M., and Cliff, S. E., “Adjoint-Based Low-Boom Design with Cart3D,” AIAA 2011-3500, January 2011.
12Wintzer, M., Kroo, I. M., Aftosmis, M. J., and Nemec, M., “Conceptual Design of Low Sonic Boom Aircraft Using Adjoint-Based CFD,” ICCFD7-2005, July 2012.
13Smith, S. C., Nemec, M., and Krist, S. E., “Integrated Nacelle-Wing Shape Optimization for an Ultra-High Bypass Fanjet Installation on a Single-Aisle Transport Configuration,” AIAA 2013-0543, January 2013.
! 17American Institute of Aeronautics and Astronautics
14Gill, P. E., Murray, W., and Saunders, M. A., “SNOPT: An SQP Algorithm for Large-Scale Constrained Optimization,” SIAM Journal on Optimization, Vol. 12, No. 4 (2002), pp. 979–1006.
15http://www.blender.org 16Anderson, G. R., Aftosmis, M. J., Nemec, M., “Parametric Deformation of Discrete Geometry for Aerodynamic Shape
Design,” AIAA 2012-0965, January 2012. 17Anderson, G. R., Aftosmis, M. J., and Nemec, M., “Aerodynamic Shape Optimization Benchmarks with Error Control and
Automatic Parameterization,” AIAA 2015-XXXX, January 2015. 18Kaul, U. K. and Nguyen, N., “Drag Optimization Study of Variable Camber Continuous Trailing Edge Flap (VCCTEF)
Using OVERFLOW,” AIAA 2014-2444, June 2014. 19Bradley, M. K. and Droney, C. K., “Subsonic Ultra Green Aircraft Research Phase II: N+4 Advanced Concept
Development,” NASA CR-2012-217556, May 2012. 20Vassberg, J. V., DeHaan, M. A., Rivers, S. M., and Wahls, R. A., “Development of a Common Research Model for Applied
CFD Validation Studies,” AIAA 2008-6919, August 2008.
! 18American Institute of Aeronautics and Astronautics