optimization of process parameters for multi-layer- … of process parameters for multi-layer- cum...
TRANSCRIPT
Shakti Bansal et al. Int. Journal of Engineering Research and Applications www.ijera.com
Vol. 3, Issue 5, Sep-Oct 2013, pp.206-217
www.ijera.com 206 | P a g e
Optimization of Process Parameters for Multi-Layer- Cum
Microwave Drying Of Oyster Mushrooms (Pleurotus Sajor Caju)
Shakti Bansal, Satish Kumar, M.S Alam, Mahesh Kumar Department of Processing and Food Engineering, Punjab Agricultural University, Ludhiana-141004.
Abstract: Experiments on oyster mushroom were carried out to study the effect of multi layer-cum-microwave drying
process parameters viz. loading density, air velocity and power level on the quality characteristics of the dried
product. Quality characteristics viz. rehydration ratio, shrinkage ratio, texture, colour, overall acceptability of dried mushroom were analyzed. The process parameters were optimized using response surface methodology
for responses with significant model and non significant lack of fit. The optimum operating conditions for air
velocity, loading density and power level were 3.80 m/sec 38.80 kg/m2 and 413 W at 600C drying air
temperature. Corresponding to these values of process variables, the value of rehydration ratio, shrinkage ratio,
hardness, chewiness, colour change was 2.15, 0.84, 720 N, 473N and 15.50 respectively. The overall desirability
was 0.78.
Keywords- Multi layer-cum-microwave drying, optimization, oyster mushroom, quality.
I. INTRODUCTION
Mushroom is the oldest single cell protein
food with protein content in between low grade
vegetable and high grade meat protein. Mushrooms are a more valuable source of protein than cattle or
fish and are valued for its characteristic meaty biting
texture and flavour. Mushroom is defined as a macro-
fungus with a distinctive fruiting body, which can be
hypogeous or epigeous, large enough to be seen with
the naked eye and to be picked by hand (Hawksworth
2001). Mushroom contains 20-35% protein (dry
weight) which is higher than those of vegetables and
fruits and is of superior quality. It is also rich in
vitamin (B, C, and D), minerals and water content
(Royse and Schisler 1980 & Mattila et al 2001). Also,
they are low in calories, salt, fat and are devoid of sugar, starch and cholesterol, which make them an
ideal nutritional and diet supplement. Medicinal
mushrooms have become important due to their
antitumor, antifungal, and reducing hyper
cholesterolemia activities (Chang and Buswell 1996).
Apart from its food nutritional and medicine value,
mushroom growing can be efficient means of waste
disposal especially agriculture waste such as paddy
straw, hay etc. (Mandeel 2005).
At present 3 varieties of mushrooms are
being cultivated in India. These are white mushroom (Agaricus bisporus), the paddy-straw mushroom
(Volvariella volvacea) and the oyster mushroom
(Pleurotus sajor-caju). Mushrooms are highly
perishable due to their high moisture content.
Amongst the various methods employed for
preservation, drying is an energy-intensive operation
in which the water activity of the food is reduced by
removal of the water. Drying is a method of
preservation in which the water activity of the food is
reduced.Traditionally mushrooms are dried under
open sun, which results in unhygienic and poor
quality products. (Chua et al 2001). The other drying
methods are mechanical viz. thin layer drying and
multi layer drying. Drying in thin layers is expensive
and wastes more energy and small amounts of product are dried. In multilayer drying, more quantity of
product can be dried and air can be utilized properly
resulting in energy saving.
Use of Microwave is considered as the fourth
generation drying technology. Waves can penetrate
directly into the material, heating is volumetric (from
inside out) and provides fast and uniform heating
throughout the entire product.The quick energy
absorption by water molecules causes rapid water
evaporation, creating an outward flux of rapidly
escaping vapour. Microwaves penetrate the food from all direction. This facilitates steam escape and speed
heating. In addition to improving the drying rate, this
outward flux can help to prevent the shrinkage of
tissue structure, which prevails in most conventional
air drying techniques. Hence better rehydration
characteristics may be expected in microwave dried
products (Khraisheh et al 1997; Prabhanjan 1995).
Microwave processes offer a lot of advantages such as
less start up time, faster heating, energy efficiency
(most of the electromagnetic energy is converted to
heat), space savings, precise process control and food product with better nutritional quality.
Mohanta et al (2011) dehydrated ginger
(Zingiber Officinale, Cv. Suprava) slices (4 mm thick)
at 25°, 40°, 50° and 60 °C at three different
microwave power levels, viz. 120, 240, and 360 W in
microwave assisted convective dryer up to 0.07 g
moisture/g dry solid. The final product quality was
RESEARCH ARTICLE OPEN ACCESS

Shakti Bansal et al. Int. Journal of Engineering Research and Applications www.ijera.com
Vol. 3, Issue 5, Sep-Oct 2013, pp.206-217
www.ijera.com 207 | P a g e
better in terms of rehydration characteristics,
oleoresin and volatile oil contents, hardness, color and
organoleptic quality. Sahoo and Mohanty (2012) dried
onion slices in microwave assisted convective dryer at
180, 360, 540 and 720 W microwave power levels
and drying air temperatures of 50, 55, and 60°C. Drying at 360 W power level and 50°C drying air
temperature provided considerable saving in drying
time. Keeping in view the above aspects, the present
study has been planned to study the effect of
convective-cum-microwave drying on the quality of
mushroom and to optimize the convective-cum-
microwave drying characteristics viz. loading density,
air velocity, microwave power.
II. MATERIAL AND METHODS Experimental design and Statistical Analysis
Response Surface Methodology was used to optimize
the multi-layer cum convective drying conditions for
good quality dried product. The second order Box-
Behnken design was used to work out the range of
independent process variables and their levels for
dried mushroom (Table 1). After coding the
experimental region extended from -1 to +1 in term of
Xi, the three level three factor experimental plans
according to Box-Behnken design (1960) consist of
17 points of treatments combinations of the
independent variables (Table 2). For each experiment,
the known weight of dried mushroom was formulated as per experimental combinations by varying loading
density (kg/m2), air velocity (m/sec) and power level
(Watt) and quality attributes viz. rehydration ratio,
shrinkage ratio, texture, colour and overall
acceptability were measured by standard
procedures.The analysis was done independently
for each response variable with the help of
response surface methodology (RSM) by using a
commercial statistical package, 'Design Expert
DX 8.0.4 (Statease Inc., Minneapolis, USA, Trial
Version 2010). The regression coefficients were
estimated through least square method. The adequacy of the fitted model was tested through
the analysis of variance showing lack of fit and
coefficient of correlation (R2). For each responses
variables, N (17) observations were obtained.
Table 1: Independent process variables and their levels for mushroom
Independent variables Symbol Levels
-1 0 +1
Loading Density (kg/m2) X1 26 39 52
Air Velocity (m/sec) X2 3 4 5
Power level (Watt) X3 270 540 810
Table 2: Experimental structure with coded and actual levels of the process variables for the dried
mushroom using Box-Behnken design
Experiment/
sample no.
Loading density
(X1)
Air velocity
(X2)
Power level
(X3)
Actual Coded Actual Coded Actual Coded
1 39 0 4 0 540 0
2 39 0 3 -1 810 1
3 39 0 4 0 540 0
4 26 -1 4 0 810 1
5 39 0 5 1 810 1
6 52 1 4 0 810 1
7 52 1 4 0 270 -1
8 52 -1 3 -1 540 0 9 39 0 4 0 540 0
10 52 1 5 1 540 0
11 39 0 4 0 540 0
12 39 0 5 1 270 -1
13 39 0 4 0 540 0
14 26 -1 3 -1 540 0
15 26 -1 5 1 540 0
16 26 -1 4 0 270 -1
17 39 0 3 -1 270 -1
Experimental Procedure
2.1 Experimental setup
The experimental set-up for multi layer
drying of mushroom comprised of an experimental
dryer (Make-SATAKE) with electrically heated hot
air system capable of supplying air upto a
temperature of 70°C. A centrifugal blower capable of
delivering air velocity upto 5.4 m/s was fitted in the
dryer. The blower was powered with 0.75 kW, 1410
rpm, 3 phase, 230-Volt electric motor with a direct

Shakti Bansal et al. Int. Journal of Engineering Research and Applications www.ijera.com
Vol. 3, Issue 5, Sep-Oct 2013, pp.206-217
www.ijera.com 208 | P a g e
online starter. The hot air was sucked by the blower
through the heaters and was thrown into the drying
chamber. These chambers had a screen at the bottom
with approximate 1 mm hole diameter. The dryer was
started half hour before actual drying experiment to
achieve steady state conditions. The mushroom was put into the drying boxes according to the desired
loading density to get the required bed depth. The
drying was carried out at 60°C. The sample was dried
to a moisture content of 27% wb (36.90 % db) in the
multi layer drying and thereafter the sample was
shifted to microwave oven for removal of remaining
moisture final moisture content ie.6.89 % wb (7.40 %
db). The experimental setup for microwave drying of
mushroom comprised of a household microwave
operating at 2450MHz and capable of running at
different power levels viz. 270, 540, 810, 1080, 1350
W at 20%, 40%, 60%, 80% and 100% respectively. Microwave heats food by bombarding it with
electromagnetic radiation in the microwave spectrum
causing polarized molecules in the food to rotate and
build up thermal energy in a process known as
dielectric heating. The samples were allowed to come
to room temperature, packed and stored. Three
replications were taken for each experiment to get an
average values.
2.2 Preparation of samples
Fresh oyster mushroom was procured from local market in Ludhiana and brought to the Food
Engineering laboratory of the department. The oyster
mushroom was cut manually and the colour and
moisture content of fresh mushroom was noted.
Mushroom was pretreated with citric acid @40 gm/lit
(Brennan and Gormely 2000). The solution was
drained out. The samples were then soaked with a
filter paper and thereafter subjected to drying run
according to required loading densities.
2.3 Determination of Quality Parameters
The quality parameters that were analysed were rehydration ratio, shrinkage ratio, texture,
colour and overall acceptability.
2.3.1 Rehydration ratio:-Rehydration ratio was
evaluated by soaking known weight (5-10 g) of each
sample in sufficient volume of water in a glass beaker
(approximately 30 times the weight of sample) at
95°C for 20 minutes. After soaking, the excess water
was removed with the help of filter paper and
samples were weighed. In order to minimize the
leaching losses, water bath was used for maintaining the defined temperature (Ranganna 1986).
Rehydration ratio (RR) of the samples was computed
as follows:
Rehydration ratio, W
W RR
d
r
Where,
Wr = Drained weight of rehydrated sample
in grams; Wd = Weight of dried sample used for
rehydration in grams
2.3.2 Shrinkage ratio:- The shrinkage ratio of
dried sample was measured by toluene displacement method. Shrinkage ratio was calculated as the
percentage change from the initial apparent volume
(Rangana 1986).
Shrinkage ratio =
0V
Vr
Where, Vr= Volume displaced by rehydrated sample;
V0 = Volume displaced by fresh sample, ml
2.3.3 Texture:-Texture (hardness and chewiness)
of the dehydrated samples was determined with the
help of Texture Analyzer TA-Hdi. The samples were
compressed by spherical probe. The pre-test speed
was set at 1.5 mm/s, post test speed was set at 10
mm/s whereas; test speed of 2 mm/s was set during compression. The height of the peak during
compression cycle was defined as hardness and
chewiness (g).
2.3.4 Colour:- Colour is one of the important
parameters, which is an indicative of the commercial
value of the product. The basic purpose was to get an
idea of the comparative change in colour of fresh,
dried and rehydrated material. Colour was
determined using Hunter Lab Miniscan XE Plus
Colorimeter (Hunter 1975).
Colour change ΔE =
Where ΔL, Δa and Δb are deviations from L, a and b
values of fresh sample.
ΔL = L dried sample – L fresh sample; + ΔL means
sample is lighter than fresh, - ΔL means sample is
darker than fresh.
Δa = a dried sample- a fresh sample, + Δa means
sample is redder than standard, - Δa means sample is greener than standard
Δb = b dried sample –b fresh sample, + Δb means
sample is yellower than standard, - Δb means sample
is bluer than standard
III RESULTS AND DISCUSSION
The response and contour plots were
generated for different interaction of three
independent variables, keeping the value of other variables constant. Such a three dimensional surfaces
could give accurate geometrical representation and
provide useful information about the behaviour of the
system within the experimental design. The complete
experimental results for convective -cum- microwave
drying of mushroom have been presented in Table 3.
3.1 Rehydration ratio
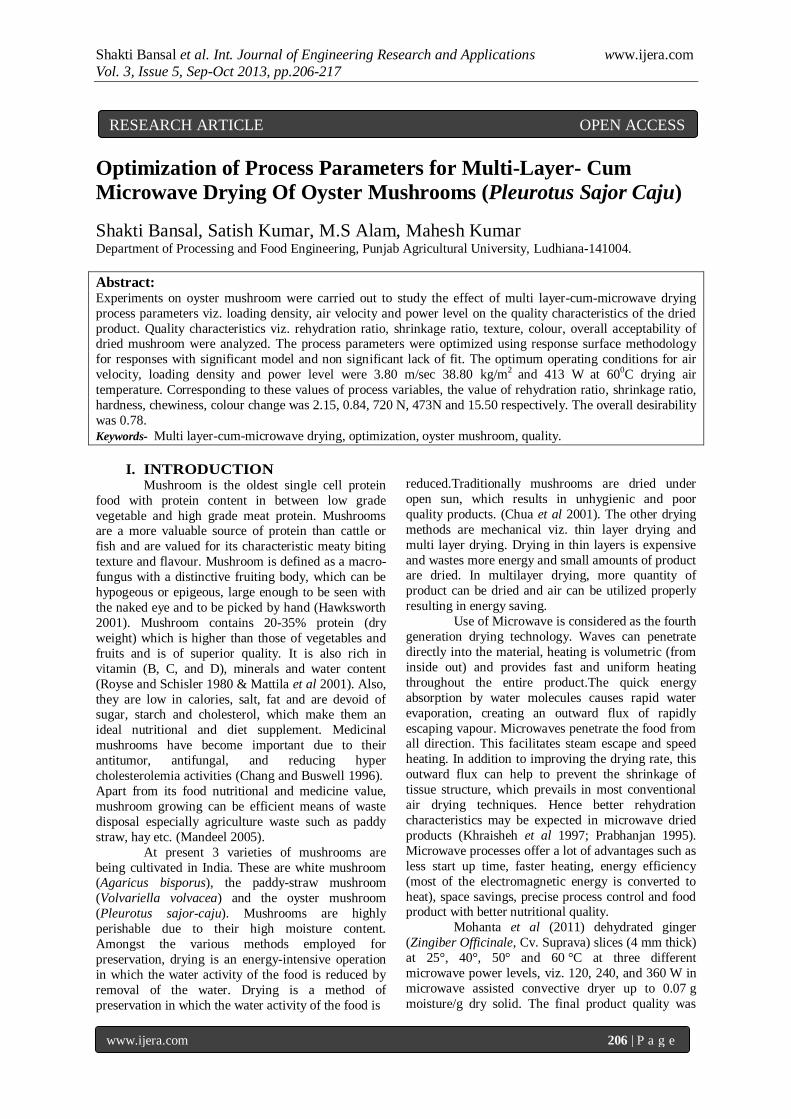
The rehydration ratio of dried mushroom
varied in the range of 1.40 to 2.40 with an average
value of 1.9. The maximum rehydration ratio (2.40)

Shakti Bansal et al. Int. Journal of Engineering Research and Applications www.ijera.com
Vol. 3, Issue 5, Sep-Oct 2013, pp.206-217
www.ijera.com 209 | P a g e
was found at 39 kg/m² loading density, 4
m/s air velocity and 540 W power level; while
minimum rehydration ratio (1.40) was found for 26
kg/m² loading density, 4 m/s air velocity and 270 W
power level. RR increased with increase in both
loading density and air velocity in multi layer drying
(Fig 1) and increased with increase in both power
level and loading density in microwave drying (Fig
2). The results corroborated from the Analysis of
Variance (ANOVA) showed that the quadratic terms
of LD (p value: 0.0292) & PL (p value: 0.0046) are
significant at 5% level of significance.
Table 3 Experimental data of drying of oyster mushroom for response surface analysis by convective-
cum-microwave drying
Loading
Density
(kg/m²)
Air
Velocity
(m/s)
Power
(W)
RR SR Texture (N) Color
OA
Hardness Chewiness
26 3 540 2.00 0.89 1675 1749 18.19 70.37
26 4 270 1.40 0.81 1180 552 18.76 70.15
26 4 810 1.80 0.75 1777 1386 21.90 66.66
26 5 540 2.10 0.82 2666 764 20.26 77.77
39 3 270 2.10 0.75 857 744 15.74 62.96
39 3 810 2.00 0.83 2376 1904 19.50 55.55
39 4 540 2.40 0.96 800 473 15.00 68.05
39 4 540 2.20 0.79 879 513 15.80 77.77
39 4 540 2.28 0.86 946 653 16.40 77.77
39 4 540 2.28 0.90 780 489 14.20 76.34
39 4 540 2.10 0.90 1485 847 17.00 76.38
39 5 270 1.70 0.75 850 508 17.87 48.15
39 5 810 2.00 0.87 2930 1323 18.76 48.15
52 3 540 2.00 0.98 1080 580 22.98 68.96
52 4 270 1.80 0.75 720 596 17.84 56.25
52 4 810 2.00 1.00 1308 1082 18.57 81.48
52 5 540 2.10 1.00 1114 1025 14.89 62.96
Table 4: Analysis of variance (ANOVA) for
model fitting
Fitting of model on
Df
Sum of Squares
Mean sum of squares
F Value
p-value
(Prob > F)
Rehydration Ratio 9 0.76 0.085 3.73 0.0483
Shrinkage ratio 9 0.11 0.012 4.66 0.0273
Hardness 9
6.351E+006
7.057E+005 3.86 0.0444
Chewiness 9
3.056E+006
3.396E+005 11.16 0.0022
Colour 9 81.69 9.08 4.69 0.0269
Overall acceptability 9 1415.46 157.27 4.03 0.0397
Shakti Bansal et al. Int. Journal of Engineering Research and Applications www.ijera.com
Vol. 3, Issue 5, Sep-Oct 2013, pp.206-217
www.ijera.com 210 | P a g e
26.00 32.50 39.00 45.50 52.00
3.00
3.50
4.00
4.50
5.00RR
A: Loading Density
B:
A
ir
V
elo
cit
y
2 2.1 2.2 2.25
3.00
3.50
4.00
4.50
5.00
26.00
32.50
39.00
45.50
52.00
1.9
2
2.1
2.2
2.3
2.4
RR
A: Loading Density B: Air Velocity
Fig 1: Contour and response surface plots
showing effect of loading density and air velocity
on RR
26.00 32.50 39.00 45.50 52.00
270.00
360.00
450.00
540.00
630.00
720.00
810.00RR
A: Loading Density
C:
P
ow
er
L
ev
el
1.6
1.8
1.8
2
2
2.2
5
270.00 360.00
450.00 540.00
630.00 720.00
810.00
26.00
32.50
39.00
45.50
52.00
1.2
1.4
1.6
1.8
2
2.2
2.4
RR
A: Loading Density C: Power Level
Fig 2: Contour and response surface plots
showing effect of loading density and microwave
power level on RR
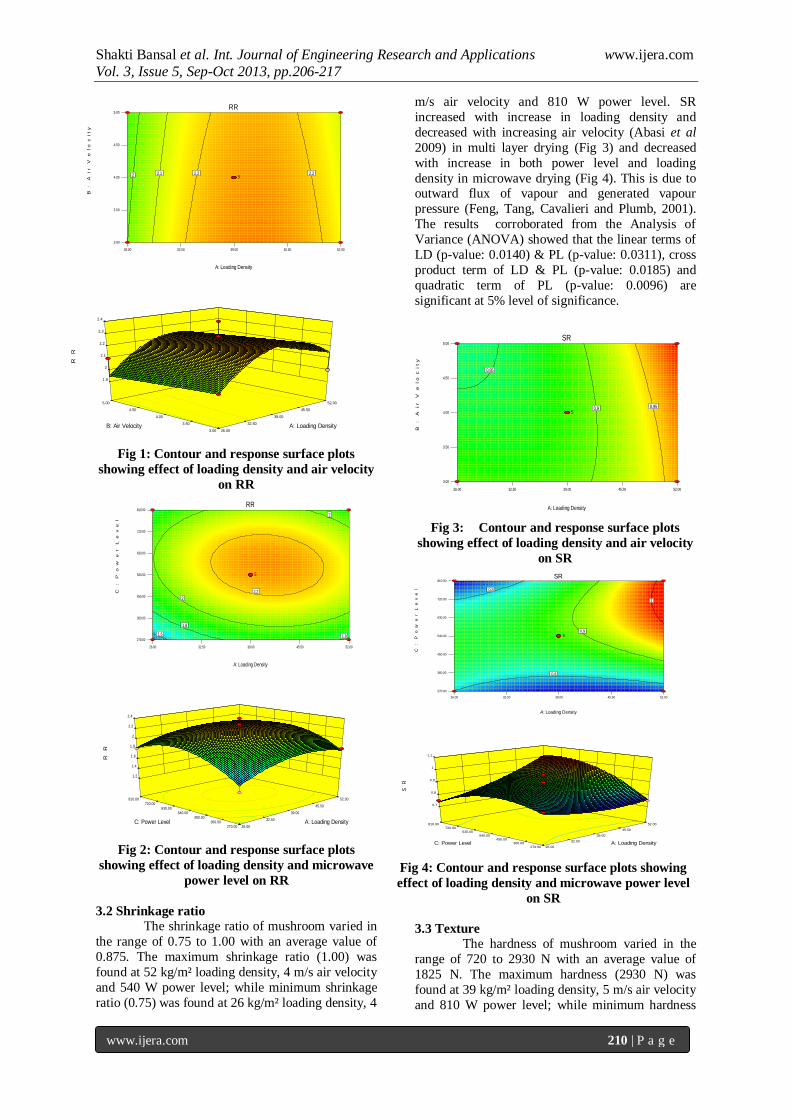
3.2 Shrinkage ratio
The shrinkage ratio of mushroom varied in
the range of 0.75 to 1.00 with an average value of
0.875. The maximum shrinkage ratio (1.00) was
found at 52 kg/m² loading density, 4 m/s air velocity
and 540 W power level; while minimum shrinkage
ratio (0.75) was found at 26 kg/m² loading density, 4
m/s air velocity and 810 W power level. SR
increased with increase in loading density and
decreased with increasing air velocity (Abasi et al
2009) in multi layer drying (Fig 3) and decreased
with increase in both power level and loading
density in microwave drying (Fig 4). This is due to outward flux of vapour and generated vapour
pressure (Feng, Tang, Cavalieri and Plumb, 2001).
The results corroborated from the Analysis of
Variance (ANOVA) showed that the linear terms of
LD (p-value: 0.0140) & PL (p-value: 0.0311), cross
product term of LD & PL (p-value: 0.0185) and
quadratic term of PL (p-value: 0.0096) are
significant at 5% level of significance.
Fig 3: Contour and response surface plots
showing effect of loading density and air velocity
on SR
26.00 32.50 39.00 45.50 52.00
270.00
360.00
450.00
540.00
630.00
720.00
810.00SR
A: Loading Density
C:
P
ow
er
L
ev
el
0.8
0.8
0.9
1
5
270.00 360.00
450.00 540.00
630.00 720.00
810.00
26.00
32.50
39.00
45.50
52.00
0.7
0.8
0.9
1
1.1
SR
A: Loading Density C: Power Level
Fig 4: Contour and response surface plots showing
effect of loading density and microwave power level
on SR
3.3 Texture
The hardness of mushroom varied in the
range of 720 to 2930 N with an average value of
1825 N. The maximum hardness (2930 N) was
found at 39 kg/m² loading density, 5 m/s air velocity
and 810 W power level; while minimum hardness
26.00 32.50 39.00 45.50 52.00
3.00
3.50
4.00
4.50
5.00SR
A: Loading Density
B:
A
ir
V
elo
cit
y
0.85
0.9 0.955

Shakti Bansal et al. Int. Journal of Engineering Research and Applications www.ijera.com
Vol. 3, Issue 5, Sep-Oct 2013, pp.206-217
www.ijera.com 211 | P a g e
(720 N) was found at 52 kg/m² loading density, 4
m/s air velocity and 270 W power level. In multi
layer drying, hardness decreased with increasing
loading density and increased with increasing air
velocity (Fig 5). In microwave drying, hardness
decreased with increase in loading density and increased with increase in power level (Fig 6). The
results corroborated from the Analysis of Variance
(ANOVA) showed that linear terms of LD (p-value:
0.0385) & PL (p-value: 0.0055) and quadratic term
of AV (p-value: 0.0269) are significant at 5% level
of significance.
26.00 32.50 39.00 45.50 52.00
3.00
3.50
4.00
4.50
5.00texture
A: Loading Density
B:
A
ir
V
elo
cit
y
1000
1500
1500
2000
5
3.00
3.50
4.00
4.50
5.00
26.00
32.50
39.00
45.50
52.00
500
1000
1500
2000
2500
3000
te
xt
ur
e
A: Loading Density B: Air Velocity
Fig 5: Contour and response surface plots
showing effect of loading density and air velocity
on texture (hardness)
26.00 32.50 39.00 45.50 52.00
270.00
360.00
450.00
540.00
630.00
720.00
810.00texture
A: Loading Density
C:
P
ow
er
L
ev
el
500
1000
1500
2000
5
270.00 360.00
450.00 540.00
630.00 720.00
810.00
26.00
32.50
39.00
45.50
52.00
0
500
1000
1500
2000
2500
te
xt
ur
e
A: Loading Density C: Power Level
Fig 6: Contour and response surface plots
showing effect of loading density and microwave
power level on texture (hardness)
The chewiness of mushroom varied in the
range of 473 to 1904 N with an average value of 1188 N. The maximum chewiness (1904 N) was
found at 39 kg/m² loading density, 3 m/s air velocity
and 810 W power level; while minimum chewiness
(473 N) was found at 39 kg/m² loading density, 4
m/s air velocity and 540 W power level. In multi
layer drying, chewiness decreased with increase in
both loading density and air velocity (Fig 7). In
microwave drying, chewiness increased with
increase in both loading density and power level
(Kotaliwale et al 2007) (Fig 8). The results
corroborated from the Analysis of Variance
(ANOVA) showed that linear term of LD (p-value: 0.0499), AV (p-value: 0.0337) & PL (p-value:
0.0003), cross product term of LD & AV (p-value:
0.0037) and quadratic term of AV (p-value: 0.0052)
are significant at 5% level of significance.
3.00
3.50
4.00
4.50
5.00
26.00
32.50
39.00
45.50
52.00
400
600
800
1000
1200
1400
1600
1800
ch
ew
in
es
s
A: Loading Density B: Air Velocity
26.00 32.50 39.00 45.50 52.00
3.00
3.50
4.00
4.50
5.00chewiness
A: Loading Density
B:
A
ir
Ve
loc
it
y
600
800
800
1000
1000
1200
1400
1600
5
Fig 7: Contour and response surface plots
showing effect of loading density and air velocity
on chewiness
270.00 360.00
450.00 540.00
630.00 720.00
810.00
26.00
32.50
39.00
45.50
52.00
200
400
600
800
1000
1200
1400
1600
c
he
win
es
s
A: Loading Density C: Power Level
FFig 8: Contour and response surface plots showing
effect of loading density and microwave power level on
chewiness
3.4 Colour

Shakti Bansal et al. Int. Journal of Engineering Research and Applications www.ijera.com
Vol. 3, Issue 5, Sep-Oct 2013, pp.206-217
www.ijera.com 212 | P a g e
The colour change of mushroom varied in the
range of 14.20 to 22.98 with an average value of
19.00. The maximum colour change (22.98) was
found at 52 kg/m² loading density, 3 m/s air velocity
and 540 W power level; while minimum colour
change (14.2) was found at 39 kg/m² loading density, 4 m/s air velocity and 540 W power level. Colour
change increased with increase in both loading density
and air velocity in multi layer drying (Fig 9). Both
these results are in agreement with (Chauca et al 2002)
who have reported color changes of banana during
drying in terms of ‘L’ and ‘a’ values. Colour change
decreased with increasing loading density and
increased with increase in power level in microwave
drying (Fig 10) (Maskan, 2001). The results
corroborated from the Analysis of Variance (ANOVA)
showed that the cross product term of LD & AV (p-
value: 0.0082) and quadratic term of LD (p-value: 0.0104) are significant at 5% level of significance.
3.00
3.50
4.00
4.50
5.00
26.00
32.50
39.00
45.50
52.00
14
16
18
20
22
24
co
lo
ur
c
ha
ng
e
A: Loading Density B: Air Velocity
26.00 32.50 39.00 45.50 52.00
3.00
3.50
4.00
4.50
5.00colour change
A: Loading Density
B:
A
ir
V
elo
cit
y
16
17
17
18
18
19
19
20
20
21
21
5
Fig 9: Contour and response surface plots
showing effect of loading density and air velocity
on colour change
26.00 32.50 39.00 45.50 52.00
270.00
360.00
450.00
540.00
630.00
720.00
810.00colour change
A: Loading Density
C:
P
ow
er
L
ev
el
16
17
18
18
18
19
20
5
Fig 10: Contour and response surface plots
showing effect of loading density and microwave
power level on colour change
3.5 Overall acceptability
The overall acceptability of mushroom slices varied
in the range of 48.15 to 81.48 with an average value
of 64.81. The maximum overall acceptability (81.48) was found at 52 kg/m² loading density, 4
m/s air velocity and 810 Watt level; while minimum
overall acceptability (48.15) was found at 39 kg/m²
loading density, 5 m/s air velocity and 810 Watt
level. OA decreased with increase in loading density
and increased with increase in air velocity in multi
layer drying (Fig 11). OA decreased with increase in
both power level and loading density in microwave
drying (Fig.12). The results corroborated from the
Analysis of Variance (ANOVA) showed that the
quadratic terms of AV (p-value: 0.0109) and PL (p-
value: 0.0082) are significant at 5% level of significance.
26.00 32.50 39.00 45.50 52.00
3.00
3.50
4.00
4.50
5.00OA
A: Loading Density
B:
A
ir
V
elo
cit
y
65
70
70
75
75
805
270.00 360.00
450.00 540.00
630.00 720.00
810.00
26.00
32.50
39.00
45.50
52.00
14
16
18
20
22
co
lo
ur
c
ha
ng
e
A: Loading Density C: Power Level

Shakti Bansal et al. Int. Journal of Engineering Research and Applications www.ijera.com
Vol. 3, Issue 5, Sep-Oct 2013, pp.206-217
www.ijera.com 213 | P a g e
3.00
3.50
4.00
4.50
5.00
26.00
32.50
39.00
45.50
52.00
60
65
70
75
80
85
OA
A: Loading Density B: Air Velocity
Fig 11: Contour and response surface plots
showing effect of loading density and air velocity
on overall acceptability
270.00 360.00
450.00 540.00
630.00 720.00
810.00
26.00
32.50
39.00
45.50
52.00
55
60
65
70
75
80
85
OA
A: Loading Density C: Power Level
Fig 12: Contour and response surface plots
showing effect of loading density and microwave
power
level
26.00 32.50 39.00 45.50 52.00
270.00
360.00
450.00
540.00
630.00
720.00
810.00OA
A: Loading Density
C:
P
ow
er
L
ev
el
60
65
70
70
75
75
80
5
on overall acceptability
3.6 Optimization of Convective-cum-microwave
drying of mushroom
The optimum values of process
parameters and responses are presented in Table 6.
The process conditions for multi layer drying of
mushroom were optimized using numerical optimization technique. The main criteria for
constraints optimization were maximum possible
rehydration ratio, hardness and overall acceptability
and minimum possible shrinkage ratio, color change
(Themelin et al 1997; Ade-Omowaye et al 2002).
The contour plots for each response were generated
for different interaction of any two independent
variables. In order to optimize the process
conditions for multi layer drying of mushroom by
numerical optimization technique, equal importance
of ‘3’ was given to three process parameters (viz.
loading density, air velocity and microwave power level ) and responses (i.e. rehydration ratio,
shrinkage ratio, color, hardness, chewiness and
overall acceptability). The conditions were
experimentally verified with deviation of +0.10%.
The optimum operating conditions for loading
density, air velocity and microwave power level was
38.80 kg/m2 and 3.86 m/sec at 600C and 413.6 W
power level. Corresponding to these values of
process variables, the value of rehydration ratio,
shrinkage ratio, texture (hardness and chewiness),
colour change and overall acceptability were 2.15, 0.84, 739 N, 473 N, 15.50 and 72.50 respectively.
The overall desirability was 0.78.

Shakti Bansal et al. Int. Journal of Engineering Research and Applications www.ijera.com
Vol. 3, Issue 5, Sep-Oct 2013, pp.206-217
www.ijera.com 214 | P a g e
Table 6: Optimum values of process parameters and responses
Process parameters Goal Lower limit Upper limit Importance Optimization level
A: Loading Density (kg/m²) in range 26 52 3 38.80
B: Air Velocity (m/s) in range 3 5 3 3.86
C: Power level (W) in range 270 810 3 413
Responses predicted value
Rehydration ratio Maximize 1.40 2.40 3 2.15
Shrinkage ratio Minimize 0.75 1.00 3 0.84
Hardness Minimize 720 2930 3 739
Chewiness in range 473 1904 3 473
Colour change (E) Minimize 14.20 22.98 3 15.50
Overall acceptability Maximize 48.15 81.48 3 72.50

Shakti Bansal et al. Int. Journal of Engineering Research and Applications www.ijera.com
Vol. 3, Issue 5, Sep-Oct 2013, pp.206-217
www.ijera.com 215 | P a g e
3.00 3.50 4.00 4.50 5.00
26.00
32.50
39.00
45.50
52.00
Overlay Plot
B: Air Velocity (m/sec)
A:
Lo
ad
ing
De
ns
ity
(k
g/m
2)
SR: 0.890
RR: 2.000
RR: 2.000
RR: 2.160
texture: 720.000
texture: 750.000
colour change: 19.000
colour change: 19.000
OA: 70.000
OA: 70.000
OA: 81.480
chewiness: 472.650
chewiness: 1100.000
Fig 13: Superimposed contour plot of different responses for optimization of convective cum microwave dehydration of mushroom.

Shakti Bansal et al. Int. Journal of Engineering Research and Applications www.ijera.com
Vol. 3, Issue 5, Sep-Oct 2013, pp.206-217
www.ijera.com 216 | P a g e
270.00 360.00 450.00 540.00 630.00 720.00 810.00
26.00
32.50
39.00
45.50
52.00
Overlay Plot
C: Power Level (W)
A:
Lo
ad
ing
De
ns
ity
(k
g/m
2)
SR: 0.780
SR: 0.780 SR: 0.890
RR: 2.100
RR: 2.160
texture: 720.000
texture: 900.000
colour change: 20.000
OA: 70.000
OA: 70.000
OA: 81.480
chewiness: 472.650
chewiness: 1200.000
Fig 14: Superimposed contour plot of different responses for optimization of convective cum microwave dehydration of mushroom

Shakti Bansal et al. Int. Journal of Engineering Research and Applications www.ijera.com
Vol. 3, Issue 5, Sep-Oct 2013, pp.206-217
www.ijera.com 217 | P a g e
References [1] Abasi S, Mousavi S M, Mohebi M and Kiani
S (2009) Effect of time and temperature on
moisture content, shrinkage and rehydration of dried onion. Iranian J chem Engg 6(3).
[2] Ade O, Rastogi N K, Angersbach A and
Knorr D (2002) Osmotic dehydration
behavior of red paprika (Capsicum annum
L.) J Fd Sci 67: 1790-96.
[3] Brennan M H and Gormely (2000)
Extending the shelf life of fresh sliced
mushrooms. J Sci Fd Agric 26: 401-11.
[4] Chang S T and Buswell J A (1996)
Mushroom nutraceuticals. W Microbiol
Biotechnol 12: 473-76. [5] Chauca C, M., Ramos, A M and Stringheta,
P. C. (2002). Color and texture change
during banana drying (Musa spp.
nanica).Allimentaria, 337:153–58.
[6] Chua K J, Mujumdar A S, Hawlader M N A,
Chou S K and Ho J C (2001) Batch drying
of banana pieces -effect of stepwise change
in drying air temperature on drying kinetics
and product colour. Fd Res Int 34: 721-31.
[7] Erle U (2005) Drying using microwave
processing. In: The microwave processing of
foods. Schubert H, Regier M (ed), Woodhead Publication, Cambridge,
England. Pp:142–52.
[8] Hawksworth D L (2001) Mushrooms: the
extent of the unexplored potential. Int J
Med. Mush 3: 333-37.
[9] Hunter S (1975) The measurement of
appearance. Pp: 304-05, John Wiley and Sons.
New York.
[10] Khraisheh M A M, Cooper T J R and Magee
T R A (1997) Shrinkage characteristic of
potatoes dehydrated under combined microwave and convective air conditions.
Drying Technol Int 15: 1003-22.
[11] Kotwaliwale N, Bakane P and Verma A
(2007) Changes in textural and optical
properties of oyster mushroom during hot air
drying. J Fd Engg 78(4):1207-11.
[12] Mandeel Q A ,Al-Laith A A and Mohamed
S A (2005) Cultivation of oyster mushrooms
(Pleurotus spp.) on various lignocellulosic
wastes World J Microbiol Biotechnol 21:
601–07.
[13] Maskan M (2001) Kinetics color change of kiwifruits during hot air and microwave
drying. J Fd Engg 48:169-75.
[14] Mohanta B, Dash S K, Panda M K, Sahoo G
R (2011) Standardization of process
parameters for microwave assisted
convective dehydration of ginger. J Fd Sci
Technol. Print ISSN 0022-1155.
[15] Prabhanjan D G Ramaswamy H S and
Raghavan, G S V (1995) Microwave-
assisted convective air drying of thin layer
carrots. J Fd Engg 25: 283-93.
[16] Ranganna S (1986) Handbook of analysis
and quality control for fruits and vegetable
products. 2nd
edition, pp 171-74. Tata
McGraw Hill publishing company Ltd. New Delhi, India.
[17] Royce D J and Schisler L C (1980)
Mushrooms: Consumption, production and
cultivation. Interdiscip Sci Rev 5:324-31.
[18] Sahoo N R and Mohanty S N (2011)
Microwave Assisted Convective Drying of
Onion (Allium cepa L.) J Agric Sci (RJAS)
SSN: 0976-1675.
[19] Themelin A, Raoult WA L, Lebert A and
Danzart M (1997) Multicriteria optimization
of food processing combining soaking prior
to air drying. Drying Technol 15: 2263-79.