optimization of moderll irrigation for biosaline agriculture
TRANSCRIPT

Arab Gulf l ournal of Scientific Research 25 ( 112) 59- 66 (2007)
Technicnal Paper Ref No 2430
Optimization of Moderll Irrigation for Biosaline Agriculture
4_~~t ~tJjU 4~~bJt 4iyt ~ VwJ
Shabbir Ahmed Shahid I and Bassam Hasbini 2
i 0lgt JIluuo lltJgt1 ~~ i I ~
I Salinity Management Scientist
2 Irrigation Manag ement Scientist
International Center for Biosaline Agriculture P O Box 14660
Dubai United Arab Emirates
ABSTRACT Supplemental irrigation water is a must to offset the water requirement to produce profitable crops in most arid and semiarid zones where fresh water resources are insufficient to meet the pressure of irrigated agriculture This necessitates the use of poor quality water resources These waters if not properly managed and used can cause serious soil related problems (salinity sodicity destruction of soil structure) in addition to decline in crop yields Biosaline agriculture (using saline water on saline soils to grow salt-tolerant crops) becomes the only option for the farmer when both soil and water resources are saline and the water resource is scarce In this regards key design considerations must be taken into account when irrigating with salty waters to optimize water uses and to reduce subsequent soil salinity development Sprinkler irrigation systems are commonly used in irrigation of large-scale agricultural production systems However they tend to concentrate salts on the leaves of plants For this reason discharge and degree of overlap between consecutive sprinkler heads are key design parameters when applying salty waters Trickle irrigation is the most efficient system and is gaining importance in the GCC countries in agriculture and landscape irrigation The objective of this study was to optimize modern irrigation systems through development of design standards for drip (emitters spacing) and sprinkler irrigation systems (single head jet and overlapping) by applying saline water The effect of emitter spacing (drip) and overlapping (sprinkler) were tested for the formation of salt contours in soil The leaching ratio (LR) is the overall soil salinity within the rhizosphere divided by the average irrigation water salinity In this study LR is used to evaluate the effectiveness of irrigation systems in developing soil salinity From the present investigations it is concluded that when using saline water for irrigation the soil salinity development can be significantly reduced by decreasing emitter spacing ie an ECe of 26 90 and 126 dSm was developed with 25 50 and 75 cm emitter spacing respectively Microsprinklers are more effective in terms of leaching capability as compared to impact sprinklers Overlapping in sprinkler irrigation reduced the evaporation compared with single jet where no overlapping was made This has a direct effect on soil salinity development Wind has a significant effect on the water distribution (sprinkler experiment) and subsequent salinity development and can cause long-term salinity problems Windbreak can offer solutions to this effect Keywords Optimization biosaline agriculture trickle sprinkler leaching ratio
JblLJI F~~~I ~bAll ltt~ ~WI w~lojl ~I~ ~)j~~1 ~JI ~~~ Ialgtj~t
u~jllgt-~I ~ ill~~J ~~I 41)jJlb~ ~dJuJ1 ~~I )J9- ~L5 rl----- dbLJ1 ~j4bLJ1
~J5L~~ul ~ ~Js Ls))j ~I~I ~ ~ I~j awGA ~yl~~~ ))JA~ )~jl
41)jJl ~ 4JbJl ~u~j ~bAll ~t ~~I~ ~L~4 (~-JI ~ J+4Jjj ~)~I ~~I) ~~
lA~ ~JjgtlJ [WI ~yl )LpJ1 (~ykU 4jA ~b ltt~ d=JlA -- ~ d=JlA ~~ r1~1 ~I) ~I
59
60 Oplimization oj Modern Trrigalion jor BiosaLine Agriculture
J~~I ~G)U eJjrLl~~1 lt9j~1 JA~j~ ~WI l)~lj~LAWI l)J-j~JIlgt-)5 0~ bull bull 1L rmiddotlI ~I - - 4-1 ~ )l~1 ~(I - q~ 1 Icl WI I~I [- 1 ~I w)lL shyu--1JJ ~j r--l -jJJ- ~j - r ~tfJ lt bull ~
JIJjl ~ r)l~1 ~jJ)~ ~ ~~I JA 0 1~~ ~I eA ~1Jjl1 rt~1 ~I tfJ ~ LAI~I S~I ~~I
~ d4J1 wIJ~~Ilgt-Jf-U ~bJ1 wLL~1 l)jjJ ~ ~1cJ1 ~Jlj ~~I ~ 0~ ~I I~j wl~1 LA~I ~j e~L1S ~~I sllgt- ~L tf~I ~1~ s-p- I ~ lgt-j ~WI WI rl~1 ~~I
~J~I )1 d1Ju1 JA ~lAgtj 4JIJQ~~1 jl ~t~1 ddJjl1 ~ ~I~ ~I 0jlJ1 ~ Jjl ~ 1-cgt1~ ~ - - shy
~L tfr l rlbiJ 4J OJ 0 o ~L jJfo J)Glgt- ~WI WI rl~1 ~ JA ~J=II tf~1 ~ J~I ~I
d1~I~l)LD1 ~j (wLL~Ilrgt ~1cJ1 ~Jlj4ugt-ltJ1 ~Gej9) ~~Ltf~1 rlbj (w~llrgt wll~I)
~JI dk)l J)Glgt- (~~L tf~1 dJb- ~) wLL~Ilrgt ~1cJ1 ~Jlj (~L tf~1 dJb- ~) w~llrgt
d~Jj~1 d4hL~ aJ1 ~yoJLvl ~j (LR) ~I~rl~1 ~j aJ1 ~ djF-J1 tfJSUSJI ~I
ltGI )~ d1Ju1 ~uiJj aJ1 ~yo ~~ ~ tf~1 rh 4 w ~ d~1 tf~1 ~~yo cby ~ lrgtwll~1 J=l4iJgt--rb~ eA~Jlr)l~1 ~1jJlgt-J=I ~ltG~~Ltf~I~~W WI r~1 ~
7550 25w~llrgt wllL1J~lj i oJ J 2l126 90 26 (EClte ) ~L~I ~yJl ~Jl ~l5~ w~1
~cJ1 wI~ wLL~L dj)~ ~JI ~ eJuiJ1 ~ lgt- ~wS1 e~1 w~L~101 ~ L5 ~yJl ~ f-- ~G 0jl Jgtlj ~LJ- djJL1-~I~~~~~L tf~1 ~ ~1cJ1 0 1~ d1Ju1 ~tJl uiJj~~1
~lJLjWItJ~~A~l 4Jrl~101~wLL~Ia~~jaJI~~~1 ~I~~~~~l I~j
~I ~~ rlYJ wI~ rl~1 ~-9 ~I sJAl1 ~FI J5L ~~ 0 1~-9 r)l~1 ~1jJ
Judl ~~y~~~0J ~I~A uLlS
INTRODUCTION
World wide concerted efforts are being made to improve irrigation water-use efficiencies to enhance crop production in irrigated agriculture where supplemental irrigation water is a must to offset the water requirement of crops and to produce profitable crops in most arid and semiarid regions The general shortage of the good quality water in most of the semi-arid and arid zone countries necessitates the use of saline water However the injudicious use of saline water is often associated with the development of soil salinity
It is generally recognized that saline water affects soil properties and plant growth The misuse of this saline water ultimately converts the good soils in to saline soils Saline soils are significant as formations of ecosystem on the earth affected by high concentrations of soluble salts and as means of crop production with little economic value due to salinity Many plants either fail to grow in saline soils or their growth is retarded significantly However few plants grow well on saline soils therefore soil salinity often restricts options for cropping in a gi ven area Under ex treme saline conditions (soil and water) the only choice is the adoption of biosaline agriculture which is gaining importance in countries where soil and water resources are degraded
The success of irrigated agriculture lies both with the quality (fresh brackish and saline) and quantity of irrigation water (irrigation budgeting) These waters if not properly managed and used can cause serious soil related problems (salinity sodicity destruction of soil structure) in addition to decline in crop yields In this regards key design considerations must be taken into account when irrigating with salty waters Sprinkler inigation systems are commonly used in irrigation of large-scale agricultural production systems However they tend to concentrate salts on the leaves of plants For this reason discharge and degree of overlap between consecutive sprinkler heads are key design parameters when applying salty waters Trickle irrigation is the most efficient system and is gaining importance in the Gulf Cooperation Council (GCC) countries in agriculture and landscape irrigation The leaching ratio (LR) is the overall soil salinity within the rhizosphere divided by average irrigation water salinity In this study LR is used to evaluate the effectiveness of irrigation systems in developing soil salinity A sustainable production system is achieved when the LR approaches unity
The objective of this study is to optimize modern irrigation systems through development of design standards for drip (emitters spacing) and sprinkler irrigation systems (single head jet
61 Shabbir Ahmed Shahid and Bassam Hasbini
and overlapping) applying saline water The effect of emitter spacing (drip) overlapping (sprinkler) were tested for the formation of salt contours in soil The results were used in models to validate and calibrate the salts distribution
RESOURCE INFORMATION
The International Center for Biosaline Agriculture (ICBA) Dubai United Arab Emirates occupies an area 100 ha of which 37 ha area is allocated for experimental purposes The soils of ICBA are generally level loose sandy surface very deep and calcareous Due to the sandy nature the soils have very high drainage capacity (well to somewhat excessively drained) and are moderate to rapidly permeable The soils are developed from wind blown sandy calcareous material and are highly prone to wind erosion the windbreakers at the ICBA station offset the wind effects to a certain extent Organic matter is very low laquo05) and the Munsell Soil Color-dry (GretagMacbeth 2000) is lOYR 64 pale brown which is a composite reflection from the dominance of carbonates and sand with insignificant contribution of organic matter to color composition
There is one water source (flow rate 45 m3hr) at the ICBA station that is saline (Electric conductivity (EC) 30 dSm) and the quality fluctuates slightly with aquifer recharge after heavy rain Water composition is shown in Table 1 Fresh water (EC =3 dSm) is brought from DubaishyAI-Ain area at Habab which flows from Dubai
m3Municipality water line at a rate of 40 per hour There are two water pumps which extract water from these two sources From these sources two water lines run parallel to each other and enter into mixing chambers where two waters are mixed in different ratios to achieve desired salinity levels before entering into experimental plots
Soil Taxonomic Class of the Experimental Site The experimental site was assessed for
taxonomic class using the norms and standards of the United States Department of Agriculture Soil Taxonomy (Soil Survey Division Staff 1993 USDA-NRCS 1999 amp 2003) The soil is classified as carbonatic hyperthermic Typic Torripsamment Where carbonatic is the mineralogy class ie more than 40 CaC0
3 in fine earth fraction
hyperthermic is the soil temperature regime (the mean annual soil temperature is 22degC or higher and the difference between mean summer and mean winter soil temperature is more than 6degC at a depth of 50 cm from the soil sUlface) Typic torripsamment indicates typical desert sandy soil at soil subgroup level of USDA Soil Taxonomy
Table 1 Water quality at leBA
Parameter Value
Water salinity EC = 30 dS m
Water Conductivity Class C4 (very high salinity water)
Residual Sodium Nil
Carbonates
Sodium adsorption Ratio 31 (rrunoles l)05
Water Sodicity Class S4 (very high sodium water)
Water Class C4S4
(Richards 1954)
Physical and Chemical Characteristics of Surface Soil
The methods used are from USDA-NRCS (1996) except where otherwise stated Complete Particle Size Distribution Analysis (PSDA) was made by using the modified hydrometer method (Day 1965 Shahid 1992) supplemented with wet sieving (that allows quantification of sub fractions of sand) suitable for soils with low organic matter contents The data (sand silt clay) presented is on less than 2 mm basis Textural class is reported by plotting the sand (2-005 mm) silt (005 to 0002 mm) and clay laquo0002 mm) values on the textural triangle (Soil Survey Division Staff 1993) The saturation percentage (SP) is determined by the volume of water added to a known amount of soil to prepare saturated soil paste the SP value is plotted into the model suggested by USDA (USDA-NRCS 1995) to determine water retention at 15 bars (W 15) and available water capacity (AWC) of soils The pH was measured on a saturated soil paste (pHs) and the EC in the saturation extract collected from the saturated soil paste under vacuum The calcium carbonates equivalents were determined by the Back Titration procedure where a known amount of soil was reacted with a known amount of 1 N HCl and the unused acid was back titrated against IN NaOH
Optimization of Modem Irrigation for Biosaline AgricullUre 62
solution in the presence of phenolphthalein indicator to a pink color end point The soil results are presented in Table 2 which clearly reveals that soil is fine sand in texture saline moderately alkaline and strongly calcareous
Table 2 Physical and Chemical Characteristics of Soil (0-30 cm)
Physical Characteristics
Gravels (2-5 nun) lt05
Very coarse sand (2-1 mm) 3
Coarse sand (I - 05 mm) 3
Medium sand (05 - 025 nun) 4
Fine sand (025 - 01 mm) 51
Very fine sand (01-005 mm) 37
Coarse silt (005 - 002 nun) 05
Fine silt (0 02 - 0 002 mm) 05
Clay laquo0002 nun) 10
Total Sand (2-005 nun) 98
Total silt (005-0002 mm) 10
Total clay laquo0002 mm) 10
Textural Class Fine sand
Saturation Percentage 26
Water retention at 15 bar 65
(W15)
Available Water Capacity
(AWC) 413
Chemical Characteristics
Electrical conductivity of
saturation extract (ECe) 123 dSm
pHs 822-moderately alkaline
CaC03 (equivalents) 53
Water Quality
Irrigation water was analyzed for standard water quality parameters (water salinity residual sodium carbonates-RSC and sodium adsorption ratio-SAR) The importance of these parameters in relation to water quality for irrigated agriculture is discussed in detail by Shahid (2004) Water salinity refers to the total concentration of dissolved salts-salinity hazard Sodicity-relative
proportion of sodium cations to other cations particularly Ca and Mg ie SAR (SAR = Na [(Ca+Mg)2]0 5) expressed as (mmolesI)deg5 where all concentrations are in meq1 The high SAR deteriorates soil structure and reduces water penetration into and through soil Similar to drought and salinity excess proportion of sodium in comparison to calcium and magnesium reduce water availability to the crops Residual Sodium Carbonates (RSC) - bicarbonate anion and carbonate anion concentration as related with calcium (Ca2+) and magnesium (Mg2+) cations [RSC =(C032- + HC03-) - (Ca2++ Mg2+)] where all concentrations are in meq1
Water Salinity and Sodicity Class - C4S4
C4 water is not suitable for irrigation under ordinary conditions but may be used occasionally under very special circumstances The soils must be permeable drainage must be adequate irrigation water must be applied in excess to provide considerable leaching and highly saltshytolerant crops should be selected S4 class is generally unsatisfactory for irrigation purposes except at low and perhaps medium salinity where the solution of calcium from the soil or use of gypsum or other amendments may make the use of these waters feasible
EXPERIMENTAL SETUP
Two field experiments were conducted at the ICBA station 1) effect of emitter spacing on the formation of salt contours 2) sprinkler overlapping and distribution to maximize leaching
Experiment 1 Three emitter spacings (25 cm 50 cm and
50 cm) were tested in this experiment Each drip line was 2 meters apart (Fig 1) and triplicated To avoid the effects of replications each replication was 3 meter apart
The initial soil salinity level was 123 dSm By mixing saline and fresh water a salinity level of 19 dSm was achieved and irrigation was applied through these driplines twice a day 30 minutes in the morning and 30 minutes in the evening over a period of 90 consecutive days Soil samples were collected at 0-20 cm depth
bull bull bull bull bull bull bull bull bull bull bull bull bull bull bull bull bull
bull bull bull bull bull bull bull bull bull
63 Shabbir Ahmed Shahid and Bassam Hasbini
for salinity measurement The LR was used to determine salinity development with the effect of different emitter spacing The LR was determined by this (ECeECw) relationship where ECe is the electrical conductivity of the soil saturation extract and ECw the electrical conductivity of the irrigation water The LR in relation to emitter spacing is presented in the form of salt contours around the emitters
- l-t
e~ feshy l
~
bull bull bull bull- bull bull J l __ al
Fig 1 Experimental set up and emitter spacing
Experiment 2 In this experiment the performance of
micro and impact sprinklers was tested by single jet and through overlapping The objective was to maximize uniformity and to minimize evaporation The water was collected in catch cans (placed at a distance of 05 m) and evaporation along the jet line was calculated based on salinity variations in the collected waters (Fig 2)
II 1 II bull bull bull
Fig 2 Setup for measurement ofwater evaporation by correlation with collected water salinity
The overlapping in micro and impact sprinkler was maintained at 90 during the course of the experiment Soil salinity developed through sprinkler irrigation was evaluated by analyzing soil samples
RESULTS
Effect of Emitter spacing on soil salinity development - trickle irrigation
In this experiment the performance of emitter spacing was tested in terms of LR of the soi Soil salinity values obtained from the
saturated soil pastes were used to prepare the salinity contour lines The results are presented in Figures 3-5 These figures clearly show that the higher LR and salinity is recorded almost in the center of the emitters (Chhabra 1986) In drip irrigation the salts accumulation occurs in two processes in the first process the soil becomes saturated and water and solutes spread in various directions saturating the neighboring voids and moving further (Fig 5) in the second process which occurs between consecutive irrigation cycles evaporation of water and uptake of water and nutrients by plants occur and the solutes are redistributed in the soil the final buildup of salts in the soil results from the interaction of these two processes throughout the crop season
Figures 4-6 clearly illustrate that the minimum LRlsalinity is developed near the emitters and increases towards the center of two emitters It is very evident from the Figures 4-6 that by
Fig 3 Initial stage of soil saturation with drip irrigation
Fig 4 Soil salinity contours (leaching ratio) with respect to 25 cm spacing
Optimization 0 Modem Irrigationor Biosaline Agriculture 64
decreasing the emitter spacing from 75 to 25 cm the LR as well as soil salinity is reduced significantly The soil salinity with 75 cm emitter spacing was recorded as 102 dSm compared with 25 cm emitter spacing where a relatively lower ECe (29 dSm) was recorded There was only a slight difference in LR and ECe with 50 and 75 cm emitter spacing The effects
Fig 5 Soil salinity contours (leaching ratio) at a drip spacing of 75 cm
Fig 6 Initial stage of soil saturation with drip irrigation
Fig 7 Comparative salinity contours in three emitter spacing - top view
of emitters spacing on soil salinity contours (top view) can be seen at a glance in Fig 7
Micro and impact sprinkler- single jet In this experiment the performance of micro
and impact sprinkler was evaluated in terms of water evaporation which was calculated from the volume of water collected in catch cans and their salinity levels The catch cans were placed in the experimental sites at a uniform distance of 05 m meter (Fig 8 and 9) The results of water evaporation and water salinity development are presented in Figs (10-11)
Fig 8 A view of experimental layout
Fig 9 A view of experimental layout
Fig 10 shows that the impact sprinkler performed better than the microsprinkler in reducing water evaporation Similarly lower water salinity was recorded in the water collected in the impact sprinker compared to the water collected in the micro sprinkler This experiment was conducted only for two hours prolonged irrigation
65 Shabbir Ahmed Shahid and Bassam Hasbini
can offer a solution to the improvement in water distribution and salinity development The blue area shows higher salinity due to uneven distribution of water through wind effect
Fig 10 Comparison of impact ad micro sprinkler on water evaporation
may cause significant salinity consequences in the soil Therefore a very careful irrigation management using saline water is needed
Overlapping in Micro Sprinkler The performance of a micro sprinkler as a
single jet and with an overlapping of 90 was tested in terms of water salinity development The results are presented in Fig 11 The comparison clearly shows higher water salinity development with a single jet at a distance of 6 meters whereas an EC of 24 dSm was recorded with 90 overlapping This development is related to water evaporation the distance the water particle travels mixing through overlapping in addition to other factors
Fig 11 Salinity reduction through overlap of two consecutive sprinkler heads at 90
In another experiment water and soil salinity was tested in sprinkler irrigation In this experiment wind has significantly affected the water distribution and the subsequent salinity development The trend of salinity development is shown in Fig 12 Since there was no control over the wind it is concluded that in areas where wind can play an important role windbreakers
Fig 12 Salinity development through sprinkler irrigation
REFERENCES
Chhabra R (ed) (1996) Soil salinity and water quality Oxford and IBH Publishing Cpo Pvt Ltd UK p284
Day PR (1965) Particle fractionation and particleshysize analysis Cv 43 (p545-566) In C A Black Amery (ed) Methods of Soil Analysis Soc Agron Wisconsin
Greta Macbeth (2000) Munsell Soil Color Charts 617 LittleBritainNew WindsorNewYorkpp125-53
Richards LA (ed) (1954) Diagnosis and improvement of saline and alkali soils USDA Handbook No 60 Washington USA pp79-81
Shahid SA (1992) An up-to-date precise stage by stage textural analysis of soil profile Pakistan Journal ofSoil Science 7(34) 28-34
Shahid SA (2004) Irrigation Water Quality Manual ERWDA Soils Bulletin 2 7 - 33
Soil Survey Division Staff (1993) Soil Survey Manual USDA-NRCS Agric Handbook No 18 USGovt Print Office Washington USA
USDA-NRCS (2003) Keys to Soil Taxonomy 91h
ed U S Govt Print Office Washington USA p331
USDA-NRCS (1995) Soil Survey Laboratory Information Manual Soil Survey Investigation Report No 45 Version 10 USDA-SCS U S Govt Print Office WashingtonUSA
66 Optimization of Modern Irrigation for Biosaline Agriculture
USDA-NRCS (1996) Soil Survey Laboratory Methods Manual Soil survey Investigation Report No 42 Version 30 USDA-NRCS U S Govt Print Office Washington USA
USDA-NRCS (1999) Soil Taxonomy A Basic System of Soil Classification for Making and Interpretation ofSoil Surveys USDA Agriculture Handbook No 436 U S Govt Print Office Washington USAp869
Ref (2430) (Paper selected and revisedfrom the seventh Gulf Water Conference Water in the GCC Towards an Integrated Management Water Science and Technology Association (WSTA) State ofKuwait November 19-23 2005)
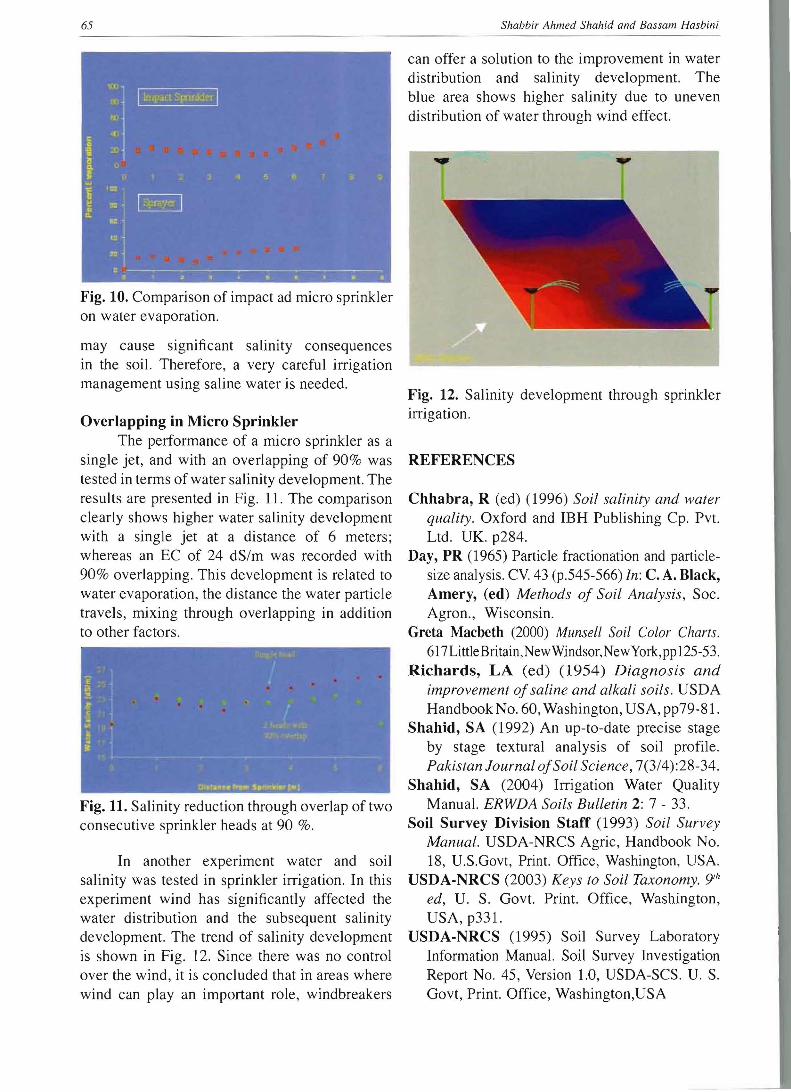