optimization of conditions for the preparation of ...7)/j0277485.pdfoptimization of conditions for...
TRANSCRIPT

American Journal of Engineering Research (AJER) 2013
w w w . a j e r . o r g
Page 74
American Journal of Engineering Research (AJER)
e-ISSN: 2320-0847 p-ISSN : 2320-0936
Volume-02, Issue-07, pp-74-85
www.ajer.org
Research Paper Open Access
Optimization of Conditions for the Preparation of Activated
Carbon from Mango Nuts using HCl
Kwaghger, A1*
and Ibrahim J.S2
1,2Department of Mechanical Engineering, University of Agriculture, Makurdi, Nigeria.
Abstract: - Activated carbon was prepared from mango nuts by chemical activation method using HCl , herein
referred to as MNAC. The effect of experimental variables; temperature, concentration, impregnation ratio and
carbonization time on the quality of the activated carbon- surface area, carbon yield and ash content were
investigated. The response surface methodology (RSM) technique was used to optimize the production
conditions. The influence of the studied production parameters on the activated carbon produced was
investigated using the analysis of variance (ANOVA) to identify the significant variables. The optimum
preparation conditions for preparation of the MNAC were obtained a follows: carbonization temperature of
212.1oC, HCl concentration of 100%, 30 min resident time and 1ml/g mix ratio. This resulted in the activated carbon with 5.92% ash content, 1142.3 m2/g surface area and 63.2% carbon yield. It was observed that the
experimental values obtained were in good agreement with the values predicted by the model with relatively
small errors between the predicted and the actual values (0.33, 0.18 and 1.94 for ash content, surface area and
carbon yield respectively).
Keywords: - Activated carbon, Conditions, HCl, Mango nuts, Optimization.
I. INTRODUCTION Mango, magnifera indica, is a major waste in Makurdi, the capital city of Benue state especially during
its harvesting season as farmers from different part of the state find a ready market in Makurdi.The edible part
of mango is the peel and the fibrous material. The pit is not a consumable part of mango and is usually
discarded as waste. Mango has become and economically important species since its demand domestically and
for export has increased tremendously. Due to the high consumption of the edible part, massive amount of mango nut are disposed causing gradual fermentation and subsequent release of odour [1]. To make better use
of cheap and abundant agricultural waste, it is proposed to convert mango nut waste into activated carbon. This
conversion will address problems of unwanted agricultural wastes been converted into useful, value- added
adsorbent and also the use of agriculture by- products to represent potential source of adsorbent which will
largely address problems of waste management. However, not many studies have been reported on converting
mango nut into activated carbon. Some relevant studies found in literature were reported by other authors [2-5].
A challenge in activated carbon production is to produce very specific carbons which are suitable for certain
application. The most important characteristics of an activated carbon is it adsorption capacity which is highly
influenced by the preparation conditions [6]. In assessing the effect of the treatments on quality attribute, the
use of an adequate experimental design is particularly important. Response Surface Methodology (RSM) has
been found to be a useful tool to study the interaction of two or more variables [7]. Optimization of experimental conditions using RSM has widely been applied in various processes; however, its application in
activated carbon production is rare. Some previous studies reported using RSM in optimizing the production of
activated carbon with other agricultural wastes were reported by other authors [7- 10]. As far as known, no
study has been carried out using RSM approach in analysing the production process of activated carbon with
mango using HCl as activating agent.
In the present study, the optimal experimental conditions required to obtain adequate activated carbon
with desirable properties in terms of carbon yield, surface area and ash content, which are critical in
determining a good quality activated carbon for a wide range of adsorption applications were determined. A
modelling technique was applied to relate the experimental conditions of the activation process with properties

American Journal of Engineering Research (AJER) 2013
w w w . a j e r . o r g
Page 75
of activated carbon. A good quality activated carbon should have low ash content as possible. Faust and Aly
[11], suggests that typical values of ash content should be in the range of 5 – 6% and about 85 – 90% for carbon
content. As the carbon content of the activated carbon increase, the surface area also increases. High carbon
content value is desired to achieve high surface area. Bacaoui et al, [8] reported that for economic viability,
activated carbon should have a carbon yield of 10- 20% and a surface area of 1000- 1300 m2/g. Using olive-
waste cake waste, Ahmad and Alrozi [12] reported a carbon yield of 20.76%; Aloko and Adebayo [13] reported
1620m2/g surface area, 148.20% ash content and 29.24% carbon yield using mango peel; Sahu et al [10] reported a carbon yield value of 46.08% using Tamarind wood; Hameed et al, [14] reported a carbon yield of
17.96% and a surface area of 1141m2/g. The inorganic material contained in activated carbon is measured as the
ash content and this value should be in range of 2-10 % [15]. The ash content generally gives a good idea about
the inorganic constituents associated with carbon obtained by different carbonization methods. Low value of
ash content indicates that the inherent carbon in the starting material is high [16]. Soleimani and Kaghazchi [17]
reported that activated carbon with high ash content is undesirable because it reduces the absorption capacity
and mechanical strength of activated carbon.
The main objective of the paper is to determine the suitable experimental conditions; carbonization
temperature, activation time, concentration and impregnation ratio required to prepare activated carbons from
mango nuts for effective use in a variety of adsorption application. Also, to select indigenous raw materials of
agricultural origin (mango seeds), explore the potential of producing activated carbons from mango nut wastes
and carry out studies to explore the possibility of obtaining high quality activated carbons.
II. MATERIALS AND METHODS. 2.1 Preparation of the activating agent (HCl). 25, 50 and 75 ml of hydrochloric acid was added to 75,
50 and 25 ml of distilled water to obtain 25, 50 and 75 % volume concentrations of acid activating agent
respectively. For 100 % volume concentration, no distilled water was added (it was used undiluted) so that it
remained in 100 % volume concentration [18].
2.2 Preparation and carbonization of mango seeds. In the preparation of the mango seeds, the
procedure is described hence was follows. First, the dried mango nuts collected were cracked using hammer and
the seeds were then removed from the nuts and were dried under sun light at room temperature for two weeks after which they were crushed using laboratory mortar and pestle. The resulting particles were again sun-dried
for 5 hours to remove any residual moisture left in them. The particles were then sieved using 6mm sieve size
and used for the rest of the experimental work. The sieved samples were then impregnated with different
concentrations of the activation agents (25%, 50%, 75% and 100%). 50g of the samples was measured and
impregnated (mixed) with 50ml, 100ml, 150ml and 200ml of the various activating agents to obtain ratios of 1:1,
1:2, 1:3 and 1:4 ml/g respectively. The impregnated samples were left at room temperature for 24 hours. After
impregnation, the excess solutions were filtered off and the remaining material dried for three days at room
temperature. Finally the resulting samples were carbonized in a pre- heated furnace at temperatures of 200, 400,
and 600oC for durations of 30, 60, 90 and 120 minutes. The activated carbons were rinsed with distilled water,
dried at 750oC temperature for 1 hour in the furnace and crushed to obtain particle sizes of 3mm by passing the
crushed carbon through sieve size 300µm. Care was taken to ensure the material was not forced through the sieve by hand pressure.
2.3 Characterizations of the products
Ash Content Determination: The ash content of MKAC produced was determined by the standard test method for
ash content- ASTM D2866-94. A crucible was pre- heated in a furnace to about 500oC, cooled in a desiccator and
weighed. 1.0g of MKAC was transferred into the crucible and reweighed (oven dry weight). The crucible and sample
were then placed in the furnace and temperature was raised to 500oC. The sample was removed and allowed to cool
in a desiccator to room temperature and reweighed (ash weight). The ash content was calculated using equation 1.
𝐴𝑠ℎ 𝑐𝑜𝑛𝑡𝑒𝑛𝑡(%) =𝐴𝑠ℎ 𝑤𝑒𝑖𝑔 ℎ𝑡(𝑔)
𝑂𝑣𝑒𝑟 𝑑𝑟𝑦 𝑤𝑒𝑖𝑔 ℎ𝑡(𝑔)× 100 (1)
Surface Area Determination: The diameter (assuming spherical shape) of the activated carbon was obtained by
passing the crushed carbon through sieve size of 300µm and the external surface area was calculated by the
relation;
Surface area, SA =6(𝑐𝑚 2 𝑔)
𝐵𝑑𝑃𝑑 (2)
Bb = bulk density
Pd= particle size (particle diameter)
A measuring cylinder was weighed, and then filled with the prepared sample of MKAC and gently tamped until
no change in the level of the sample was observed. The volume occupied by the packed sample was recorded as
Vs, if Wc is the weight of the empty cylinder and W, the weight of the cylinder and sample, then, weight of the

American Journal of Engineering Research (AJER) 2013
w w w . a j e r . o r g
Page 76
sample Ws was obtained by 𝑊𝑠 = 𝑊−𝑊𝑐 [20]
The bulk density was calculated using equation 3.
𝐵𝑑(𝑔
𝑚𝐿) =
𝑊𝑠
𝑉𝑠 (3)
Where Vs, is the volume occupied by the packed sample
Activated Carbon Yield
The dried weight, Wca of each carbon sample was determined and the carbon yield (CY) was calculated as follows;
𝐶𝑎𝑟𝑏𝑜𝑛𝑌𝑖𝑒𝑙𝑑 =W ca
W f× 100% [21] (4)
Where, Wca = oven dried weight of carbon sample,
Wf = weight of carbon retrieved from the furnace.
III. RESULTS

American Journal of Engineering Research (AJER) 2013
w w w . a j e r . o r g
Page 77
0
10
20
30
40
50
60
70
80
0 50 100 150
Ash
Conte
nt
(%)
Resident Time (oC)
Fig. 1: Effect of Resident Time on Ash Content at the studied Temperatures (HCl)
Ash (200)
Ash(400)
Ash(600)

American Journal of Engineering Research (AJER) 2013
w w w . a j e r . o r g
Page 78
01020304050607080
0 200 400 600 800
Ash
Conte
nt
(%)
Temperature (oC)
Fig. 2: Effect of Temperature on Ash Content at the studied Impregnation Ratios (HCl)
Ash(1:1)Ash(1:2)Ash(1:3)Ash(1:4)
01000200030004000500060007000
0 50 100 150
Surf
ace
Are
a (
m2/g
)
Resident Time (oC)
Fig. 3: Effect of Resident Time on Surface Area at the studied Temperature (HCl)
SA(200)SA(400)SA(600)
0
1000
2000
3000
4000
5000
6000
7000
0 20 40 60 80 100 120
Surf
ace
Are
a (
m2/g
)
Concentration (%)
Fig. 4: Effect of Concentration on Surface Area at the studied Impregnation Ratios (HCl)
SA(1:1)
SA(1:2)
SA(1:3)
SA(1:4)

American Journal of Engineering Research (AJER) 2013
w w w . a j e r . o r g
Page 79
-
American Journal of Engineering Research (AJER) 2013
w w w . a j e r . o r g
Page 80
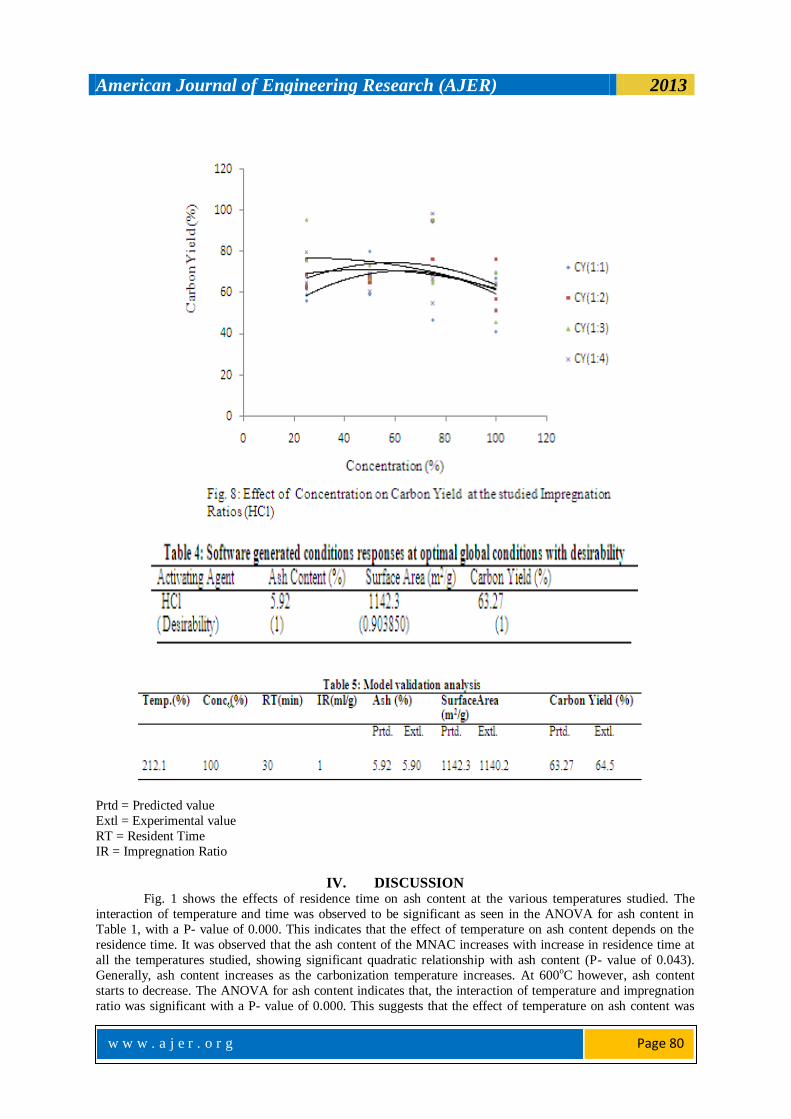
Prtd = Predicted value
Extl = Experimental value
RT = Resident Time
IR = Impregnation Ratio
IV. DISCUSSION Fig. 1 shows the effects of residence time on ash content at the various temperatures studied. The
interaction of temperature and time was observed to be significant as seen in the ANOVA for ash content in
Table 1, with a P- value of 0.000. This indicates that the effect of temperature on ash content depends on the
residence time. It was observed that the ash content of the MNAC increases with increase in residence time at
all the temperatures studied, showing significant quadratic relationship with ash content (P- value of 0.043).
Generally, ash content increases as the carbonization temperature increases. At 600oC however, ash content
starts to decrease. The ANOVA for ash content indicates that, the interaction of temperature and impregnation
ratio was significant with a P- value of 0.000. This suggests that the effect of temperature on ash content was

American Journal of Engineering Research (AJER) 2013
w w w . a j e r . o r g
Page 81
also dependent on the impregnation ratio. Also, Table 1 suggests that impregnation ratio has significant
quadratic relationship with ash content with a P- value of 0.031. The quadratic coefficient for impregnation ratio
was -4.9546 indicating that as the impregnation ratio increases the ash content decreases. A similar trend was
observed by Usmani et al, [22]. They observed that increasing the impregnation ratio gradually decreases the
ash content using CaCl2 as the activating agent. KCl however showed no effect. Generally HCl, ZnCl2 and
CaCl2, have good ash reduction action especially on raw materials of vegetable origin.
Fig. 2 shows the effect of temperature on ash yield at all levels of impregnation ratios studied. It was observed that ash output increases as the temperature increases at all impregnation ratios. Temperature effect on
ash content at the various mix ratios was however discussed in the paragraph above. The ANOVA for ash
content in Table 1 shows that the interaction of temperature and mix ratio is significant (P- value of 0.000). This
suggests that the effect of temperature on ash content depends on the mix ratio. The increase in ash yield was
however within accepted range of 5-6% when activation was carried out at lower temperatures. This
observation could be due to the highly corrosive nature of HCl on the precursor such that longer activation
became detrimental to targeted yield of carbon. Longer activation durations intensify dehydration and
elimination reactions increasing volatiles in the system resulting in ash increase [23]. The trend observed was
consistent with results of Adel et al, [24] using HCl. In their report, the ash yield increases from (20.79-21.95)
for rice husk while the ash content for beans husk decreased from (1.63-1.48). The discrepancies could be due
to the lignocellulosic content of the precursors used. The nature of the result could be traced to the fact that the
low boiling point of the activating agent (HCl) caused it to vaporize easily leaving a dry precursor thus enhancing burn-off yielding ash as the duration of carbonization increases. Also the difference in behaviour
could be due to the different lignocellulosic composition of the precursor thus reacting differently when in
contact with the activating agent. According to the other studies, the difficulties arising from the complex
composition of lignocellulosic materials and the activating agents as well as from the large number of complex
reactions involved in the pyrolysis process makes it difficult to achieve precise models describing pyrolysis
mechanism [5]. The interaction of temperature and concentration was significant with a P-value of 0.004 as
seen in Table 1. This suggests that the effect of temperature on ash content also depends on the concentration
which in turn depends on the impregnation ratio. Generally, the effect of the studied parameters on ash content
can be said to be synergistic with all the parameters contributing significantly to the ash content of the MNAC
produced. In Table2 the ANOVA for surface area suggests that the model is significant with the linear,
quadratic and interaction terms all significant. Table 2 also indicates that the interactions of temperature and concentration, temperature and time, temperature and ratio, concentration and time, concentration and ratio as
well as time and ratio are all significant with P- values of 0.000, 0.000 0.000, 0.000, 0.010 and 0.002
respectively. This observation suggests that the effect of temperature on ash content depends on both the
concentration of HCl as well as the impregnation ratio. The effect of concentration on surface area depends on
carbonization temperature and impregnation ratio and the effect of carbonization time on the ash content
depends on the impregnation ratio. Fig. 3 shows the effect of carbonization time on the surface area at the
temperatures studied. The Fig. indicates that as the carbonization duration increase, the surface area also
increases. The increase was observed to be gradual at lower temperatures of 200 and 400oC. However, at
600oC, the increase was sharp. In Table 2, resident time and carbonization temperature play decisive role in the
surface area of MNAC produced. This observation was similar to that of Tan [6] using KOH as activating agent.
Generally, as the temperature rises and duration in the furnace increases, the C- HCl and C- CO2 reaction rates
increase resulting in increasing devolatilization which further develop the rudimentary pore structure in the char and also enhance the existing pores thus creating higher surface area and higher porosities. Besides, the increase
in temperature also caused the CO2 and the surface metal complexes to further gasify the carbon leading to
widening of mesopore to macropore [23]. Fig. 4 shows the effect of concentration on the surface area at the
ratios studied. The Fig. shows a little increase, though significant, in surface area as the concentration increases.
However, it was observed from the graph that within the concentrations used in the research, no maximum point
was reached. In Fig. 7, the increasing trend of surface area observed can be explained by the fact that carbon
gasification was enhanced by increase in impregnation ratio and residence time thus causing the removal of
carbon atoms on pore walls, which increase surface area [25]. Fig. 5 shows the effect of temperature on surface
area at the studied residence time. The ANOVA for surface area in Table 2 suggests that the interaction of
temperature and impregnation ratio was highly significant (P- value of 0.000). This indicates that, the effect of
temperature on surface area was largely due to the resident ratio. The increase of temperature and impregnation ratio enhances the existing pores leading to higher surface area and higher absorption rates. In Fig. 5, surface
area was observed to increase with increasing temperature. This observation could probably be due to drastic
expansion of the carbon material leading to the creation of large surface area. Similar results were obtained by
Diao et al,[26] using sorghums, they found that, for temperatures lower than 500oC, microporous carbons with
small surface areas were observed, however, at temperature of 600oC, high surface areas were observed. Prahas
et al, [27] also observed similar results. They found that as temperature and impregnation ratio increase the

American Journal of Engineering Research (AJER) 2013
w w w . a j e r . o r g
Page 82
surface area also increases. The optimum activation temperature for higher surface area was found to be 450oC
for coconut shells impregnated with phosphoric acid [28] and 500oC for rubber wood dust [29]. The observation
in the present work could probably be due to the depolymerization of cellulose in the reaction as concentration
increases resulting in tar formation. The temperature of activation has significant effects on the development of
carbon’s porous networks and should just be enough to eliminate all the moisture and most of volatile
components in the precursor to cause pores to develop. Since the end of the volatile evolution marks the
formation of the basic pore structure, activation should be limited up to a point. Higher temperatures cause enlargement of pores at the expense of the surface area. Also, control of the activation temperature is of
economic interest since shorter durations are generally desired as this is equivalent to reduction in energy
consumption. Fig. 6 shows the increase of surface area with increasing impregnation ratio. It was found that the
highest surface area was obtained at ratio 1:4 for temperature of 600oC. At temperatures of 200 and 400oC, only
a gradual increase in surface area was observed after undergoing activation process, it was expected that the
volatile matter content decreases significantly whereas the fixed carbon content increases. This observation
could have been due to pyrolytic effect at high temperature where most of the organic substance have degraded
and discharged both as gas and liquid tars living the material with high carbon purity [6].
The ANOVA for carbon yield in Table 3 suggests that the regression model was significant. All the
levels of the model, linear quadratic and interaction terms, were significant with P- values 0.000 for each. The
interactions of temperature and concentration, time and temperature as well as temperature and ratio were
significant with P- values of 0.000, 0.000 and 0.053 respectively. The quadratic effects of temperature and concentration were also significant with P- values of 0.031 and 0.000 respectively. Fig. 7 shows the effect of
residence time on carbon yield using HCl at the temperatures studied. The Fig. suggests the linear relationship
of time with carbon yield. It shows that carbon yield decreases as the residence time increases at all
temperatures of activation studied. The interaction of time and temperature was also significant. This could be
because longer carbonization durations mean higher probability of the carbon to be exposed to the steam
atmosphere; hence higher chance for the activation reaction to take place. Based on the activation, higher
temperature and longer reaction time means more carbon will react and more gasification will occur that will
increase the ash content with extra reactions taking place, more carbon will be consumed and there will be low
carbon yield [30]. Similar trends were observed by Chan et al, [30] using HCl and tyres precursor, Adel et al
[24] using Rice husk and beans husk with HCl activation agent. However the yield obtained using HCl was
higher than fixed carbon of the mango nuts. Essentially, mango nuts are complex composite material formed of natural polymers (cellulose, lignin and hemicellulose) during carbonization at high temperatures; these
polymeric structures decompose and liberate most of the non-carbon elements, mainly hydrogen, oxygen and
nitrogen in form of liquid (tars) and gasses leaving behind a rigid carbon skeleton in the form of aromatic sheet
strips. The presence of HCl during activation promotes depolymerization, dehydration and redistribution of
constituents’ biopolymers and also favours the conversion of aliphatic to aromatic compounds thus increasing
the yield of carbon yield [25].
The observation in Fig. 7 agrees with that observed by Sundaryanto et al, [31] where activated
temperature was found to play an important role in the yield of activated carbon. The increase in temperature
would release increasing volatiles as a result of intensifying dehydration, which HCl is noted for, elimination
reaction and increase C-HCl reaction rates, thereby resulting in decreasing carbon yield [32- 33]. Indeed, the
increase in temperature and time quickens the gasification reactions of carbon and therefore, attack the
amorphous component which obstructs the pores causing decrease in carbon yield [8]. Sentorun- Shalaby et al [34] observed that at higher activation temperatures, activation of apricot stones becomes more extensive
resulting in lower solid yield with more widened porous structure. The yield of activated carbon prepared from
fir wood was also found to decrease gradually with carbonization duration. However, impregnation ratio
promoted the yield of activated carbons. Similar trends were observed by Prahas et al,[27] although they used
H3PO4 and Jack fruit peel waste as precursors. The observed result for carbon yield in the present work could be
because; the reaction of lignocelluloses with HCl begins as soon as the components are mixed. The acid first
attack hemicelluloses and lignin because cellulose is more resistant to acid hydrolysis [35]. Here, the acids will
hydrolyse glycosidic linkages in lignocellulosic and cut aryl ether bond in lignin. These reactions are
accompanied by further chemical transformations that include dehydration, degradation and condensation. As
the temperature increase, aromatic condensation reactions also take place among the adjacent molecules which
results in the activation of gaseous products, from hydro-aromatic structure of carbonized char leading to decrease carbon yield. Similar observation was reported by Adel et al, [24] using rice husk, when temperature
was increases from 80-120oC using HCl as activating agent. However an increase in carbon yield was observed
when they used HCl and beans husk. The differences would be due to the original lignocellulosic content and
elemental composition of precursors used.
It is worthy of note in Figs. 2 and 5 that while ash yield was much at 600oC, carbon yield decreased at
this same temperature and surface area increases at 600oC. Figs. 1, 3 and 7 show relationships of ash content

American Journal of Engineering Research (AJER) 2013
w w w . a j e r . o r g
Page 83
surface area and carbon yield with time. Many researchers reported that there will be a drop in surface area after
certain decrease of ash content. It was observed that the surface area of carbon produced will start to decrease
when the ash content reached around 50% and up to 68% [36- 38]. Also, when there is a collapse in the micro
pores, this might lower surface area but at the same time there is micro pore and meso pore formation which
would increase the surface area [30]. As a result, the overall surface area increases despite high ash yield.
Fig. 8 shows the effect of concentration on the carbon yield at the various ratios considered. The
interaction effect of concentration and ratio as seen in Table 3 was not significant (P-value = 0.45). The quadratic effect of concentration on surface area is significant with a P- value of 0.022. The Fig. suggests that
surface area increase to a point where average concentration is 55% beyond which the surface area begins to
drop. It was observed from the ANOVA in Table 3 that, for carbon yield, impregnation ratio generally did not
show any significant contribution to carbon yield at both linear and quadratic levels. The interaction of
temperature and ratio was almost not significant with a P- value of 0.053.
4.1 Prediction equations for HCl.
Response Surface Methodology (RSM) which is a collection of mathematical and statistical technique
that is useful for modelling and analysis of problems in which a response of interest is influenced by several
variables [38]. A 2FI (two factor interaction) polynomial regression model was developed to analyse the factor
interaction and to identify the significant factors contributing to the model. The surface area, carbon yield and
ash content are utilized in the quadratic model according to the propositions of the software. Analysis of
variance was carried out to justify the adequacy of the model. The final empirical models for ash content, surface area and carbon yield respectively are shown in equations (5), (6) and (7). The suitability and quality of
the model developed was evaluated using the correlation coefficient R2 which are 66% for equation 5 above,
55% for equation 6 and 39% for equation 7. The high values of R2 indicate good agreement between
experimental data and the model prediction [39]. The coefficient with one factor represents the effect of the
particular factor; while the coefficient with two factors and those with second- order terms represent the
interaction between two factors and quadratic effect respectively. The positive sign in front of the terms
indicates synergistic effect, whereas negative sign indicates antagonistic effect
ASH=9.9970+11.5905TEMP+2.2958CONC+3.2186TIME+2.3756RATIO+10.3445TEMP2-4.9546CONC2-
2.0221TIME2+2.1572RATIO2+2.1192TEMP*CONC+3.2600TEMP*TIME+
3.1752TEMP*RATIO+0.6154CONC*TIME-2.3991CONC*RATIO-0.0385TIME*RATIO (5)
R2 = 66% SA=382.21+236.48TEMP-44.31CONC+304.84TEMP+126.47RATIO+
137.55TEMP2+232.61CONC2+186.19TEMP2+76.90RATIO2-
126.75TEMP*CONC+281.25TEMP*TIME+130.19TEMP*RATIO-129.50CONC*TIME-
93.05CONC*RATIO+112.67TIME*RATIO (6)
R2 = 55%
CY=70.0662-4.6502TEMP-0.2257CONC-9.0287TEMP+0.3921RATIO+3.8343TEMP2-18.1731CONC2-
3.5889TIME2-0.5832RATIO2-7.3487TEMP*CONC-4.8825TEMP*TIME-
2.6534TEMP*RATIO+0.7653CONC*TIME-1.007CONC*RATIO-0.6797TIME*RATIO (7)
R2 = 39%
Low R2 value for ash could be due to due to difficulty in handling combustion processes, however agreeable
carbon yield of 63.27% was obtained as carbon yield from the raw materials. 4.2 Process optimization.
In the production of commercial activated carbons, high quality products are expected in terms of high
surface area, high carbon yield and low ash content for effective adsorption capacity and economic viability.
However, to optimize all these responses under the same condition is difficult since the interest regions
of factors are different. This is because, while higher carbon yield and surface area are desirable, ash content
has to be low for a good quality activated carbon. In order to compromise between these three responses, the
function of desirability was employed using MINITAB version 16 software as shown in table 4. The
experimental conditions with the highest desirability were selected to be verified. The MNAC was then
prepared using the experimental conditions given in table 5 including the predicted and experimental values.
The optimal activated carbon using preparation conditions as: 212.1oC carbonization temperature, 100%
concentration of HCl, 30 min resident time and 1ml/g mix ratio which resulted in 5.92% ash content, 1142.3m2/g surface area and 63.27% carbon yield. It was observed that the experimental values obtained were
in good agreement with the values predicted from the model, with relatively small errors between the predicted
and the actual values as seen in Table 5, which were only 0.33, 0.18 and 1.94 respectively for ash content,
surface area and carbon yield. Through the process optimization, mango nut was proved to be a potential
precursor for production of activated carbons with high surface area, high carbon yield and low ash content as
required.

American Journal of Engineering Research (AJER) 2013
w w w . a j e r . o r g
Page 84
V. CONCLUSION Mango nuts are good precursor for the production of activated carbons with characteristic high quality.
The RSM methodology is an appropriate tool to study the optimization of the activation process of preparing
activated carbons to be used in a given technological process. In the present paper, the optimization was done to
obtain activated carbons from mango nuts with high surface, high carbon yield, low ash content suitable for adsorption applications. The experimental parameters analysed were temperature, concentration, and
carbonization time and impregnation ratio. The optimal activated carbon was obtained using preparation
conditions as: 212.1oC carbonization temperature, 100% concentration of HCl, 30 min resident time and 1ml/g
mix ratio which resulted in 5.92% ash content, 1142.3 m2/g surface area and 63.27% carbon yield which are
quite satisfactory and suitable for a wide range of adsorption applications.
REFERENCES [1]. S. Okonogi, C. Duangrat, S. Anuchpreeda, S. Tachakittirungrod and S. Chowwanapoonpohn S,
Comparison of antioxidant capacities and cytotoxicities of certain fruit peels. Food Chem. 103, 2007, 839- 846.
[2]. D. G. Akpen, I. L. Nwaogazie, and T.G. Leton, Optimization of conditions for the removal of colour
from waste water by mango seed shells based activated carbons. Indian J. Sc. & Tech. Vol 4; no.8 2011.
[3]. M. Ajmal, R. Mohammad, Y. Yusuf, and A. Ahmed, Adsorption behaviour of Cadmium, Zinc, Nickel
and Lead from aqueous solutions by MagniferaIndica seed shell. Indian J. Env.Hlth. 40 (1),1998, 15-26.
[4]. K. V Kumar, and A. Kumaran, Removal of methylene blue by mango seed kernel powder. Biochem.
Eng. J. 27, 2005, 83-93
[5]. M. P. Elizalde- Gonzalez and V. Hernandez- Montoya, Characterization of mango pit as raw material
in the preparation of activated carbons for wastewater treatment. Biochem. Eng. J. 36, 2007, 230- 238.
[6]. I. A. W. Tan, A. L. Ahmad, and B. H. Hameed, Preparation of activated carbon from coconut husk:
Optimization study on removal of 2, 4, 6- trichlorophenol using response surface area method. J. of
Haz.Mater. 153, 2008, 709- 717 [7]. F. Karacan, U. Ozden, and S. Karacan, Optimization of manufacturing conditions for activated carbons
from Turkish lignite by chemical activation using surface response methodology. Apl. Thermal Eng. 27
(7), 2007, 1212- 1218
[8]. A. Bacaoui, A. Yaacoubi, A. Dahbi, C. Bennouna, R. Phantanluu, F. J. Maldonado- Hodar, J. Rivera
and C. Moreno- Castilla, Optimization of conditions for the preparation of activated carbons from olive-
waste.Carbon.39, 2001, 425- 432.
[9]. R. Azargohar and A. K. Dalai, Production of activated carbon from luscar char: Experimental and
modelling studies, Micropor. Mesopor. Mater 85, 2005, 219- 225
[10]. J. N. Sahu, J. Achrya, and B. C. Meikap, Optimization of production conditions for activated carbons
from Tamarind wood by zinc chloride using response surface methodology. Bioresour. Technol. 101,
2010,1974- 1982 [11]. S. D. Faust and O. M. AlyChemistry of Water Treatment, (Butterwort Pub. Woburn, 1983)
[12]. M. A. Ahmad and R. Alrozi, Optimization of preparation conditions for mangosteen peel- based
activated carbons for the removal of remazol brilliant blue R using response surface methodology.
Chemical.Engr. J. 165, 2010, 883- 890.
[13]. D. F. Aloko and G. A. Adebayo, Production and characterization of activated carbons from agricultural
waste. J. Eng. Applied Sci.2 (2), 2008, 440-444.
[14]. B. H. Hameed, I. A. W Tan and A. L. Ahmad, Preparation of oil palm empty fruit bunch- based
activated carbon for removal of 2, 4, 6- trichlorophenol: Optimization using response surface
methodology. Journal of Hazardous Mat.164, 2009, 1316- 1324.
[15]. T. Yang and A. C. Lua, Characteristics of activated carbons prepared from pistachio-nut Shells by
physical activation. Journal of Colloid andInterface Sci. Vol. 267, Issue 2, 2003, 408-417. [16]. S. Karthikeyan , P. Sivakumar and P. N. Palanisamy, Novel activated carbons from agricultural wastes
and their characterization. E- Journal of Chem. Vol. 5, 2008, 409- 426.
[17]. M. Soleimani and T. Kaghazchi, Agricultural waste conversion to activated carbon by chemical
activation with phosphoric acid.Chem. Eng. Technol. 30, 2007, 649- 654.
[18]. Laboratory solution preparation guide.(2008).
[19]. S. S. Dara, Experiments and Calculations in Engineering Chemistry, (S. Chand and Co. Ltd. New-
Delhi1991)
[20]. M. Ahmedna , M. M. Johns, S. J. Clark, W. E. Marshall and M. M. Rao, Potential of agricultural by-
product based activated carbon for use in raw sugar discolorization. Journal of Sci. Food and Agric. 75,
1997, 117-124.
American Journal of Engineering Research (AJER) 2013
w w w . a j e r . o r g
Page 85
[21]. O. P. Fapetu, Production of carbon from biomass for industrial and metallurgical processes. Nigerian
Journal of Eng. Manag.1, 2000, 34- 37.
[22]. T. H. Usmani, T. W. Ahmad and A. H. K. Yousufzai, Preparation and liquid- phase characterization of
granular activated carbon from rice husk. Bioresour.Technol. 30, 1994, 31- 35.
[23]. F. U. Wu and R. L. Teng, Preparation of highly porous carbon from fir wood by KOH etching and CO2
gasification for adsorption of dyes and phenols from water. Journal of Colloid Interface Sci. 294, 2006,
21- 30. [24]. A. M. Adel, Z. H. Abd El- Wahab, A. A. Ibrahim and M. T. Al- Shemy, Characterization of
microcrystalline cellulose prepared from lignocellulosic materials. Part I. Acid catalysed hydrolysis.
Bioresour. Technol. 101, 2010, 4446- 4455
[25]. H. Teng, M. A. Serio, M. A. Whjtowicz, R. Bassilaki and P. R. Solomon, Reprocessing of used tyres in
to activated carbon and other products. Ind. Eng. Chem. Res. 34(9), 1996, 3102- 3113
[26]. Y. Diao, W. P. Walawender, and L.T. Fan, Activated carbons prepared from phosphoric acid activation
of grain sorghum. Bioresour. Technol. 81,2002, 45- 52.
[27]. D. Prahas, Y. Kartika, N. Indraswati and S. Ismadji, Activated carbon from jackpeel waste by H3PO4
chemical activation: Pore structure and surface chemistry characterization. Chem. Eng. Journal 140,
2008, 32-42.
[28]. J. Laine, A. Calafat, and M. Labady, Preparation and characterisation of activated carbons from
coconut shell impregnated with phosphoric acid. Carbon.27, 1989, 191- 195. [29]. C. Srinivasakannan and M. B. Zailani, Production of activated carbon from rubber wood sawdust.
Biomass & Bioenergy. 27,2004, 89- 96.
[30]. O. S. Chan, W. H. Cheung and G. McKay, Preparation and characterisation of demineralised tyre
derived activated carbon. Carbon.49, 2006, 4674- 4687.
[31]. Y. Sundaryanto, S. B. Hartono, W. Irawaty, H. Hindarso and S. Ismadji, High surface area activated
carbon prepared from cassava peel by chemical activation. Bioresour.Technol. 97, 2006, 734- 739.
[32]. A. C. Lua, and T. Yang, Effect of activating temperature on the textural and chemical properties of
potassium hydroxide activated carbon prepared from pistachio- nut shell. Journal of Colloid Sci. 274,
2004,594- 601.
[33]. D. Adinata, W. M. A. W. Daud and M. K. Aroua, Preparation and characterization of activated carbon
from palm shell by chemical activation with K2CO3. Bioresour. Technol. (98), 2007, 145-149. [34]. C. Sentorun- Shalaby, M. G. Ucak- Astarhoglu, L. Artok and C. Sarici, Preparation and
characterization of activated carbons by one- step steam pyrolysis/ activation from apricot stones.
Micropor.Mesopor.Mater. 88, 2006, 126-134
[35]. M. Jagtoyen, and F. Derbyshire, Activated carbon from yellow poplar and white oak by H3PO4
activation. Carbon. 36, 1998, 1085-1097.
[36]. J. F. Gonzalez, M. J. Encimar, C. M. Gonzalez- Garcia, E. Sabio, A. Ramiro and J. L. Canito,
Preparation of activated carbons from used tyres by gasification with steam and carbon dioxide. Appl.
Surf. Sci.252 (17), 2006, 5999- 6004.
[37]. T. Xu and X. Liu, Peanut shell activated carbon: characterisation, surface modification and adsorption
of Pb2+
from aqueous solution. China Journal of Chem. Eng. 16(3), 2008, 406- 407.
[38]. S.Q. Li, Q. Yao, S. E. Wen, Y. Chi and J. H. Yan, Properties of pyrolytic chars and activated carbons
derived from pilot- scale pyrolysis of used tyre. Journal of Air Waste Manag.Assoc. 55(9), 2005, 1315- 1341.
[39]. D.C Montgomery, D.C. Design and analysis of experiments, (5th ed. John Wiley and Sons, New York.
USA 2001).