optimising project value and robustness
TRANSCRIPT

7/28/2019 Optimising Project Value and Robustness
http://slidepdf.com/reader/full/optimising-project-value-and-robustness 1/10
Optimising Project Value and Robustness
G Whittle1, W Stange2 and N Hanson3
ABSTRACT
An important aspect of the project evaluation process is the achievementof a clear and quantitative understanding of the primary driversinfluencing project value and risk. A business scenario-based approach isrequired to ensure that the project meets value and risk hurdles over theshort, medium and longer term. Adopting an optimising approach can aidsignificantly in the development of a project concept into a business thatis optimal and sustainable in the longer term.
Through the application of case studies, based on work performed withvarious mining organisations during the last five years, this paper willdemonstrate how project value and robustness can be optimised.Experience has demonstrated that applying this approach results insignificant value improvements and risk reduction – primarily byapplication of a rigorous, fact-based analysis and optimisation processthat rapidly increases management team understanding and insight of keydriver of value and risk.
INTRODUCTION
Much of the effort expended during project developmentultimately contributes towards developing an accurate estimateof the project value under an assumed set or range of conditions.Mining projects are sufficiently complex that an evaluation of thesame basic project can be significantly different depending onthe degree to which the project evaluation has been optimised. Inaddition, an estimate of project value is of limited utility if therobustness of the project around this value estimate has not beenadequately quantified.
Although the scale and inherent complexity of mining projectsare such that optimisation and risk assessment are challenging,this paper contends that:
•Optimisation of even the largest project is now technicallyfeasible and practical. Due to the significant value premiumachieved ‘best-practice’ evaluation needs to encompassrigorous optimisation.
• Assessment of project robustness, although less welldeveloped, can be readily achieved by application of aquantitative risk management framework that has provedeffective in other disciplines, such as the trading of financialinstruments. Value at risk (VaR) (Dowd, 1998; Jorion, 2001)is proposed as an effective approach and this paper illustrateshow a VaR-like framework can be used to quantify projectrobustness.
This paper presents a novel integrated approach to projectoptimisation and robustness assessment. The benefits of the
approach are demonstrated by applying them to a hypothetical,but realistic, Cu/Au project – Marvin (Hanson, 2007). The natureof the Marvin project and its key parameters are summarised inAppendix 1.
In our view the primary benefit of adopting the approachproposed in this paper is not the fact that an ‘optimum’ value,and associated risk profile, is derived but rather that the key
drivers of value and risk are clearly and quantitatively revealed.
This understanding facilitates the effectiveness of the overalldevelopment process by keeping management focus on the‘critical few’ key risk and value drivers to ensure developmentachieves maximum improvement in value and reduction in risk for any given level of expenditure and activity. Concentrating ona single plan too early can hide potential value that could berealised and/or reduced understanding of risk.
This is best achieved by definition and analysis of the likelybusiness scenarios in which the project is to be developed andoperated in the medium and longer term, eg in the currentclimate much more focus is required on managing aroundresource and infrastructure constraints, as well as understandingthe impact of potential price trends. Although not addressed inthis paper the application of scenario-analysis for strategicdevelopment and planning is well established (Ringland, 1998).
The benefits associated with the approach proposed extend pastthe project development phase. The insight and understandinggained in developing the integrated risk and optimisation modelcan be captured in a strategic asset management plan whichshould be transferred to the operations management team. Thisteam should then update the risk and value model and plan toensure that as business conditions change, as well as theunderstanding of the orebody and its mining and processingimproves, the operation can be managed to a more rigorous risk and value profile.
This paper is structured as follows:
• A review of the current status of relevant risk andoptimisation work is undertaken.
• An integrated risk and optimisation architecture which can
be applied to project evaluation is provided.• A case study, based on the hypothetical Marvin orebody (see
Appendix 1) is conducted. An analysis of the case studydemonstrates the benefits and typical outcomes of such anapproach.
• Conclusions drawn from the work are presented.
REVIEW OF OPTIMISATION AND RISKAPPROACHES
If optimisation is not applied the typical approach to evaluationis to define a ‘mid-case’ approach with a consequent poorquantitative understanding of the many trade-offs betweeninteracting variables. The range of assumptions that make up a
‘mid case’or ‘most likely case’ typically encompasses:• geology: tonnes, grades, variability, continuity;
• geotechnical parameters: what pit slopes or undergroundstructures are supportable, with associated hydrology, civilworks options, berm construction, stockpile, waste andtailings competency;
• mining cost, productivity and dilution: equipmentperformance potential may be clear but the end resultdepends heavily on geology and geotechnical issues;
• metallurgy cost, recovery and throughput; and
• market metal prices, and for some commodities the demandfor certain product specifications (eg iron ore and coal).
The ‘mid-case’ approach does not guarantee that the evaluated
basis is financially optimal and provides little quantification of
Project Evaluation Conference Melbourne, Vic, 19 - 20 June 2007 1
1. Managing Director, Whittle Consulting Pty Ltd, Suite 13, 333Canterbury Road, Canterbury Vic 3126.Email: [email protected]
2. Client Director, Deloitte Consulting, Level 5, 180 Lonsdale Street,Melbourne Vic 3000. Email: [email protected]
3. MAusIMM, Geologist and Consultant, Imageo, 100 Mary Avenue,
Wheelers Hill Vic 3150. Email: [email protected]
7/28/2019 Optimising Project Value and Robustness
http://slidepdf.com/reader/full/optimising-project-value-and-robustness 2/10
the project robustness – it is never clear whether the mid-pointapproach is overly conservative or optimistic. Throughout theevaluation process we eagerly lock in the single favoured valuefor each of the above parameters. This is normally driven by theneed to define sufficient detail so that ‘accurate’ cost estimatescan be derived as quickly as possible. For new projects inparticular, where there is a lack of actual operating experience,the truth is that many of the key parameters could be within a
fairly broad range and are likely to change over time.
The typical project optimisation process
Pit and schedule optimisation for mining projects is welldeveloped. This typically involves comprehensive geological andoperational modelling, and usually the application of sophisticated mathematical optimisation software. The processinvolves identifying the combination of controllable variablesthat maximise the value of the project in the context of a givenset or range on assumptions. ‘Whole-of-Business’ optimisation isan area in which significant progress has been made (Whittle,2004; King, 2004; Hall and Hall, 2006) and it is now feasible toroutinely apply value optimisation to large/regional-scale assetsduring development as well as during ongoing operations.
Geological models are created at a point in time based ondrilling data of different spacing and density of drilling. Evenwhen conditional simulation has been performed, it is commonpractice to construct a single block model flagging each block with the confidence level that the drilling data in that areasupports. It is possible later in the analysis to exclude or at leastdiscount apparent ore in the ‘inferred’ category.
From that point on the block model is regarded as a ‘reality’.Different dilution formulae are sometimes applied, but generallythere is pressure to lock in these assumptions early in theprocess, due to the large amounts of re-work that is involved inchanging them.
Metallurgical recoveries are set based on test work in the caseof new projects. In most situations the inherent variability inthese tests are simply ‘averaged out’. How representative the test
samples are of the orebody concerned is as uncertain as thegeological modelling process itself. Based on engineeringdesign, ultimate plant throughput is determined and just asimportantly the ramp up to this is defined. The impact of delayedramp-up is sometimes explored.
Alternative market scenarios are more often explored, usuallyin terms of an upside and downside case for metal prices. Metalprices arguably have the largest impact on project valuation, anddo have an impact on what the optimal operational plan will be.
With this set of information pit optimisation or undergroundmine conceptual design takes place. Depending on whether thestudy undertaken is a prefeasibility or definitive feasibility study,varying amounts of actual mine design work will take place. Thismay involve specification of haulage roads, dewatering and detailof waste movements and waste/ore stockpile design. It is common
for the detailed mine design work to only be performed for areasto be mined within say the first five years, with other areas left atthe more conceptual design status, perhaps using the shapes thatcame out of the pit optimiser.
In the case of pits, applying the Lerchs-Grossman (L-G)algorithm with varying revenue factors (say from 0.4 to 1.4)provides useful guidance for a value-based phasing strategy. Theearly mining shapes are generated by high-grade and/or lowstripping ratio – the extent to which they can be designed in asearly high-value phases depends on practical consideration suchas minimum mining width and haul road access.
Once a set of optimal pit shapes has been generated the life-of-mine schedule, subject to defined operational constraints, isoptimised. The schedule optimiser should control:
• the rate and location of mining, within the shapes defined inthe previous stage of the planning process;
• the cut-off grade(s) between waste, stockpile and processing;
• which processing method an ore parcel will report to, if morethan one alternative exists;
• blend specification, observing any minimum or maximumlimits but otherwise negotiating the attributes based on anunderstanding of the material available from mining andstockpiles and the sensitivities of the plant cost/recovery/
throughput to feed characteristics; and• production volume, mix and specification (where applicable).
If the optimisation analysis is performed properly, then theresult is a life-of-mine (LOM) plan that maximises the netpresent value (NPV) for the project for the specified set of assumptions (geological, geotechnical, metallurgical, market,environmental, etc).
If the result is best amongst a range of alternatives, or meetssome predetermined criteria, and fits in with the company’soverall investment strategy, then the project is consideredfavourable and the next phase of development is sanctioned.
Typical characteristics of an optimisedlife-of-mine plan
Based on a large range of projects undertaken, some on aregional scale, a number of characteristics of an optimisedlife-of-mine plan have been observed. To maximise the currentvalue of a project (as measured by the NPV) the optimiser istypically making choices that:
• avoids doing anything that destroys value, ie where the costexceeds the benefit;
• brings forward larger/positive cash flows; and
• delays smaller/negative cash flows.
In general an optimised life-of-mine schedule tends to have thefollowing characteristics:
• After initial waste stripping, which should be performed aslate and as quickly as possible, low stripping ratio phasesresult in modest mining rates. As these are depleted, it isnecessary to increase mining capacity due to increasedstripping ratio:
• to deliver a constant amount of ore to the plant (if theplant is input limited), or
• a constant amount of metal contained (if the plant isoutput limited).
• High early head grades which decline ultimately to themarginal cut-off grade at the end of the LOM. This behaviouris enabled partly by:
• the pit optimisation or underground block prioritisationpresenting high-grade sources of ore within the miningsystem, or
• the opportunity to raise the early cut-off grade (increasingwaste or stockpiling) to maximise overall schedule value(as per Ken Lane).
• The result is either:
• decreasing production rates (if the plant is input limited),or
• increasing mining and processing rates (if the system isoutput limited).
Any specific situation may involve many variations from theabove guidelines. It is common practice to constrain theoptimiser to produce schedules with steady or smoothed miningand production rates, even though they are financiallysuboptimal. This possibly reflects the (irrational) human desire to
keep plant and equipment busy, or more likely reflects poor cost
2 Melbourne, Vic, 19 - 20 June 2007 Project Evaluation Conference
G WHITTLE, W STANGE and N HANSON
7/28/2019 Optimising Project Value and Robustness
http://slidepdf.com/reader/full/optimising-project-value-and-robustness 3/10
modelling, which overstates the benefit of not utilising availablelabour and equipment on a short-term basis. In a regionalsituation, ie where there are several facilities around majormineral provinces (eg Pilbara, Bowen Basin) this typicallyindicates significant potential for improved management andsharing of assets.
The importance of quantifying risk/robustness
There is little point in embracing optimisation without anaccompanying ability to understand how optimisation strategies,decisions and trade-offs impact on project robustness and risk.This allows the robustness of the optimal project configuration tobe compared with scenarios that are less favourable financially ina meaningful way.
Project risk analysis
There are a number of conventional approaches to assessing therisk or robustness of a minerals project (Torries, 1998):
• Sensitivity analysis – varying one or more parameters to seewhat impact this has on the project value of the project.
• Scenario analysis – group values of key parameters byscenarios and then understand how project value changesunder different scenarios. For example Rolley and Johnson(1997) demonstrate how different resource models impact onestimates of project profitability.
• Probabilistic analysis – key inputs, such as metal prices andcosts, are characterised as probability distributions andMonte Carlo simulation is used to simulate the projectvaluation under a range of inputs sampled from theunderlying distributions. This implies that resulting outputs(costs, revenues, NPV) are distributed and appropriatestatistics can be collected to characterise these quantitiessuch as average, standard deviations, etc. For exampleMardon, Goode and Rozman (1995) demonstrate theapplication of the @Risk software package with Whittle 4D
to quantify the uncertainty of project value (NPV) and cashflow by treating critical input variables (ore tonnes, grade,capital costs, operating costs, etc) as probability distributionsrather than point or mid-case estimates.
• Conditional simulation – can be used to quantify thedistribution of grades within an orebody. These gradedistributions can then be used in combination with a MonteCarlo based probabilistic evaluation model to understandhow grade variation impacts project value. For exampleRossi and van Brunt (1997) demonstrated how conditionalsimulation could be used in conjunction with the Lerchs-Grossman pit optimisation algorithm to better quantify thelevel of risk in an evaluation.
AN INTEGRATED OPTIMISATION ANDRISK FRAMEWORK
This paper demonstrates that in order to achieve best outcomesoptimisation should be considered in a manner that is completelyintegrated with an approach that provides a quantitative measureof the risk or robustness of the evaluation. Although this is oftenhinted at in the literature, to the knowledge of the authors a fullyintegrated approach has not been developed, primarily due to thelarge data volumes and intensive computation requirements.
The first step in achieving this is in developing a methodologyfor assessing project risk/robustness.
Quantifying project risk/robustness
In recent years there has been a strong adoption of the value atrisk (VaR) approach to quantifying risk (Jorion, 2001). Since the
early 1990s financial services industries, typically with complexand large financial risk issues (eg trading) have increasinglyadopted VaR to quantify and manage risk. There is also someindication (McCarthy, 2006) that mining companies are adoptingthis style of approach – albeit at a corporate level – to manageportfolio risk.
The technical definition of VaR is:
The maximum (worst) loss possible over a target
time horizon at a given level of confidence.
A VaR-like approach has been applied to valuation of businesses and projects (Godfrey and Espinosa, 1998; Schiefnerand Schmidt, 2003; Shimko, 2001) and this approach is proposedas an appropriate basis to evaluate the robustness of a project.
The VaR approach to project risk assessment is implementedas follows:
1. Define the VaR parameters:
• level of confidence parameter, typically one to five percent (this parameter defines what proportion of outcomes the VaR can be worse than).
• The time horizon – in project evaluation it is likely tobe the life-of-mine or long-term planning horizon.
2. Define the key inputs for which the robustness assessmentis to be conducted. These are typically quantities such asore grades and characteristics, equipment performancecharacteristics, financial and cost structures, product prices,etc.
3. Define the distributions that these inputs are likely to have,including how these distributions may change, possiblyover time, as well as how distributions may be correlated,eg the grade of a secondary mineral is correlated with theprimary mineral. In many respects this is the most difficultaspect of VaR to do well in a project development situation.There are several ways in which distributions can bedefined:
•
the use of historical data for similar projects andoperations;
• estimations by subject-matter experts; and
• use of detailed models, eg a detailed mine operationssimulation model can be configured to providedistribution data, eg how variations in truck loadingcycles result in variations of mine productivity andcosts for different stripping ratios.
4. Develop a discounted cash flow model which converts theselected inputs into appropriately timed capital, operatingcost and revenue impacts.
5. Use a tool like @Risk from Palisade Corporation to runMonte Carlo simulations of project value for manycombinations of the input distributions.
6. Analyse and interpret the outcomes.
In undertaking a VaR evaluation we are only considering risksthat can and should be expressed in a quantified financialmanner. This implies that risks and issues which are notamenable to this treatment (eg social, safety and environmentalrisks) are dealt with separately using an appropriate methodologysuch as enterprise risk management and that VaR is quantifiedwithin the appropriate policy ‘envelopes’.
To better explain the concept Figure 1 shows the VaR for thecase study presented in the next section. It can be seenthat the expected value of the project NPV over the projectlife (ten years) is $2884 M. However, there is a five per centprobability that the NPV is less than $1560 M – the VaR. TheVaR could also be expressed as the five per cent tail value as aproportion of the expected NPV, ie 54.2 per cent.
Project Evaluation Conference Melbourne, Vic, 19 - 20 June 2007 3
OPTIMISING PROJECT VALUE AND ROBUSTNESS

7/28/2019 Optimising Project Value and Robustness
http://slidepdf.com/reader/full/optimising-project-value-and-robustness 4/10
One of the key benefits of the VaR approach is that it isstraightforward to manage the ‘cascading’ of risk throughdifferent levels of an organisation, ie expressing the robustness of a particular project, component of a project or a developmentportfolio consisting of many projects.
Integrating optimisation and risk quantification
Based on the experience of the authors and access to a uniquelypowerful software system for project optimisation the conceptualarchitecture in Figure 2 is proposed for integrating projectoptimisation and quantification of risk using VaR. Thearchitecture is based on the application of a Monte Carloapproach where all of the project information is assumed to beexpressed as probability distributions. The key elements of thearchitecture are:
• Probability analysis system – this is the toolset used tomanage the probability distributions which underlie the VaRapproach. @Risk from Palisade was used for this work.
• Pit optimisation – given a specific input data set the L-G pitoptimiser determines the optimum pit design. Whittle FourXwas used for this work.
• Global optimiser – the Global Optimiser takes as input theoptimal pit design and then performs a ‘whole-of-business’
optimisation to find the LOM schedule that optimises theproject NPV, subject to defined constraints, eg constant metalproduction rate. The software used is proprietary to WhittleConsulting and represent decades of research in termsof best-practice ‘whole-of-business’ optimisation of miningprojects (Whittle, 2004).
The following processing sequence takes place on everyiteration:
• The probability analysis system ‘samples’ all of the keyinputs from the project database. The project database isdefined in a manner where key inputs are described byprobability distributions rather than ‘point’ estimates. Varioustechniques can be applied for estimating these distributions,as discussed above.
• The sample data set is processed by the L-G pit optimisationalgorithm to produce the optimal pit and phase design andthen by the global optimiser to maximise the ‘whole-of-business’NPV over LOM.
• The optimised LOM schedule and associated data are storedin a database accessible to the probability analysis system –allowing the output information to be analysed in aprobabilistic manner to produce distributions of keyinformation such as NPV, cash flow, mining schedules, etc.
• Typically the system runs for upward of 100 iterations – 500were used in the case study requiring some 40 hours of computation time.
CASE STUDY – MARVIN COPPER
The Marvin Copper project is a fictitious project but itincorporates many features of a typical sulfide mineraldeposit (Hanson, 2007). The project is more fully described inAppendix 1.
Parameters
The Marvin resource model consisted of some 30 000 blockswith an Au and Cu grade estimated for each block. Some 500iterations were applied resulting in some 15 000 000 blocksprocessed for the integrated risk and optimisation study. Keyparameters which were investigated in this study are described in
Table 1.
4 Melbourne, Vic, 19 - 20 June 2007 Project Evaluation Conference
G WHITTLE, W STANGE and N HANSON
Project NPV, Millions of US$
0.000
0.200
0.400
0.600
0.800
1.000
0 1000 2000 3000 4000 5000 60000 1000 2000 3000 4000 5000 6000
5% 90% 5% >1562.072 4400.313
C u m u
l a t i v e
P r o
b a
b i l i t y
Mean=2.884025E+09
90%
FIG 1 - Net present value for value at risk for Marvin case study.
Iterative Process
Probability Analysis
System
OrebodyModel
ProjectParameters
ProjectDatabase
Lerchs-Grossman
Pit Optimisation
GlobalOptimiser
OptimisedLOM Plans
FIG 2 - Integrated risk and optimisation system.

7/28/2019 Optimising Project Value and Robustness
http://slidepdf.com/reader/full/optimising-project-value-and-robustness 5/10
Case study findings
Impact of optimisation
The base case is defined as the application of Whittle FourX todevelop the optimal pit design, which also selects suitablepushbacks, and schedule as generated by an experienced user.The project NPV calculated in this manner is $2.3 billion. Theapplication of the global optimiser in addition to FourX providesan expected project valuation of $2.9 billion (see Figure 1) – anincrease of some 25 per cent. We conclude that the smallincremental cost and effort associated with application of rigorous optimisation is more than justified.
Project valuation
Figure 1 illustrates the probability distribution of the optimisedproject NPV. It is surprisingly broad, given the relatively smallvariability in the input parameters. This clearly illustrates that the
way in which variables interact in a large complex system resultsin non-intuitive outcomes. Although the distribution is broad it
can be clear seen that the optimiser has been very effective atensuring maximum NPV outcomes – the distribution comprisesonly positive values. In similar work without use of an optimiserit is often found that the NPV shows a finite probability of beingless than zero, ie of the project destroying value. Applyingoptimisation inherently improves robustness.
Cash flow
Figure 3 illustrates expected annual cash flows, including the fiveand 95 per cent probability boundaries. There is a five per centprobability that annual cash flows are break-even or nil fromyear six onwards. Figure 4 demonstrates how the cash flowdistributions evolve over project life. As the project lifeprogresses the distribution skews towards zero; however, theoptimiser is effective in avoiding negative cash flows.
Project Evaluation Conference Melbourne, Vic, 19 - 20 June 2007 5
OPTIMISING PROJECT VALUE AND ROBUSTNESS
$0
$200
$400
$600
$800
$1000
$1200
$1400
1 2 3 4 5 6 7 8 9 10
Period, years
M $
5% Prob
Expected
95% Prob
FIG 3 - Annual cash flow probability envelope.
Parameter Average Standard deviation Distribution Comments
Cu grade factor 1.0 0.05 Normal All Cu grades on the block model are multiplied by thisfactor to generate a distribution of Cu grades on each block.
Au grade factor 1.0 0.075 Log-Normal As for above but applied to the gold grade.
Short-term (three-year)Cu price, $/t $6195 $930 Log-Normal The possible distribution of copper prices over the next threeyears.
Long-term Cu price, $/t $4956 $1230 Log-Normal As for the short-term Cu price but for longer-term periods(four years into future and onwards).
Short-term (three-year)Au price, $/oz
$664 $70 Log-Normal As for copper short-term price but for gold.
Long-term Au price, $/oz $730 $150 Log-Normal As for gold long-term price but for gold.
Cu recovery factor 1.0 0.03 Normal The metallurgical recovery estimate for Cu is multiplied bythis factor to illustrate the impact of variability of copperrecovery.
Au recovery factor 1.0 0.05 Normal As for copper but applied to gold.
Selling cost, Cu, $/t $2000 $250 Normal Costs incurred in selling copper.
Selling cost, Au, $/oz $8.20 $1.03 Normal Costs incurred in selling gold.
Mining cost – $/t $2.10 $0.32 Log-Normal Mining operating costs.
Processing cost – $/t $7.50 $0.94 Log-Normal Processing operating costs.
Pit slope – east 45.0 2.0 Triangular Distribution of pit slopes – eastern side of pit
Pit slope – west 40.0 2.0 Triangular Distribution of pit slopes – western side of pit
TABLE 1Summary of input distributions and parameters.

7/28/2019 Optimising Project Value and Robustness
http://slidepdf.com/reader/full/optimising-project-value-and-robustness 6/10
Project life
Figure 5 illustrates the distribution of optimal project lives –
illustrating that periods of ten to 14 years are most common.
Mining tonnage
Figure 6 illustrates the expected total mining rate (ore and waste)over the project life including five per cent and 95 per centboundaries. Again, the distribution is broad and illustrates thetrend of declining mining rate over time. This is because theoptimal schedule favours high mining rates and creation of stockpiles initially and then the processing of lower-gradestockpiled material in later years. Figure 7 illustrates how thedistribution of mining rates varies with time. This informationallows the risk associated with various fleet and sourcingapproaches to be evaluated.
Processing plant grade
Figure 8 illustrates the feed grade of gold and copper to theprocessing plant. It can be clearly seen how the optimiser brings
forward high-grade material to maximise NPV.
Drivers of value and risk
The architecture illustrated in Figure 2 has the benefit that key
drivers of value and risk can be ascertained from the datagenerated. The following table illustrates the relative impact thateach of the key inputs has on key outputs such as NPV andannual cash flow in years one, four and eight. This facilitates anunderstanding of where project development effort should befocused to ensure reduction of risk and/or value improvement.
Table 2 represents a summary view of factors impacting risk and value. The system used provides a wealth of information at amuch greater level of detail that supports in-depth analysis anddevelopment of action plans to increase value and mitigate risk.
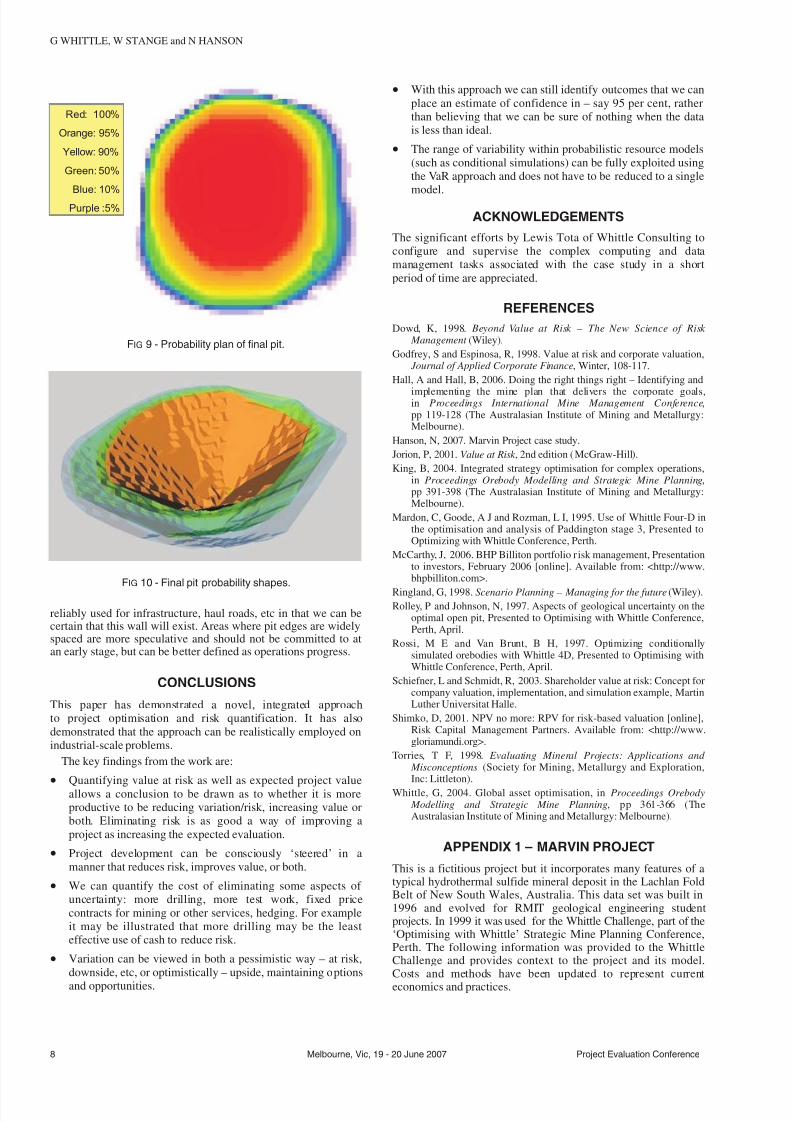
Probabilistic pit designThe system illustrated in Figure 2 provides valuable probabilisticinformation with respect to the ultimate pit design. The blocksthat make up the various phases of the optimal pit design arecalculated by the L-G algorithm. This information is collectedfor each iteration and then analysed statistically. Figure 9 is theplan view of the probability that each block is in the optimumdesign.
The 95 per cent probability pit phases define the high-certaintyarea for mining whereas the five per cent probability footprintcan be used to guide location of infrastructure to ensure futuredevelopment options are not complicated by obstructinginfrastructure.
The various probability ultimate pit shapes are shown inFigure 10. Where the edges of the various confidence pits areclose together, this is a stable pit wall location and can be
6 Melbourne, Vic, 19 - 20 June 2007 Project Evaluation Conference
G WHITTLE, W STANGE and N HANSON
Optimal LOM Period, Years
0.00
0.05
0.10
0.15
0.20
0.25
0.30
0 2 4 6 8
1 1 1
16
5.0% 5.0%90.0%
7.00 13.00
F r e q u e n c y
1810 12 14
FIG 5 - Optimal project life.
NPV Cash flow
(1)
Cash flow
(4)
Cash flow
(8)
Pit slope 1 2 4 5
Selling costs 2 6 1 4
Mining costs 4 4 6 1
Process costs 6 7 7 6
Price – short term 7 1 3 3
Price – long term 5 5 2 7
Recoveries 3 3 5 2
Note: 1 indicates the highest impact and 7 indicates smallest relativeimpact.
TABLE 2Key value drivers over project life.
0
0.5
1
1.5
2
2.5
3
3.5
4
4.5
0 0.25 0.5 0.75 1 1.25 1.5 1.75 2 2.25 2.5
Values in Billions of US$
Year 10
Year 1
Year 4
FIG 4 - Evolution of cash flow distributions.

7/28/2019 Optimising Project Value and Robustness
http://slidepdf.com/reader/full/optimising-project-value-and-robustness 7/10
Project Evaluation Conference Melbourne, Vic, 19 - 20 June 2007 7
OPTIMISING PROJECT VALUE AND ROBUSTNESS
0.000
0.100
0.200
0.300
0.400
0.500
0.600
0.700
0.800
0.900
1.000
1 2 3 4 5 6 7 8 9 10
Period, Years
95% Prob
5% ProbExpected
0.0
0.1
0.2
0.3
0.4
0.5
0.6
0.7
0.8
0.9
1.0
1 2 3 4 5 6 7 8 9 10
Period, Years
Gold
Copper
95% Prob
5% ProbExpected
C u G r a d e
, %
G r a d e
, g
/ t
FIG 8 - Processing plant feed grade.
0
1
2
3
4
5
6
7
8
0 10 20 30 40 50 60 70 80 90 100
Tonnes Mined, Mpa
Year 1
Year 4
Year 8
F r e q u e n c y o
f O
c c u r r e n c e
FIG 7 - Evolution of mining tonnage distributions.
-
20
40
60
80
100
120
1 2 3 4 5 6 7 8 9 10
Period, Years
5% ProbExpected95% Prob
T o n n e
s , M
i l l i o n s
FIG 6 - Mining tonnage probability envelope.
7/28/2019 Optimising Project Value and Robustness
http://slidepdf.com/reader/full/optimising-project-value-and-robustness 8/10
reliably used for infrastructure, haul roads, etc in that we can becertain that this wall will exist. Areas where pit edges are widelyspaced are more speculative and should not be committed to atan early stage, but can be better defined as operations progress.
CONCLUSIONS
This paper has demonstrated a novel, integrated approachto project optimisation and risk quantification. It has alsodemonstrated that the approach can be realistically employed onindustrial-scale problems.
The key findings from the work are:
•
Quantifying value at risk as well as expected project valueallows a conclusion to be drawn as to whether it is moreproductive to be reducing variation/risk, increasing value orboth. Eliminating risk is as good a way of improving aproject as increasing the expected evaluation.
• Project development can be consciously ‘steered’ in amanner that reduces risk, improves value, or both.
• We can quantify the cost of eliminating some aspects of uncertainty: more drilling, more test work, fixed pricecontracts for mining or other services, hedging. For exampleit may be illustrated that more drilling may be the leasteffective use of cash to reduce risk.
• Variation can be viewed in both a pessimistic way – at risk,downside, etc, or optimistically – upside, maintaining options
and opportunities.
• With this approach we can still identify outcomes that we canplace an estimate of confidence in – say 95 per cent, ratherthan believing that we can be sure of nothing when the datais less than ideal.
• The range of variability within probabilistic resource models(such as conditional simulations) can be fully exploited usingthe VaR approach and does not have to be reduced to a singlemodel.
ACKNOWLEDGEMENTS
The significant efforts by Lewis Tota of Whittle Consulting toconfigure and supervise the complex computing and datamanagement tasks associated with the case study in a shortperiod of time are appreciated.
REFERENCES
Dowd, K, 1998. Beyond Value at Risk – The New Science of Risk Management (Wiley).
Godfrey, S and Espinosa, R, 1998. Value at risk and corporate valuation, Journal of Applied Corporate Finance, Winter, 108-117.
Hall, A and Hall, B, 2006. Doing the right things right – Identifying and
implementing the mine plan that delivers the corporate goals,in Proceedings International Mine Management Conference,pp 119-128 (The Australasian Institute of Mining and Metallurgy:Melbourne).
Hanson, N, 2007. Marvin Project case study.
Jorion, P, 2001. Value at Risk , 2nd edition (McGraw-Hill).
King, B, 2004. Integrated strategy optimisation for complex operations,in Proceedings Orebody Modelling and Strategic Mine Planning,pp 391-398 (The Australasian Institute of Mining and Metallurgy:Melbourne).
Mardon, C, Goode, A J and Rozman, L I, 1995. Use of Whittle Four-D inthe optimisation and analysis of Paddington stage 3, Presented toOptimizing with Whittle Conference, Perth.
McCarthy, J, 2006. BHP Billiton portfolio r isk management, Presentationto investors, February 2006 [online]. Available from: <http://www.bhpbilliton.com>.
Ringland, G, 1998. Scenario Planning – Managing for the future (Wiley).Rolley, P and Johnson, N, 1997. Aspects of geological uncertainty on the
optimal open pit, Presented to Optimising with Whittle Conference,Perth, April.
Rossi, M E and Van Brunt, B H, 1997. Optimizing conditionallysimulated orebodies with Whittle 4D, Presented to Optimising withWhittle Conference, Perth, April.
Schiefner, L and Schmidt, R, 2003. Shareholder value at risk: Concept forcompany valuation, implementation, and simulation example, MartinLuther Universitat Halle.
Shimko, D, 2001. NPV no more: RPV for risk-based valuation [online],Risk Capital Management Partners. Available from: <http://www.gloriamundi.org>.
Torries, T F, 1998. Evaluating Mineral Projects: Applications and Misconceptions (Society for Mining, Metallurgy and Exploration,Inc: Littleton).
Whittle, G, 2004. Global asset optimisation, in Proceedings Orebody Modelling and Strategic Mine Planning, pp 361-366 (TheAustralasian Institute of Mining and Metallurgy: Melbourne).
APPENDIX 1 – MARVIN PROJECT
This is a fictitious project but it incorporates many features of atypical hydrothermal sulfide mineral deposit in the Lachlan FoldBelt of New South Wales, Australia. This data set was built in1996 and evolved for RMIT geological engineering studentprojects. In 1999 it was used for the Whittle Challenge, part of the‘Optimising with Whittle’ Strategic Mine Planning Conference,Perth. The following information was provided to the WhittleChallenge and provides context to the project and its model.Costs and methods have been updated to represent currenteconomics and practices.
8 Melbourne, Vic, 19 - 20 June 2007 Project Evaluation Conference
G WHITTLE, W STANGE and N HANSON
FIG 10 - Final pit probability shapes.
Red: 100%
Orange: 95%
Yellow: 90%
Green: 50%
Blue: 10%
Purple :5%
FIG 9 - Probability plan of final pit.

7/28/2019 Optimising Project Value and Robustness
http://slidepdf.com/reader/full/optimising-project-value-and-robustness 9/10
Location and exploration history
The Marvin copper-gold deposit is located approximately 100 kmNorth of Orange in the eastern Lachlan Fold belt at latitude149 00 E and 32 40 S on the Bathurst 1:250 000 scale map sheet
(see Figure A1.1). Mining and exploration in the area dates back to the 1850s when gold and copper were discovered in the area.The Marvin copper deposit was discovered in late 1996 using adetailed induced polarisation (IP) survey for targets for anextensive drilling program. Subsequent drilling at Marvin hasbeen performed to delineate the favourable host rock forgeological mapping and resource/reserve estimation.
Geological setting
The eastern portion of the Lachlan Fold belt contains anumber of Ordovician Volcano-intrusive complexes which hostporphyry style copper-gold mineralisation and high sulfurisationhydrothermal mineral deposits (Newcrest Mining staff, 1998).
Marvin is located within an altered acid volcanic sequencemaking up part of one of the aforementioned Ordovician volcanic
belts. The main mineralised zone is closely associated with a
quartz porphyry/breccia zone that has been interpreted byChiswell (1998) as an intrusion into andesitic tuffs. At depth agranodiorite pluton may have acted as the heat sourcefor a hydrothermal mineralisation event. The mineralisationis distinctly zoned with a bornite/chalcocite core and disseminated
chalcopyrite/pyrite halo. This deposit is very different in stylefrom all others in the area due to the abundance of chalcocite andbornite. These hydrous minerals, unlike chalcopyrite, are soluble.
Drilling and resource modelling
There have been three phases of drilling to date:
1. discovery RAB drilling program,
2. first deep drilling campaign, and
3. a second phase of deep drilling.
This has provided information for a preliminary block modelto be created to be used for project evaluation. The material hasbeen categorised as measured, indicated, inferred and pre-
resource to assist in project evaluation.
Project Evaluation Conference Melbourne, Vic, 19 - 20 June 2007 9
OPTIMISING PROJECT VALUE AND ROBUSTNESS
FIG A1.2 - Cut-away view of the OK block model.
FIG A1.1 - View of the orebody looking east.

7/28/2019 Optimising Project Value and Robustness
http://slidepdf.com/reader/full/optimising-project-value-and-robustness 10/10
10 Melbourne, Vic, 19 - 20 June 2007 Project Evaluation Conference