optimised biogas production at malabar sewage treatment plant · optimised biogas production at...
TRANSCRIPT
Optimised Biogas Production
At
Malabar Sewage Treatment Plant
By
Steven Mark Cowgill B.E. (Mech) Hons, MIEAust
A dissertation in partial fulfilment of requirements for the degree of
Master of Science (Renewable Energy)
Presented to
School of Engineering and Energy
Murdoch University, Western Australia
January 2011
Optimised Biogas Production at Malabar STP M.Sc. (Renewable Energy) Dissertation Steven Mark Cowgill School of Engineering and Energy January 2011 Murdoch University
i
Declaration
This dissertation is an authentic account of original research conducted by me which
has not been submitted towards another degree. Editorial changes that were
recommended after its examination in November 2010 have been made.
Steven Mark Cowgill
January 2011
Optimised Biogas Production at Malabar STP M.Sc. (Renewable Energy) Dissertation Steven Mark Cowgill School of Engineering and Energy January 2011 Murdoch University
ii
Acknowledgements
Thanks to Professor Philip Jennings at Murdoch University for supervising this
dissertation and for prompt, constructive reviews of all its draft versions.
Thanks to everyone involved at Sydney Water. Sarah Spurrett and Daniel Cooper
helped to decide the subject and to refine the research questions. Derek Van Rys
provided technical guidance to get started. Greg Melville gave access to Malabar
STP’s SCADA system. Richard Camilleri at Malabar STP and Debashis Raha at
Parramatta head office went out of their way to collect data and find drawings.
Thanks to my colleagues at WorleyParsons. Louise Spencer initially approached
Sydney Water with my notion of a no-budget study into a renewable energy problem
of its choice, helped with contacts, and always had good advice on finding
information. Koen Windey shared his expertise in digester operations and
cogeneration, and had plenty of ideas on increasing biogas yield at Malabar STP.
Stephen Roels freely provided introductions, a tour of Malabar STP, and a
memorable lift to the site in his late model Carrera.
Thanks to Paul Harris of the Faculty of Sciences at Adelaide University for guidance
on using his spreadsheet of Chen’s anaerobic digestion model and for permission to
include here its surface graphs of methane yield.
Finally, thanks to my family, in particular my wife Carmen and my parents Bess and
Geoff, for their love and practical support during this dissertation and throughout the
masters program. My completed degree is dedicated with due modesty to the future
of my daughters Imogen and Alana, and to the memory of my grandparents Dulcie
and Alan, Eileen and Arthur.
Optimised Biogas Production at Malabar STP M.Sc. (Renewable Energy) Dissertation Steven Mark Cowgill School of Engineering and Energy January 2011 Murdoch University
iii
Disclaimer
This dissertation was written for the purpose of academic research. The author is
solely responsible for the accuracy and representation of data, calculations,
diagrams, figures, and all other information in any form presented in the dissertation,
including the proper citation of other published research. Neither Sydney Water nor
WorleyParsons are liable for any result derived from any use made of the
dissertation by anyone. Views and opinions expressed in the dissertation are those
of the author and do not necessarily reflect those of Sydney Water, WorleyParsons,
or the management of either organisation.

Optimised Biogas Production at Malabar STP M.Sc. (Renewable Energy) Dissertation Steven Mark Cowgill School of Engineering and Energy January 2011 Murdoch University
iv
Abstract
Methane in biogas from anaerobic digestion of sewage sludge at Malabar Sewage
Treatment Plant (STP) fuels a cogeneration system of rated capacity 2,975 kWE that
helps meet the site’s electrical load of about 3,600 kWE. Low biogas flow rates limit
the cogeneration system to peak loads of about 2,300 kWE in a rolling average of
1,900 kWE. Site operating costs are thus increased by the need to purchase up to
1,000 kWE of additional grid electricity at any given time.
This research investigated ways to increase the supply of biogas to the
cogeneration system. A literature review of anaerobic digestion microbiology and
high rate primary sewage treatment processes gave benchmark performance data
against which Malabar STP digesters could be compared. Methods of increasing
the biogas yield per unit mass of sewage sludge were evaluated for their likely
benefit and risk at Malabar STP. The most viable of these were ultrasonic pre-
treatment of sludge, food waste co-digestion, and use of mechanical mixers in place
of compressed biogas for sludge recirculation. These methods could increase
existing steady state biogas flow rates by up to 40%.
It was concluded, however, that methods to increase biogas yield would be
unnecessary at Malabar STP if Digester 3 was returned to active sludge digestion,
and if the sludge in all digesters was maintained at a constant temperature of 35 oC
± 0.5 oC/d. Under these conditions some 10,300 m3/d of additional biogas would be
produced, enabling the cogeneration system to operate at its rated capacity.
Optimised Biogas Production at Malabar STP M.Sc. (Renewable Energy) Dissertation Steven Mark Cowgill School of Engineering and Energy January 2011 Murdoch University
v
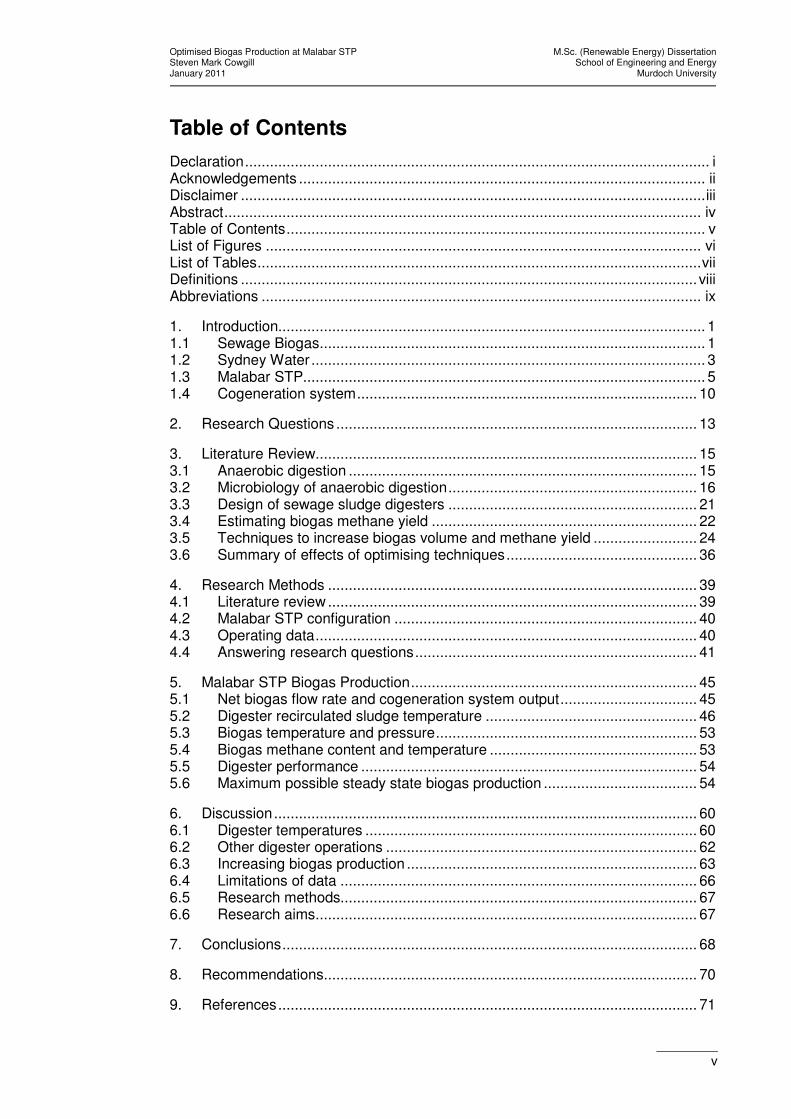
Table of Contents
Declaration................................................................................................................ i Acknowledgements .................................................................................................. ii Disclaimer ................................................................................................................iii Abstract................................................................................................................... iv Table of Contents..................................................................................................... v List of Figures ......................................................................................................... vi List of Tables...........................................................................................................vii Definitions ..............................................................................................................viii Abbreviations .......................................................................................................... ix
1. Introduction....................................................................................................... 1 1.1 Sewage Biogas............................................................................................. 1 1.2 Sydney Water ............................................................................................... 3 1.3 Malabar STP................................................................................................. 5 1.4 Cogeneration system.................................................................................. 10
2. Research Questions ....................................................................................... 13
3. Literature Review............................................................................................ 15 3.1 Anaerobic digestion .................................................................................... 15 3.2 Microbiology of anaerobic digestion............................................................ 16 3.3 Design of sewage sludge digesters ............................................................ 21 3.4 Estimating biogas methane yield ................................................................ 22 3.5 Techniques to increase biogas volume and methane yield ......................... 24 3.6 Summary of effects of optimising techniques.............................................. 36
4. Research Methods ......................................................................................... 39 4.1 Literature review ......................................................................................... 39 4.2 Malabar STP configuration ......................................................................... 40 4.3 Operating data............................................................................................ 40 4.4 Answering research questions.................................................................... 41
5. Malabar STP Biogas Production..................................................................... 45 5.1 Net biogas flow rate and cogeneration system output................................. 45 5.2 Digester recirculated sludge temperature ................................................... 46 5.3 Biogas temperature and pressure............................................................... 53 5.4 Biogas methane content and temperature .................................................. 53 5.5 Digester performance ................................................................................. 54 5.6 Maximum possible steady state biogas production ..................................... 54
6. Discussion...................................................................................................... 60 6.1 Digester temperatures ................................................................................ 60 6.2 Other digester operations ........................................................................... 62 6.3 Increasing biogas production ...................................................................... 63 6.4 Limitations of data ...................................................................................... 66 6.5 Research methods...................................................................................... 67 6.6 Research aims............................................................................................ 67
7. Conclusions.................................................................................................... 68
8. Recommendations.......................................................................................... 70
9. References..................................................................................................... 71
Optimised Biogas Production at Malabar STP M.Sc. (Renewable Energy) Dissertation Steven Mark Cowgill School of Engineering and Energy January 2011 Murdoch University
vi
List of Figures
Figure 1.2.1 Sydney Water sewage treatment network ......................................... 4
Figure 1.3.1 Malabar STP process flow diagram................................................... 6
Figure 1.3.2 Malabar STP anaerobic Digester 3 ................................................... 7
Figure 1.3.3 Malabar STP anaerobic Digester 5 cross-section.............................. 8
Figure 1.4.1 Malabar STP cogeneration system engines .................................... 10
Figure 1.4.2 Malabar STP cogeneration system block diagram........................... 12
Figure 3.2.1 Stages of anaerobic digestion ......................................................... 17
Figure 3.5.1 Effect of microwave irradiation on AD biogas volume...................... 28
Figure 3.5.2 Effect of γ-irradiation on AD biogas volume ..................................... 29
Figure 3.5.3 Effect of co-digested food processing wastes on AD biogas volume........................................................................... 32
Figure 3.5.4 Effect of aerobic thermophilic sludge seeding on AD biogas volume........................................................................... 36
Figure 4.4.1 VS consumption in high rate mesophilic AD of sewage sludge........ 42
Figure 5.2.1 Malabar STP biogas net and recirculation flow rates, cogeneration electrical output 11 – 18 June 2010 ........................... 49
Figure 5.2.2 Malabar STP digester sludge recirculation temperatures 11 – 18 June 2010 .......................................................................... 50
Figure 5.2.3 Malabar STP biogas temperature and pressure at cogeneration system inlet 11 – 18 June 2010 ................................. 51
Figure 5.2.4 Malabar STP biogas methane content and temperature at cogeneration system inlet 11 – 18 June 2010 ................................. 52
Figure 5.6.1 Malabar STP methane yield per unit volume of primary sludge at temperature 35 oC............................................... 58
Figure 5.6.2 Malabar STP methane yield per unit volume of primary sludge at volatile solids concentration 45 kgVS/m3............... 58
Optimised Biogas Production at Malabar STP M.Sc. (Renewable Energy) Dissertation Steven Mark Cowgill School of Engineering and Energy January 2011 Murdoch University
vii
List of Tables
Table 1.1.1 Electricity generated from sewage biogas in selected OECD countries during 2009 ............................................................ 2
Table 3.2.1 Biogas components......................................................................... 20
Table 3.4.1 Characteristics of stable mesophilic AD in single-stage sewage digesters ............................................................................ 23
Table 3.6.1 Effect of optimising techniques on sewage AD biogas volume and methane fraction .......................................................... 37
Table 5.5.1 Malabar STP anaerobic digester performance 11 – 18 June 2010 .......................................................................... 54
Table 5.6.1 Malabar STP maximum steady state biogas flow rate ..................... 55
Table 5.6.2 Malabar STP cogeneration system potential electrical output.............................................................................................. 56
Optimised Biogas Production at Malabar STP M.Sc. (Renewable Energy) Dissertation Steven Mark Cowgill School of Engineering and Energy January 2011 Murdoch University
viii
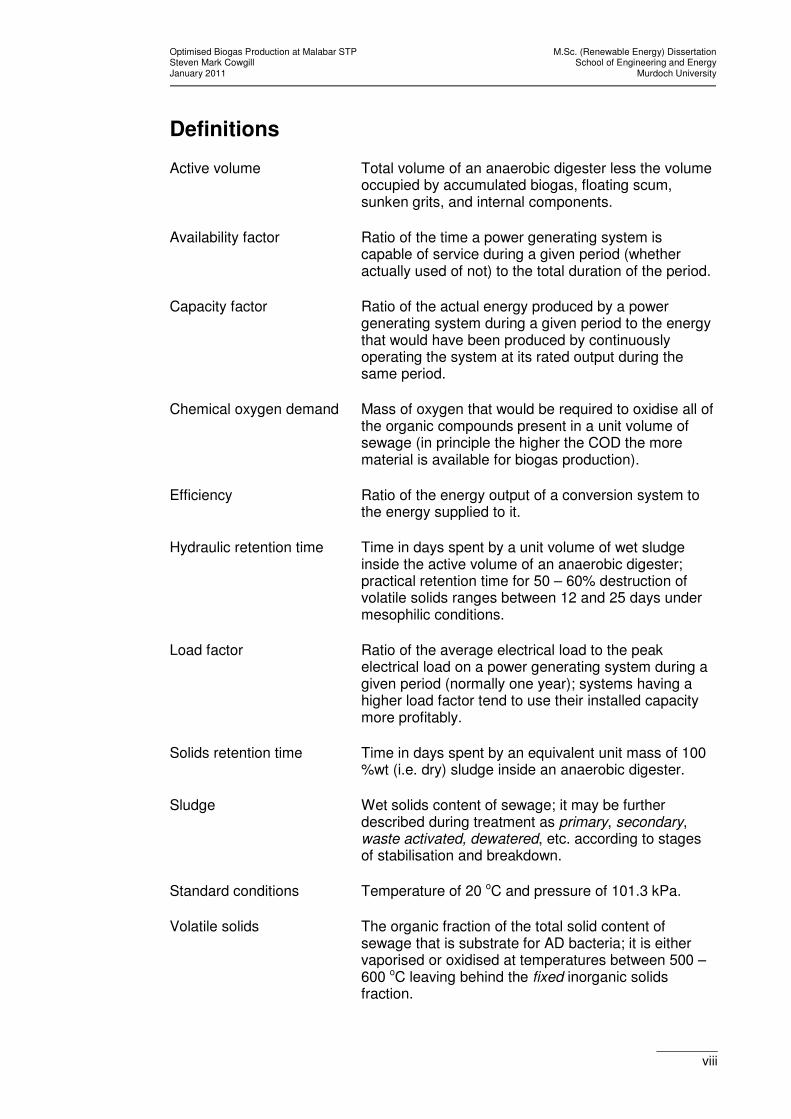
Definitions
Active volume Total volume of an anaerobic digester less the volume occupied by accumulated biogas, floating scum, sunken grits, and internal components.
Availability factor Ratio of the time a power generating system is capable of service during a given period (whether actually used of not) to the total duration of the period.
Capacity factor Ratio of the actual energy produced by a power generating system during a given period to the energy that would have been produced by continuously operating the system at its rated output during the same period.
Chemical oxygen demand Mass of oxygen that would be required to oxidise all of the organic compounds present in a unit volume of sewage (in principle the higher the COD the more material is available for biogas production).
Efficiency Ratio of the energy output of a conversion system to the energy supplied to it.
Hydraulic retention time Time in days spent by a unit volume of wet sludge inside the active volume of an anaerobic digester; practical retention time for 50 – 60% destruction of volatile solids ranges between 12 and 25 days under mesophilic conditions.
Load factor Ratio of the average electrical load to the peak electrical load on a power generating system during a given period (normally one year); systems having a higher load factor tend to use their installed capacity more profitably.
Solids retention time Time in days spent by an equivalent unit mass of 100 %wt (i.e. dry) sludge inside an anaerobic digester.
Sludge Wet solids content of sewage; it may be further described during treatment as primary, secondary, waste activated, dewatered, etc. according to stages of stabilisation and breakdown.
Standard conditions Temperature of 20 oC and pressure of 101.3 kPa.
Volatile solids The organic fraction of the total solid content of sewage that is substrate for AD bacteria; it is either vaporised or oxidised at temperatures between 500 – 600 oC leaving behind the fixed inorganic solids fraction.

Optimised Biogas Production at Malabar STP M.Sc. (Renewable Energy) Dissertation Steven Mark Cowgill School of Engineering and Energy January 2011 Murdoch University
ix
Abbreviations
%vol Percentage per unit volume of one component in a mixture of gases
%wt Percentage per unit mass of one component in a single- or multi-phase mixture of solid and liquid substances
oC Temperature in degrees Celsius
oC/d Maximum deviation of constant sludge temperature during 24 hours
∆% Percentage change in an initial quantity
AD Anaerobic digestion
AT Aerobic thermophilic
CAS Chemically assisted sedimentation
CH4 Methane gas
CO2 Carbon dioxide gas
COD Chemical oxygen demand
CSV Comma separated variable format (of raw data)
GWhE Gigawatt hour of electrical energy
GWhT Gigawatt hour of thermal energy
HRT Hydraulic retention time
kg/d Kilograms per day of mass flow rate
kg/m3 Kilograms of mass per cubic metre of volume
kgVS/m3 Kilograms of volatile solids per cubic metre of primary sludge volume
kgVS/m3/d Kilograms of volatile solids fed per day per cubic metre of digester volume
kGy Kilogray of absorbed dose by gamma irradiation
kHz Kilohertz of ultrasound frequency
kPa Kilopascals of absolute pressure
kPag Kilopascals of gauge pressure

Optimised Biogas Production at Malabar STP M.Sc. (Renewable Energy) Dissertation Steven Mark Cowgill School of Engineering and Energy January 2011 Murdoch University
x
kW Kilowatt of mechanical power
kWE Kilowatt of electrical power
kWhE Kilowatt hour of electrical energy
L/s Litres per second of liquid or gas flow at operating conditions
m3 Cubic metres of liquid or gas volume at operating conditions
m3/d Cubic metres per day of liquid of gas flow at operating conditions
m3/kgCOD Cubic metres of biogas or methane per kilogram of digested COD
m3/kgVS Cubic metres of biogas or methane per kilogram of digested VS
m3CH4/m
3 Cubic metres of methane per cubic metre of primary sludge
mg/L Milligrams concentration per litre in liquid solution
MHz Megahertz of microwave frequency
MJ/Nm3 Megajoules of energy per cubic metre of gas at standard conditions
ML/d Megalitres per day of liquid flow
MWE Megawatt of electrical power
OECD Organisation for Economic Cooperation and Development
OHPA Obligate hydrogen producing acetogen
P&ID Process and instrumentation diagram
s Seconds of time duration
SCADA Supervisory control and data acquisition (system)
SRB Sulphate reducing bacteria
SRT Solids retention time
STP Sewage treatment plant
SW Sydney Water
VFA Volatile fatty acid
VS Volatile solids
VSLR Volatile solids loading rate

Optimised Biogas Production at Malabar STP M.Sc. (Renewable Energy) Dissertation Steven Mark Cowgill School of Engineering and Energy January 2011 Murdoch University
1
1. Introduction
This section presents background information on sewage biogas and Malabar
Sewage Treatment Plant (STP) in order to set a context for later discussion of
findings from the literature review and survey of operating data.
1.1 Sewage Biogas
Biogas, a nominal mixture of 60 %vol methane and 40 %vol carbon dioxide,
produced by anaerobic digestion (AD) of sewage sludge in utility digesters, is
increasingly viewed as a valuable, renewable fuel for decentralised power
generation in urban areas. Power generation is usually accompanied by the
recovery of waste thermal energy from engine exhaust gases and cooling systems
and its use for process or district heating. Such an arrangement is known as a
biogas fired cogeneration system.
In the past sewage biogas has been neglected as a fuel source. To demonstrate
this, Table 1.1.1 compares total and per capita electricity generated from sewage
biogas in selected OECD countries with their total electricity generated during 2009.
These two data sets were derived from the sources listed below Table 1.1.1.
Germany leads this field and the world by generating 13 kWhE per capita from
sewage biogas, or roughly 0.2% of total annual electricity consumption. Australia
currently generates about 6 kWhE per capita.
In 2009 Germany had 1,893 MWE of stationary generating capacity operating on
biogas derived from sewage and energy crops (mostly from the latter) and had
under construction 1,093 new biogas fired generators of total capacity 516 MWE
(EurObserv’ER 2010). As well as being used in a relatively raw form for generating
electricity, purified biogas is sold as a vehicle fuel and also added to the piped
natural gas supply across northern Europe. Purifying biogas involves chemical

Optimised Biogas Production at Malabar STP M.Sc. (Renewable Energy) Dissertation Steven Mark Cowgill School of Engineering and Energy January 2011 Murdoch University
2
treatment to remove carbon dioxide and trace contaminants, compression to
increase energy density, and refrigeration to remove moisture.
Table 1.1.1 Electricity generated from sewage biogas in selected OECD countries during 2009
Country
Total electricity generated (GWhE)
[1]
Electricity generated
from sewage biogas
(GWhE) [3]
Population [1]
Electricity from sewage biogas per
capita (kWhE)
Percent of total
electricity from sewage
biogas (%)
Germany 547,000 1,057 82,217,800 12.9 0.19
Luxembourg 6,500 6 497,500 12.1 0.09
United Kingdom 345,000 638 60,587,000 10.5 0.18
Netherlands 124,000 150 16,639,800 9.0 0.12
Czech Republic 62,000 83 10,256,700 8.1 0.13
United States 3,873,000 2,400 [4] 310,232,800 7.7 0.06
Denmark 34,300 38 5,515,500 6.8 0.11
Australia 222,000 125 [2] 21,515,000 5.8 0.06
Austria 68,300 39 8,214,100 4.7 0.06
Poland 129,300 123 38,463,700 3.2 0.10
Sweden 134,500 19 9,074,100 2.1 0.01
France 447,000 45 63,601,000 0.7 0.01
Italy 315,000 20 59,715,600 0.3 0.01
(Sources: [1] Central Intelligence Agency 2010, [2] Clean Energy Council of Australia 2010, [3] EurObserv’ER 2010, [4] United States Energy Information Administration 2010)
Australia has a total of about 40 MWE of stationary capacity that generates about
125 GWhE from sewage biogas (Clean Energy Council of Australia 2010). This is
forecast to increase by 2020 to about 900 GWhE generated from about 120 MWE of
total stationary capacity (Clean Energy Council of Australia 2008). Sewage biogas
is classed as a renewable energy source in the legislation governing Australia’s
mandatory renewable energy target, but its useful conversion is rare, and is limited
to a few larger STPs in the major metropolitan areas.
There are novel examples in Australia of small generators operating on non-sewage
biogas (from animal manures and organic process wastes) but data on their
individual capacities and performance are not generally available.
Optimised Biogas Production at Malabar STP M.Sc. (Renewable Energy) Dissertation Steven Mark Cowgill School of Engineering and Energy January 2011 Murdoch University
3
1.2 Sydney Water
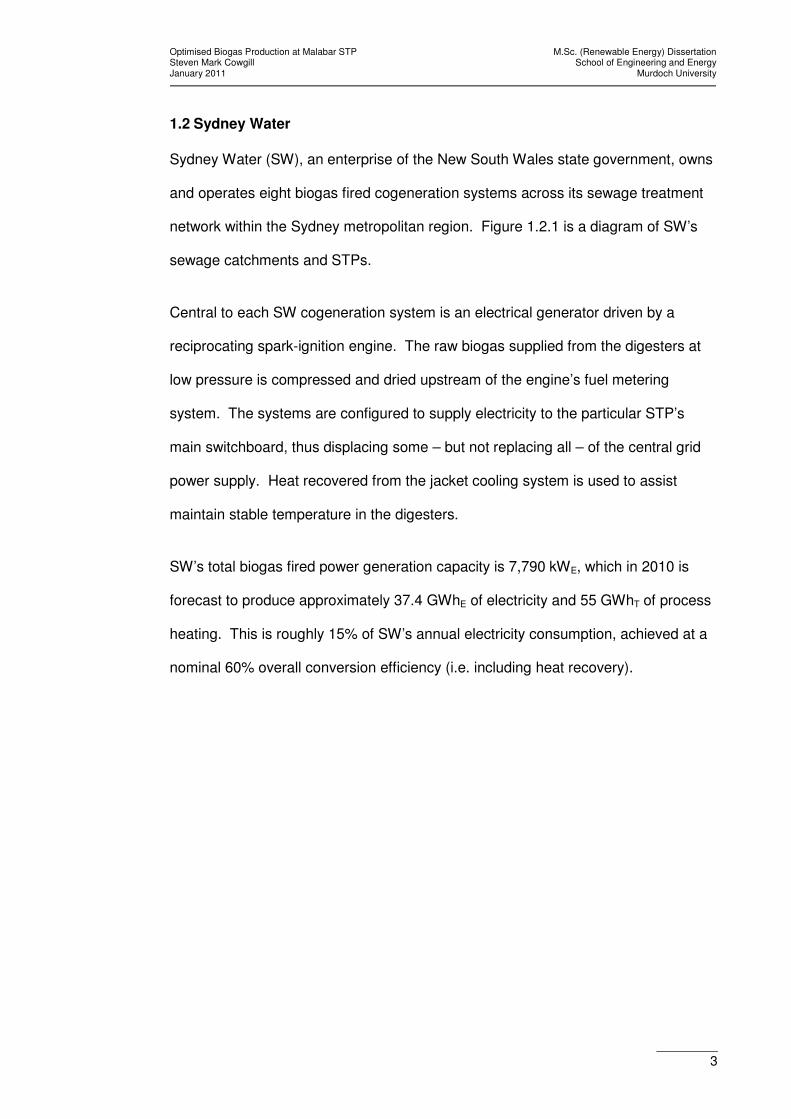
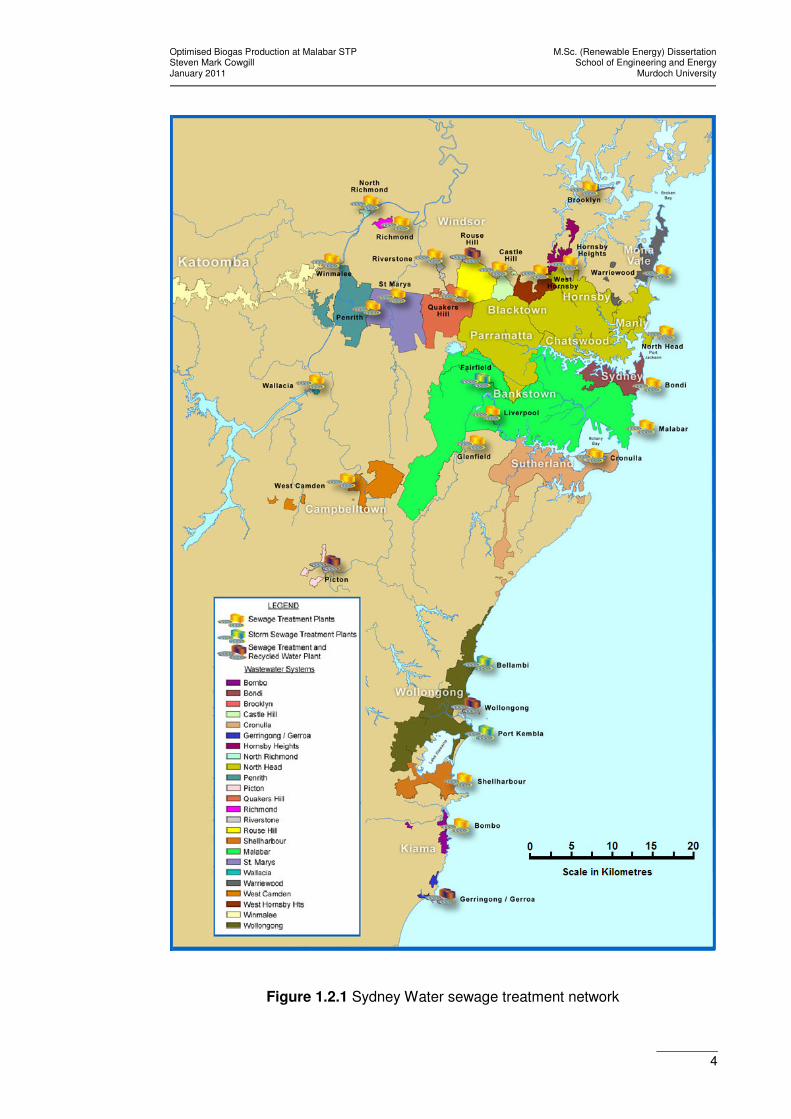
Sydney Water (SW), an enterprise of the New South Wales state government, owns
and operates eight biogas fired cogeneration systems across its sewage treatment
network within the Sydney metropolitan region. Figure 1.2.1 is a diagram of SW’s
sewage catchments and STPs.
Central to each SW cogeneration system is an electrical generator driven by a
reciprocating spark-ignition engine. The raw biogas supplied from the digesters at
low pressure is compressed and dried upstream of the engine’s fuel metering
system. The systems are configured to supply electricity to the particular STP’s
main switchboard, thus displacing some – but not replacing all – of the central grid
power supply. Heat recovered from the jacket cooling system is used to assist
maintain stable temperature in the digesters.
SW’s total biogas fired power generation capacity is 7,790 kWE, which in 2010 is
forecast to produce approximately 37.4 GWhE of electricity and 55 GWhT of process
heating. This is roughly 15% of SW’s annual electricity consumption, achieved at a
nominal 60% overall conversion efficiency (i.e. including heat recovery).
Optimised Biogas Production at Malabar STP M.Sc. (Renewable Energy) Dissertation Steven Mark Cowgill School of Engineering and Energy January 2011 Murdoch University
4
Figure 1.2.1 Sydney Water sewage treatment network

Optimised Biogas Production at Malabar STP M.Sc. (Renewable Energy) Dissertation Steven Mark Cowgill School of Engineering and Energy January 2011 Murdoch University
5
1.3 Malabar STP
Malabar STP began operating in the 1950s and has been expanded in stages since
then. It processes an average dry weather flow of 477 ML/d of raw sewage by high
rate primary separation, anaerobic sludge digestion, and deep water ocean
dispersion of the treated effluent. The influent enters from two trunk mains
(SWSOOS 1 and 2) handling the domestic, commercial, and industrial liquid wastes
of an urban population of about 1.7 million people across south western Sydney.
Figure 1.3.1 is a process flow diagram showing the treatment stages and by-
products at Malabar STP. The influent is first screened to remove bulk solid
contaminants such as sticks, rags, and plastics before hard particulates known as
grits are removed by cyclonic separators. The influent is then pumped into large
sedimentation tanks in which the flow velocity is lowered such that the suspended
solids (≤1 %wt at this point) settle under gravity to form primary sludge at the bottom
of the tanks. Contaminant oils, fats, and greases float to the surface of the
sedimentation tanks and are removed by scum scrapers.
The primary sludge (now approximately 4 %wt of solids) is pumped to the anaerobic
digesters. The balance of the treated effluent gravitates into the ocean outfall
system where it diffuses from seabed nozzles at a depth of 80 m. Screenings, grits,
and separated scum are dewatered and trucked to offsite landfill. Finally, digested
sludge is pumped from the bottom of the digesters, then dewatered by centrifuge
into its final form (known as “biosolids”) and sold as a soil conditioner.
There are three partly-buried anaerobic digesters of total volume 35,000 m3 and a
digested sludge storage tank of 4,500 m3 that supplies the biosolids plant. In each
digester biogas released from the digesting sludge is collected in a cover that floats
on the sludge; sealing the biogas and rising or falling under steady pressure.

Optimised Biogas Production at Malabar STP M.Sc. (Renewable Energy) Dissertation Steven Mark Cowgill School of Engineering and Energy January 2011 Murdoch University
6
Figure 1.3.1 Malabar STP process flow diagram

Optimised Biogas Production at Malabar STP M.Sc. (Renewable Energy) Dissertation Steven Mark Cowgill School of Engineering and Energy January 2011 Murdoch University
7
Some of the raw biogas is drawn off from the cover, compressed, and re-injected
throughout each digester to continuously mix the sludge. Mixing is also done by
recirculating the sludge through external heat exchangers that maintain the digester
temperature. The heat exchangers are heated either by cooling water from the
cogeneration system or by back-up biogas burners.
Some of the recirculated sludge is directed at breaking up the floating scum layer
that otherwise hinders biogas release into the digester cover (and also reduces the
active volume of the digester). Any biogas excess to the net flow drawn off by the
cogeneration system is flared.
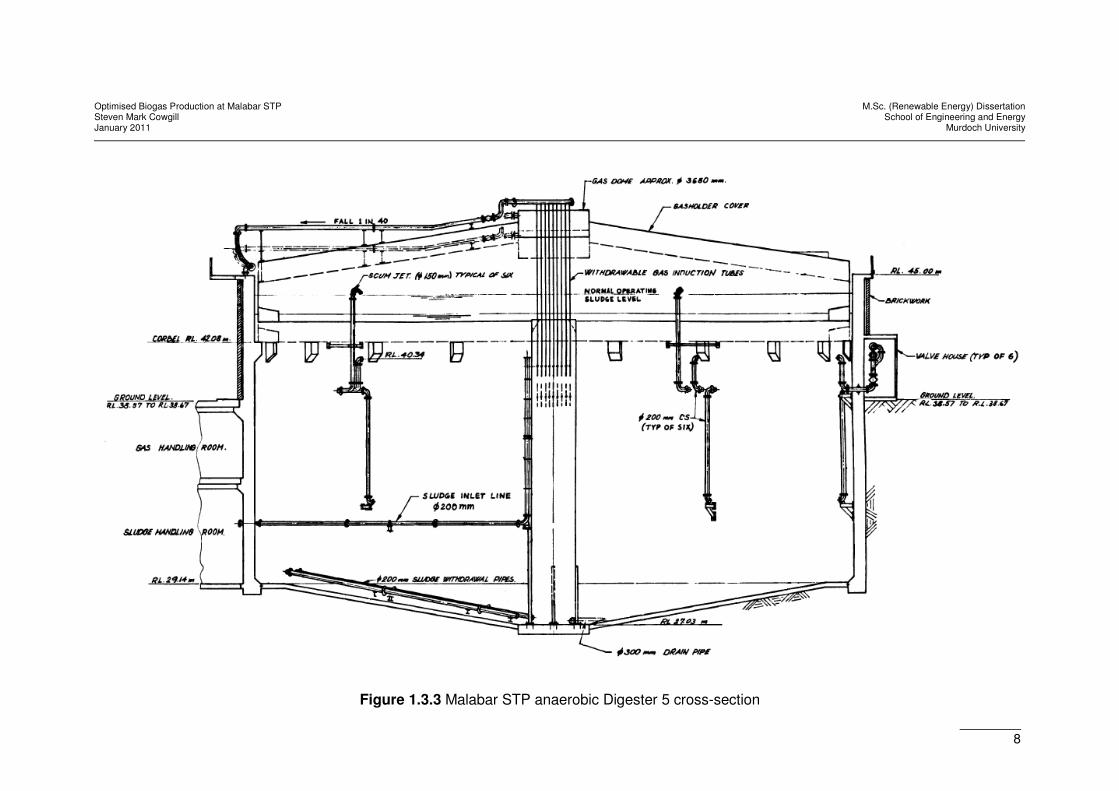
Figure 1.3.2 is a photograph of the floating cover of Digester 3 and its biogas
pipework. Figure 1.3.3 is a cross-sectional elevation view of Digester 5 showing the
internal sludge recirculation pipework, scum-breaking jets, floating cover, and
external biogas recirculation pipework. The floating cover is shown in its maximum
upper and minimum lower (resting on the internal corbels) positions. The normal
range of the digesting sludge surface level is also shown.
Figure 1.3.2 Malabar STP anaerobic Digester 3
Optimised Biogas Production at Malabar STP M.Sc. (Renewable Energy) Dissertation Steven Mark Cowgill School of Engineering and Energy January 2011 Murdoch University
8
Figure 1.3.3 Malabar STP anaerobic Digester 5 cross-section
Optimised Biogas Production at Malabar STP M.Sc. (Renewable Energy) Dissertation Steven Mark Cowgill School of Engineering and Energy January 2011 Murdoch University
9
The solids retention time (SRT) of the digesters is 15 – 19 days depending on the
day-to-day flow rate and solids content of the influent (Sydney Water 2004).
Upstream treatment processes, as described above, can also change the solids
load entering the digesters.
The primary sludge is fed by continual partial batching into the digester’s external
heating circuit, where a small volume of fresh sludge (at ambient temperature) is
regularly added to offset periodic removal of digested sludge (at the operating
temperature of nominally 35 oC) from the conical base of the digester.
The aim of digester operation is to feed enough fresh sludge to sustain the bacterial
colony inside, but to not overload it or cause thermal shock. At the same time the
primary sludge feed must balance with the average solids settling rate of newly
arrived influent in the sedimentation tanks and with the rate of digested sludge
removal from each digester. Finally, the digested sludge must meet licence
conditions on organic content and must be removed slowly enough to avoid washing
out more of the bacterial colony than can be replaced within the hydraulic retention
time (HRT) that is imposed by the digester’s active volume and the feed rate of
primary sludge.
Any two or all three of the Malabar STP digesters may be operated either in parallel,
where the whole digestion process occurs simultaneously in their combined volume,
or in series, where staged digestion at different temperatures is possible.
Malabar STP has a chemically-assisted sedimentation (CAS) dosing plant which
adds ferric chloride to the influent at the grit separation stage. This polymerises the
fine particles of organic solid into aggregates that have higher settling rates, thus
tending to increase the mass of sludge recovered in the sedimentation tanks and so

Optimised Biogas Production at Malabar STP M.Sc. (Renewable Energy) Dissertation Steven Mark Cowgill School of Engineering and Energy January 2011 Murdoch University
10
available for digester feeding. It is rarely necessary to use CAS in order to meet
Malabar STP’s license limit on total solids in the effluent.
1.4 Cogeneration system
The cogeneration system at Malabar STP was commissioned in 1999. It consists of
three reciprocating engine driven generators having a continuous rated capacity of
975 kWE each, giving a total capacity of 2,925 kWE compared with the maximum site
electrical load of about 3,600 kWE. The system supplies around 12.4 GWhE per
annum, or approximately 40% of Malabar STP’s annual electricity consumption.
Figure 1.4.1 is a photograph of the cogeneration system engines (inside their
acoustic enclosures).
Figure 1.4.1 Malabar STP cogeneration system engines

Optimised Biogas Production at Malabar STP M.Sc. (Renewable Energy) Dissertation Steven Mark Cowgill School of Engineering and Energy January 2011 Murdoch University
11
Figure 1.4.2 is a simplified SCADA output screen showing major components of the
cogeneration system.
Raw biogas is drawn from the anaerobic digesters to the cogeneration system by a
variable speed, positive displacement blower. Before entering the blower the
biogas passes through a water separator, a refrigerated dryer, and a particulate filter.
The compressed, dried, and filtered biogas is briefly stored in an anti-surge vessel
that absorbs flow and pressure variations, and then reheated if necessary before
entering the common fuel manifold where it is individually metered to each engine.
The blower attempts to maintain digester cover pressure between control set points
of 2.2 and 2.6 kPag. Below this range the cogeneration system automatically sheds
electrical load in order to leave biogas in the digester and so raise the pressure.
Above this range the electrical load is increased to capacity to remove biogas and
lower the pressure. Sludge level in each digester also varies independently of the
rate of biogas removal, and so affects the cover position.
If the flow of biogas exceeds the cogeneration system’s firing capacity then the
digester sludge heaters (first) and the waste biogas flares (second) are
automatically started to dispose of the excess.
Heat removed by the engine’s jacket cooling system is transferred to the digester
sludge heating circuits, thus making available further biogas for electricity generation
by reducing the thermal load on the biogas-fired sludge heaters.

Optimised Biogas Production at Malabar STP M.Sc. (Renewable Energy) Dissertation Steven Mark Cowgill School of Engineering and Energy January 2011 Murdoch University
12
Figure 1.4.2 Malabar STP cogeneration system block diagram

Optimised Biogas Production at Malabar STP M.Sc. (Renewable Energy) Dissertation Steven Mark Cowgill School of Engineering and Energy January 2011 Murdoch University
13
2. Research Questions
The 2,975 kWE rated cogeneration system rarely generates at a load of more than
2,300 kWE either for a lack of biogas, low methane content of the biogas, or both.
To reflect this situation in monthly performance reporting the system’s target load
factor is 66%; which is equivalent to a continuous or rolling average load of about
1,900 kWE over a given period.
The inability to run the cogeneration system at its rated capacity means that up to
1,000 kWE (based on the target load factor) of additional grid electricity must be
imported at a relatively higher unit energy cost in order to maintain treatment
operations.
It was initially planned that this research would consider broad questions about the
way Malabar STP digesters could be operated so that potentially conflicting time
profiles of sludge loading, lagging biogas output, digester heat loading, plant
electrical demand, peak energy tariffs (ideally to be avoided by cogeneration of
electricity), and digester SRT would be balanced for best overall plant performance.
Due to their complexity answers to such a question were soon found to be beyond
the more limited scope of optimising biogas production – considering the time and
resources available to complete the project.
The focus of this research then became to identify ways to increase the load factor
of the fuel-constrained cogeneration system, or in other words; to consider how
Malabar STP could make more biogas, containing more methane, more of the time.
This research was framed by following specific questions about biogas formation
within the anaerobic digesters at Malabar STP:

Optimised Biogas Production at Malabar STP M.Sc. (Renewable Energy) Dissertation Steven Mark Cowgill School of Engineering and Energy January 2011 Murdoch University
14
i) What are the most viable means, including plant modifications or use of
additional equipment, to achieve higher rates of biogas production within
the overall constraints presented by Malabar’s primary functions as a
sewage treatment plant?
ii) What factors limit the maximum rate of biogas production by AD of a
given sewage flow?
iii) What is the maximum sustained rate at which biogas could be produced
at Malabar STP?
iv) What factors affect the ratio of methane to carbon dioxide in sewage
biogas and how can these factors be optimised at Malabar STP?
v) How does biogas production at Malabar STP compare with benchmark
performance data on AD of sewage sludge?
The overall aim of the research was to recommend ways to improve the
performance of the Malabar STP cogeneration system by answering these five
questions.

Optimised Biogas Production at Malabar STP M.Sc. (Renewable Energy) Dissertation Steven Mark Cowgill School of Engineering and Energy January 2011 Murdoch University
15
3. Literature Review
3.1 Anaerobic digestion
Anaerobic digestion is the process by which complex biodegradable organic matter
is broken down by groups of co-dependent bacteria in the absence of free oxygen.
It occurs in natural ecosystems and has been used for centuries to stabilise and
concentrate organic wastes from human civilisation. AD is particularly well-suited to
waterborne wastes such as sewage and animal manures due to the ease with which
bacterial colonies can transport and expand within a mixed fluid medium, and the
simplicity of systems for storage and transfer of fluid wastes.
AD has seen a revival of interest in recent decades in response to environmental
threats from large and increasing volumes of sewage (Ahring 2003, Weiland 2010)
and the simultaneous need to reduce the cost of its treatment. The concern of water
utilities has historically been to stabilise the solids content in the waste water stream
and to safely flare AD biogas – which until recently was considered to be a nuisance
by-product. Other benefits of AD such as the potential for biogas power generation
and the lower lifecycle cost of AD digesters (compared with aerobic or activated
types) have received much less attention in the past.
The anaerobic stabilisation of sewage sludge has the following objectives (Sydney
Water 2007):
i) Reduction in pathogens.
ii) Inhibition / reduction in the potential for sludge putrification.
iii) Elimination of offensive odours.
iv) Reduced mass of organic solids for disposal.
v) Energy recovery by the production and utilisation of methane.

Optimised Biogas Production at Malabar STP M.Sc. (Renewable Energy) Dissertation Steven Mark Cowgill School of Engineering and Energy January 2011 Murdoch University
16
In spite of its ancient use and widespread application, the detailed microbiology of
AD is still to be fully understood due to the difficulty of using traditional culturing
methods to isolate particular anaerobic bacteria and identify their role in active
colonies. These gaps in knowledge sometimes result in inexplicable digester
failures today, even after long periods of stable operation (Weiland 2010). In the
last 20 years molecular and biochemical techniques have been developed (Kuang
2002) that have greatly improved characterisation of microbial communities and the
scope for their optimisation in anaerobic digesters.
3.2 Microbiology of anaerobic digestion
AD is most reactive in two temperature ranges; mesophilic AD occurs between 32 –
38 oC with the optimal temperature being around 35 oC, while thermophilic AD
occurs in the range 60 – 75 oC. In both mesophilic and thermophilic AD three stages
of decomposition may be distinguished: hydrolysis, acidification, and
methanogenesis. Some researchers include as a fourth stage the process of
acetogenesis – an alternate but parallel route by which up to 70% of substrates from
the acidification stage may be converted to methane (Kuang 2002, O’Flaherty et al.
2006). A simplified description of what is known about the four stages is given
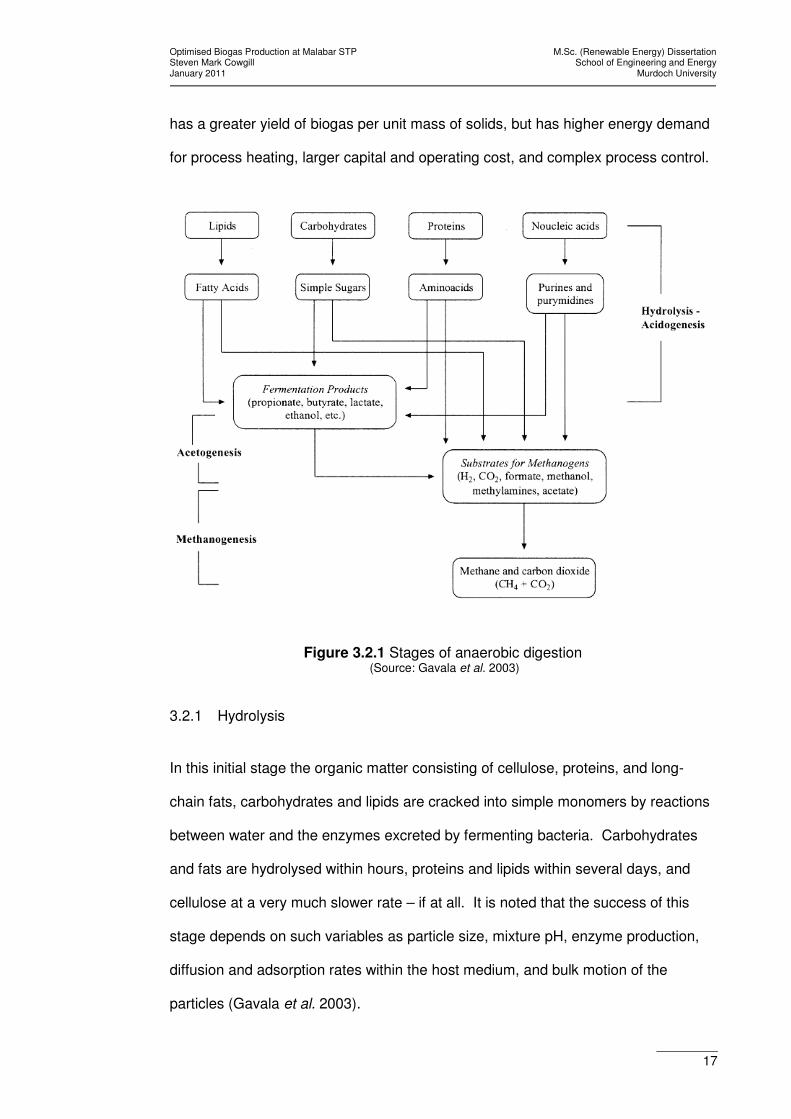
below (Kuang 2002, Deublein and Steinhauser 2008). Figure 3.2.1 is a diagram of
the overall process.
It is important to note that all stages of anaerobic digestion must proceed at the
same time, but that each stage has a different range of kinetic constants (Gavala et
al. 2003).
Discussion here is concerned with mesophilic AD as used at Malabar STP. It is
noted in passing that thermophilic AD digests more organic solids in less time and
Optimised Biogas Production at Malabar STP M.Sc. (Renewable Energy) Dissertation Steven Mark Cowgill School of Engineering and Energy January 2011 Murdoch University
17
has a greater yield of biogas per unit mass of solids, but has higher energy demand
for process heating, larger capital and operating cost, and complex process control.
Figure 3.2.1 Stages of anaerobic digestion (Source: Gavala et al. 2003)
3.2.1 Hydrolysis
In this initial stage the organic matter consisting of cellulose, proteins, and long-
chain fats, carbohydrates and lipids are cracked into simple monomers by reactions
between water and the enzymes excreted by fermenting bacteria. Carbohydrates
and fats are hydrolysed within hours, proteins and lipids within several days, and
cellulose at a very much slower rate – if at all. It is noted that the success of this
stage depends on such variables as particle size, mixture pH, enzyme production,
diffusion and adsorption rates within the host medium, and bulk motion of the
particles (Gavala et al. 2003).

Optimised Biogas Production at Malabar STP M.Sc. (Renewable Energy) Dissertation Steven Mark Cowgill School of Engineering and Energy January 2011 Murdoch University
18
3.2.2 Acidification
In the second stage the monomers formed during hydrolysis are converted to short
chain, organic volatile fatty acids (VFA including butyric, proprionic, and acetic
acids), acetate, alcohols, hydrogen, and carbon dioxide. The concentration of
hydrogen ions formed during this stage influences the simultaneous production of
acetate: the higher the partial pressure of hydrogen in the bacterial colony, the less
acetate is produced. The effect of hydrogen partial pressure is also understood to
be critical in determining the route of interdependent methane formation taken
during the final methanogenesis stage and in maintaining the overall thermodynamic
viability of the digestion process (Kovács et al. 2005, Deublein and Steinhauser
2008). Factors affecting the hydrogen ion concentration during acidification are not
yet clear (Demirel and Scherer 2008). Acidifying bacteria are known to metabolise
rapidly, typically reproducing within 4 – 12 hours and requiring a retention time of 6
days or less (Sydney Water 2007).
3.2.3 Acetogenesis
A portion of the products of the acidification stage may be further oxidised to acetate,
hydrogen, and carbon dioxide by bacteria known as obligate hydrogen producing
acetogens (OHPA). The metabolism of OHPA is only viable when the partial
pressure of hydrogen in the colony is lowered by the simultaneous growth of
hydrogen-utilising methanogens, sulphate-reducing bacteria (SRB) which compete
with them, or homoacetogens; all of which consume hydrogen produced by the
acetogens (O’Flaherty et al. 2006).
Problems with stable methane production from operating digesters tend to arise
during acetogenesis, when faster-growing and less sensitive microbes, in particular
SRB which are present in all digesters, may get the upper hand - leading to reduced
Optimised Biogas Production at Malabar STP M.Sc. (Renewable Energy) Dissertation Steven Mark Cowgill School of Engineering and Energy January 2011 Murdoch University
19
pH, the formation of odorous hydrogen sulphide rather than methane, and ultimate
collapse of the anaerobic colony.
3.2.4 Methanogenesis
The final stage sees conversion of remaining substrates to methane and carbon
dioxide, plus traces of hydrogen sulphide, nitrous oxide, and other gases. There are
two groups of methanogenic bacteria (O’Flaherty et al. 2006). The first are
hydrogenophillic or hydrogenotrophic species which form methane by the reduction
of hydrogen and carbon dioxide. The second are acetoclastic or acetotrophic
species, which generate methane by acetate decarboxylation. The share of
methane generated by each species is determined by the exact reaction path of the
substrate through the previous three stages and on the success of interspecies
hydrogen transfer during acetogenesis. Stable methanogenesis requires between 4
– 10 days for the bacteria to reproduce and between 12 – 35 days for digestion to
complete.
At a molecular scale, the fraction of methane produced in this final stage is currently
thought to be determined by the concentration of hydrogen ions available for
interspecies transfer (Bagi et al. 2007). The final composition of sewage biogas has
a typical methane fraction of between 50 – 70 %vol. Other components and their
effect on biogas properties are as listed in Table 3.2.1.

Optimised Biogas Production at Malabar STP M.Sc. (Renewable Energy) Dissertation Steven Mark Cowgill School of Engineering and Energy January 2011 Murdoch University
20
Table 3.2.1 Biogas components
(Source: Deublein and Steinhauser 2008)
3.2.5 Inhibiting and rate limiting factors
Methanogenesis is generally considered to be the foremost rate limiting stage in AD
owing to the inherently slow growth rate of methanogenic bacteria, even under ideal
conditions. Methanogens are also highly sensitive to rapid changes in process
conditions, namely; organic loading rate, digested sludge removal rate, solids
particulate size distribution, exposure to light, digester temperature, and pH.
Intermediate AD products such as volatile fatty acids, hydrogen sulphide, ammonia,
any chlorinated hydrocarbons, and heavy metals (above certain minimum and
necessary concentrations) are all known to be toxic to methanogenic bacteria
(Gavala et al. 2003). In addition some of the organic substrates in primary sludge
that are consumed by AD can themselves be inhibitory at high concentration.
Optimised Biogas Production at Malabar STP M.Sc. (Renewable Energy) Dissertation Steven Mark Cowgill School of Engineering and Energy January 2011 Murdoch University
21
Some researchers claim that hydrolysis is the ultimate limiting step because it “is
limited by the restricted accessibility of the extracellular enzymes produced by the
hydrolysing bacteria to the intracellular polymeric materials which are protected by
cell membranes” (Cui and Jahng 2006, p531).
3.3 Design of sewage sludge digesters
Malabar STP digesters are of the single-stage, high rate design that is most
common in modern centralised mesophilic AD systems. In this design all four
stages of AD are made to occur in the same enclosed volume of sludge.
Development of this design and its variants began in the 1960s based on earlier
anaerobic methods such as open lagoons and septic tanks (Haandel et al. 2006).
Advances in the design reflected better awareness of AD as a process, and included
vigorous sludge mixing to improve exchange between bacterial species, separation
of the primary sludge inlet and the digested sludge outlet in order to increase and
even out SRT, improved sludge feed rate control, and external sludge heating to
maintain mesophilic conditions in the digester.
The major alternative to this design in anaerobic systems is the multi-stage, high
rate digestion process train that has been found suitable for both mesophilic and
(more often) thermophilic AD, especially when the influent has unusually high
chemical oxygen demand (COD) (Haandel et al. 2006). In this design the initial
hydrolysis and secondary acidification stages occur separately in a single tank,
sometimes in the thermophilic AD temperature range in order to increase the rate of
these reactions. The partially digested sludge is then transferred into a second and,
sometimes, third tank for the acetogenesis and methanogenesis stages. Difficulties
arise in limiting SRT to prevent methane formation in the first tank, and in judging
the point at which the contents of the first tank should be transferred out to begin
acetogenesis.
Optimised Biogas Production at Malabar STP M.Sc. (Renewable Energy) Dissertation Steven Mark Cowgill School of Engineering and Energy January 2011 Murdoch University
22
The process and mechanical design of high rate digesters is normally based on a
combination of hydraulic retention time (HRT) and either COD (Batstone 2006) or
volatile solids (VS) loading using empirical data from previous designs. A number of
researchers observe that this practice has led to digesters that are “mostly operated
as black boxes, taking the effluent concentration as an output value that cannot be
improved… the [digester] control strategy [does] not generally take into account
processes occurring at the microorganism level” (O’Flaherty et al. 2006, p39).
Anaerobic digesters are easily imbalanced causing terminal increases in the
concentration of organic acids (Stamatelatou et al. 1997). As noted earlier, modern
techniques for characterising anaerobic communities permit more accurate
modelling of AD (Kuang 2006, O’Flaherty et al. 2006) and should ultimately lead to
more precise plant design and operation.
3.4 Estimating biogas methane yield
The volumetric biogas yield and energy content (i.e. methane fraction) from sewage
sludge AD is normally estimated by empirical methods. These methods are based
on measurement of actual COD or VS in the influent and on some knowledge of the
volume of biogas historically produced per unit mass of COD or VS reduction
occurring either within that digester or others of a similar design. Biogas yield at
new plants is normally inferred from similar existing installations rather than
calculated explicitly. Using this method always assumes a range of methane
fraction; unless it too is inferred from past measurements. From the discussion of
AD stability in Section 3.2 it may be appreciated that empirical estimates of sewage
biogas yield can be wildly inaccurate.
Table 3.4.1 shows benchmark ranges for certain parameters that are characteristic
of stable operation in single-stage mesophilic sewage digesters.

Optimised Biogas Production at Malabar STP M.Sc. (Renewable Energy) Dissertation Steven Mark Cowgill School of Engineering and Energy January 2011 Murdoch University
23
Table 3.4.1 Characteristics of stable mesophilic AD in single-stage sewage digesters
Parameter Units Range
Sludge temperature oC 32 – 38
Sludge temperature change oC/d ≤ 0.5
Biogas yield m3/kgVS 0.75 – 1.10
Methane yield m3/kgVS 0.35 – 0.60
pH - 6.8 – 7.2
Alkalinity Mg/L 2000 – 5000
VFA Mg/L 25 – 200
VFA / Alkalinity ratio - 0.01 – 0.05
VSLR kgVS/m3/d 1.6 – 4.8
Influent solids concentration %wt 5 – 6
VS fraction of influent solids % 60 – 85
VS reduction %wt 50 – 60
(Sources: Sydney Water 2007, Taricska et al. 2007, Deublein and Steinhauser 2008)
Mathematical modelling of AD has advanced during the last 20 years (Batstone
2006, Gerber and Span 2008) into generalised, dynamic, high order non-linear,
physicochemical models that consider substrate chemistry, mass transfer, fluid
motion, and reaction thermodynamics of each AD stage, and which do not
necessarily need to be validated on a particular digester. In 2001 a project team of
the International Water Association published an authoritative computational routine
known as Anaerobic Digestion Model No. 1 (International Water Association 2010).
The objective in developing such models has been to better understand and
improve the performance of AD for any given organic substrate, particularly at the
design stage of new industrial digesters. Modelling has gained fresh impetus during
the last 5 – 10 years with wider appreciation of the low cost and potential energy
yield of AD.
These elaborate models are noted here for future reference. Their application in
forecasting effects on Malabar STP biogas yield and methane content of the
optimising techniques reviewed in Section 3.5 is beyond the scope of this research.

Optimised Biogas Production at Malabar STP M.Sc. (Renewable Energy) Dissertation Steven Mark Cowgill School of Engineering and Energy January 2011 Murdoch University
24
Instead, a simplified steady-state model developed for AD of slurried pig manure
(Chen 1983) and adapted to sewage sludge was used to estimate a theoretical
maximum biogas flow rate at Malabar STP (refer Section 4.4.3).
SW has previously licensed the STOAT and BioWin dynamic simulation software for
modelling and diagnosis of treatment processes. But the cost and heavy data
requirements of the verification process for this software inhibited their use by
operators and designers alike, and SW ceased renewing its licenses in 1999
(Sydney Water 2009a).
3.5 Techniques to increase biogas volume and methane yield
This section reviews published research on a range of methods for increasing both
the overall volume of biogas generated by sewage sludge AD and the methane
content of the biogas. Methods tend to fall into three categories:
i) Pre-treatment of primary sludge.
ii) Modifying the composition of primary sludge.
iii) Improved control of digestion processes.
The potential increases in volume and methane content that could be expected from
each technique is stated. This together with some practical considerations forms a
basis to compare of the viability of these techniques at Malabar STP.
3.5.1 Comments on CH4/CO2 ratio
Before discussing ways to optimise methane content it is appropriate to consider
why sewage biogas from AD is not 100 %vol methane. This research found it well
established in the literature that the total redox potential of the AD colony controls
the CH4/CO2 ratio (Pind et al. 2003). During methanogenesis the reduction of

Optimised Biogas Production at Malabar STP M.Sc. (Renewable Energy) Dissertation Steven Mark Cowgill School of Engineering and Energy January 2011 Murdoch University
25
carbon by hydrogen to yield methane (preferred for power generation), rather than
the oxidation of carbon to yield carbon dioxide, relies on the availability of hydrogen.
Ultimately, the different kinetic rates of simultaneous AD stages always dictate that
limited hydrogen is available for the reduction reaction.
Digester pH and alkalinity control the evaporation of carbon dioxide and so affect the
CH4/CO2 ratio of biogas leaving a digester, but only in that more or less of the
carbon dioxide that is actually produced remains dissolved.
The CH4/CO2 ratio of biogas may be increased by allowing more time for digestion
(longer SRT), by the presence of long chain hydrocarbons rich in fats (up to a limit at
which these begin to interfere with pumping and mixing), and by increasing the
digester pressure and liquid content (Deublein and Steinhauser 2008). Increased
digester pressure and liquid content both result in a higher concentration of
dissolved carbon dioxide removed with the liquid digestate. However, pressure
increases in an existing digester generally lead to loss of biogas through increased
cover seal leakage, and greater liquid content has the negating effect of reduced
solids content available for digestion.
3.5.2 Thermal pre-treatment and solar-assisted heating
Thermal pre-treatment or hydrolysis of primary sludge is one of numerous pre-
digestion processes that aim to rupture the cell membranes of long-chain polymer
molecules; releasing the more easily digested organic material contained inside.
This increases the rate of VS break down by AD; reducing the mass of residual
sludge, and converting more of the VS to biogas. In thermal hydrolysis the primary
sludge is artificially heated under pressure and “soaked” before it is fed to the
digester. Soaking temperatures in the range 160 – 180 oC at pressures of 500 – 700

Optimised Biogas Production at Malabar STP M.Sc. (Renewable Energy) Dissertation Steven Mark Cowgill School of Engineering and Energy January 2011 Murdoch University
26
kPag are common for soaking periods of 30 – 60 minutes. Thermal pre-treatment
may be applied to all or part of the sludge flow.
The method is the basis of several commercial technologies, the best known of
which are the proprietary CAMBI and BioThelys processes (Water Environment
Research Foundation 2008) that are applied to the whole sludge flow. Both have
been implemented at existing European STPs and both have resulted in significant
increases in the volume of AD biogas (in the order of 50%). Both have the
disadvantages of significantly increased process complexity and energy
consumption, and the requirement to dewater primary sludge before it is heated.
Both are claimed by their proprietors to produce a net energy gain when the
increased biogas production is accounted for – a claim that is disputed by some
researchers (Ahring 2003).
Process heating of sewage sludge using solar concentrators has been considered
as a way to reduce the quantity of biogas that is drawn off and used to maintain
digester temperature. During the 1980s the United States Environmental Protection
Agency made a detailed analysis of solar heating primary sludge anaerobic
digesters at STPs of capacity 37.8 ML/d using flat-plate collectors in nine US cities
(USEPA 1982). The present worth of conserved biogas was compared to the
present worth of the solar energy collection system. This study found that solar
heating was uneconomical at any scale over any period at any location. In then-
current dollars the unitised heating system cost was approximately three times that
necessary to make the system worthwhile (USEPA 1982).
In more recent work Axaopoulos et al. built an experimental solar heated anaerobic
digester of 45 m3 active volume, successfully operated it at a relatively highly
insolated location (in Greece), and with the results validated a TRNSYS simulation

Optimised Biogas Production at Malabar STP M.Sc. (Renewable Energy) Dissertation Steven Mark Cowgill School of Engineering and Energy January 2011 Murdoch University
27
of its performance on pig manure with SRT of 6 days. The four 8 m2 solar collectors
were built into the digester roof and circulated warmed water by thermosiphon effect
through a coil heat exchanger fixed within the sludge volume.
The study concluded that methane production strongly influenced the economic
viability of solar assisted heating, but that methane production itself “heavily
depends on proper management of the chemical and physical environment within
the digester” (Axaopoulos et al. 2001, p163). The solar heating merely offset biogas
use: it had no effect on biogas production per se and the AD bacteria fared neither
better nor worse for it.
Low thermal yields (relative to the heat load of industrial-scale digesters), except in
a limited number of specific locations, and the need to maintain back-up heating for
night operation, have generally continued to hinder widespread use of solar energy
for this purpose, particularly at large urban STPs with space restrictions.
3.5.3 Ultrasonic pre-treatment
When passed through primary sludge ultrasonic sound waves cause cavitation in
which microscopic bubbles of vapour form under negative pressure and then
collapse almost immediately. The resulting shock pressure (10,000 – 20,000 kPag)
and point temperature rise (1000 – 2000 oC) lead to the destruction of bacterial cell
membranes, with the typical result of halving the minimum SRT, increasing biogas
volume by up to 40%, and reducing the mass of digested sludge by 40% (Deublein
and Steinhauser 2008). There is no effect on methane fraction.
Ultrasonic frequencies of 40 kHz have been found to be most effective, and are
typically applied to a bypass flow of around 30% of the total volume of primary
sludge entering an anaerobic digester. Exposure times of up to 100 s may be
Optimised Biogas Production at Malabar STP M.Sc. (Renewable Energy) Dissertation Steven Mark Cowgill School of Engineering and Energy January 2011 Murdoch University
28
necessary. Proprietary ultrasonic pre-treatment technology is available and, as with
thermal pre-treatment, a net energy gain is claimed due to increased volume of
biogas offsetting the additional electricity required for the ultrasound generator(s).
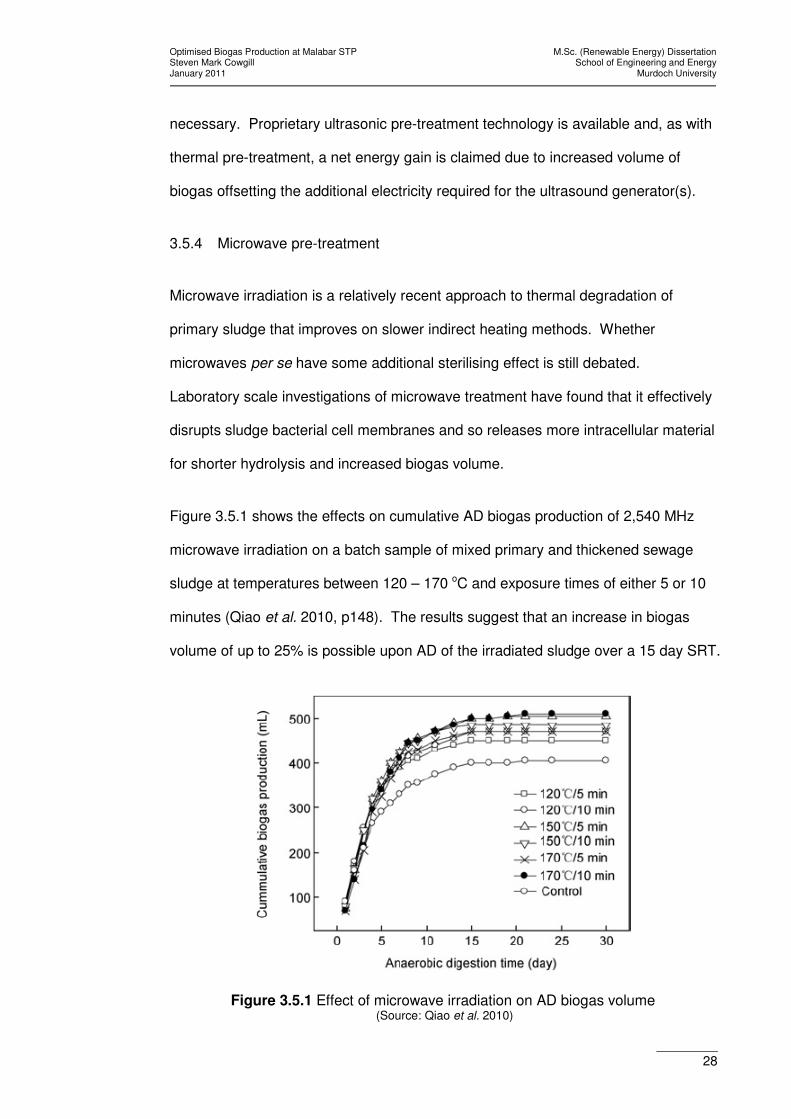
3.5.4 Microwave pre-treatment
Microwave irradiation is a relatively recent approach to thermal degradation of
primary sludge that improves on slower indirect heating methods. Whether
microwaves per se have some additional sterilising effect is still debated.
Laboratory scale investigations of microwave treatment have found that it effectively
disrupts sludge bacterial cell membranes and so releases more intracellular material
for shorter hydrolysis and increased biogas volume.
Figure 3.5.1 shows the effects on cumulative AD biogas production of 2,540 MHz
microwave irradiation on a batch sample of mixed primary and thickened sewage
sludge at temperatures between 120 – 170 oC and exposure times of either 5 or 10
minutes (Qiao et al. 2010, p148). The results suggest that an increase in biogas
volume of up to 25% is possible upon AD of the irradiated sludge over a 15 day SRT.
Figure 3.5.1 Effect of microwave irradiation on AD biogas volume (Source: Qiao et al. 2010)

Optimised Biogas Production at Malabar STP M.Sc. (Renewable Energy) Dissertation Steven Mark Cowgill School of Engineering and Energy January 2011 Murdoch University
29
3.5.5 γ-Ray pre-treatment
Laboratory-scale small batch experiments have shown that γ-irradiated primary
sludge has reduced particle size distribution, increased levels of soluble COD
substrates, and increased production of biogas during AD compared to non-
irradiated sludge in direct proportion to the dose strength (Yuan et al. 2008). Sludge
disintegration occurs very quickly under γ-irradiation (<1 s), but total irradiation time
in reported experiments has been in the order of hours for small sample volumes of
sludge (<5 L). It could be speculated this was due to low intensity of the particular
radioelement source of the γ-irradiation. Figure 3.5.2 shows results from one set of
experiments (Yuan et al. 2008) which suggest increases in biogas volume of up to
35% are possible during subsequent AD of γ-irradiated sludge compared to non-
irradiated sludge at SRT of 15 days beginning with solids content of just 1.5 %wt.
Figure 3.5.2 Effect of γ-irradiation on AD biogas volume (Source: Yuan et al. 2008)

Optimised Biogas Production at Malabar STP M.Sc. (Renewable Energy) Dissertation Steven Mark Cowgill School of Engineering and Energy January 2011 Murdoch University
30
3.5.6 Electron beam pre-treatment
Electron beam irradiation of waste water is known to form reactive chemical species
in solution that aid the conversion of pollutants through redox reactions, precipitation,
and organic decomposition (Shin and Kang 2003). It has been applied to a variety
of water disinfection and water-borne solids reduction problems. Laboratory scale
research has also shown that electron beam irradiation increases soluble COD
(particularly by dramatic increases in soluble proteins and carbohydrates) available
for subsequent AD. In one such experiment on thickened sludge in the range 2.4 –
3.2 %wt solids, between 189% and 287% of additional biogas was produced by AD
over the same hydraulic retention time as the control sample, owing to the “large
quantity of soluble organic materials leached out by the electron beam radiation”
(Shin and Kang 2003, p236).
3.5.7 Substrate improvement
The aim of pre-treatment methods discussed above is to increase the availability of
readily digestible organic substrates within sewage sludge for AD bacteria. This
section considers what substances may be mixed with primary sewage sludge with
the same aim, giving either or both increased biogas volume and methane fraction.
Various organic wastes have been mixed with sewage sludge to improve the rate of
hydrolysis and the availability of hydrolysis products for subsequent acidification or
acetogenesis of both the sewage sludge and the added substrate. Any biomass
material can be used for co-digestion provided it contains carbohydrates, proteins,
fats, cellulose, and hemi-cellulose as the main components (Deublein and
Steinhauser 2008). Materials include macerated restaurant (food) scraps, shredded
grass clippings, pulverised urban greenwaste (wood), abattoir wastes (subject to
local regulations), and sugar refining wastes. The higher the total COD of the mixed

Optimised Biogas Production at Malabar STP M.Sc. (Renewable Energy) Dissertation Steven Mark Cowgill School of Engineering and Energy January 2011 Murdoch University
31
materials, the greater is the potential for biogas formation. Wastes for co-digestion
should ideally have a similar (or smaller) particle size distribution to the primary
sludge or else be in liquid form (Ahring 2003).
The largest European AD plants all co-digest feedlot animal manures that are mixed
with other organic wastes which have higher biogas potential, in particular food
scraps and fatty wastes such as grease trappings (Ahring 2003). It is known that
dramatic increases in biogas volume can result from co-digestion, provided there is
sufficient excess digester active volume for the minimum SRT necessary on the
combined influent.
As an example, addition of 5 %vol (or 50 L) of fish oil to 1 m3 of fresh cattle manure
has led to increases in the order of 200 %vol in AD biogas (Ahring 2003) compared
to that from untreated manure. It is not reported what effect if any the oil had on the
stabilisation of the manure, the quantity of residual sludge, or its chemical and
handling properties. No change in methane content was reported either.
More recent research in the US reported increases of between 10 – 40% in AD
biogas volume due to co-digestion of food wastes with sewage sludge (California
Energy Commission 2008). Figure 3.5.3 shows the effect in laboratory batch tests
of three types of food processing wastes in 50 %wt mixtures with sewage sludge on
biogas volume during subsequent mesophilic AD over a 20 day SRT. The control
was 100 %wt sludge.

Optimised Biogas Production at Malabar STP M.Sc. (Renewable Energy) Dissertation Steven Mark Cowgill School of Engineering and Energy January 2011 Murdoch University
32
Figure 3.5.3 Effect of co-digested food processing wastes on AD biogas volume (Source: California Energy Commission 2008)
Results from these laboratory scale tests guided pilot-scale trials on an industrial
continuously fed digester, and became the basis of an empirical model to predict co-
digestion biogas production. The pilot-scale test showed an increase of at least 12
%vol of biogas from sludge co-digested with 10 %wt food waste sustained over a
test period of some 7 months. Net VS destruction in the digester also increased in a
similar ratio. The researchers noted that large spikes in biogas production following
bulk digester feeding with pure food wastes caused havoc with the existing biogas
handling/flaring system, and they recommended instead that food wastes be
continuously blended with influent sludge.
3.5.8 Sludge thickening
This section considers methods of sludge “thickening”, by which the solids content
of wet sludge fed to AD digesters is increased above what can be achieved with
primary sedimentation alone. As with other methods discussed above, the intended
result is a higher concentration of organic substrate that can support larger bacterial
colonies which produce more biogas, but that stays within the maximum SRT on a

Optimised Biogas Production at Malabar STP M.Sc. (Renewable Energy) Dissertation Steven Mark Cowgill School of Engineering and Energy January 2011 Murdoch University
33
given digester. Chemical and gravitational methods only are discussed here, as
they are the most suitable for primary sewage treatment.
Thickening sludge by dosing the raw influent with ferric chloride has been trialled at
a number of SW primary treatment plants, where it has been demonstrated to
increase the volume of AD biogas by increasing settled solids concentration in the
primary sludge. Increases of up to 30 %vol of biogas produced per day over
untreated sludge have been recorded with all else the same. Malabar STP is
equipped with a permanent ferric chloride dosing (or CAS) system as described in
Section 1.3. In this mode of operation about 10mg/L of ferric chloride solution and
0.5mg/L polyelectrolyte are added to improve solids capture. At this dose rate,
approximately 55 %wt to 60 %wt of suspended solids are removed, compared to
about 50 %wt when CAS is not used. As noted earlier, Malabar STP normally
meets its license limit on total solids discharge without using the CAS system.
Sydney Water investigations have found that “while higher doses of chemical would
result in greater removal of solids, sludge quantities generated at the dose of
10mg/L ferric chloride are at the limit of the sludge treatment system’s capacity”
(Sydney Water 2004, p27). CAS is currently not a viable means for increasing
biogas volumes at Malabar STP and it appears that any technique of increasing the
solids content for more biogas production would have a practical limit at Malabar
STP of 10 %wt additional solids capture – with the downstream plant in its existing
configuration.
Gravitational sludge thickening is by the same process to that occurring in primary
sedimentation; the influent flow rate is slowed so that the solid particles sink and
collect at the bottom. Thickeners are typically cylindrical tanks (diameter < 50 m)
with conical bases; the thickened sludge is pumped out from the lowest point at the

Optimised Biogas Production at Malabar STP M.Sc. (Renewable Energy) Dissertation Steven Mark Cowgill School of Engineering and Energy January 2011 Murdoch University
34
apex of the cone while the overflow is returned upstream to the primary
sedimentation system. Primary sludge thickened in this way typically has a practical
upper limit of 5 – 10 %wt solids (Sydney Water 2009b) before thickeners become
too large to be built and operated economically.
Centrifuge and belt press thickening of sludge are alternatives to gravitational
methods that offer similar increases in solids fraction, with reduced space and
installation costs, but with higher operating costs.
3.5.9 Digester mixing regime
The digester mixing regime either impedes or promotes growth of the AD bacterial
colony. Mixing promotes growth by supplying stage organisms with fresh substrate,
maintaining a stable temperature throughout the digester, moving the products of
metabolism to receiver organisms, separating biogas from the liquid phase and
moving it out of the digester, breaking up floating or submerged layers of sludge and
scum, and preventing undigested solids from entraining with the discharge sludge.
At the same time, excessive mixing can impede growth and biogas production by
disrupting interspecies hydrogen transfer or by simply killing the shear-sensitive
bacteria (Deublein and Steinhauser 2008).
It is commonly observed that gas-mixed sludge digesters produce a surge in biogas
flow rate immediately after starting a mixing cycle, even though the digester’s liquid
contents are continuously turned over through the sludge heaters. Continuous
mechanically-stirred digesters do not show this tendency. In general a continuous,
careful, but intensive mixing action should be used (Deublein and Steinhauser 2008).
It is noted that prompt removal of biogas from the digester has a major effect on
increasing the reproduction of microorganisms in anaerobic digesters. Also, mixing

Optimised Biogas Production at Malabar STP M.Sc. (Renewable Energy) Dissertation Steven Mark Cowgill School of Engineering and Energy January 2011 Murdoch University
35
with compressed biogas is known to inhibit the formation of hydrogen sulphide (H2S)
(Deublein and Steinhauser 2008), albeit at the expense of having that portion of the
total biogas produced available for energy recovery.
Mechanical scaling effects in trying to reproduce results from laboratory apparatus
on real, full-sized industrial AD digesters hampers improved mixing, although
advances in computational fluid dynamics (Latha et al. 2009) continue to improve
predictions of what will happen.
3.5.10 Partial inoculation with aerobic thermophilic sludge
Thermophilic AD occurs in the temperature range 60 – 75 oC and, in any direct
comparison, normally has a higher gross biogas yield than mesophilic AD.
Researchers have found that small quantities of seed sludge taken from aerobic
thermophilic (AT) digestion processes and added to the influent of a mesophilic
anaerobic digester will also increase biogas yields from the latter.
In one case it was found that the addition of 5 %vol AT sludge (having 1.2 %wt of
volatile solids) to primary sludge improved the production of biogas in a separate
mesophilic AD process (Miah et al. 2005). Biogas production within the mesophilic
process decreased as the seed volume of AT sludge was increased further (e.g. to 7
%vol and 10 %vol). The optimum additional volume and the pre-treatment
temperature of the AT sludge for maximum biogas production was 5 %vol and 65 oC,
at which the biogas volume increased by some 150% over that from unseeded
sludge during subsequent AD having SRT of 15 days. Figure 3.5.4 shows the
results of these experiments.

Optimised Biogas Production at Malabar STP M.Sc. (Renewable Energy) Dissertation Steven Mark Cowgill School of Engineering and Energy January 2011 Murdoch University
36
symbol %wt AT
sludge
▲ 0 1
● 3
◊ 5
○ 7
ж 10
■ 20
Figure 3.5.4 Effect of aerobic thermophilic sludge seeding on AD biogas volume (Source: Miah et al. 2005)
3.6 Summary of effects of optimising techniques
Table 3.6.1 summarises the techniques reviewed above. It shows their maximum
potential effect on the biogas volume and methane fraction generated from a unit
mass of sewage sludge. Advantages and disadvantages of each technique at
Malabar STP that were discerned during this research are stated together with the
source of the information. The purpose of this table is to enable discussion and to
guide selection of the most viable techniques for Malabar STP (refer Section 6).

Optimised Biogas Production at Malabar STP M.Sc. (Renewable Energy) Dissertation Steven Mark Cowgill School of Engineering and Energy January 2011 Murdoch University
37
Table 3.6.1 (A) Effect of optimising techniques on sewage AD biogas volume and methane fraction
Technique ∆∆∆∆% biogas volume
∆∆∆∆% biogas CH4 fraction
Benefits at Malabar STP Concerns at Malabar STP Source(s)
Pre-treatment
Thermal hydrolysis 0 to 400% negligible
• Significant increase in biogas m3/kgVS • Significant net energy gain • Reduced mass of biosolids
• Relatively high cost • Process complexity • Suited to new AD plant, rather than retrofit
Pérez-Elvira et al. 2006
Ultrasonic 0 to 40% negligible
• Relatively low upfront cost • Simple operation, external to sludge circuit • Net energy gain • Commercialised technology • Suited to retrofit • Part influent flow can be treated • Reduced mass of biosolids
• Potential cavitation in sludge handling plant • Potential vibration in sludge handling plant • Unknown reliability of equipment in
comparison with other STP components
BiogasMax 2010,
Deublein and Steinhauser 2008,
Sydney Water 2009b
Microwave 0 to 25% negligible
• Rapid sludge disintegration • Simple operation, external to sludge circuit • Suited to retrofit
• Laboratory scale demonstrated only • Net energy gain unproven at full scale • Suitability in continuous process
Qiao et al. 2010
Electron beam 0 to 290% negligible
• Rapid sludge disintegration • Significant increase in biogas m3/kgVS • Simple operation, external to sludge circuit • Suited to retrofit
• Laboratory scale demonstrated only • Suitability in continuous process • Unknown net energy gain
Shin and Kang 2003
γ-Ray 0 to 35% negligible
• Rapid sludge disintegration • Part influent flow can be treated • Suited to retrofit
• Laboratory scale demonstrated only • Suitability in continuous process • Unknown safety issues • Unknown radio-contamination of effluent • Unknown net energy gain
Yuan et al. 2008

Optimised Biogas Production at Malabar STP M.Sc. (Renewable Energy) Dissertation Steven Mark Cowgill School of Engineering and Energy January 2011 Murdoch University
38
Table 3.6.1 (B) Effect of optimising techniques on sewage AD biogas volume and methane fraction
Technique ∆∆∆∆% biogas volume
∆∆∆∆% biogas CH4 fraction
Benefits at Malabar STP Concerns at Malabar STP Source(s)
Substrate improvement
AT sludge inoculation 0 to 150% Negligible
• Significant increase in biogas m3/kgVS • Suited to retrofit • Minimal effect on biosolids processing
• Laboratory scale demonstrated only • Additional sludge heating circuit to produce
AT sludge • Unknown net energy gain
Miah et al. 2005
Co-digested organics 0 to 40% 0 to 15%
• Reduced biosolids • Treatment of additional wastes • Compatible collection networks • Minor changes in operating procedure • Potential increased methane content by
altered substrate composition
• Additional materials handling on site • Additional waste storage • Additional truck movements in area • Vector and vermin control • License restrictions • Additional odour issues for local community
Ahring 2003,
California Energy Commission 2008
Sludge thickening (CAS) 0 to 10% Negligible
• Existing CAS plant for sludge thickening • Extensive SW experience with CAS • Reduces solids loading of effluent to ocean
• Cost of chemical supply • Sludge handling plant capacity restricts
primary solids capture to 60 %wt • Marginal increase in biogas m3/kgVS
Deublein and Steinhauser 2008,
Sydney Water 2009b
Digester operation
Mixing optimisation 0 to 10% Negligible
• Minor scope of plant modifications • Recovery of biogas that is no longer
required for compression and sludge mixing
• Difficulty and relatively high cost of accurate modelling or plant trialling to guide optimisation efforts and to measure their effect
• Additional electrical load • Digester outages are likely to be required in
order to make only minor modifications to the mixing system (i.e. hard to justify to plant operations staff)
Deublein and Steinhauser 2008

Optimised Biogas Production at Malabar STP M.Sc. (Renewable Energy) Dissertation Steven Mark Cowgill School of Engineering and Energy January 2011 Murdoch University
39
4. Research Methods
This section explains in detail how the specific questions raised during this research
were answered. General information on methods for the literature review, plant
familiarisation, and data collection is also provided.
4.1 Literature review
The initial aim of the literature review was to understand AD in primary sewage
treatment and the sludge digestion plant at Malabar STP. It was considered that, in
order to not miss any opportunity of increasing biogas volume or methane content,
the review should follow the sludge through the whole process train from its receipt
as raw influent through to its final forms; dewatered biosolids, treated effluent, and
conversion to biogas.
The literature review then considered the following areas:
i) Detailed AD chemistry and microbiology.
ii) Previous work by SW on biogas optimisation.
iii) Recent academic research on biogas optimisation.
iv) Digester design principles.
Academic and industrial literature was obtained for review via a keyword abstract
search of journal databases in Murdoch University library and in the public domain.
Handbooks and conference presentations were obtained via internet search and
library loan. Process guidelines, design rules, and STP asset reports were obtained
from SW.

Optimised Biogas Production at Malabar STP M.Sc. (Renewable Energy) Dissertation Steven Mark Cowgill School of Engineering and Energy January 2011 Murdoch University
40
4.2 Malabar STP configuration
In order to understand the route of the sludge through Malabar STP it was
necessary to obtain and read relevant plant arrangement drawings and process and
instrumentation diagrams (P&IDs).
4.3 Operating data
The research used historical operating data from the cogeneration plant and sewage
digesters as collected and stored by the SCADA system at Malabar STP. Each
plant instrument is identified on P&IDs by a unique number known as its data point.
All data points for analysis were selected after reading the P&IDs for Malabar STP
concurrent with the literature review, and deciding which instruments measured
process variables that were of interest.
As noted in Section 1.3 the SRT of Malabar STP digesters is 15 – 19 days.
Operating data was recovered for the 7 day period 11th – 18th June 2010 at a
uniform sampling rate of 16 minutes and 48 s throughout the period. It was judged
from the literature review that this sampling rate and period were adequate to
observe the relatively slower rates of change in the continuous AD process as well
as to produce a manageable quantity of data. It was also considered that the
digester’s “worst case” operation would occur during winter, when low ambient
temperatures maximise the heating load on the total biogas supply. The net biogas
available for cogeneration in winter time would indicate the maximum scope for
optimisation during the year.
The raw data was recovered from the SCADA system as a comma separated
variable (CSV) file, opened as a spreadsheet, and checked for inconsistent
measurements or continuous zeroing - such data was deleted. The checked data
was then manipulated in a new spreadsheet to show graphical trends over time.

Optimised Biogas Production at Malabar STP M.Sc. (Renewable Energy) Dissertation Steven Mark Cowgill School of Engineering and Energy January 2011 Murdoch University
41
4.4 Answering research questions
The specific research questions raised in Section 2 are repeated below with a
discussion of the method followed to answer each one.
4.4.1 Question 1
“What are the most viable means, including plant modifications or additional
equipment, to achieve higher rates of biogas production within the overall
constraints presented by Malabar’s primary functions as a sewage treatment
plant?”
This question was answered by reference to the industrial and academic literature
on AD of sewage sludge, by consideration of the process design and equipment in
use at Malabar STP, by studying graphs of operating data described in Section 4.3,
and by drawing informed conclusions about the most practical and economical
methods to increase biogas volumes without upsetting the digestion regime.
4.4.2 Question 2
“What factors limit the maximum rate of biogas production by anaerobic
digestion of a given sewage flow?”
This question was answered by consulting the reviewed academic literature on
sewage sludge AD and reaction kinetics.
4.4.3 Question 3
“What is the maximum sustained rate at which biogas could be produced at
Malabar STP?”

Optimised Biogas Production at Malabar STP M.Sc. (Renewable Energy) Dissertation Steven Mark Cowgill School of Engineering and Energy January 2011 Murdoch University
42
This question was answered by calculating a theoretical maximum biogas flow rate
using a validated spreadsheet adapted to primary sewage sludge from the steady
state AD model originally developed for slurried pig manure (Chen 1983).
Inputs to this calculation for Malabar STP were as follows:
i) The measured average VS fraction of 75 – 80% in the primary sludge.
ii) The typical digestion of 50% of VS in mesophilic AD of sewage sludge as
shown in Figure 4.4.1 (Taricska et al. 2007).
iii) A total active digester volume in parallel operation of 35,000 m3.
iv) A uniform and steady digesting sludge temperature of 35 oC.
v) The measured average methane fraction 65 %vol in biogas supplied to
the cogeneration system.
vi) An historical methane yield of 0.5 m3/kgVS of digested volatile solids.
vii) An SRT of 15 days.
Figure 4.4.1 VS consumption in high rate mesophilic AD of sewage sludge (Source: Taricska et al. 2007)

Optimised Biogas Production at Malabar STP M.Sc. (Renewable Energy) Dissertation Steven Mark Cowgill School of Engineering and Energy January 2011 Murdoch University
43
This calculation ignored correctable issues arising from the age of the real plant,
such loss of active digester volume by sedimentation, and from short term variations
in influent conditions such as solids concentration and storm flows.
A digester temperature of 35 oC was used because it was the maximum observed in
actual digester temperatures at Malabar STP during the (winter) data collection
period of this research. This temperature was also regarded as the optimum point in
the range 32 – 38 oC for mesophilic AD (refer Section 3.2). Based on the digester
sludge temperature profiles observed during this research it was considered
reasonable to assume for this estimate that the digester heating system had the
capacity (if not the necessary finer control) to maintain sludge temperature steady at
35 oC throughout the year.
An SRT of 15 days was used because it was on the conservative side of the design
operating range of 15 – 19 days for Malabar STP.
Results of the calculation were represented as surface graphs in order to show the
sensitivity of AD biogas production to changes in digester SRT, sludge temperature,
and VS concentration.
It was then supposed that the single most viable optimising technique chosen in
answer to Question 1 would be implemented. The calculated theoretical range of
maximum flow rate was then multiplied by the average likely percentage increase in
biogas volume from that technique as reported in Table 3.6.1.
Estimating biogas production from a digester’s measured VSLR and VS destruction
is a conventional method. Greater accuracy has been reported by some
researchers using newer methods based on influent COD and COD destruction.
Malabar STP primary sludge COD data was unavailable for this research.

Optimised Biogas Production at Malabar STP M.Sc. (Renewable Energy) Dissertation Steven Mark Cowgill School of Engineering and Energy January 2011 Murdoch University
44
4.4.4 Question 4
“What factors affect the ratio of methane to carbon dioxide in sewage biogas
and how can these factors be optimised at Malabar STP?”
The first part of this question was answered by consulting the academic literature on
AD microbiology. The second part was answered by considering the process path
of primary sludge through Malabar STP, by studying the graphs of digester and
cogeneration system process conditions, and by then drawing informed conclusions
about ways of potentially increasing the CH4/CO2 ratio by changing certain process
parameters and the properties of the AD substrate.
4.4.5 Question 5
“How does biogas production at Malabar STP compare with benchmark
performance data for anaerobic digestion of sewage sludge?”
This question was answered by directly comparing published typical operating data
for stable AD digesters fed with primary sewage sludge with the same operating
data from Malabar STP.

Optimised Biogas Production at Malabar STP M.Sc. (Renewable Energy) Dissertation Steven Mark Cowgill School of Engineering and Energy January 2011 Murdoch University
45
5. Malabar STP Biogas Production
This section presents the operating data collected at Malabar STP as described in
Section 4.3. Further description of specific data points and trends in plant function,
discussion of background calculations, and any other necessary qualification of the
data are provided throughout this section. Detailed interpretation and a critical
analysis of the data and calculation results are presented in Section 6.
During the period of the collected data, primary sludge digestion was performed in
Digesters 2 and 5. Digester 3 was used as a holding tank for digested sludge ahead
of dewatering in the biosolids plant. Digesters 2 and 5 were operated continuously
in parallel, with a total active volume of about 22,800 m3. Both digesters had
recently been cleared of grit carried over from the primary sedimentation tanks.
All three generator sets in the cogeneration system were operated continuously at
various part loads throughout the period of the collected data.
5.1 Net biogas flow rate and cogeneration system output
Figure 5.2.1 shows the net biogas flow rate measured at the inlet to the
cogeneration system’s biogas conditioning skid (blue), and the total electrical output
of the cogeneration system (orange). The total flow rate of biogas (green) drawn by
the compressors for recirculation through all three digesters to mix the sludge is also
shown. Measurements of flared biogas flow rate were not available.
It is important to note that Figure 5.2.1 shows the total volume flow rate of
uncompressed biogas as measured in the take-off pipework from individual digester
covers, and so may be compared directly with the net biogas flow rate to the
cogeneration system that is drawn from the same locations. The rated electrical

Optimised Biogas Production at Malabar STP M.Sc. (Renewable Energy) Dissertation Steven Mark Cowgill School of Engineering and Energy January 2011 Murdoch University
46
output of the cogeneration system (red) is also shown for reference. Each vertical
gridline represents 12 hours during the period.
Large, sudden falls in the cogeneration system’s electrical output are clearly
followed by similar falls in biogas flow rate. This indicates that the loss of electrical
load was caused by some operating factor other than an interruption in biogas fuel
flow, which appears to have been correctly isolated in response. On these
occasions the electrical load was quickly recovered while the biogas recirculation
flow rate was maintained, indicating that the biogas supply was readily available
throughout the period.
In summary, Figure 5.2.1 shows that the net combined biogas production of
Digesters 2 and 5 was steady at about 375 L/s. This fuel flow was enough for a
cogeneration system electrical output of about 2,250 kWE or 74% of rated capacity.
The total biogas recirculation flow rate through both digesters was steady at about
1,200 L/s, which was roughly 320% of the net biogas flow rate available to the
cogeneration system.
5.2 Digester recirculated sludge temperature
Figure 5.2.2 shows digester sludge temperatures measured at the inlet of the
recirculation pipework located at the base of each digester and leading to the sludge
recirculation pumps. Each vertical gridline represents 12 hours during the data
collection period.
The lower and lagging sludge temperatures measured in the unheated Digester 3
(red) confirm its use for storage of digested sludge being fed to the biosolids plant.
The sludge temperature in Digester 3 was normally stable at between 25 – 26 oC.

Optimised Biogas Production at Malabar STP M.Sc. (Renewable Energy) Dissertation Steven Mark Cowgill School of Engineering and Energy January 2011 Murdoch University
47
The primary sludge in Digesters 2 (grey) and 5 (lime) appears to have experienced
relatively large and rapid cycles of alternating forced heating and natural (i.e. free
conductive and convective) cooling throughout the period. Temperatures in
Digester 2 appear to be the most varied; ranging at times through 5 – 6 oC over the
course of one day.
For a period of some 15 hours between about 20:00 on 15 June and 11:00 on 16
June Digester 2 appears to have been unheated; evident by a steady exponential
decay in sludge temperature. Immediately after this period a similar but more
sudden fall from about 25.5 oC to 22 oC may be seen in the temperature of sludge
stored in Digester 3. This suggests that cooled digested sludge from Digester 2,
mixed with digested sludge at around 33.5 oC from Digester 5, had been transferred
into Digester 3 for storage. Sludge temperature in Digester 3 returned to around 25
oC within 4 – 5 hours of sludge heating being restored on Digester 2.
Numerous times the sludge temperature in Digester 2 spiked upwards to the same
point at about 35 oC before immediately falling.
Digester 2 appears to have had no steady temperature during the data collection
period, while Digester 5 does appear to have been maintained for up to several days
at various temperatures between 33.5 – 34.5 oC, with excursions as low as 30.5 oC.
It is unlikely that the entire volume in either digester uniformly experienced the
indicated temperature ranges owing to the thermal inertia of around 11,000 m3 of
sludge in each; but clearly some portion of the volume did, depending on how long
the sludge was unheated. The nominal total recirculation sludge flow rate of either
digester was 120 L/s, which meant that the combined volume of both would be
turned over in about 24 hours. When the sludge temperature fell continuously by 5

Optimised Biogas Production at Malabar STP M.Sc. (Renewable Energy) Dissertation Steven Mark Cowgill School of Engineering and Energy January 2011 Murdoch University
48
– 6 oC during a 24 hour period, as was observed here on Digester 2, it is reasonable
to conclude that most of the sludge in that digester did cool by this amount.
Figure 5.2.1 shows that the net biogas flow rate and the cogeneration system’s
electrical output both remained steady despite the sludge temperature variations.
This suggests that the temperature variations only affected the long-term trend (i.e.
over a number of months) in total average biogas production.

Optimised Biogas Production at Malabar STP M.Sc. (Renewable Energy) Dissertation Steven Mark Cowgill School of Engineering and Energy
January 2011 Murdoch University
49
0
250
500
750
1000
1250
1500
1750
2000
2250
2500
2750
3000
11-Jun 12 P
M
12-Jun 12 A
M
12-Jun 12 P
M
13-Jun 12 A
M
13-Jun 12 P
M
14-Jun 12 A
M
14-Jun 12 P
M
15-Jun 12 A
M
15-Jun 12 P
M
16-Jun 12 A
M
16-Jun 12 P
M
17-Jun 12 A
M
17-Jun 12 P
M
18-Jun 12 A
M
18-Jun 12 P
M
19-Jun 12 A
M
ele
ctr
ical
ou
tpu
t (k
WE)
0
125
250
375
500
625
750
875
1000
1125
1250
1375
1500
un
co
mp
res
se
d b
iog
as f
low
ra
te (
L/s
)
cogen rated elec output cogen total elec output net biogas flow rate total recirc biogas flow rate
Figure 5.2.1 Malabar STP biogas net and recirculation flow rates, cogeneration electrical output 11 – 18 June 2010

Optimised Biogas Production at Malabar STP M.Sc. (Renewable Energy) Dissertation Steven Mark Cowgill School of Engineering and Energy
January 2011 Murdoch University
50
22
23
24
25
26
27
28
29
30
31
32
33
34
35
36
11-Jun 12 P
M
12-Jun 12 A
M
12-Jun 12 P
M
13-Jun 12 A
M
13-Jun 12 P
M
14-Jun 12 A
M
14-Jun 12 P
M
15-Jun 12 A
M
15-Jun 12 P
M
16-Jun 12 A
M
16-Jun 12 P
M
17-Jun 12 A
M
17-Jun 12 P
M
18-Jun 12 A
M
18-Jun 12 P
M
19-Jun 12 A
M
slu
dg
e t
em
pe
ratu
re (
oC
)
Digester 2 Digester 3 Digester 5
Figure 5.2.2 Malabar STP digester sludge recirculation temperatures 11 – 18 June 2010
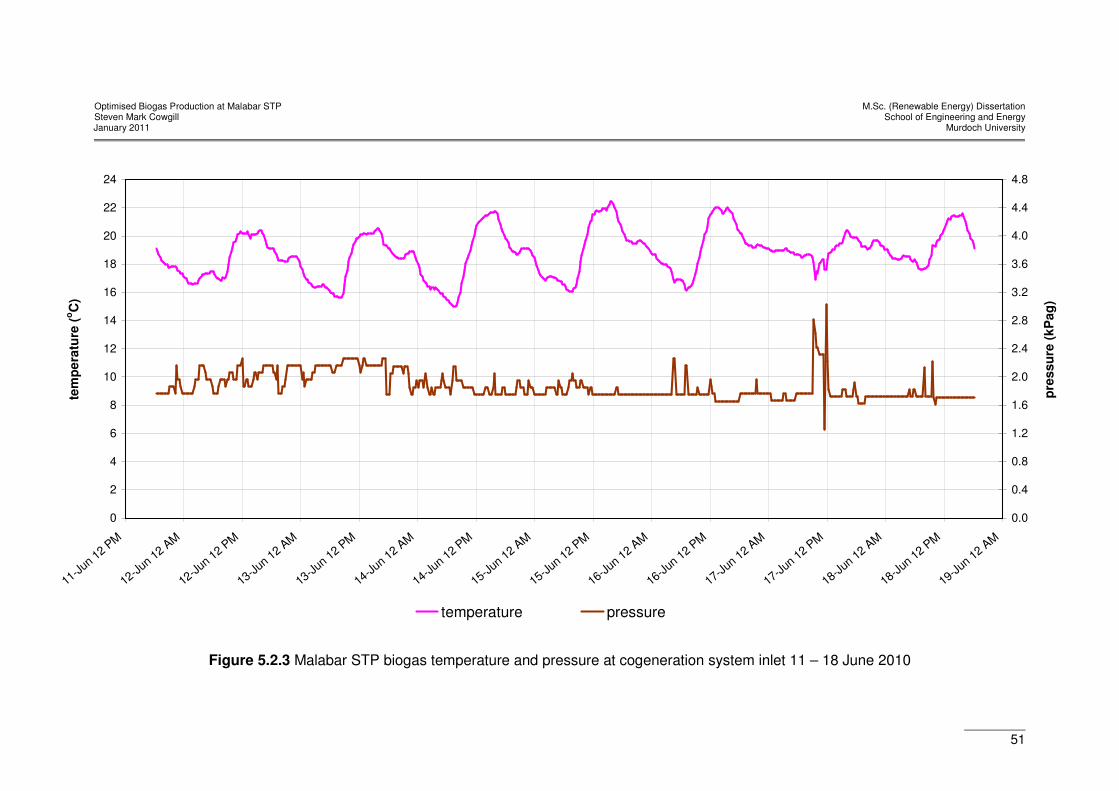
Optimised Biogas Production at Malabar STP M.Sc. (Renewable Energy) Dissertation Steven Mark Cowgill School of Engineering and Energy
January 2011 Murdoch University
51
0
2
4
6
8
10
12
14
16
18
20
22
24
11-Jun 12 P
M
12-Jun 12 A
M
12-Jun 12 P
M
13-Jun 12 A
M
13-Jun 12 P
M
14-Jun 12 A
M
14-Jun 12 P
M
15-Jun 12 A
M
15-Jun 12 P
M
16-Jun 12 A
M
16-Jun 12 P
M
17-Jun 12 A
M
17-Jun 12 P
M
18-Jun 12 A
M
18-Jun 12 P
M
19-Jun 12 A
M
tem
pe
ratu
re (
oC
)
0.0
0.4
0.8
1.2
1.6
2.0
2.4
2.8
3.2
3.6
4.0
4.4
4.8
pre
ss
ure
(k
Pa
g)
temperature pressure
Figure 5.2.3 Malabar STP biogas temperature and pressure at cogeneration system inlet 11 – 18 June 2010

Optimised Biogas Production at Malabar STP M.Sc. (Renewable Energy) Dissertation Steven Mark Cowgill School of Engineering and Energy
January 2011 Murdoch University
52
0
5
10
15
20
25
30
35
40
45
50
55
60
65
70
75
80
11-Jun 12 P
M
12-Jun 12 A
M
12-Jun 12 P
M
13-Jun 12 A
M
13-Jun 12 P
M
14-Jun 12 A
M
14-Jun 12 P
M
15-Jun 12 A
M
15-Jun 12 P
M
16-Jun 12 A
M
16-Jun 12 P
M
17-Jun 12 A
M
17-Jun 12 P
M
18-Jun 12 A
M
18-Jun 12 P
M
19-Jun 12 A
M
me
tha
ne
co
nte
nt
(%v
ol)
0
5
10
15
20
25
30
35
40
tem
pe
ratu
re (
oC
)
methane content temperature
Figure 5.2.4 Malabar STP biogas methane content and temperature at cogeneration system inlet 11 – 18 June 2010
Optimised Biogas Production at Malabar STP M.Sc. (Renewable Energy) Dissertation Steven Mark Cowgill School of Engineering and Energy January 2011 Murdoch University
53
5.3 Biogas temperature and pressure
Figure 5.2.3 shows biogas temperature (pink) and pressure (brown) measured at
the inlet to the cogeneration system’s biogas conditioning skid.
The biogas temperature ranges between 22 oC and 14.5 oC. The temperature
clearly follows a daily pattern of ambient heating and cooling as the biogas is
transferred from the digester manifold to the cogeneration system inlet via an
uninsulated pipe located above ground.
Biogas pressure at the cogeneration system inlet, and therefore throughout the
upstream pipework from the digesters, was normally between 1.7 – 2.3 kPag during
the data collection period. An exception was the loss of cogeneration system
electrical output and subsequent isolation of the biogas supply just before 12:00 on
17 June. The instantaneous rise and fall in biogas pressure simply suggests that it
was a rapid isolation.
The biogas pressure at the cogeneration system inlet during the data collection
period was generally below the set point range of 2.2 – 2.6 kPag for maximum
electrical output. As observed in Figure 5.2.1 and explained in Section 1.4 the
cogeneration system automatically reduced its electrical output in response to these
lower pressures and the corresponding reduced net biogas flow rate received from
Digesters 2 and 5.
5.4 Biogas methane content and temperature
Figure 5.2.4 shows biogas volumetric methane content (blue) and temperature
(khaki) measured at the inlet to the cogeneration system’s biogas conditioning skid.
The volumetric methane content shows the expected inverse relationship to biogas
temperature. At a temperature of 20 oC the methane content was 65 %vol.

Optimised Biogas Production at Malabar STP M.Sc. (Renewable Energy) Dissertation Steven Mark Cowgill School of Engineering and Energy January 2011 Murdoch University
54
5.5 Digester performance
Certain operating points extracted from the measured data for Digesters 2 and 5 are
summarised in Table 5.5.1, and compared with the benchmark data that were
presented in Section 3.4. Some residual AD was likely to have continued in storage
Digester 3 before the bacteria washed out of Digesters 2 and 5 died. Any additional
biogas from this is not considered here since Digester 3 was effectively in a dynamic
state and so unable to be compared with the benchmark steady state data.
Table 5.5.1 Malabar STP anaerobic digester performance 11 – 18 June 2010
Parameter Units Digester 2 Digester 5 Benchmark
Total solids in primary sludge %wt 5 5 – 6
VSLR kgVS/m3/d 4.7 1.6 – 4.8
Sludge temperature oC 26 – 35 31 – 34 32 – 38
Sludge temperature change oC/d 5 – 6 3 – 4 ≤ 0.5
Biogas yield [1] m3/kgVS 0.64 0.75 – 1.12 [1] Net of recirculation flow rate
The biogas yield is reported here on a net basis because, although the biogas
recirculation flow rate was known, the combined flow rate of dissolved (compressed)
biogas being removed with the digested sludge from active Digesters 2 and 5 and
storage Digester 3 was unknown. The stability of both the net and recirculation
biogas flow rates seen in Figure 5.2.1 suggests that the AD processes were able to
supply this ‘replacement’ biogas.
5.6 Maximum possible steady state biogas production
The maximum possible net rate of biogas production under steady state conditions
at Malabar STP was estimated using a steady state AD model that was based on
VS destruction and loading rate in a continuously-stirred digester (Chen 1983). The
model was developed for pig manure, but in the spreadsheet calculation used here
the kinetic constants and methane yield for the model had been re-calibrated for

Optimised Biogas Production at Malabar STP M.Sc. (Renewable Energy) Dissertation Steven Mark Cowgill School of Engineering and Energy January 2011 Murdoch University
55
typical sewage sludge from published data. Inputs to the calculation were as listed
in Section 4.4.3 above.
Model input values and results of the biogas production estimate are shown in Table
5.6.1. All values in this table were calculated unless noted otherwise.
Table 5.6.1 Malabar STP maximum steady state biogas flow rate
Parameter Units Value
Total solids in primary sludge [1] kg/d 131,200
VS fraction [1] % 75 – 80
VS in primary sludge kg/d 104,960
Primary sludge flow rate m3/d 2,333
Digester active volume [2] m3 35,000
SRT [2] days 15
Digester operating temperature (constant) [2] oC 35
VS concentration [1] kgVS/m3 45
VS digested# %wt 50
Methane yield per unit of VS in primary sludge [3] m3/kgVS 0.50
Methane flow rate m3/d 27,440
Methane fraction [1] %vol 65
Carbon dioxide flow rate m3/d 14,770
m3/d 42,200 Maximum steady state biogas flow rate
L/s 490
Biogas yield per unit of VS digested m3/kgVS 0.77
Methane yield per unit of primary sludge m3CH4/m
3 11.8 [1] Data measured during this research [2] Design or typical data [3] Historical data
The estimated maximum steady state biogas flow rate at operating temperature 35
oC and VS concentration 45 kgVS/m3 is 490 L/s with methane fraction of 65 %vol.
Table 5.6.2 shows the potential electrical output of the cogeneration system
operating on a net steady state biogas flow rate of 490 L/s containing 65 %vol
methane. In this calculation the generating sets are assumed to convert the biogas
to electricity with an average efficiency of 26% (recovered heat is not included in
this). The estimate also assumed that, once established, the total recirculation

Optimised Biogas Production at Malabar STP M.Sc. (Renewable Energy) Dissertation Steven Mark Cowgill School of Engineering and Energy January 2011 Murdoch University
56
biogas flow does not need to be replenished, so that all of the biogas produced in
steady state operation is net available to fuel the cogeneration system.
Table 5.6.2 Malabar STP cogeneration system potential electrical output
Parameter Units Value
Methane energy content [1] MJ/m3 39.0
m3/d 27,440 Methane flow rate
m3/s 0.32
Energy available for cogeneration MW 12.5
Cogeneration efficiency (electrical) [3] % 26
Potential electrical output kWE 3,245
Rated electrical output [2] kWE 2,925 [1] Data at 35 oC and 1.5 kPag (digester operating conditions) [2] Design or typical data [3] Assumed data
The potential electrical output under these conditions is 3,245 kWE compared with
the rated system output of 2,975 kWE.
Results of the calculation in Table 5.6.2 indicate that it is theoretically possible to
produce enough biogas in the existing Malabar STP digesters to operate the
cogeneration system at its rated load all of the time. This quantity of biogas would
be produced from typical Malabar STP influent sewage using the existing primary
sedimentation system without CAS or other pre-treatment. A slight excess of biogas
could even be expected to be flared under steady state conditions.
On the strength of this calculation no additional measures to increase biogas
production appear to be necessary: Digester 3 has only to be reverted to active
sludge digestion rather than being used to store digested sludge from Digesters 2
and 5. Still, following the approach outlined in Section 4.4.3, application at Malabar
STP of what is currently the most viable biogas optimisation technique - ultrasonic
pre-treatment, as described in Section 3.5.3 and Table 3.6.1 - could yield an
additional 20% biogas for a total flow of 42,200 × 1.2 = 50,600 m3/d.

Optimised Biogas Production at Malabar STP M.Sc. (Renewable Energy) Dissertation Steven Mark Cowgill School of Engineering and Energy January 2011 Murdoch University
57
The sensitivity of this estimate to VS concentration, digester operating temperature,
and SRT was investigated to see what methane production may be possible within
the fixed capacity of the Malabar STP digesters, when fed with the measured VS
content of primary sludge pumped from the existing sedimentation tanks.
Figure 5.6.1 is a surface graph of AD methane yield per unit volume of primary
sludge as a function of VS concentration and SRT at Malabar STP during AD at a
steady uniform temperature of 35 oC throughout the digesters.
Figure 5.6.2 is a surface graph of AD methane yield per unit volume of primary
sludge as a function of digester temperature and SRT at Malabar STP during AD of
primary sludge having a constant VS concentration of 45 kgVS/m3.
Figures 5.6.1 and 5.6.2 together show how biogas methane yield would change in
response to variations in VS concentration, digester temperature, and SRT.
In both Figures 5.6.1 and 5.6.2 the methane yield of 11.8 m3CH4/m
3 of primary sludge
that was estimated in the Table 5.6.1 calculation is confirmed to be within the plotted
range of 10 – 15 m3CH4/m
3.
Figure 5.6.1 shows how methane yield changes with variations in VS concentration
and SRT at constant sludge temperature 35 oC. In general, longer retention times
with sludge of any given VS concentration lead to a higher methane yield from a
given volume of primary sludge. At sludge temperature of 35 oC the model indicates
that there is an optimum VS concentration of 40 – 60 kgVS/m3 for maximum methane
yield and that within this range SRT has minimal effect. At VS concentrations
outside the range 30 – 70 kgVS/m3 the model indicates that the biogas methane yield
is substantially reduced regardless of SRT (up to 23 days). This is consistent with
the effects of organic under- and over-loading conditions on actual digesters.

Optimised Biogas Production at Malabar STP M.Sc. (Renewable Energy) Dissertation Steven Mark Cowgill School of Engineering and Energy January 2011 Murdoch University
58
Figure 5.6.1 Malabar STP methane yield per unit volume of primary sludge at temperature 35 oC
Figure 5.6.2 Malabar STP methane yield per unit volume of primary sludge at volatile solids concentration 45 kgVS/m3
Optimised Biogas Production at Malabar STP M.Sc. (Renewable Energy) Dissertation Steven Mark Cowgill School of Engineering and Energy January 2011 Murdoch University
59
Figure 5.6.2 shows how methane yield changes with variations in sludge
temperature and SRT at the constant VS concentration of 45 kgVS/m3 that was
observed in the primary sludge at Malabar STP during this research. It is clear from
this that a mesophilic anaerobic colony will have a low reproduction rate at
temperatures below about 20 oC regardless of VS concentration or SRT. At the
opposite (right hand) side of the graph, a slight increase in biogas methane yield
would be expected from increasing the sludge temperature above 35 oC, together
with ever-decreasing gains in methane yield as SRT is steadily increased (up to 23
days).
Both Figures 5.6.1 and 5.6.2 suggest that, given the plant’s physical constraints, the
actual operating conditions at Malabar STP of a nominal (but apparently unstable)
sludge temperature 35 oC, VS concentration 45 kgVS/m3, and SRT of 15 – 19 days
are near to a practical optimum combination of these three important variables of AD.

Optimised Biogas Production at Malabar STP M.Sc. (Renewable Energy) Dissertation Steven Mark Cowgill School of Engineering and Energy January 2011 Murdoch University
60
6. Discussion
This section presents an interpretation of the data in Section 5. It offers a critical
analysis of the potential for increased biogas production at Malabar STP in view of
other researchers’ findings as reviewed in Section 3. This section also discusses
the significance and limitations of the data, the limitations of the research methods,
and the extent to which the aims of the research were achieved.
Answers to the research questions are developed in this section then stated as
explicit conclusions in Section 7.
6.1 Digester temperatures
Sludge temperatures in Digesters 2 and 5 observed over 11 – 18 June showed
unexpected variability. This could indicate any one or a combination of the following:
i) Rapid stopping and re-starting of sludge recirculation and local cooling
only of sludge stopped next to the measurement point, while the
temperature of the majority of sludge remained stable.
ii) Temperature stratification within the digester while the sludge
recirculation and biogas mixing flows were steady.
iii) Delays in supplementary biogas firing of the digester heaters following
reduced heat input from the engine jacket water systems, in response to
low biogas flow rate or some other operating problem.
iv) Instrument faults.
In any of these cases except the last, the sludge temperature variation observed in
both Digesters 2 and 5 would inhibit methanogenesis and contribute to VFA
instability. As the comparison in Table 5.5.1 makes clear; temperature changes in
these digesters of up to ± 6.0 oC/d are well beyond the recommended figure of ± 0.5

Optimised Biogas Production at Malabar STP M.Sc. (Renewable Energy) Dissertation Steven Mark Cowgill School of Engineering and Energy January 2011 Murdoch University
61
oC/d or less for stability of the bacterial colony as found by other researchers (Table
3.4.1).
The thermal inertia of such large volumes of water as held in Digesters 2 and 5
makes it unlikely that the temperature variations seen in Figure 5.2.2 were
representative of or uniform throughout the entire volume of primary sludge in each.
But as discussed in Section 5.2; during periods of 12 or more hours of steady decay
in temperature during which sludge was being recirculated it is certain that a
significant portion of the sludge experienced temperature variations larger than the
recommended ± 0.5 oC/d.
AD researchers have consistently reported on the need for temperature stability
during methanogenesis. It is reasonable to conclude that the variation observed
here in Digesters 2 and 5 reduced the biogas yield and the net biogas flow rate to
the cogeneration system. This finding is confirmed by the result of the estimate of
maximum potential biogas flow rate at a steady temperature of 35 oC - equal to the
maximum temperature observed in Figure 5.2.2. The biogas yield for the steady
temperature was estimated to be 0.77 m3/kgVS (Table 5.6.1); or approximately 20%
greater than the yield of 0.64 m3/kgVS (Table 5.5.1) that was observed with some
portion of the sludge affected by temperature variations of up to ± 6.0 oC/d. There is
no reason to think that the plant performance seen during this research is atypical,
and that reduced net biogas production doesn’t persist all year as a result.
The profile of the temperature spikes in Figure 5.2.2 is notable. They show the
sludge temperature in Digesters 2 and 5 repeatedly falling gradually at a reducing
rate but increasing suddenly and almost linearly; and all of this apparently occurring
at random. These trends indicate relatively long periods of no heating, rather than a
Optimised Biogas Production at Malabar STP M.Sc. (Renewable Energy) Dissertation Steven Mark Cowgill School of Engineering and Energy January 2011 Murdoch University
62
lack of heating capacity that would be able to maintain a steady temperature.
Possible reasons for this behaviour include:
i) An excessive time lag on the biogas heaters’ purge and ignition
sequence upon receipt of a low sludge temperature signal – possibly
meant to reduce either fluctuations in flow rate and pressure throughout
the raw biogas network or wear and tear on the biogas heaters
themselves.
ii) Poorly calibrated or faulty pressure switches in the biogas heaters’ fuel
lines erroneously indicating no fuel present to start on receipt of a low
sludge temperature signal.
Such issues as these would be a matter for regular maintenance of the equipment
and fine-tuning of plant controls.
In summary; greater sludge temperature stability in Digesters 2 and 5 has good
potential to increase biogas yield and the net flow of biogas available for
cogeneration by some 20%. An average temperature of 32 – 35 oC should be
maintained and rapid variations around this value should be eliminated.
6.2 Other digester operations
Figure 5.2.1 shows the nominal total biogas recirculation flow rate is 1,200 L/s. This
flow was continually compressed and re-injected into Digesters 2, 3, and 5 for
sludge mixing, then drawn out of the covers for re-compression. The biogas
recirculation flow rate of 1,200 L/s compares with the net biogas flow rate of 375 L/s
left over for fuelling the cogeneration system.
The recirculation biogas flow is built up over months during initial start-up of a
digester and, once established, is adjusted with day-to-day changes in sludge level,

Optimised Biogas Production at Malabar STP M.Sc. (Renewable Energy) Dissertation Steven Mark Cowgill School of Engineering and Energy January 2011 Murdoch University
63
temperature, and other operating variables. As noted in Section 5.5, a portion of the
net biogas production is needed to replace recirculation biogas that is continually
removed in solution with digested sludge, or periodically removed with the net
biogas flow when the sludge level falls. Were some other method of sludge mixing
employed, additional biogas would become available for cogeneration and the
overall net biogas flow would be more even. Alternatives could include submersible
mechanical (propeller) mixers or additional sludge recirculation pumps internal to the
digester. Given the large volumes to be mixed these devices would be likely to add
a significant new electrical load at the site which may not be covered by any gain in
cogeneration system electrical output.
Malabar STP digesters occasionally suffer biogas leaks in the seal between the
floating cover and the side wall. Leaks result in biogas escaping out of the cover
into the atmosphere. Obviously, this reduces the volume of biogas available for
cogeneration, but repairs involve lengthy digester outages and heavy-lift cranes to
remove the cover.
6.3 Increasing biogas production
The estimate in Section 5.6 of maximum possible steady state biogas production
reveals two salient points on increasing current biogas flows.
The first is that the total volume of primary sludge in Digesters 2 and 5 alone does
not provide enough substrate to sustain an AD bacterial colony capable of
converting enough VS into a biogas flow rate sufficient to fuel the cogeneration
system at rated output, as observed in Figure 5.2.1. The estimated maximum
possible biogas flow rate of 490 L/s is based on all three digesters being in service
at very similar average operating conditions to those observed. As shown in Table
5.6.2, a biogas flow rate of 490 L/s and 65 %vol methane would be adequate to fuel

Optimised Biogas Production at Malabar STP M.Sc. (Renewable Energy) Dissertation Steven Mark Cowgill School of Engineering and Energy January 2011 Murdoch University
64
the cogeneration system at rated load. Therefore it can be concluded that, with all
other process conditions being equal, providing more sludge volume by returning
Digester 3 to active AD will dramatically increase the net flow rate of biogas.
The second is the effect of temperature variations as discussed in Section 6.1. The
estimated biogas yield of 0.77 m3/kgVS from digesting sludge at steady temperatures
of 35.0 ± 0.5 oC/d is about 20% greater than at temperatures of 35.0 ± 6.0 oC/d with
all other operating parameters the same (sludge volume, total and volatile solids
concentrations, SRT, VS fraction converted to biogas).
Table 3.6.1 gives a qualitative assessment of the viability of techniques for
increasing biogas production at Malabar STP. Many of these techniques have not
yet been commercialised for sewage treatment, although their principles have been
demonstrated in a laboratory setting using small, static batch volumes of sludge.
Such demonstrations are not intended to also deal with the complicating factors of
fluid mixing, VSLR dynamics, digested sludge removal, ambient temperature
variations, physical and chemical contaminants, equipment wear and failure, and
uneven sludge heating that regularly affect real anaerobic digesters. Electron beam,
γ-ray, and microwave irradiation are readily applied to 1 – 2 L flasks of tailored
substrate: the problem remains to apply these pre-treatments to large and
continuous flows of primary sludge, having variable total solids and VS
concentrations, in an industrial environment.
Of all the pre-treatment techniques considered the exposure of primary sludge to
ultrasonic energy appears to offer the most benefit to SW at Malabar STP. This is a
commercialised technology that has been demonstrated at other STPs to increase
biogas yields from primary sludge by up to 40%. It would have an added benefit at
Malabar STP of reducing the mass loading on the biosolids processing plant,
Optimised Biogas Production at Malabar STP M.Sc. (Renewable Energy) Dissertation Steven Mark Cowgill School of Engineering and Energy January 2011 Murdoch University
65
leading to fewer truck movements around neighbouring suburbs in order to dispose
of the biosolids offsite. Ultrasonic pre-treatment equipment would be installed
upstream of the digesters; a likely location would be on the discharge pipework from
the primary sludge transfer pumps where the flow is turbulent and well-mixed, rather
than in a straight section of pipe further downstream (most of which is buried
anyway). This should ensure maximum VS exposure to the ultrasonic dose.
All optimising techniques other than food waste co-digestion have no effect on
methane fraction. Food waste co-digestion alters the chemical structure of the AD
substrate by increasing carbohydrates and fats, which both have higher methane
yield and are digested faster than the lipids and proteins that are prevalent in
sewage sludge. Establishing food waste co-digestion at Malabar would need to
start with a cost-benefit analysis that considers specific wastes. It is likely that those
wastes with the lowest transport and handling costs to SW will be most attractive
regardless of any increase in actual biogas yield and methane fraction. The
analysis should look at wider implications for the treatment process including:
i) At what ratios the food waste is best mixed with primary sludge to
prevent blocking pipes, pumps, etc.
ii) How and at what point in the treatment process the waste is introduced.
iii) What pulping and shredding may be necessary before introducing the
waste.
iv) What changes in VFA, SRT, pH, alkalinity, and other digester control
parameters are likely to be required.
v) Changes in biosolids plant solids loading.
vi) Effects on effluent quality ahead of the ocean outfall system.

Optimised Biogas Production at Malabar STP M.Sc. (Renewable Energy) Dissertation Steven Mark Cowgill School of Engineering and Energy January 2011 Murdoch University
66
The metropolitan setting of Malabar STP would seem to increase the range of
wastes available nearby that could be examined for their co-digestion potential.
Increased biogas flows from any measure are likely to require either the installation
of larger flares or an upgrade of existing flares to safely handle the extra biogas
during cogeneration system outages.
6.4 Limitations of data
In general the selected data points enabled sufficient analysis to answer the
research questions. Greater accuracy may have been possible in estimating
maximum possible biogas yield by using data on the COD (instead of VS) content of
the primary sludge had it been available. The sampling rate of 16 minutes and 48 s
over a period of one week gave satisfactory resolution of digester trends relative to
the SRT of 15 – 19 days and, as was discovered, temperature changes of ± 6.0 oC/d.
Some pressure sensors and flow meters in different parts of the LP biogas and
sludge recirculation system returned zero readings (e.g. biogas flow and methane
content at the waste gas flares, sludge heat exchanger return temperatures). This
indicated no signal or some other configuration error, and so narrowed the view into
the digesters’ performance.
Several problems arose from the use of historical data recorded with plant
instrumentation. Chief among these was uncertainty over the history of particular
instruments, their calibration and functional status, and their exact physical location
in the treatment process – which is normally only shown schematically on P&IDs.
But given cost and time constraints there were few alternatives. On the other hand,
an advantage of this approach was the ability to view trends and model the macro-

Optimised Biogas Production at Malabar STP M.Sc. (Renewable Energy) Dissertation Steven Mark Cowgill School of Engineering and Energy January 2011 Murdoch University
67
scale behaviour of an industrial high rate digester, rather than attempt to infer full-
scale effects from, say, more precise laboratory batch tests.
6.5 Research methods
The research methods were generally suitable. An extensive and current academic
and industrial literature on anaerobic digestion of sewage sludge was found, as
expected, and formed a sound basis for interpreting the data collected from Malabar
STP.
It had been intended to compare actual biogas production from similar anaerobic
digesters to those of Malabar STP. This plan floundered for the unforeseen lack of
suitably detailed data published by other utilities. Instead, benchmark design data
were used for comparison; an approach that was probably more suitable in the end
since the wide variation in plant configuration and equipment age in real STPs would
have made for a difficult comparison.
It would have greatly improved this research to have had more time at Malabar STP
to simply observe day-to-day treatment processes and to gain insight from the plant
operator’s experience with AD biogas production.
6.6 Research aims
The primary objective of this research was to find ways to improve the load factor of
the Malabar STP cogeneration system, by making more biogas available to it for
more of the time; without forgetting that the purpose of Malabar STP is to continue
providing cost-effective primary sewage treatment. This objective was mostly
achieved, but further investigations should be made as recommended in Section 8.

Optimised Biogas Production at Malabar STP M.Sc. (Renewable Energy) Dissertation Steven Mark Cowgill School of Engineering and Energy January 2011 Murdoch University
68
7. Conclusions
This section presents conclusions about AD biogas production from sewage at
Malabar STP in answer to the research questions set out in Sections 2 and 4.
Many sewage pre-treatment techniques have been the subject of academic study
over the past 5 – 10 years. Most of these have been shown to increase biogas
volume yield at the scale of a laboratory apparatus. The technical and commercial
viability of almost all these techniques at an industrial scale remains uncertain.
The methane fraction of biogas is determined by the redox potential of the anaerobic
reactions occurring in a digester maintained at particular temperature and pressure.
For all practical purposes in mesophilic AD; the redox potential depends only on the
chemical composition of the substrate rather than on process conditions.
The maximum rate of biogas produced by AD of sewage sludge is limited by the
mass of sludge being digested, the temperature of digestion and its time rate of
change, the concentration of easily digested intercellular organics (as opposed to
total solids concentration) in the sludge, the solids retention time, the extent of
forced mixing, and the presence of contaminants including VFAs. All of these
factors impact on methanogenesis as the rate limiting stage in AD microbiology.
Malabar STP biogas yield is currently 0.64 m3/kgVS which is below the benchmark
range of 0.75 – 1.12 m3/kgVS for AD. The VSLR and total solids concentration of the
primary sludge feed are both within benchmark ranges. The low biogas yield is due
to excessive temperature changes of up to ± 6.0 oC/d during sludge digestion
compared with a benchmark rate of just ± 0.5 oC/d.
The maximum possible steady state biogas flow rate at Malabar STP was estimated
to be 490 L/s or 42,200 m3/d, containing 65 %vol methane, produced from Digesters

Optimised Biogas Production at Malabar STP M.Sc. (Renewable Energy) Dissertation Steven Mark Cowgill School of Engineering and Energy January 2011 Murdoch University
69
2, 3, and 5 working in parallel with a combined sludge volume of 35,000 m3. The
operating conditions in this scenario would be steady digester temperatures of 35.0
± 0.5 oC/d and primary sludge volatile solids content 45 kgVS/m3, of which 50 %wt
would be converted to biogas. This flow is adequate to fuel the cogeneration
system operating at its continuous rated electrical output of 2,925 kWE.
Additional primary sludge thickening by CAS or other methods is unlikely to be a
viable means of increasing biogas production because the downstream sludge and
biosolids handling plant cannot process the quantity of digested sludge that would
result from digesting primary sludge having more than 55 – 60 kg/m3 of total solids.
Instead, sludge thickening would be likely to either overload the digester or lead to
no net gain in biogas production because some SRT lower than the present 15 – 19
days would be necessary to prevent overloading.
The single most viable way to increase biogas production at Malabar STP is to
reinstate Digester 3 as an active volume for sludge digestion, rather than continue
using it for storing digested sludge from Digesters 2 and 5. This would result in
about 120 L/s or 10,300 m3/d of additional biogas; a gain of some 32% over the
current net flow rate from Digesters 2 and 5. Extra volume for storage of digested
sludge if required would appear to be better provided by enlarging or replicating the
existing digested sludge storage tank, since Digester 3 is already configured for AD,
and has sludge mixing, sludge transfer, and biogas collection systems in place.
Reducing sludge temperature changes in Digesters 2 and 5 to within ± 0.5 oC/d
should improve biogas yields by up to 20%. Other viable ways to increase biogas
production still further are food waste co-digestion, sludge pre-treatment by
ultrasonic irradiation, and use of mechanical mixers in place of compressed biogas.
Optimised Biogas Production at Malabar STP M.Sc. (Renewable Energy) Dissertation Steven Mark Cowgill School of Engineering and Energy January 2011 Murdoch University
70
8. Recommendations
This section makes recommendations on further work to increase biogas production
at Malabar STP in view of findings from this research.
i) Reinstate Digester 3 for primary sludge AD.
ii) Investigate and verify the correct functioning and calibration of sludge
temperature sensors and sludge heater controls on Digesters 2 and 5
(and 3 if reinstated) in order to minimise sludge temperature variations.
iii) Trial ultrasonic pre-treatment of primary sludge through a risk-reward
style contract with a design-and-construct technology provider. The
provider could retain ownership of the equipment and pay themselves
out of the savings SW makes on reduced import of grid electricity
through higher biogas production. The equipment could be installed on
either the primary sludge feed or recirculation pipework.
iv) Investigate food waste co-digestion. This could include trialling of
domestic insinkerator maceration units at source throughout the Malabar
STP sewage catchment, and diversion of grease-trap waste trucks, etc.
working in the local area. Any waste should be blended with the sewage
before being fed to the digesters.
v) Regularly calibrate and maintain pressure switches and transmitters
within the biogas circuit.
vi) Investigate reducing or eliminating the need for biogas to be diverted to
the compressors for digester mixing. Propeller-style, submersible
mechanical mixers and pumps are the most viable alternative.
vii) Maximise active digester volume and SRT by regularly removing
accumulated sunken grit and floating scum.
Optimised Biogas Production at Malabar STP M.Sc. (Renewable Energy) Dissertation Steven Mark Cowgill School of Engineering and Energy January 2011 Murdoch University
71
9. References
Ahring B. K., Perspectives for Anaerobic Digestion, Advances in Biochemical Engineering and Biotechnology (2003), Vol. 81
Axaopoulos P., Panagakis P., Tsavdaris A., and Georgakakis D., Simulation and Experimental Performance of a Solar-Heated Anaerobic Digester, Solar Energy (2001), 70(2):155-164
Bagi Z., Ács N., Bálint B., Horváth L., Dobó K., Perei K. R., Rákhely G., and Kovács K., Biotechnological Intensification of Biogas Production, Journal of Applied Microbiology and Biotechnology (2007), 76:473-482
Batstone D. J., Mathematical Modelling of Anaerobic Reactors Treating Domestic Wastewater: Rational Criteria for Model Use, Reviews in Environmental Science and Biotechnology (2006), 5:57-71
BiogasMax, Best Practices in Europe, European Biomethane Fuel Conference, http://www.biogasmax.eu/media/1p2_biogasmax_best_practices__021032800_0649_30092009.pdf, accessed online May 2010
California Energy Commission, Public Interest Energy Research Program (PIER), Project 3.1 Co-Digestion of Dairy Manure/Food Processing Wastes and Biosolids Food Processing Wastes to Energy – Final Report (2008), CEC-500-2007-015
Central Intelligence Agency, World Factbook 2010, https://www.cia.gov/library/ publications/the-world-factbook, accessed online December 2010
Chen Y. R., Kinetic Analysis of Anaerobic Digestion of Pig Manure and its Design Implications, Agricultural Wastes (1983), 8:65-81
Clean Energy Council of Australia, Australian Bioenergy Roadmap – Biomass Resource Appraisal (2008)
Clean Energy Council of Australia, Clean Energy Australia 2010, http://www. cleanenergycouncil.org.au/dms/cec/reports/clean-energy-australia/B--Clean-Energy-Australia-Report-2010/B.Clean Energy Australia report 2010.pdf, accessed December 2010
Cui R. and Jahng D., Enhanced Methane Production from Anaerobic Digestion of Disintegrated and Deproteinized Excess Sludge, Biotechnology Letters (2006), 28: 531-538
Demirel B. and Scherer P., Roles of Acetotrophic and Hydrogenotrophic Methanogens during Anaerobic Conversion of Biomass to Methane: A Review, Reviews in Environmental Science and Biotechnology (2008), 7:173-190
Deublein D. and Steinhauser A., Biogas from Waste & Renewable Resources: An Introduction (2008) Wiley-VCH, Weinheim
EurObserv’ER, Baromètre Biogaz, Le Journal des Ènergies Renouvelables, No. 200 (2010), Systèmes Solaires
Optimised Biogas Production at Malabar STP M.Sc. (Renewable Energy) Dissertation Steven Mark Cowgill School of Engineering and Energy January 2011 Murdoch University
72
Gavala H., Angelidaki I., and Ahring B., Kinetics and Modelling of Anaerobic Digestion Process, Advances in Biochemical Engineering / Biotechnology Vol 81 (2003) Springer-Verlag, Berlin
Gerber M. and Span R., An Analysis of Available Mathematical Models for Anaerobic Digestion of Organic Substances for Production of Biogas (2008), International Gas Union Research Conference
Haandel A. van, Kato M. T., Cavalcanti P. F. F., and Florencio L., Anaerobic Reactor Design Concepts for the Treatment of Domestic Wastewater, Reviews in Environmental Science and Biotechnology (2006), 5:21-38
International Water Association, Anaerobic Digestion Modelling Working Group, http://www.iwahq.org/Home/Networks/Specialist_groups/List_of_groups/Anaerobic_Digestion/Anaerobic_Digestion_Modelling_Working_group/, accessed online July 2010
Kovács K. L., Kovács A. T., Maróti G., Bagi Z., Csanádi G., Perei K., Bálint B., Balogh J., Fülöp A., Mészáros L., Tóth A., Dávid R., Latinovics D., Varga A., and Rákhely G., Improvement of Biohydrogen Production and Intensification of Biogas Formation, Reviews in Environmental Science and Biotechnology (2004), 3:321-330
Kuang Y., Enhanced Anaerobic Degradation of Lipids in Waste Water by Addition of Co-Substrate (2002) Doctoral Thesis, School of Environmental Science, Murdoch University
Latha S., Borman D., and Sleigh P. A., CFD Multiphase Modelling for Evaluation of Gas Mixing in an Anaerobic Digester, 14th European Biosolids and Organic Resources Conference (2009)
Miah M. S., Tada C., Yang Y., Sawayama S., Aerobic Thermophilic Bacteria Enhance Biogas Production, Journal of Material Cycles and Waste Management (2005), 7:48-54
O’Flaherty V., Collins G., and Mahony T., The Microbiology and Biochemistry of Anaerobic Bioreactors with Relevance to Domestic Sewage Treatment, Reviews in Environmental Science and Biotechnology (2006), 5:39-55
Pérez-Elvira S. I., Nieto Diez P., and Fdz-Polanco F., Sludge Minimisation Technologies, Reviews in Environmental Science and Biotechnology (2006), 5:375-398
Pind P.F., Angelidaki I., Ahring B. K., Stamatelatou K., and Lyberatos G., Monitoring and Control of Anaerobic Reactors, Advances in Biochemical Engineering / Biotechnology Vol 82 (2003) Springer-Verlag, Berlin
Qiao W., Wang W., Zhu C. P., and Zhang Z. Z., Biogas Recovery from Microwave Heated Sludge by Anaerobic Digestion, Science China, Technological Sciences (2010), 53:144-149
Optimised Biogas Production at Malabar STP M.Sc. (Renewable Energy) Dissertation Steven Mark Cowgill School of Engineering and Energy January 2011 Murdoch University
73
Shin K. S., and Kang H., Electron Beam Pretreatment of Sewage Sludge before Anaerobic Digestion, Applied Biochemistry and Biotechnology (2003), Vol.109:227-239
Stamatelatou K., Lyberatos G., Tsiligiannis C., Pavlou S., Pullammanappallil P., Svoronos S. A., Optimal and Suboptimal Control of Anaerobic Digesters, Environmental Monitoring and Assessment 2 (1997) 355-363
Sydney Water, Asset Planning (Treatment), Malabar STP Asset Management Plan (2004)
Sydney Water, Unit Process Guideline, Sludge Mesophilic Anaerobic Digestion, North Head STP ref. UPG-1005-015 (2007)
Sydney Water, Asset Information, Systems & Standards, STP Criteria Manual, Process Guidelines / Specifications, Group 4 – Standards & Specifications (2009a)
Sydney Water, Asset Information, Systems & Standards, STP Criteria Manual, Process Guidelines / Specifications, Group 3 – Sludge Processing (2009b)
Taricska J. R., Long D. A., Chen J. P., Yung-Tse H., Shuai-Wen Z., Anaerobic Digestion in Wang L. (Editor), Biosolids Treatment Processes (2007), Humana Press, New Jersey
United States Energy Information Administration, Form EIA-923 Power Plant Operations Report, Renewable Energy Consumption and Electricity Preliminary Statistics 2009, http://www.eia.doe.gov/cneaf/alternate/page/renew_ energy_consump/table3.html, accessed online December 2010
United States Environmental Protection Agency (USEPA), Municipal Environmental Research Laboratory, Technology Assessment of Solar Thermal Energy Applications in Wastewater Treatment (1982), EPA-600/2-82-006, Cincinnati, Ohio
Water Environment Research Foundation, State of Science Report: Resource and Energy Recovery from Sludge (2008), Global Water Research Coalition
Weiland P., Biogas Production: Current State and Perspectives, Journal of Applied Microbiology and Biotechnology (2010), 85:849-860
Yuan S., Zheng Z., Mu Y., Yu X., and Zhao Y., Use of Gamma-irradiation Pretreatment for Enhancement of Anaerobic Digestibility of Sewage Sludge, Frontiers of Environmental Science and Engineering China (2008), 2(2):247-250