optimisation of wire-cut edm process parameter by …...original research optimisation of wire-cut...
TRANSCRIPT
ORIGINAL RESEARCH
Optimisation of wire-cut EDM process parameter by Grey-basedresponse surface methodology
Amit Kumar1 • Tarun Soota1 • Jitendra Kumar1
Received: 6 March 2018 / Accepted: 14 March 2018� The Author(s) 2018
AbstractWire electric discharge machining (WEDM) is one of the advanced machining processes. Response surface methodology
coupled with Grey relation analysis method has been proposed and used to optimise the machining parameters of WEDM.
A face centred cubic design is used for conducting experiments on high speed steel (HSS) M2 grade workpiece material.
The regression model of significant factors such as pulse-on time, pulse-off time, peak current, and wire feed is considered
for optimising the responses variables material removal rate (MRR), surface roughness and Kerf width. The optimal
condition of the machining parameter was obtained using the Grey relation grade. ANOVA is applied to determine
significance of the input parameters for optimising the Grey relation grade.
Keywords Wire-cut EDM � Response surface methodology � Grey relation analysis � WEDM
NomenclatureAE Angular error
ANOVA Analysis of variance
CCD Central composite design
EDM Electric discharge machining
GC Gap current
GRA Grey relational analysis
MRR Material removal rate
MRSN Multiple response signal-to noise ratio
MS Machining speed
RSM Response surface methodology
S/N Signal-to-noise ratio
SG Spark gap
SO Single objective
SR Surface roughness
WEDM Wire electric discharge machining
WSN Weighted signal-to-noise ratio
Tm Machining time (min)
Toff Pulse-off time (ls)Ton Pulse-on time (ls)
max xðoÞi ðkÞ Maximum of x
ðoÞi ðkÞ
min xðoÞi ðkÞ Minimum of x
ðoÞi ðkÞ
Wi Initial weight of workpiece material (g)
Wf Final weight of workpiece material (g)
2i ðkÞ Grey relational coefficient of the ith
experiment for the kth response
y�i ðkÞ Normalised data
Ci Grey related grade
Introduction
Wire electric discharge machining (WEDM) process has
opened a new swing in the manufacturing sector. Non-tra-
ditional machining processes changed the whole scenario of
manufacturing industries. Traditional machining processes
are rapidly replaced by non-traditional methods for achiev-
ing better production rates and quality. One of the successful
methods is WEDM, which is based on the conventional
electric discharge machining (EDM). The principle remains
the same for WEDM as in conventional EDM, a thermo-
electrical process. WEDM process involves the erosion
effect by rapid repetitive and discrete spark discharges
between the wire tool electrode and work piece in a liquid
dielectricmedium.Manufacturing the parts of high quality at
high production efficiency is the main objective of WEDM
process. Selecting the appropriate machining parameter for
high quality product is very difficult. Much research is not
found in the field of WEDM to find the optimum parameter;
in the present research, GRA is used to find the response
& Jitendra Kumar
1 Bundelkhand Institute of Engineering and Technology,
Jhansi, India
123
Journal of Industrial Engineering Internationalhttps://doi.org/10.1007/s40092-018-0264-8(0123456789().,-volV)(0123456789().,-volV)

variable of WEDM. An attempt is made by Majhi et al.
(2013) for the determination of the optimal process param-
eters material removal rate, surface roughness and tool wear
rate for EDM process. Modelling and optimisation of
WEDMwere given byKumar andKumar (2013). To find the
optimum surface roughness, they used to input parameters
such as Time On, Time Off, Wire Speed and Wire Feed.
Taguchi techniques have been used for optimisation of
minimizing the SR. Due to multiple variables, an extremely
trained operator with a modern WEDM is rarely to achieve
the optimal performance. Pasam et al. (2010) conducted
research to solve this problem to determine the relation
among the responses and its parameter. The most important
responses in WEDM are metal removal rate, workpiece’s
surface finish, and kerf width. Discharge current, pulse
duration, pulse frequency, wire speed, wire tension, and
dielectric flow rate are some of the machining parameters
which affect the responses. The gap between the wire and
work piece is also an important in wire EDM and it usually
ranges from 0.02 to 0.075 mm given by Mahapatra and
Patnaik (2007). Taguchi-based Grey relational analysis, to
find the optimal process parameter setting for multi-matrix
composite using molybdenum wire of 0.18 mm diameter, as
electrode is applied byLal et al. (2015). Similar technique for
optimisation was used by Shivade and Shinde (2014) for D3
tool steel material. Nayak and Mahapatra (2016) applied an
artificial neural network (ANN) model to determine the
relationship between input parameters and performance
characteristics for taper cutting of deep cryo-treated Inconel
718 with cryo-treated coated Bronco cut-W. In wire elec-
trical discharge machining process 0.2 mm diameter wire
electrode was used. Jaganathan et al. (2012) optimised the
wire EDM parameter and responses MRR and surface finish
for EN31 is done by Taguchi L27 orthogonal array (OA).
Singha and Pradhan (2014) conducted experiment through
Taguchi method and response surface methodology is
applied to estimate the optimummachining condition within
the experimental constraints. Varun and Venkaiah (2014)
used an optimisation strategy by coupling Grey relational
analysis (GRA) with genetic algorithm (GA) to optimise the
response parameters. Experiments were conducted on EN-
353 work material to study the effects of input parameters.
Zinc-coated copper wire with 0.25mmdiameter is used as an
electrode. The response parameter such as material removal
rate (MRR), the surface roughness (SR), and kerf width is
observed. Saha and Mondal (2016) applied an optimisation
technique combining Grey relational analysis with principal
component analysis to identify the optimal combination of
process parameters inWEDM for machining nanostructured
hard facing materials. Sinha et al. (2015) used Taguchi
method for single objective optimisation and then the signal-
to-noise (S/N) ratios obtained from Taguchi method have
been further used in principal component analysis (PCA) for
multi-objective optimisation. Huang and Liao (2003)
applied Grey relational analyses with L18 mixed orthogonal
array to determine the optimal selection of machining
parameters for the wire electrical discharge machining pro-
cess. Baig and Vankaiah (2001) applied Taguchi and Grey
relation analysis to find the optimal parameter settings for
WEDM for a nickel-based alloy.
This work investigates and optimizes the potential pro-
cess parameters influencing the MRR, SR and kerf width
while machiningHSSM2 alloys usingWEDMprocess. This
work involves study of the relation between the various input
process parameters like pulse-on time (Ton), pulse-off time
(Toff), pulse peak current (IP), and wire feed. The RSM
method, a powerful experimental design tool, uses a simple,
effective, and systematic approach for deriving the optimal
machining parameters. Further, this approach requires min-
imum experimental cost and efficiently reduces the effect of
the source of variation. An inexpensive and easy to operate
methodology must be evolved to modify the machined sur-
faces as well as to maintain accuracy. RSMmethodology by
face centred design is used for conducting the design of
experiments to optimise the experimental values for
machining HSS M2 alloys by WEDM. A Grey relation
approach is used to combine all the response in single
response for optimisation to achieve single operating optimal
condition for all the response MRR, SR and Kerf width.
Experimentation detail
Chemical composition of the material HSS-M2 is shown in
Table 1. Two high speed steel plates of 100 mm 9 90
mm 9 7.2 mm size are tempered in furnace to increase its
hardness. It was hardened to 60 HRC. Then, with the help
of WEDM it is sectioned into 20 mm 9 30 mm and it is
weighed. Then, the sample is mounted on the EZEECUT
NXG machine tool and specimens of 10 mm 9 10
mm 9 7.2 mm size are cut by molybdenum wire of
0.18 mm diameter. Experimental setup of EZEECUT NXG
machine is shown in Fig. 1.
The different levels of a factor consider for this study are
depicted in Table 2. The fixed process parameter is voltage,
molybdenum wire, HSS M2 work material, deionised water
as dielectric fluid, wire tension, dielectric pressure, etc.
Measurement of responses
Material removal rate
MRR (metal removal rate) determined the economics of
machining and rate of production. The material removal
rate (g/min) is calculated by weight difference of the
Journal of Industrial Engineering International
123

specimens before and after machining. Mathematical for-
mula used for measuring MRR for all experiments is given
below:
MRR ¼ Wi �Wf
t
where Wi, Wf is the initial and final weight of workpiece
material (g), respectively, and t is the time period of
machining in minutes.
Surface roughness
Roughness is a measure of the texture of a surface. It is
measured (lm) using Veeco Optical Profiler model NT
9080. Figure 2 shows a captured image of surface rough-
ness of sample at parameter 20 ls, 15 lm, 1 A, 50 mm/s
of Ton, Toff, IP, and Wf, respectively.
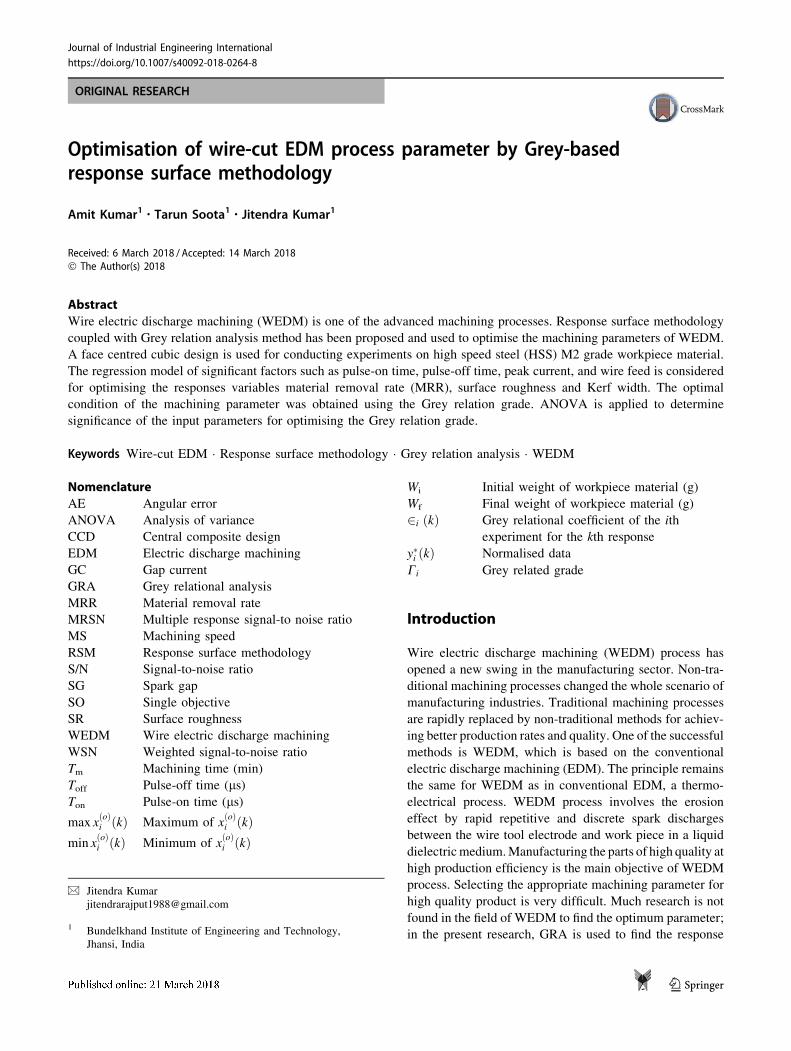
Kerf width
It is a measure of the amount of the material that is wasted
during machining; it also affects the offset condition and
thereby dimensional accuracy. For present experiments,
kerf width has been measured using Mitutoyo Toolmaker’s
Microscope model TM 500. It is measured in mm. As
shown in the Fig. 3.
Experimental results for four parameters in uncoded units
with measurement of response (Material Removal Rate
MRR, Surface roughness, Kerf width) are shown in Table 3.
Table 1 Chemical composition
of the material HSS-M2Constituent C Mn Si S P Cr V Mo W Co Cu
% composition 0.92 0.23 0.18 0.016 0.018 3.85 2.19 4.80 6.40 0.90 0.18
DISPLAY SCREEN
WORK TABLE
WIRE DRUM
SWITCH PANNEL
KEYBOARD
DIELECTRIC TANK
Fig. 1 Schematic diagram of
the WEDM EZEECUT NXG
EN 3240 model
Table 2 Process parameters and their levels
Variable Unit Level
- 1 0 1
Pulse-on time, Ton (A) ls 20 30 40
Pulse-off time, Toff (B) ls 5 10 15
Current, IP (C) A 1 2 3
Wire feed, Wf (D) mm/s 30 40 50
Fig. 2 Surface roughness image
at parameter at 20 ls, 15 lm,
1 A, 50 mm/s (Ton, Toff, IP, Wf)
Journal of Industrial Engineering International
123
Grey relation analysis
GRA is a decision-making method based on Grey system
theory firstly technologically advanced by Deng (1982). In
Grey theory, black means a system with insufficient
information, while a white system represents complete
information. However, the Grey relation is relative to
partial information and is used to characterise the degree of
relationship between the sequences so that the distance of
two factors can be measured individually. When experi-
ments are uncertain or if the experimental method cannot
be performed accurately, Grey analysis contributes to
compensating for the lack of statistical regression. There-
fore, Grey relation analysis is an effective means of ana-
lysing the relationship between less-than-data sequences
and can analyse many factors that can overcome the
drawback of the statistical method by Pradhan (2013). In
the Grey relational analysis, experimental data, that is the
measured quality characteristics, are normally normalised
in the range from 0 to 1. This process is called Grey
relational generation. Based on these data, the Grey rela-
tional coefficients are calculated to represent the correla-
tion between the (best) ideal and the actual normalised
experimental data. The overall Grey relational grade is
Fig. 3 Kerf width of sample image in Mitutoyo Toolmaker’s
Microscope model TM
Table 3 Experimental results for four parameters in uncoded units
Run order Process parameter Responses
A (Ton), ls B (Toff), ls C (IP), A D (Wf), mm/s MRR (g/min) Surface roughness (lm) Kerf width (mm)
1 40 15 3 30 0.0349 3.77 0.22
2 30 10 3 40 0.0314 4.48 0.22
3 40 15 3 50 0.0263 3.66 0.23
4 40 10 2 40 0.0357 4.85 0.25
5 20 5 3 50 0.0253 3.96 0.215
6 30 10 2 50 0.0268 4.23 0.2
7 40 15 1 30 0.0095 3.55 0.24
8 30 10 2 30 0.0383 4.5 0.225
9 30 5 2 40 0.0298 5.5 0.23
10 40 5 1 50 0.0163 5.82 0.225
11 20 5 1 50 0.019 4.19 0.19
12 20 15 3 30 0.0277 2.94 0.199
13 20 5 3 30 0.028 4.4 0.22
14 20 10 2 40 0.0276 3.04 0.19
15 20 15 3 50 0.0208 2.32 0.19
16 20 15 1 50 0.0088 2.61 0.19
17 30 10 2 40 0.0309 4.42 0.21
18 40 15 1 50 0.0141 3.3 0.21
19 40 5 3 30 0.0529 6.55 0.24
20 30 10 1 40 0.0201 4.35 0.205
21 30 10 2 40 0.0304 4.38 0.2
22 20 15 1 30 0.0073 2.78 0.195
23 40 5 3 50 0.0283 6.38 0.225
24 40 5 1 30 0.0101 5.9 0.24
25 30 15 2 40 0.0278 3.27 0.19
26 20 5 1 30 0.0064 4.21 0.22
Journal of Industrial Engineering International
123
determined by averaging the Grey relational coefficients
corresponding to the selected responses. The overall
quality characteristics of the multiple response process
depend on the calculated grey relational grade.
Grey relational generation
There are three different types of data normalisation
according to the requirement of LB, HB, or NB criteria.
MRR follows the HB criterion. So, the normalisation of
original sequence of the response is done as follows:
y�i kð Þ ¼ yi kð Þ �min yiðkÞmax yi kð Þ �min yiðkÞ
ð1Þ
where y�i kð Þ is the normalised data, i.e. after Grey relational
generation, yi kð Þ is the kth response of the ith experiment,
min yi kð Þ is the smallest value of yi kð Þ for the kth response,
and max yi kð Þ is the largest value of yi kð Þ for the kth
response. Surface roughness and Kerf width follow the LB
criterion. Accordingly, the normalisation of these responses
is done as follows:
y�i kð Þ ¼ max yi kð Þ � yiðkÞmax yi kð Þ �min yiðkÞ
: ð2Þ
Grey relational coefficient
The Grey relational coefficient is given as:
2i kð Þ ¼ Dmin þ -Dmax
D0iðkÞ þ -Dmax
ð3Þ
where 2i kð Þ is the Grey relational coefficient of the ith
experiment for the kth response, D0iðkÞ ¼ y�0 kð Þ � y�i kð Þ,i.e. absolute of the difference between y�0 kð Þ and y�i kð Þ,y�0 kð Þ is the ideal or reference sequence, Dmax ¼max
imaxk
y�0 kð Þ � y�i kð Þ is the largest value of D0i, and
Dmin ¼ mini
mink
y�0 kð Þ � y�i kð Þ is the largest value of D0i,
and -ð0k �-� 1Þ is the distinguishing coefficient and
- ¼ 0:5 is generally used.
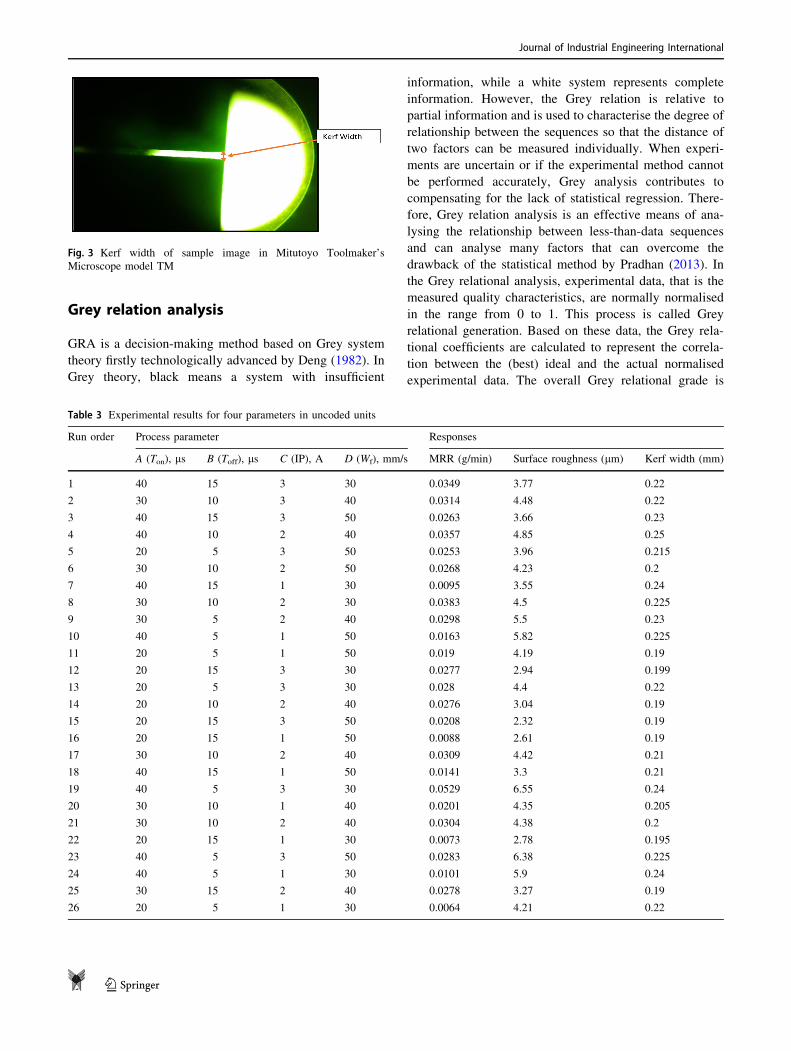
Table 4 Grey relation
coefficientExperiment no. MRR SR Kerf width Grey relation coefficient
MRR 2i ð1Þ SR 2i ð2Þ Kerf width 2i ð3Þ
1 0.0349 3.77 0.22 0.5636 0.5933 0.5
2 0.0314 4.48 0.22 0.5196 0.4947 0.5
3 0.0263 3.66 0.23 0.4664 0.6122 0.4286
4 0.0357 4.85 0.25 0.5748 0.4553 0.3333
5 0.0253 3.96 0.215 0.4572 0.5632 0.5455
6 0.0268 4.23 0.2 0.4711 0.5255 0.75
7 0.0095 3.55 0.24 0.3488 0.6323 0.375
8 0.0383 4.5 0.225 0.6143 0.4924 0.4615
9 0.0298 5.5 0.23 0.5016 0.3994 0.4286
10 0.0163 5.82 0.225 0.3885 0.3767 0.4615
11 0.019 4.19 0.19 0.4068 0.5307 1
12 0.0277 2.94 0.199 0.4799 0.7733 0.7692
13 0.028 4.4 0.22 0.4829 0.5042 0.5
14 0.0276 3.04 0.19 0.4789 0.746 1
15 0.0208 2.32 0.19 0.4201 1 1
16 0.0088 2.61 0.19 0.3452 0.8794 1
17 0.0309 4.42 0.21 0.5138 0.5018 0.6
18 0.0141 3.3 0.21 0.3747 0.6834 0.6
19 0.0529 6.55 0.24 1 0.3333 0.375
20 0.0201 4.35 0.205 0.4148 0.5103 0.6667
21 0.0304 4.38 0.2 0.5082 0.5066 0.75
22 0.0073 2.78 0.195 0.3377 0.8214 0.8571
23 0.0283 6.38 0.225 0.4859 0.3425 0.4615
24 0.0101 5.9 0.24 0.352 0.3714 0.375
25 0.0278 3.27 0.19 0.4809 0.69 1
26 0.0064 4.21 0.22 0.3333 0.5281 0.5
Journal of Industrial Engineering International
123

Grey relation grade
The Grey relational grade (Ci) is calculated by averaging
the Grey relational coefficients:
Di ¼1
Q
XQ
k¼1
2i ðkÞ ð4Þ
where Q is the total number of responses. A high Grey
relational grade corresponds to intense relational degree
between the given sequence and the reference sequence.
The reference sequence, y�0 kð Þ, represents the best process
sequence; therefore, higher Grey relational grade means
that the corresponding parameter combination is closer to
the optimal setting (Table 5).
Multi-response optimisation by Grey analysis
The following Table 4 shows the experimental number
along with the result of MRR, SR, and Kerf width. Grey
relation coefficient for the three responses MRR 2i ð1Þ,SR 2i ð2Þ, and Kerf width 2i ð3Þ has been calculated and
shown in the Table 4 corresponding to MRR, SR, and Kerf
Width using Eqs. 1, 2 and 3.
From Eq. 4, the three-response is converted into single
response, i.e. Grey relation grade. It has been calculated,
corresponding to parameter Ton, Toff, current and wire feed
by passing the response MRR, SR and Kerf width.
The purpose of distinguishing coefficient is to expand or
compress the range of the Grey relational coefficient. The
distinguishing coefficient can be selected by decision
maker judgement, and different distinguishing coefficients
usually provide different results in GRA. They led to the
same optimum factor levels. In this case distinguishing
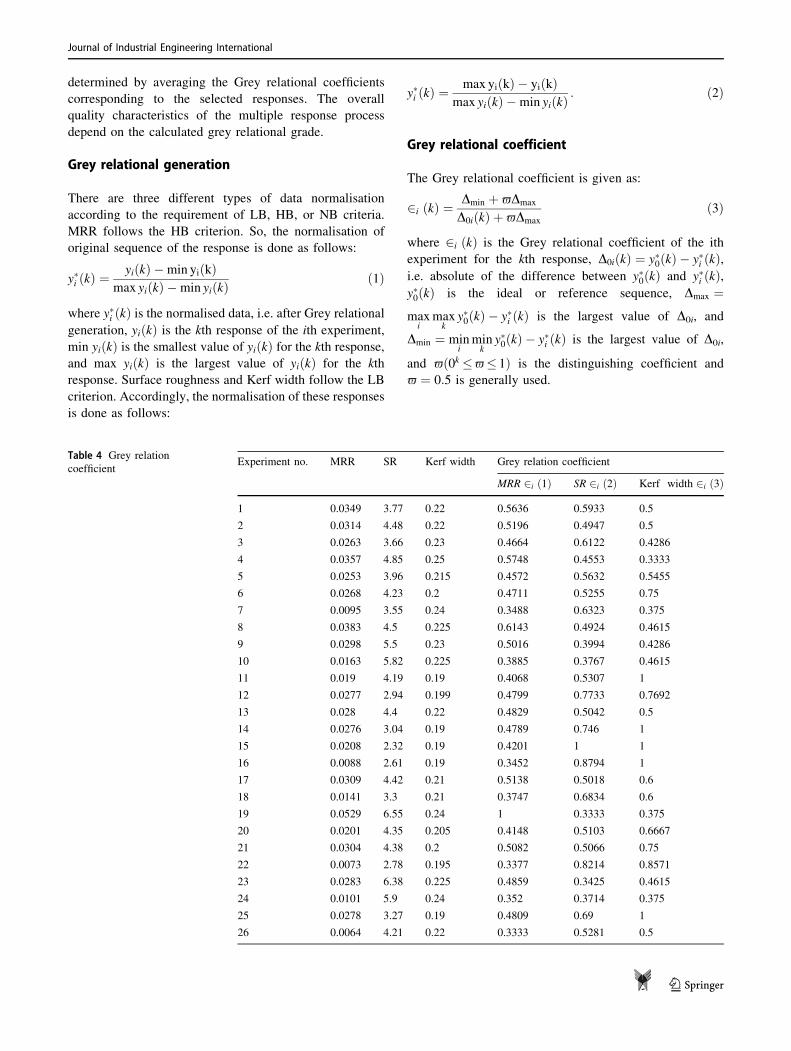
coefficient is taken as 0.5. Figure 2 shows that Grey rela-
tion grade should be found near 0.8 (Table 5).
In Table 6, it is shown that P value of model is linear
and less than 0.05, so these terms are significant, square
and 2-way interaction P value is more than 0.05 so these
terms are non-significant, and non-significance lack of fit is
desired in this case value of LOF that is 0.419 which is
more than 0.05 and non-significant. The coefficient of
determination (R2) which indicates the percentage of total
variation in the response explained by the terms in the
model is 87.96% (Fig. 4).
Table 5 Grey relation grade
Experiment no. A (Ton) B (Toff) C (IP) D (Wf) GRG
1 40 15 3 30 0.5523
2 30 10 3 40 0.5048
3 40 15 3 50 0.5024
4 40 10 2 40 0.4545
5 20 5 3 50 0.522
6 30 10 2 50 0.5822
7 40 15 1 30 0.452
8 30 10 2 30 0.5227
9 30 5 2 40 0.4432
10 40 5 1 50 0.4089
11 20 5 1 50 0.6459
12 20 15 3 30 0.6741
13 20 5 3 30 0.4957
14 20 10 2 40 0.7416
15 20 15 3 50 0.8067
16 20 15 1 50 0.7415
17 30 10 2 40 0.5385
18 40 15 1 50 0.5527
19 40 5 3 30 0.5694
20 30 10 1 40 0.5306
21 30 10 2 40 0.5883
22 20 15 1 30 0.6721
23 40 5 3 50 0.43
24 40 5 1 30 0.3661
25 30 15 2 40 0.7236
26 20 5 1 30 0.4538
Table 6 ANOVA analysis for
Grey relation gradeSource DF Grey relation grade
Adj SS Adj MS F-value P value % contribution
Model 14 0.28801 0.020572 5.74 0.003 87.95917
Linear 4 0.23287 0.058218 16.24 0 71.11924
Square 4 0.008239 0.00206 0.57 0.687 2.516217
2-Way interaction 6 0.046901 0.007817 2.18 0.124 14.32372
Error 11 0.039426 0.003584 12.04083
Lack-of-fit (LOF) 10 0.038186 0.003819 3.08 0.419 11.66213
Pure error 1 0.00124 0.00124 0.3787
Total 25 0.327436 100
Journal of Industrial Engineering International
123
0
0.1
0.2
0.3
0.4
0.5
0.6
0.7
0.8
0.9
1 2 3 4 5 6 7 8 9 10 11 12 13 14 15 16 17 18 19 20 21 22 23 24 25 26G
rey
rela
tion
grad
e Experiment number
Fig. 4 Grey relation grade
variation with number of
experiment
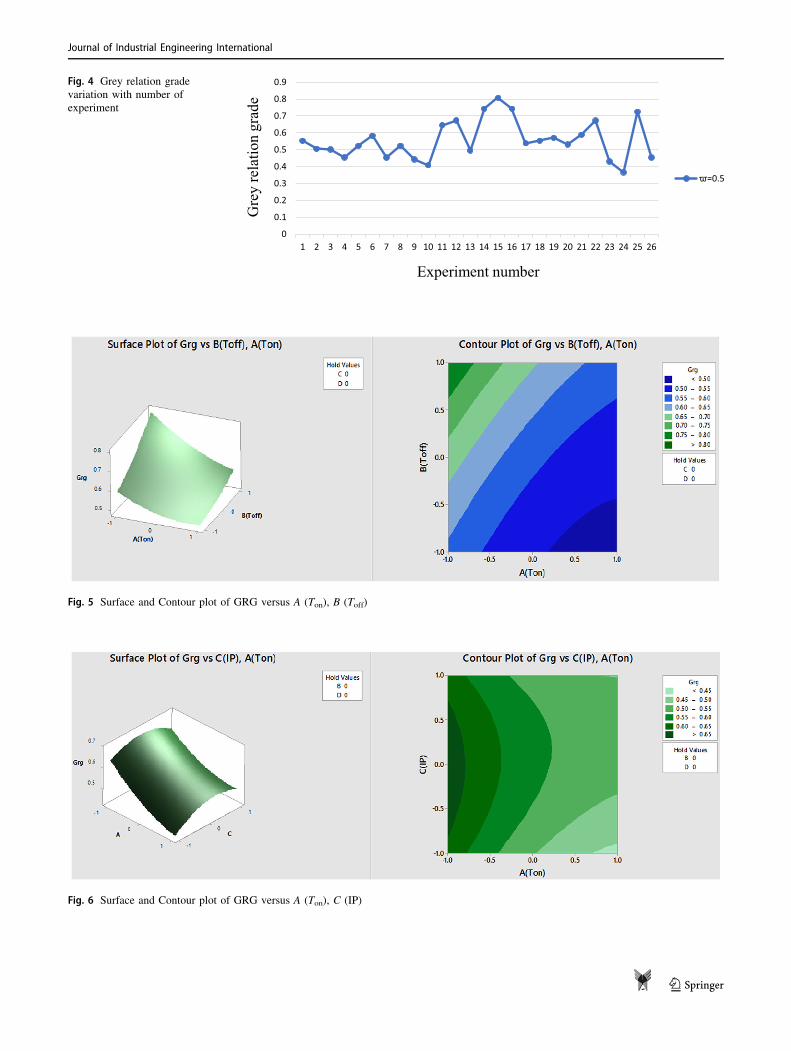
Fig. 5 Surface and Contour plot of GRG versus A (Ton), B (Toff)
Fig. 6 Surface and Contour plot of GRG versus A (Ton), C (IP)
Journal of Industrial Engineering International
123

GRG ¼ 0:5654� 0:0814Aþ 0:0746Bþ 0:0130Cþ 0:0241D coded formð Þ
In Fig. 5, it is observed that GRG is maximum at a lower
value of Ton and a high value of Toff.
It is noticed from the Fig. 6 response surface plot that
GRG is maximum at middle value of current and a higher
value of Ton.
From Fig. 7, it is clearly noticed that GRG is maximum
at lower value of Ton and at higher value of D (Wf).
ANOVA is applied to get the percentage of contribution
of different parameter and their interactions. The percent-
age contribution is calculated by sum of each square
parameter with total sum of square. The lack of fit is
11.66% while pure error is 0.38% (Fig. 8).
Response optimisation of GRG and optimalparameter setting
With the help of response optimizer, we have found the
optimal parameter setting for all three responses:
Response Goal Lower Target Upper Weight Importance
GRG Maximum 0.3661 1 1 1 1
Predicted GRG responses = 0.855339
Desirability = 0.771792
For the above predicted response, the optimal parameter
setting obtained is shown in Table 7.
Conclusion
In this paper, the performance parameters namely metal
removal rate, surface roughness and kerf width are inves-
tigated by varying the machining parameters on workpiece
HSS M2 grade steel. Molybdenum wire of 0.18 mm
diameter is used as an electrode in WEDM. The perfor-
mance parameters of pulse-on time (Ton), pulse-off time
(Toff), peak current (IP) and wire feed rate (Wf) are anal-
ysed. FCCD based on RSM is used for experimental
Fig. 7 Surface and Contour plot of GRG versus A (Ton), D (Wf)
Ton, 36.42
Toff, 30.57
IP, 0.93
Wf, 3.20
Square, 2.52
2-Way Interac�on, 14.32
[CATEGORY NAME], [VALUE]
Pure Error, 0.38
Fig. 8 Percentage contribution of factors on the Grey relation grade
Table 7 Optimised process
parameters of WEDM by Grey
analysis
Parameter Value Units
Ton 20 ls
Toff 15 ls
IP 2 A
Wire feed 50 mm/s
Journal of Industrial Engineering International
123

design. Using Grey analysis, WEDM’s parameter was
optimised and found that optimal responses were material
removal rate (0.03137 g/min), surface roughness (1.79 lm)
and Kerf width (0.19 mm) at optimal parameter at pulse-on
time 20 ls, pulse-off time 15 ls current 2 A, and wire feed
50 mm/s which are the best parametric combination.
Open Access This article is distributed under the terms of the Creative
Commons Attribution 4.0 International License (http://creative
commons.org/licenses/by/4.0/), which permits unrestricted use, dis-
tribution, and reproduction in any medium, provided you give
appropriate credit to the original author(s) and the source, provide a
link to the Creative Commons license, and indicate if changes were
made.
References
Baig K, Venkaiah N (2001) Parametric optimization of WEDM for
Hastelloy C276 using GRA method. Int J Eng Dev Res 1(2):1–7
Deng J (1982) Control problems of grey systems. Syst Control Lett
1(5):288–294
Huang JT, Liao YS (2003) Optimization of machining parameters of
Wire-EDM based on Grey relational and statistical analyses. Int
J Prod Res 41(8):1707–1720. https://doi.org/10.1080/
1352816031000074973
Jaganathan P, Kumar N, Sivasubramanian R (2012) Optimization of
WEDM parameters using Taguchi method. Int J Sci Res Publ
2(12):1–4
Kumar K, Kumar RR (2013) Modelling and optimization of WEDM.
Int J Mod Eng Res 3(3):1645–1648
Lal S, Kumar S, Khan ZA, Siddiquee AN (2015) Multi-response
optimization of wire electrical discharge machining process
parameters for Al7075/Al2O3/SiC hybrid composite using
Taguchi-based Grey relational analysis. J Eng Manuf
229(2):229–237. https://doi.org/10.1177/0954405414526382
Mahapatra SS, Patnaik A (2007) Int J Adv Manuf Technol 34:911.
https://doi.org/10.1007/s00170-006-0672-6
Majhi SK, Pradhan MK, Soni H (2013) Application of integrated
RSM-Grey-entropy analysis for optimization of EDM parame-
ters. In: Proceedings of the International Conference on
Advanced Research in Mechanical Engineering, Coimbatore,
ISBN: 978-93-83060-03-0
Nayak BB, Mahapatra SS (2016) Optimization of WEDM process
parameters using deep cryo-treated Inconel 718 as work
material. Int J Eng Sci Technol 19:161–170
Pasam VK, Battula SB, Valli MP, Swapna M (2010) Optimizing
surface finish in WEDM using the Taguchi parameter design
method. J Braz Soc Mech Sci Eng 49(2010):155–166
Pradhan MK (2013) Estimating the effect of process parameters on
surface integrity of EDM AISI D2 tool steel by response surface
methodology coupled with Grey relation analysis. Int J Adv
Manuf Technol 67:2051–2062
Saha A, Mondal SC (2016) Multi-objective optimization in WEDM
process of nanostructured hard facing materials through hybrid
techniques. Measurement 94:46–59
Shivade AS, Shinde VD (2014) Multi-objective optimization in
WEDM of D3 tool steel using integrated approach of Taguchi
method & Grey relational analysis. J Ind Eng Int 10:149. https://
doi.org/10.1007/s40092-014-0081-7
Singha V, Pradhan SK (2014) Optimization of WEDM parameters
using Taguchi technique and response surface methodology in
machining of AISI D2 steel. Procedia Eng 97:1597–1608.
https://doi.org/10.1016/j.proeng.2014.12.310
Sinha P, Kumar R, Singh GK, Thomas D, Srivastava T (2015)
Optimization of wire EDM of AISI D3 tool steel using
orthogonal array with principal component analysis. Mater
Today Proc 2(4–5):2512–2521. https://doi.org/10.1016/j.matpr.
2015.07.196
Varun A, Venkaiah N (2014) Simultaneous optimization of WEDM
responses using Grey relational analysis coupled with genetic
algorithm while machining EN 353. Int J Adv Manuf Technol.
https://doi.org/10.1007/s00170-014-6198-4
Journal of Industrial Engineering International
123