optimisation of the drill and blast work in the open pit rabenwald mine of rio tinto minerals
TRANSCRIPT

Optimisation of the drill and blast work in the open pit Rabenwald
mine of Rio Tinto Minerals
Author: Florian Bauer Leoben, February 2007

ii
STATEMENT OF ORIGINALITY
„I hereby declare that this report is my own work and that it contains, to the best
knowledge and belief, no material previously published or written by another person nor
material which to a substantial extent has been submitted for another course, except where
due acknowledgement is made in the report.”

iii
SUMMARYI have been assigned by the Naintsch Mineralwerke to evaluate the As-Is State at the
Rabenwald mine and the State of the Art in drilling and blasting. Therefore all aspects of
drilling and blasting were examined, from the planning process at the beginning, a wall
surveying program, the drilling process, the charging of the holes up to the documentation and
measurement of ground vibrations and blasting results.
It was found that in many cases to achieve the aim of being State of the Art a better utilisation
of already existing resources is recommended. Nevertheless some aspects need a bigger
investment, like a new automatic drilling and GPS-guided surface crawler.
What is common for all aspects is that they need a thorough planning process that works in
the background of all of them. This is also the objective for the long term, to build up a
management system for the whole drilling and blasting process as a central guidance and
planning tool to make the process more economic and safer for all involved people.
iv
CONTENTS
Statement of Originality ............................................................................................................. ii Summary ...................................................................................................................................iii Contents..................................................................................................................................... iv 1. Introduction ........................................................................................................................ 1
1.1. The Deposit ................................................................................................................ 1 2. Project Overview................................................................................................................ 3 3. As-Is State .......................................................................................................................... 4
3.1. Layout of the blasting work ....................................................................................... 4 3.2. Surveying of the Wall ................................................................................................ 4 3.3. Drilling ....................................................................................................................... 4 3.4. Quality of the Boreholes ............................................................................................ 5 3.5. Detonators .................................................................................................................. 5 3.6. Way of Initiation ........................................................................................................ 53.7. Blastin Agent / Column Design ................................................................................. 5 3.8. Loading the Holes ...................................................................................................... 6 3.9. Documentation of the Blast........................................................................................ 7 3.10. Documentation / Measuring the Blasting Result.................................................. 11 3.11. Noise and Vibration – Neighbours....................................................................... 11 3.12. Clearing of the Blasting Area............................................................................... 11
4. Taken Measurements and Data Gathered......................................................................... 13 4.1. Surveying with the Theodolite ................................................................................. 13 4.2. Surveying of the Wall with the 3G-System ............................................................. 14 4.3. Quality of the Boreholes .......................................................................................... 17 4.4. Documentation of Charging ..................................................................................... 23 4.5. Vibration Measurement............................................................................................ 24 4.6. Noise Measurements ................................................................................................ 26
5. Analysis of data measured................................................................................................ 27 5.1. Analysis of blast geometry....................................................................................... 27
5.1.1. Burden and Spacing ......................................................................................... 27 5.1.2. Powder Factor .................................................................................................. 29
5.2. Positioning of the Drill Rig ...................................................................................... 30 5.3. Wall Surveying with 3G System.............................................................................. 31 5.4. Quality of the Borehole ............................................................................................ 32 5.5. Analysis of Vibration Measurements....................................................................... 33 5.6. Analysis of Noise Measurements............................................................................. 35
6. Deviations Between Planned and Monitored Data .......................................................... 36 6.1. Borehole Specifications............................................................................................ 36 6.2. Blasting Pattern ........................................................................................................ 366.3. Powder Factor .......................................................................................................... 42 6.5. Vibrations ................................................................................................................. 44
7. The State of the Art in Drilling and Blasting ................................................................... 46 7.1. Planning a Blast........................................................................................................ 46
7.1.1. Review on the planning process of the blast .................................................... 46 7.2. Surveying of the Wall .............................................................................................. 46
7.2.1. Review on the Actual Process of Surveying the Wall ..................................... 47 7.3. Drilling ..................................................................................................................... 48
7.3.1. Smart Rig System............................................................................................. 48

v
7.3.2. Review on the Actual Drilling ......................................................................... 50 7.4. Measuring Borehole Deviations............................................................................... 51 7.5. Detonators ................................................................................................................ 51
7.5.1. Review on the Electric Detonators................................................................... 51 7.6. Way of initiation....................................................................................................... 52
7.6.1. Review on the actual way of initiation............................................................. 52 7.7. Blasting Agent/Column Design ............................................................................... 53
7.7.1. Review on the column design .......................................................................... 53 7.8. Loading the holes ..................................................................................................... 53
7.8.1. Review on Loading the Holes .......................................................................... 54 7.9. Documentation of the Blast...................................................................................... 54 7.10. Documentation of the Blasting Result ................................................................. 54
7.10.1. Review on Documentation of the Blasting Result ........................................... 55 7.11. Ground Vibrations and Noise Measurements ...................................................... 56
7.11.1. Review on the actual state in ground vibrations and noise measurements ...... 56 8. Gap Analysis .................................................................................................................... 57
8.1. Layout of the Blasting Work.................................................................................... 57 8.2. Surveying the wall.................................................................................................... 57 8.3. Drilling ..................................................................................................................... 57 8.4. Quality of the Boreholes .......................................................................................... 57 8.5. Detonators/Way of Initiation.................................................................................... 58 8.6. Blasting Agent/Column Design ............................................................................... 58 8.7. Loading the Holes .................................................................................................... 58 8.8. Documentation of the Blast...................................................................................... 58 8.9. Documentation of the Blasting Result ..................................................................... 58 8.10. Ground Vibrations and Noise............................................................................... 58
9. Economic and Safety Benefits ......................................................................................... 60 9.1. Surveying of the Wall ............................................................................................. 60 9.2. Drilling ..................................................................................................................... 60 9.3. Quality of the Boreholes .......................................................................................... 60 9.4. Detonators ................................................................................................................ 619.5. Way of initiation....................................................................................................... 619.6. Blasting Agent.......................................................................................................... 619.7. Loading the Holes .................................................................................................... 61 9.8. Documentation of the blast ...................................................................................... 62 9.9. Documentation of the Blasting Result ..................................................................... 62 9.10. Noise and Vibrations............................................................................................ 62
10. Conclusions .................................................................................................................. 63 10.1. Short Term Realisation......................................................................................... 63 10.2. Middle Term Realisation...................................................................................... 63 10.3. Long Term Realisation......................................................................................... 64
Bibliography............................................................................................................................. 65 Appendix A: Drill Operator’s and Shot-Firer’s Blast Records ................................................ 67 Appendix B: Vibration Event Reports ..................................................................................... 89 Appendix C: Surveyed Shot Plans ........................................................................................... 93 Appendix D: Pictures of the Surveyed Walls with the 3G-Software....................................... 96 Appendix E: Data Sheets from Loading the Holes ................................................................ 105

vi
Figures
Figure 1: Longitudinal section through the talc deposit………………………………….. 1Figure 2: Direction of initiation of a blasthole…………………………………………… 5Figure 3: The blasters truck with the crane mounted to it………………………………... 6
Figure 4: Drill operator's record of the 1st blast…………………………………………... 8
Figure 5: Shot-firer's record of the 1st blast………………………………………………. 9
Figure 6: Shot-firer's plan of the 1st blast…………………………………………………. 10
Figure 7: Blast vibrations event report of the 1st blast……………………………………. 12
Figure 8: Surveyed shot plan of the borehole starting points from the 10th blast………… 13
Figure 9: Surveyed shot plan of the borehole staring points from the 9th blast…………... 14
Figure 10: 3G-front-picture from the 4th blast……………………………………………. 15
Figure 11: 3G-side-picture from the 4th blast…………………………………………….. 15
Figure 12: Picture of the first borehole with burdens from the 4th blast………………….. 16
Figure 13: Plan view of the wall from the 4th blast……………………………………….. 16
Figure 14: Borehole deviation display from the 8th blast…………………………………. 18
Figure 15: Front view of the boreholes from the 8th blast………………………………… 19
Figure 16: Borehole deviation display for the 9th blast…………………………………… 19
Figure 17: Borehole deviation display from the 10th blast………………………………... 20
Figure 18: Detailed display of hole number 3 from the 9th blast…………………………. 21
Figure 19: Detailed display of hole number 9 from the 9th blast…………………………. 21Figure 20: Map of the Rabenwald mine showing the blasting areas and the neighbours Reithofer and Stoppacher…………………………………………………………………. 24Figure 21: A DIN 4150 diagram showing the vibration velocity versus frequency……… 25Figure 22: Results from noise measurements…………………………………………….. 26Figure 23: Explanation of spacing S and burden B………………………………………. 27Figure 24: Average burdens and spacings from the eight surveyed blasts……………….. 28Figure 25: Difference between smallest and biggest burdens and spacings for the eight surveyed blasts……………………………………………………………………………. 28Figure 26: Average powder factors for blast 3 to blast 10………………………………... 29Figure 27: Changing powder factors per hole for blast 9………………………………… 30Figure 28: Changing powder factors per hole for blast 10……………………………….. 30Figure 29: Borehole direction resulting from slight turns of Drillrig…………………….. 31
Figure 30: Example of a too long drilled borehole from the 10th blast…………………… 32Figure 31: Measured and predicted vibration velocities………………………………….. 34Figure 32: Correlation of predicted and measured vibration velocities…………………... 34Figure 33: Log maximum vibrations versus log scaled distance diagram………………... 35Figure 34: Comparison of recorded and measured burdens……………………………… 37Figure 35: Comparison of recorded and measured spacings……………………………... 38Figure 36: Comparison of recorded and monitored average blasted area per hole……….. 39Figure 37: Intended direction where muck should be thrown………………………… 40

vii
Figure 38: Direction where the muck was actually thrown by changing the ignition sequence (delay numbers shown)………………………………………………………… 40Figure 39: Different powder factors before and after the change of ignition sequence for blast 9……………………………………………………………………………………... 41Figure 40: Different energy/borehole before and after the change of ignition sequence for blast 9…………………………………………………………………………………. 41Figure 41: Comparison of recorded and planned powder factors………………………… 42Figure 42: Comparison of mass explosive recorded and charged for blast 8…………….. 43Figure 43: Comparison of mass explosive recorded and charged for blast 9…………….. 43Figure 44: Comparison of vibration values……………………………………………….. 45Figure 45: Difference between DTH-hammer and tophammer in relation to the penetration rate……………………………………………………………………………. 48Figure 46: Comparison of conventional positioning and HNS…………………………… 49Figure 47: Atlas Copco Roc F9 SmartRig Surface Crawler……………………………… 50Figure 48: The ikon-system of Orica, showing the electronic detonator, the blaster, the logger and the planning software…………………………………………………………. 51Figure 49: Drawing of an ideal blasting column………………………………………….. 52Figure 50: Example of an anfo trailer from DynoNobel………………………………….. 54
Figure 51: Drill operator's record of the 2nd blast………………………………………… 67
Figure 52: Shot-firer's record of the 2nd blast……………………………………………... 68
Figure 53: Shot-firer's plan of the 2nd blast……………………………………………….. 69
Figure 54: Drill operator's record of the 3rd blast…………………………………………. 70
Figure 55: Shot-firer's record for the 3rd blast…………………………………………….. 71
Figure 56: Shot-firer's plan of the 3rd blast……………………………………………….. 72
Figure 57: Drill operator's record of the 4th blast…………………………………………. 73
Figure 58: Shot-firer's record of the 4th blast……………………………………………... 74
Figure 59: Shot-firer's record of the 4th blast……………………………………………... 75
Figure 60: Drill operator's record of the 5th blast…………………………………………. 76
Figure 61: Shot-firer's record of the 5th blast……………………………………………... 77
Figure 62: Shot-firer's plan of the 5th blast……………………………………………….. 78
Figure 63: Drill operator's record of the 6th blast…………………………………………. 79
Figure 64: Shot-firer's record of the 6th blast……………………………………………... 80
Figure 65: Drill operator's record of the 7th blast…………………………………………. 81
Figure 66: Shot-firer's record of the 7th blast……………………………………………... 82
Figure 67: Drill operator's record of the 8th blast…………………………………………. 83
Figure 68: Shot-firer's record of the 8th blast……………………………………………... 84
Figure 69: Shot-firer's plan of the 8th blast……………………………………………….. 85
Figure 70: Drill operator's record of the 9th blast…………………………………………. 86
Figure 71: Shot-firer's record of the 9th blast……………………………………………... 87
Figure 72: Shot-firer's plan of the 9th blast……………………………………………….. 88
Figure 73: Vibrations event report from the 4th blast……………………………………... 89
Figure 74: Vibrations event report from the 5th blast……………………………………... 90

viii
Figure 75: Vibrations event report from the 7th blast……………………………………... 91
Figure 76: Vibrations event report from the 8th blast……………………………………... 92
Figure 77: Surveyed shot plan of the borehole starting points from the 3rd blast………… 93
Figure 78: Surveyed shot plan for the borehole starting points from the 4th blast………... 93
Figure 79: Surveyed shot plan for the borehole starting points from the 5th blast………... 94
Figure 80: Surveyed shot plan for the borehole starting points from the 6th blast………... 94
Figure 81: Surveyed shot plan for the borehole starting points from the 7th blast………... 95
Figure 82: Surveyed shot plan for the borehole starting points from the 8th blast………... 95
Figure 83: 3G-front-picture from the 5th blast……………………………………………. 96
Figure 84: 3G-side-picture left from the 5th blast………………………………………… 96
Figure 85: 3G-side-picture right from the 5th blast……………………………………….. 97
Figure 86: Plan view of the wall from the 5th blast……………………………………….. 97
Figure 87: 3G-front-picture of the 7th blast (left side)……………………………………. 98
Figure 88: 3G-side-picture of the 7th blast (left side)……………………………………... 98
Figure 89: Picture of the first borehole with burdens from the 7th blast (left side)……….. 99
Figure 90: Plan view of the 7th blast (left side)…………………………………………… 99
Figure 91: 3G-front-picture of the 7th blast (right side)…………………………………... 100
Figure 92: 3G-side-picture of the 7th blast (right side)…………………………………… 100
Figure 93: Picture of the first borehole with burdens from the 7th blast (right side)……... 101
Figure 94: Plan view of the 7th blast (right side)………………………………………….. 101
Figure 95: 3G-front-picture of the 9th blast……………………………………………….. 102
Figure 96: 3G-side-picture from the 9th blast……………………………………………... 102
Figure 97: Plan view from the 9th blast…………………………………………………… 103
Figure 98: 3G-front-picture of the 10th blast……………………………………………… 103
Figure 99: 3G-side-picture of the 10th blast………………………………………………. 104
Figure 100: Plan view of the 10th blast…………………………………………………… 104
TablesTable 1: Specifications of used explosives ................................................................................ 6 Table 2: Overview of the gathered data ................................................................................... 13 Table 3: Comparison of vanishing lights from the 6th and 7th blast ......................................... 17 Table 4: Overview of borehole deviations ............................................................................... 22 Table 5: Data sheet of the 1st blast ........................................................................................... 23 Table 6: Measured vibration velocities .................................................................................... 25 Table 7: Summary of average burdens and spacings ............................................................... 27 Table 8: Average powder factors ............................................................................................. 29 Table 9: Summary of derived data from 3G-system ................................................................ 31 Table 10: Summary of measured borehole deviations ............................................................. 33

ix
Table 11: Comparison of measured, calculated and drill operators records of borehole specifications............................................................................................................................ 36 Table 12: Comparison of recorded and measured burdens and spacing .................................. 37 Table 13: Comparison of recorded and monitored average blasted area per hole ................... 38 Table 14: Comparison from the shot-firer's and the monitored powder factor........................ 42 Table 15: Comparison of vibration values ............................................................................... 44 Table 16: Two examples for a possible drill length saving...................................................... 47 Table 17: Possible documentation sheet for the blasting result ............................................... 55 Table 18: Data sheet of the 2nd blast ...................................................................................... 105 Table 19: Data sheet of the 3rd blast ....................................................................................... 107 Table 20: Data sheet of the 4th blast ....................................................................................... 108 Table 21: Data sheet of the 5th blast ....................................................................................... 110 Table 22: Data sheet of the 6th blast ....................................................................................... 111 Table 23: Data sheet of the 7th blast ....................................................................................... 113 Table 24: Data sheet of the 8th blast ....................................................................................... 115 Table 25: Data sheet of the 9th blast ....................................................................................... 117 Table 26: Data sheet of the 10th blast ..................................................................................... 118

1
1. INTRODUCTIONThe Naintsch Mineralwerke, part of the Rio Tinto and Luzenac group extract at the
Rabenwald mine about 100 000 t talc a year. To do that more than 2 million tonnes of
overburden have to be removed. This is done by drilling and blasting. Talc is mined
mechanically using a hydraulic digger.
In order to realise excellence programs, the Naintsch Mineralwerke are working to bring the
drilling and blasting work to the highest possible level. In particular the drilling and blasting
work should get more economic and safer.
Moreover Rio Tinto wants to create a reference model for surface drilling and blasting and
even use the mine as a training centre for drilling and blasting work for the whole company
group.
To achieve this target all necessary data to describe the state of the art in drilling and blasting
were evaluated and a gap-analysis was conducted to find the economic and safety benefits of
a change to the newest standards and techniques.
1.1. THE DEPOSIT
The Rabenwald mine is located on a crest about 2.5 km in the south east of the
Rabenwaldkogel at about 1100 m above sea level. It lies right on the boarder between the two
political districts Weiz and Hartberg in eastern styria
The talc deposit is part of the sub-eastern-crystalline at the eastern edge of the Alps in a gneiss
basement. It is spacious bonded to tectonic overfolded areas that are part of a big faulted zone.
This tabular talc faulted zone dips with 5 to 7 degrees into a south and south-western direction
and therefore most times parallel to the hills edge (Figure 1).
N SHalde
Nordtagebau
Krughofkogel
Südtagebau
Figure 1: Longitudinal section through the talc deposit, Source [25]

2
The whole deposit covers an area of about 7.5 km². The talc zone is between 20 and 50 m
thick due to different thicknesses of the waste rock strata. The overburden is between a few
meters thick where it reaches the surface and 100 to 150 m thick under elevations like the
Krughofkogel (see Figure 1).
From the lithology the deposit consists of talc-chlorite-schist, leucophylite and a little bit of
dolomite and magnesite. The waste rock stratas are paragneiss, othogneiss and granite-mica
schist.
The surrounding rock is in large parts competent rock, where it is untouched. Exceptions are
the axial and cross running faulted zones and the pre-damaged areas of the old underground
mining operations.
3
2. PROJECT OVERVIEWThe following will explain the goals of this thesis, the approach and the way it was realised.
The thesis is divided into three parts:
The first part is the evaluation of the actual drill and blast work. These comprise:
� Planning of the drilling and blasting work
� Surveying of the wall
� Drilling
� Quality of the boreholes
� Detonators
� Way of initiation
� Blasting agent / column design
� Way of borehole charging
� Documentation of the blast and the blasting quality in terms of fragmentation
� Noise and vibrations
A precise explanation how the data was gathered is shown section 4.
The second part consists of the description of the latest technology in drilling and blasting.
This was based on a literature survey.
Further on, in a third part, a gap analysis between the latest technology drilling and blasting
and the actual work it is done. This Gap-Analysis comprised also an evaluation of the
economical consequences and the safety risks of the gap found.

4
3. AS-IS STATE
3.1. LAYOUT OF THE BLASTING WORK
At the moment the layout for a blast is defined by the driller and the pit deputy. They visit the
blasting site together and define the blasting area. The driller decides about the actual position
for each hole, using a wooden stick with self-made marks on it and sprays the position for
each hole on the ground. The position of the boreholes is not surveyed nor are they marked in
a map.
3.2. SURVEYING OF THE WALL
In summer 2006 the Rabenwald mine bought the wall surveying system of the 3G Company.
This system allows a photogrammetric surveying of the wall by making two pictures of the
wall in a small distance from each other. A reference stick on the picture makes it possible to
match the photo later with a scale. The provided computer software compares the two pictures
and creates a 3D-image. Further more it is possible to insert boreholes to the 3D-picture, with
previously defined burden and spacing, get the total blasted volume in cubic meter or tonnes,
and read out the actual burden over the full length of each borehole.
During the data gathering, from August 2006 till the beginning of October 2006 the 3G -
system has not been used at all nor was the wall surveyed with a theodolite. It was never
recognised that the height of the wall was measured before the drilling process.
3.3. DRILLING
In advance of the drilling process material that lies on the edge of the wall for safety reasons
as a barricade is pushed down using a bulldozer. Then drilling is conducted with the
tophammer drilling machine Atlas Copco F9. The driller drives from each marked top
position for each hole to the next and drills the boreholes. Until the middle of September 2006
the holes where drilled with an inclination of 80 degrees then it was changed to 75 degrees.
The actual length of each hole is defined by the driller from his experience. The orientation of
the drill boom is done with the inclinometers mounted on the drill rig. The azimuth of the drill
holes is visually estimated. Therefore the driller tries, if possible, to position the drill rig
parallel to the wall and drills the holes.

5
3.4. QUALITY OF THE BOREHOLES
At the moment the Rabenwald mine does not measure the quality of the boreholes at all. The
only thing that is done is that the driller lowers a plumb (piece of metal) to check if the holes
are not blocked. Sometimes also a torch or a mirror is used.
3.5. DETONATORS
The Rabenwald mine is using electric detonators with pyrotechnic delays for blasting. These
Polex-detonators are highly insensitive (inner resistance: 0,09 Ohm). They are available in 21
steps including the momentum detonator (delay 0 ms) with 20 ms between each step. This
means the delay times are: 0 ms, 20 ms, 40 ms, 60 ms…...400 ms.
3.6. WAY OF INITIATION
The blast is initiated from the top of the borehole using a detonating cord on which the
detonator is attached on the sureface (Figure 2).
3.7. BLASTIN AGENT / COLUMN DESIGN
The way the column is build currently is shown in Figure 2.
Detonatingcord
Cartridges
Bulk Anfo
Stemming:drill cuttings
Electric detonator
Direction of initiationfrom top to bottom
Figure 2: Direction of initiation of a blasthole

6
Firstly a detonating cord (20 g/m) is fixed on a cartridge, either gelatine or emulsion, and
lowered into the borehole. After that another two cartridges follow, depending if the borehole
is wet (emulsion) or dry (gelatine). The exact amount is not fixed and depends also on the
availability of the explosive. If the hole is filled with water to the top, the whole column is
charged with emulsion cartridges.
In dry boreholes, after three cartridges, the hole is charged with Anfo up to a height of 3.5 m
from the collar. The rest of the hole is filled with stemming, typically drill cuttings.
On the outside of the hole the detonator is mounted on the detonating cord, using a plastic
wrapping. If there is enough time, detonating cords too long are cut off and the part of the
detonating cord outside the borehole is covered with drill cuttings.
All explosives are delivered by the Alpspreng-company. The exact specifications of the used
explosives are: Table 1: Specifications of used explosives
Kind of explosive Name Length
[ mm]
Density
[g/cm³]
Diameter
[mm]
Weight of one
package [kg]
Gelatine (cartridged) Supergel 30 600 1,4 65 2,5/cartridge
Emulsion (cartridged) Emulgit 82GP 600 1,2 65 2,5/cartridge
Anfo (bulk) Prillex 1 - 0,82 - 25/bag
3.8. LOADING THE HOLES
By now the workmen drive with a truck to the blasting location. They unload their truck using
Figure 3: The blasters truck with the crane mounted to it

7
a crane that is mounted to the truck (Figure 3) and distribute the explosives to each borehole
manually. This means carrying the 2.5 kg cartridges of gelatine and emulsion explosives and
the 25 kg bags of Anfo explosives.
3.9. DOCUMENTATION OF THE BLAST
The blast is documented according to the “Sprengarbeitenverordnung”, which is the Austrian
regulatory framework for blasting operations. This means the operator of the drilling machine
has to record how many holes he has drilled and to which depth and the shot-firer has to draw
a plan containing the position of each hole and the amount of explosive it is charged with.
This documentation can be seen in Figure 4 (record of the drill operator) and Figure 5 & 6
(record of the shot-firer). All the other records of the blasts analysed in the frame of this study
are attached in Appendix A. There is no shot-firer’s plan from the 6th and 7th blast. From the
10th blast no data is available at all.

8
Figure 4: Drill operator's record of the 1st blast, Source [27]

9
Figure 5: Shot-firer's record of the 1st blast, Source [27]

10
Figure 6: Shot-firer's plan of the 1st blast, Source [27]
11
3.10. DOCUMENTATION / MEASURING THE BLASTING RESULT
At the moment there is no written documentation of the blasting result nor is it measured. The
shot-firer just walks back to the blasting area and has a look at the result to make sure all
holes detonated successfully.
3.11. NOISE AND VIBRATION – NEIGHBOURS
The company owns two vibration measurement systems (the Minimate Plus W/ext.Geo and
the S3 Std Triaxial-Geophone, both from the Instantel company) which are regularly in use.
An example of a vibration measurement event report is shown is Figure 7. All the other event
reports are shown in Appendix B. There are no such reports from the 2nd, 3rd, 6th, 9th and 10th
blast. To my extent of knowledge noise is not measured.
One neighbour who is within the 300 m safety radius of the blasts most times has to be
contacted by telephone and fax about the actual blasting time. All other neighbours know that
the official blasting times are between ten o’clock am and two o’clock pm every day.
3.12. CLEARING OF THE BLASTING AREA
The Austrian law says that every blasting area has to be cleared within a radius of 300 m.
During a blast all streets to the pit are secured by a truck, the pit deputy or workmen, who are
all equipped with walkie talkies, to be able to stop the blast in case of an unexpected situation.
The positions for all people who close streets in case of blasts are always the same; the exact
positions of the 300 m safety radius are not read out anew every blast nor are they marked in a
plan.

12
Figure 7: Blast vibrations event report of the 1st blast, Source [27]

13
4. TAKEN MEASUREMENTS AND DATA GATHEREDTable 2 shows an overview of blasts analysed in the frame of this study, of data gathered and
when it was measured. Table 2: Overview of the gathered data parameters registered
date of blast
3G wall surveying
Surveying of the holes with theodolite
boreholedeviation
measurement
chargingdocumentation
vibrationmeasurement
noisemeasurement
photosof blast
blast 1 30.08.2006 (x) x x x x blast 2 01.09.2006 (x) x x x x blast 3 05.09.2006 x (x) x x x x
blast 4 07.09.2006 x x (x) x x value from
company x x
blast 5 09.09.2006 x x (x) x x value from
company x blast 6 15.09.2006 x (x) x x x x blast 7 19.09.2006 x x (x) x x x blast 8 26.09.2006 x x x x x blast 9 28.09.2006 x x x x x x blast 10 05.10.2006 x x x x
(x)….values were measured but can not be used because of wrong calibrated measurement device
4.1. SURVEYING WITH THE THEODOLITE
The following two figures (Figure 8 & 9) show a typical example of a surveyed blasting plan.
All other plans of surveyed holes are attached in Appendix C. The lines between the red
cycles show the edge of the wall, the green cycles are the drilled boreholes.
Figure 8: Surveyed shot plan of the borehole starting points from the 10th blast

14
In order to measure the borehole starting points the theodolite was positioned on a place with
known coordinates. Then a mirror was positioned over each hole and the distance to the
mirror as well as the vertical and horizontal angle measured. From that the position for each
hole could be calculated.
4.2. SURVEYING OF THE WALL WITH THE 3G-SYSTEM
During the data gathering for the 3G-system two problems occurred, which made it often
impossible to get a good picture of the blasted walls. Sometimes the wall or parts of it were
not visible because of pushed off muck (Figure 12) on the toe of the wall or the wall was not
scaled off at all. Another time is was just not possible to see the wall because of too big
distances between the wall and the possible photo position or there was no accessible bench in
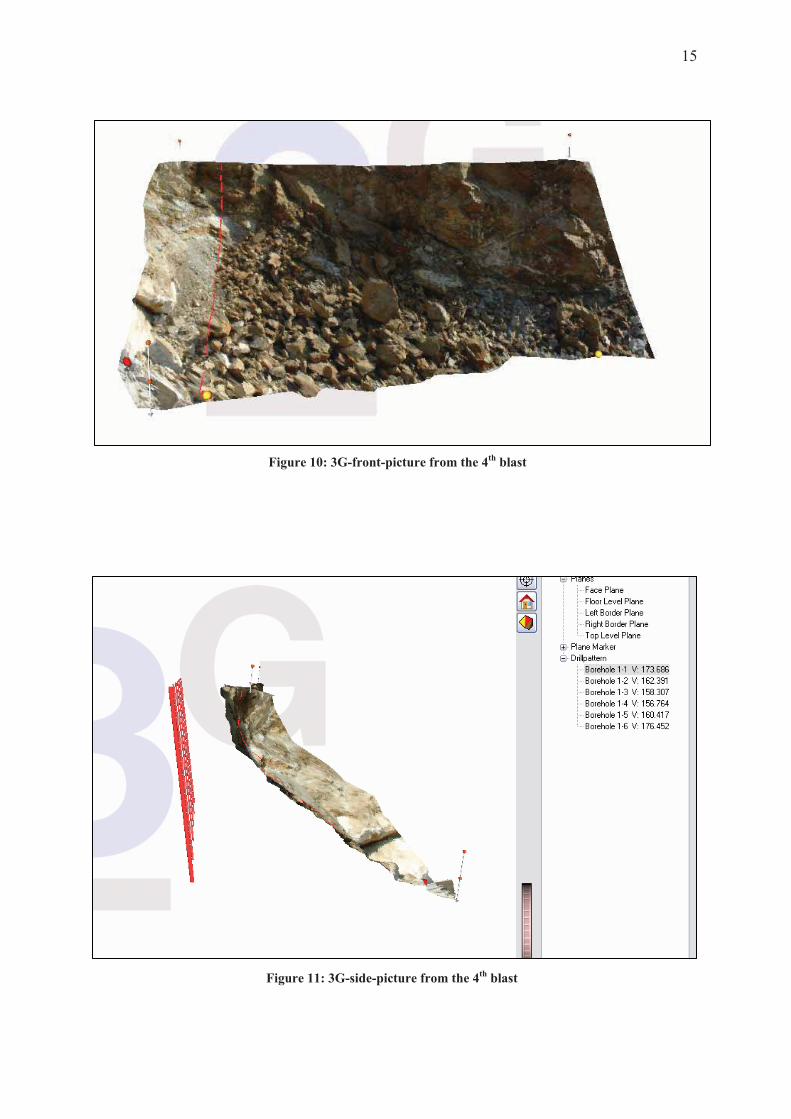
front of the wall to make a photo. Even though some photos created useful results. These can
be seen in Figure 10 to 13. All the other pictures of surveyed walls are shown in Appendix D.
Figure 9: Surveyed shot plan of the borehole staring points from the 9th blast
15
Figure 10: 3G-front-picture from the 4th blast
Figure 11: 3G-side-picture from the 4th blast

16
Figure 12: Picture of the first borehole with burdens from the 4th blast
From here on muck
Figure 13: Plan view of the wall from the 4th blast

17
4.3. QUALITY OF THE BOREHOLES
For measuring the deviation of the boreholes the Boretrack system of MDL was used.
Therefore a measurement rod was lowered in the holes and re-raised in 1 m increments. Each
meter the deviation from the vertical is measured and the value saved. Software then connects
these points and displays the actual run of the hole and the position compared to the other
holes as well as the intended direction.
Unfortunately only 3 of the 10 blasts can be used, because the compass of the measurement
rod was not calibrated correctly. Nevertheless it can be said that the holes from the first blasts
were really bad. One was not even able to see to the bottom of the holes with a torch that was
lowered into every hole. For 75 % of the holes the light vanished before the depth of 7 m,
which is already an information about the poor quality of the holes. This circumstance
changed after the first presentation on gathered data at the company and the holes got quite
better. This can be seen from the comparison of blast 6 to blast 7 in Table 3.
Table 3: Comparison of vanishing lights from the 6th and 7th blast 6th blast 7th blast
Number of Borehole
Light vanishing [m]
Number of Borehole
Light vanishing [m]
14 3 38 7,3 39 3,4 7 7,8 13 3,7 21 8,4 40 4 39 8,4 36 4,2 32 9,3
5 4,5 10 10,3 12 4,6 33 10,6
8 5 36 10,7 19 5,1 8 10,8 21 5,1 9 10,8 34 5,3 29 10,9 42 5,4 37 11
4 5,5 41 11,4 41 5,5 5 11,5
3 5,6 27 11,5 30 6,3 6 11,6 17 6,4 14 11,6 22 6,4 22 11,6 35 6,4 40 11,6 38 6,5 1 11,7 25 6,6 18 11,7 33 6,6 24 11,7
2 6,7 30 11,7 31 6,7 13 11,8 32 6,7 17 11,9 24 6,8 42 11,9 37 6,8 3 12
1 6,9 11 12

18
6 6,9 16 12 23 7 25 12 27 7 15 12,1 44 7 26 12,2 43 7,1 20 12,3 10 7,2 2 visible till bottom 16 7,2 4 visible till bottom 20 7,3 12 visible till bottom
7 7,4 19 visible till bottom 11 7,6 23 visible till bottom
9 7,7 28 visible till bottom 15 7,7 31 visible till bottom 28 7,7 34 visible till bottom 26 8,2 35 visible till bottom 29 8,5 43 visible till bottom 18 9,3
After that the quality of the holes remained better, which was underlined by the Boretrack
measurements. The lowering of the torch was not done again because of lack of time.
The evaluated borehole deviations are shown in Figure 14 to 17. The red lines show the
intended direction of the holes, the green lines are the actual location.
Figure 14: Borehole deviation display from the 8th blast
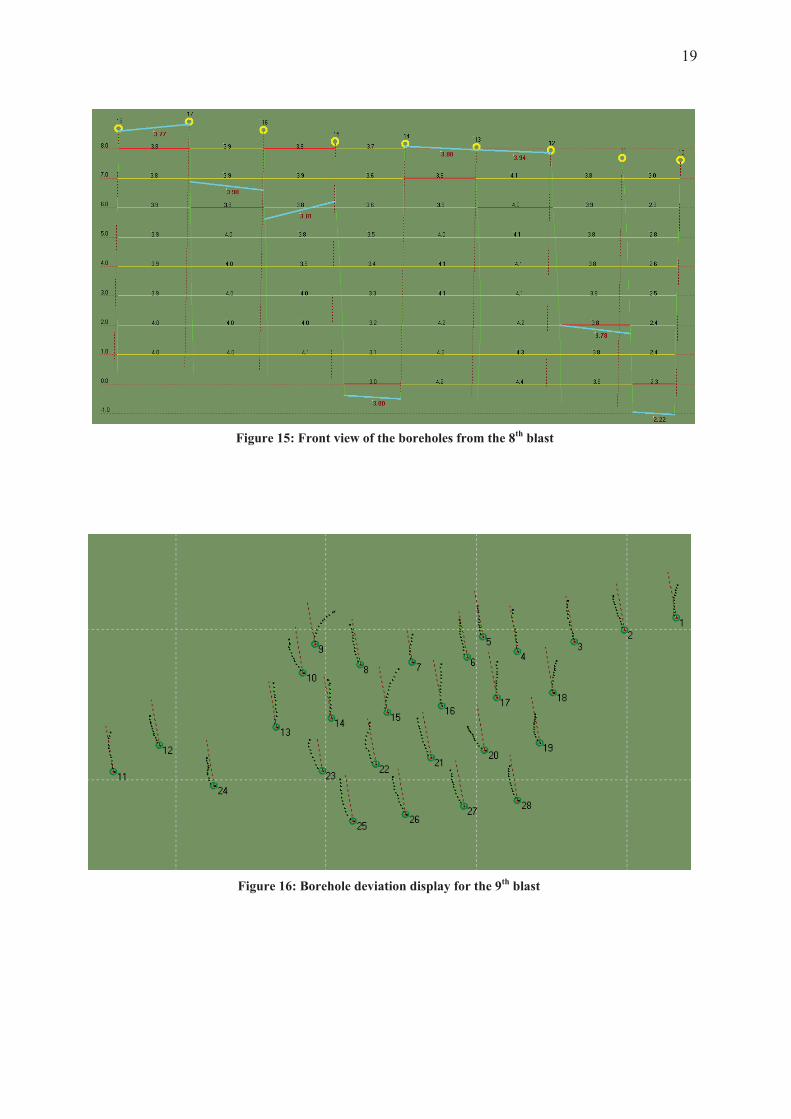
19
Figure 15: Front view of the boreholes from the 8th blast
Figure 16: Borehole deviation display for the 9th blast

20
Figure 17: Borehole deviation display from the 10th blast

21
Figure 18 and 19 also show the differences of borehole quality within one drilled blast,
whereas hole three in Figure 18 is nearly ideal, hole 9 in Figure 19 deviates more than 1 m
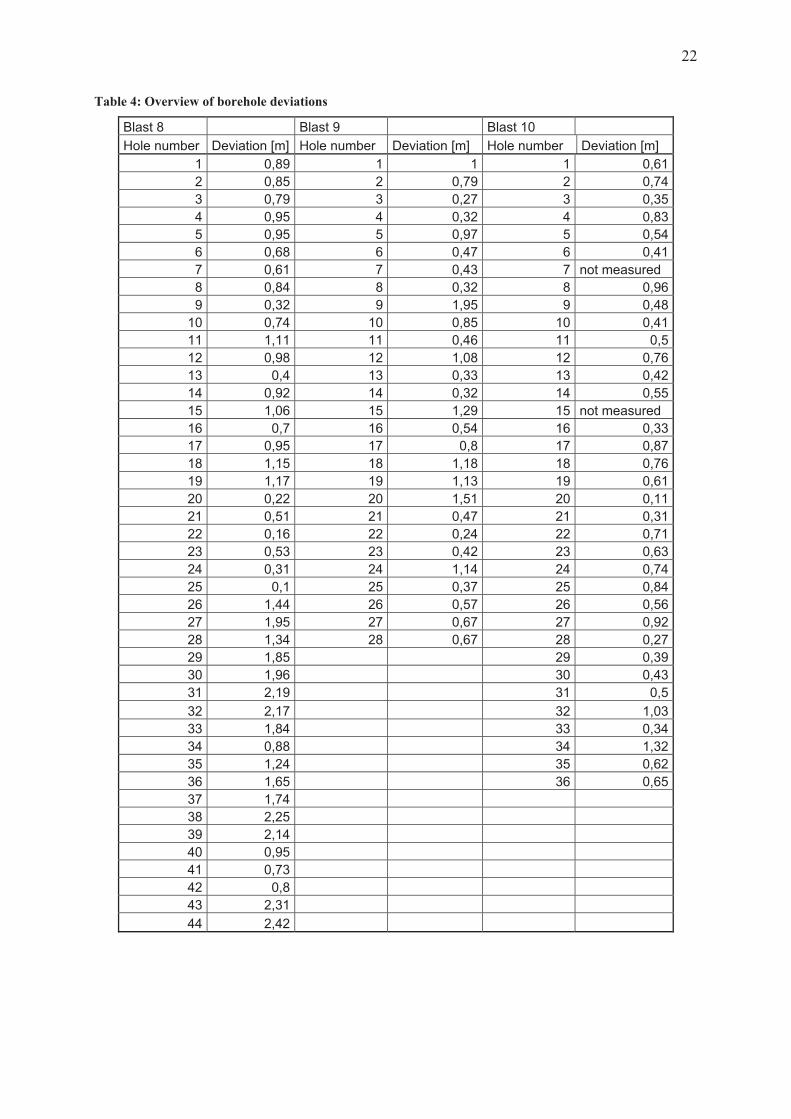
from it’s planned position. Table 4 shows and overview of the measured borehole deviation in
relation to the planed end position.
Figure 18: Detailed display of hole number 3 from the 9th blast
Figure 19: Detailed display of hole number 9 from the 9th blast
22
Table 4: Overview of borehole deviations
Blast 8 Blast 9 Blast 10 Hole number Deviation [m] Hole number Deviation [m] Hole number Deviation [m]
1 0,89 1 1 1 0,612 0,85 2 0,79 2 0,743 0,79 3 0,27 3 0,354 0,95 4 0,32 4 0,835 0,95 5 0,97 5 0,546 0,68 6 0,47 6 0,417 0,61 7 0,43 7 not measured 8 0,84 8 0,32 8 0,969 0,32 9 1,95 9 0,48
10 0,74 10 0,85 10 0,4111 1,11 11 0,46 11 0,512 0,98 12 1,08 12 0,7613 0,4 13 0,33 13 0,4214 0,92 14 0,32 14 0,5515 1,06 15 1,29 15 not measured 16 0,7 16 0,54 16 0,3317 0,95 17 0,8 17 0,8718 1,15 18 1,18 18 0,7619 1,17 19 1,13 19 0,6120 0,22 20 1,51 20 0,1121 0,51 21 0,47 21 0,3122 0,16 22 0,24 22 0,7123 0,53 23 0,42 23 0,6324 0,31 24 1,14 24 0,7425 0,1 25 0,37 25 0,8426 1,44 26 0,57 26 0,5627 1,95 27 0,67 27 0,9228 1,34 28 0,67 28 0,2729 1,85 29 0,3930 1,96 30 0,4331 2,19 31 0,532 2,17 32 1,0333 1,84 33 0,3434 0,88 34 1,3235 1,24 35 0,6236 1,65 36 0,6537 1,74 38 2,25 39 2,14 40 0,95 41 0,73 42 0,8 43 2,31 44 2,42

23
4.4. DOCUMENTATION OF CHARGING
The charging process of the holes was documented completely. Table 5 shows an example of
documentation. All other documentation sheets are in Appendix E. Table 5: Data sheet of the 1st blast
Blast date 30.08.2006 (13:45) Bench: 1060
Charge Stemming No. Det. No. Gelatine Emulsion ANFO Hight Kind Notes
(Cartridges) (Cartridges) (Bag) (m) 1 3 1,5 1,5 3,5 drill cuttings 2 3 1 1,75 3,5 drill cuttings 3 2 3 2 3,5 drill cuttings 4 2 3 1,5 3,5 drill cuttings 5 1 3 2 3,5 drill cuttings 6 1 3 3,25 3,5 drill cuttings 7 7 2 0,5 3,3 drill cuttings 8 6 2 0,5 4 drill cuttings 9 6 1,5 1,25 3,5 drill cuttings
10 5 3 1,75 3,5 drill cuttings 11 5 3 2 3,5 drill cuttings 12 4 3 1,75 3,5 drill cuttings 13 4 3 2 3,5 drill cuttings 14 10 2 1 3 drill cuttings 15 10 1 0,5 3,5 drill cuttings 16 9 3 3 3,5 drill cuttings 17 9 3 2 3,5 drill cuttings 18 8 3 1,5 3,5 drill cuttings 19 8 3 2 3,5 drill cuttings 20 7 3 1,75 3,5 drill cuttings 21 14 2 0,75 3,5 drill cuttings 22 13 3 1,75 3,5 drill cuttings 23 13 2 0,75 3,5 drill cuttings 24 12 3 1,5 3,5 drill cuttings 25 12 3 1,75 3,5 drill cuttings 26 11 3 1,5 3,5 drill cuttings 27 11 3 1,5 3,5 drill cuttings 28 18 2 1,75 3,5 drill cuttings 29 17 2 1,5 3,5 drill cuttings 30 17 2 0,75 3,5 drill cuttings 31 16 1 0,75 3 drill cuttings 32 16 3 1,5 3,5 drill cuttings 33 15 3 1,5 3,5 drill cuttings 34 15 3 1,5 3,5 drill cuttings 35 14 3 1,25 3,5 drill cuttings

24
4.5. VIBRATION MEASUREMENT
Vibrations were measured using the VIBRAS-system of Walesch Elektronik together with up
to four geophones. Measurements were conducted once at the house of Mr. Stoppacher, about
500 m away from the blast and all the other times on the next neighbour’s property, around
200 m away from the blast. The first measurement at Mr. Stoppacher’s house gave no results
at the trigger level of 1 mm/s. All other measurements at Mr. Reithofer’s house were
undertaken at a trigger level of 0.1 mm/s.
Figure 20 shows a map of the mine and the houses of Mr. Stoppacher and Mr. Reithofer.
Reithofer
Stoppacher
Area of 9 blasts
Area of 1 blast
Figure 20: Map of the Rabenwald mine showing the blasting areas and the neighbours Reithofer and Stoppacher, Source [26]

25
Table 6 shows a summary of the measured vibration velocities. Table 6: Measured vibration velocities
Distance [m] Vibration velocities [mm/s] 370 2,54 330 6,07 280 4,7 240 2,22 230 9,41 220 8,94 220 2,35 220 4,23 220 4,31 220 4,11 200 4,69 180 16,05 180 11,56 180 6,47 130 6,07 80 30,58 80 8,03
The vibration velocity and the frequency that where measured right at the next neighbour’s
house are shown in Figure 21.
Figure 21: A DIN 4150 diagram showing the vibration velocity versus frequency
The DIN 4150 diagram is divided into 3 classifications of buildings (line 1 to 3).Values below
line 1 represent industrial buildings, values below line 2 represent residential buildings and
values below line 3 represent buildings that are listed.
The company’s goal is to stay below line 3 whenever possible and this goal is reached for
71 % of the blasts.
05
101520253035404550
0 5 10 15 20 25 30
frequency [Hz]
vibr
atio
n ve
loci
ty [m
m/s
]
1
2
3

26
4.6. NOISE MEASUREMENTS
Noise measurements were conducted with the Norsonic Sound Level Meter. The results are
shown in Figure 22.
The value from the 1st blast was taken at Mr. Stoppacher’s house about 500 m from the blast.
The values from the 5th and 7th blast were taken inside the mine about 150 m away from the
blast with detonating chords hanging out of boulders that were also fired.
0,0
20,0
40,0
60,0
80,0
100,0
120,0
140,0
160,0
blast 1 blast 2 blast 3 blast 4 blast 5 blast 6 blast 7 blast 8 blast 9 blast 10
blast number
nois
e [d
B(A
)]
dB(A)
Figure 22: Results from noise measurements

27
5. ANALYSIS OF DATA MEASURED
5.1. ANALYSIS OF BLAST GEOMETRY
5.1.1. BURDEN AND SPACING
From the measured positions for all boreholes the actual drilled burdens and spacings were
calculated for the borehole staring points. The spacing is the distance from each borehole to
the next hole; the burden is the distance from the borehole to the next drillhole row. This is
shown in Figure 23.
From the documented ten blasts eight were surveyed with the theodolite. Then burdens and
spacings were calculated by summarizing all values and building an average. The calculated
average burdens and spacings are shown in Table 7 and Figure 24.Table 7: Summary of average burdens and spacings
spacing burden blast 3 3,28 3,55 blast 4 3,19 3,35 blast 5 2,73 3,57 blast 6 3,44 3,40 blast 7 3,39 2,55 blast 8 3,60 3,24 blast 9 4,94 3,15 blast 10 3,69 3,04
S
B
Figure 23: Explanation of spacing S and burden B

28
As can be seen the values vary a lot between the different blasts, spacings from 2.7 m to 4.9 m
and burdens from 2.5 m to 3.6 m. Moreover there is no regularity (e.g.: the burden is always
bigger than the spacing) visible in the blast geometry. In order to demonstrate these variations
even better Figure 25 shows the variation between the biggest and the smallest burdens and
spacings for eight surveyed blasts.
0,00
1,00
2,00
3,00
4,00
5,00
6,00
blast 3 blast 4 blast 5 blast 6 blast 7 blast 8 blast 9 blast 10
number of blast
spac
ing/
burd
en [m
]
spacingburden
Figure 24: Average burdens and spacings from the eight surveyed blasts
012345678
burde
n blast
3
spac
ing blast
3
burde
n blast
4
spac
ing blas
t 4
burde
n blast
5
spac
ing blast
5
burde
n blast
6
spac
ing blas
t 6
burde
n blast
7
spac
ing blas
t 7
burde
n blast
8
spac
ing blast
8
burde
n blast
9
spac
ing blas
t 9
burde
n blast
10
spac
ing blast
10
[m]
biggest valuesmallest valueaverage value
Figure 25: Difference between smallest and biggest burdens and spacings for the eight surveyed blasts
29
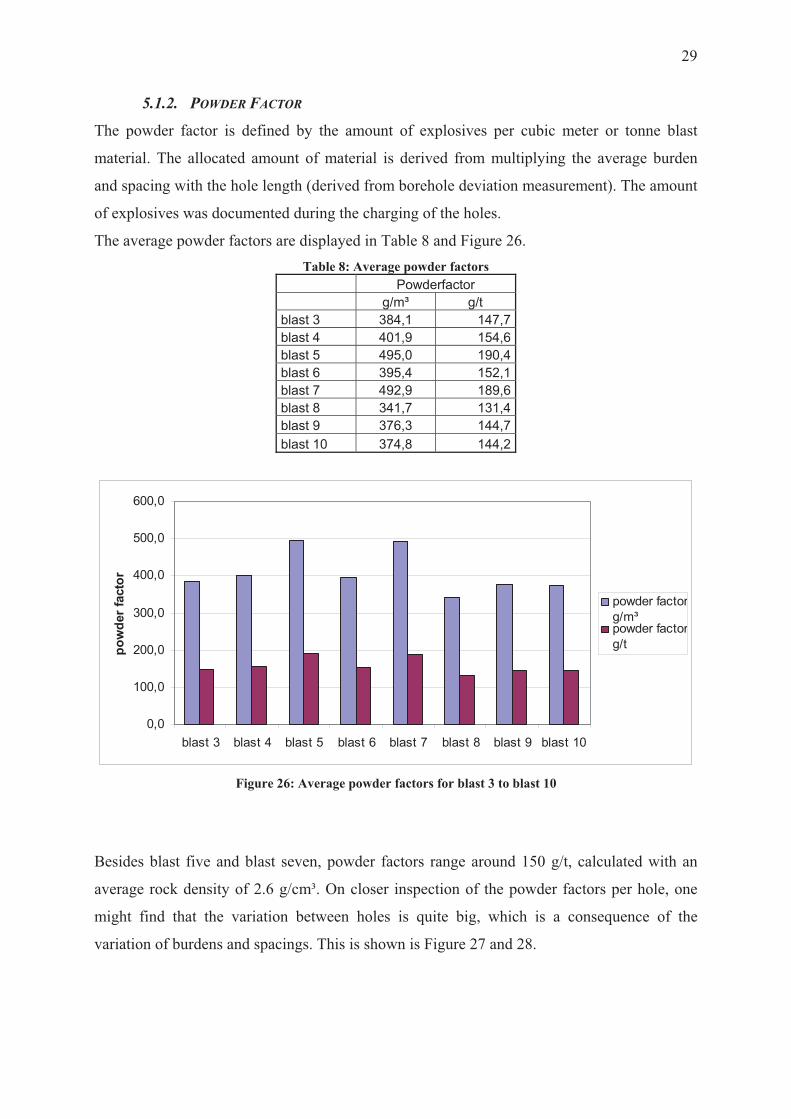
5.1.2. POWDER FACTOR
The powder factor is defined by the amount of explosives per cubic meter or tonne blast
material. The allocated amount of material is derived from multiplying the average burden
and spacing with the hole length (derived from borehole deviation measurement). The amount
of explosives was documented during the charging of the holes.
The average powder factors are displayed in Table 8 and Figure 26. Table 8: Average powder factors
Powderfactor g/m³ g/t blast 3 384,1 147,7blast 4 401,9 154,6blast 5 495,0 190,4blast 6 395,4 152,1blast 7 492,9 189,6blast 8 341,7 131,4blast 9 376,3 144,7blast 10 374,8 144,2
Besides blast five and blast seven, powder factors range around 150 g/t, calculated with an
average rock density of 2.6 g/cm³. On closer inspection of the powder factors per hole, one
might find that the variation between holes is quite big, which is a consequence of the
variation of burdens and spacings. This is shown is Figure 27 and 28.
0,0
100,0
200,0
300,0
400,0
500,0
600,0
blast 3 blast 4 blast 5 blast 6 blast 7 blast 8 blast 9 blast 10
pow
der f
acto
r
powder factorg/m³powder factorg/t
Figure 26: Average powder factors for blast 3 to blast 10

30
5.2. POSITIONING OF THE DRILL RIG
As was stated before the orientation of the drill boom is done with the inclinometers mounted
on the drill rig. The azimuth of the drillholes is visually estimated. Therefore the drill operator
tries if possible to position the drill rig parallel to the wall. This may have the effect that not
all holes have the same direction of dipping. A slight turn of the drillrig for only a few degrees
may therefore result in big deviations of the end position of the hole. This effect is displayed
in Figure 29.
0,0050,00
100,00150,00200,00250,00300,00350,00400,00450,00
1 2 3 4 5 6 7 8 9 10 11 12 13 14 15 16 17 18 19 20 21 22 23 24 25 26 27 28 29 30 31 32 33 34
hole number
pow
der f
acto
r/hol
e [g
/t]
powder factor/hole [g/t]
Figure 28: Changing powder factors per hole for blast 10
0,0
100,0
200,0
300,0
400,0
500,0
600,0
1 3 5 7 9 11 13 15 17 19 21 23 25 27
hole number
[g/t]
powder factor [g/t]
Figure 27: Changing powder factors per hole for blast 9

31
5.3. WALL SURVEYING WITH 3G SYSTEM
The wall surveying with the 3G system shows beside the problems of using the system which
were already discussed in chapter 4.2, that the walls are quite different. A summary of derived
data from the 3G-system is shown in Table 9. Table 9: Summary of derived data from 3G-system
Calculated dipping Dipping Lenght of holes [m]
Blast number
(includes material in front
of the wall)
(without material in front of the
wall)calculated with
3G software
average drilledlength
4 45,92° 70°- 75° 8,90 10 5 23,16° 75° 10,9-11,7 12
7 (1)* 54,36° 60°- 65° 8,7-10 12,2 7 (2)* 41,13° 45° 9,9-10,2 12,2
9 26,46° 30° 10,5-8,6 11,7 10 60,32° 65°- 70° 9,2-10 11,2
*…Wall was surveyed from two sides
The material that lies on the toe of the wall results in very big burdens and therefore a high
confinement of the hole in the bottom. That’s why the calculated dipping is always very flat
and it would be much steeper without the material. Nevertheless even the dipping without the
material is not always the same as the borehole dipping, just because most times the digger
defines the wall angle and not the inclination of the blast holes from the previous blast. In
blast 7 (2) and blast 9 the dipping without the material could not be derived because the
material was lying from the toe up to the edge of the wall.
Another aspect is that the boreholes are drilled too long. This is shown in Figure 30.
Wall
DrillrigDirections of boreholes
Figure 29: Borehole direction resulting from slight turns of drillrig

32
The 3G-software that comes with the 3G-system is also able to calculate volumes and tonnes
that have to be blasted by each borehole. Unfortunately this information can not be used here
because of the irregular blast patterns and material that is lying on the toe of the wall. Until
now one is not able to put blastholes on free chosen positions. Moreover the blastholes can
only be lined up in a row between the two marks that define the limits of the picture and
further more only complete rows (it is not possible to delete individual boreholes) can be
realised. As can be seen from the surveyed boreholes these ideal situations never existed.
5.4. QUALITY OF THE BOREHOLE
Although the values from the first seven deviation measurements can not be used because the
compass of the rod was calibrated wrong, it can be said that the quality of the boreholes was
really bad. This is underlined by the calculated values from the experiment with the torch that
was lowered into the boreholes. In the 6th blast the light of the torch vanished in 72 % of the
holes before the depth of 7 meters and none of them could be seen till the bottom.
It was already stated that this effect suddenly changed after the 6th blast. In the 7th blast
already 23 % of the holes could be seen till the bottom and none vanished before a depth of 7
meters.
Length: 9.2m Drilled length: 12m
Figure 30: Example of a too long drilled borehole from the 10th blast

33
The deviation measurement with the Boretrack system shows that the deviations of the drilled
holes are quite big. A summary of the measured deviations is shown is Table 10.
It should be noted that only 30 % of the holes are less than 0,5 m away from their planned
position. More than 43 % deviate between 0,5 m and 1 m and even 27 % deviate between 1 m
and 2,5 m. Table 10: Summary of measured borehole deviations
Deviation Percentage< 0,5 m 30,20%0,5 - 1 m 43,40%1 - 1,5 m 13,20%1,5 - 2 m 7,50%2 - 2,5 m 5,70%
5.5. ANALYSIS OF VIBRATION MEASUREMENTS
The measured ground vibrations are at a quite acceptable level. Even the predictions for
ground vibrations match very well with the real measured values.
To calculate these predicted ground vibrations the prediction formula of Lüdeling/Hinzen
(1986) for sedimentary rock (which is also used by the company) was used:
vmax = 969 * L0.6 * D-1.5
where vmax = the maximum oscillation vibration (mm/s),
L = maximum explosive charge fired instantaneously (kg) and
D = distance from the blast (m)
The values for “the maximum explosive charge fired instantaneously” were taken from the
borehole charging documentation. The measured and predicted values for all blasts are
displayed in Figure 31.

34
As can be seen the measured and predicted values correlate quite well, the differences can be
explained with irregularities of the rock mass that can not be foreseen.
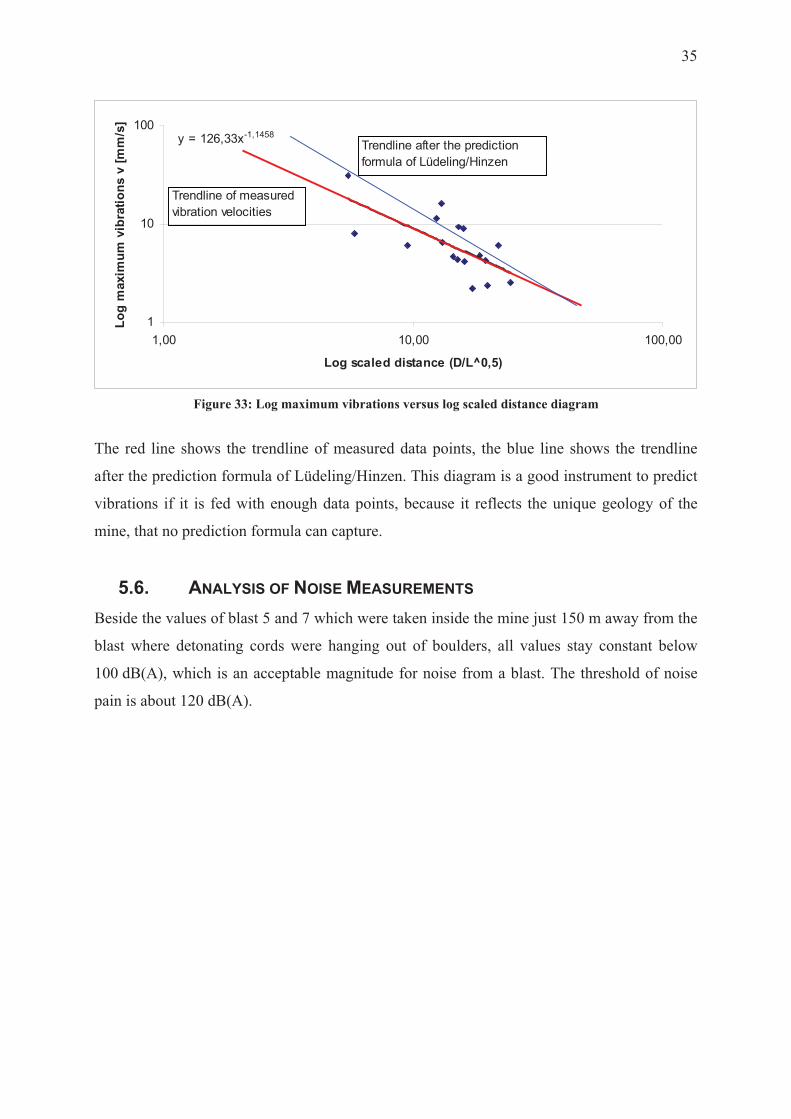
To be able to predict the vibrations better a “log maximum velocities/log scaled distance”
diagram was prepared (Figure 33).
0
5
10
15
20
25
30
35
40
370
330
280
240
230
220
220
220
220
220
200
180
180
180
130 80 80
distance [m]
vibr
atio
n ve
loci
ty [m
m/s
]
vibrationvelocities [mm/s]
predictedvibrationvelocities [mm/s]
Figure 31: Measured and predicted vibration velocities
R2 = 0,4812
R2 = 1 total correlation
0
5
10
15
20
25
30
35
0 10 20 30 40
Predicted vibration velocities [mm/s]
Mea
sure
d vi
brat
ion
velo
citie
s [m
m/s
]
Figure 32: Correlation of predicted and measured vibration velocities
35
The red line shows the trendline of measured data points, the blue line shows the trendline
after the prediction formula of Lüdeling/Hinzen. This diagram is a good instrument to predict
vibrations if it is fed with enough data points, because it reflects the unique geology of the
mine, that no prediction formula can capture.
5.6. ANALYSIS OF NOISE MEASUREMENTS
Beside the values of blast 5 and 7 which were taken inside the mine just 150 m away from the
blast where detonating cords were hanging out of boulders, all values stay constant below
100 dB(A), which is an acceptable magnitude for noise from a blast. The threshold of noise
pain is about 120 dB(A).
y = 126,33x-1,1458
1
10
100
1,00 10,00 100,00
Log scaled distance (D/L^0,5)
Log
max
imum
vib
ratio
ns v
[mm
/s]
Trendline after the prediction formula of Lüdeling/Hinzen
Trendline of measured vibration velocities
Figure 33: Log maximum vibrations versus log scaled distance diagram
36
6. DEVIATIONS BETWEEN PLANNED AND MONITORED DATAThis part of the thesis shows a comparison between documented data by the company and
actually monitored data. The documented data from the company was taken from the drill
operator’s records and the shot-firer’s records as well as from the vibration velocities event
report.
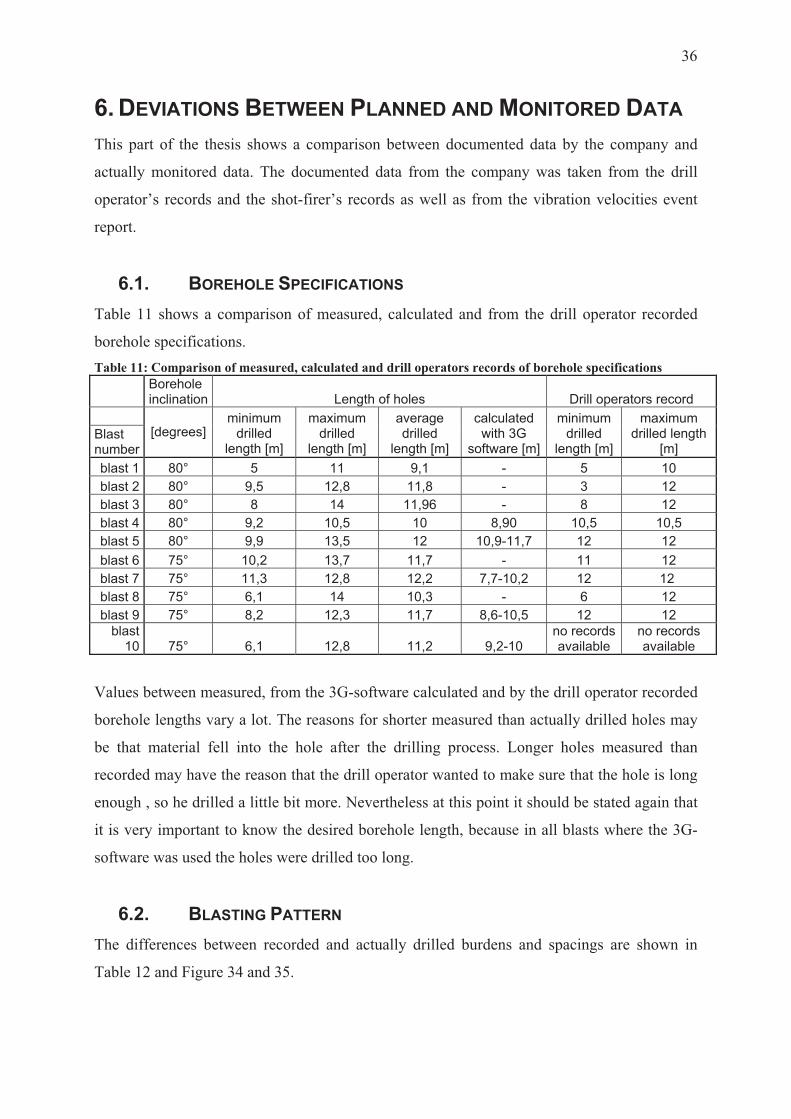
6.1. BOREHOLE SPECIFICATIONS
Table 11 shows a comparison of measured, calculated and from the drill operator recorded
borehole specifications. Table 11: Comparison of measured, calculated and drill operators records of borehole specifications
Boreholeinclination Length of holes Drill operators record
Blast number
[degrees] minimum
drilledlength [m]
maximumdrilled
length [m]
average drilled
length [m]
calculated with 3G
software [m]
minimumdrilled
length [m]
maximumdrilled length
[m]blast 1 80° 5 11 9,1 - 5 10 blast 2 80° 9,5 12,8 11,8 - 3 12 blast 3 80° 8 14 11,96 - 8 12 blast 4 80° 9,2 10,5 10 8,90 10,5 10,5 blast 5 80° 9,9 13,5 12 10,9-11,7 12 12 blast 6 75° 10,2 13,7 11,7 - 11 12 blast 7 75° 11,3 12,8 12,2 7,7-10,2 12 12 blast 8 75° 6,1 14 10,3 - 6 12 blast 9 75° 8,2 12,3 11,7 8,6-10,5 12 12
blast10 75° 6,1 12,8 11,2 9,2-10
no records available
no records available
Values between measured, from the 3G-software calculated and by the drill operator recorded
borehole lengths vary a lot. The reasons for shorter measured than actually drilled holes may
be that material fell into the hole after the drilling process. Longer holes measured than
recorded may have the reason that the drill operator wanted to make sure that the hole is long
enough , so he drilled a little bit more. Nevertheless at this point it should be stated again that
it is very important to know the desired borehole length, because in all blasts where the 3G-
software was used the holes were drilled too long.
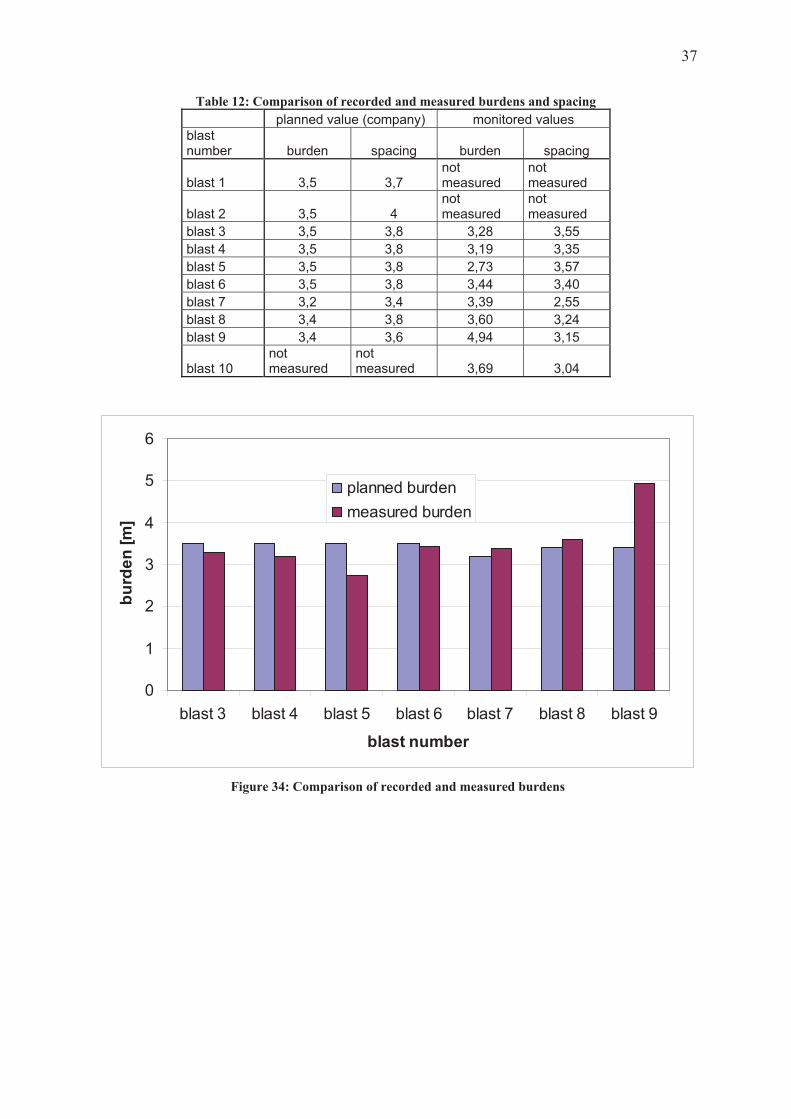
6.2. BLASTING PATTERN
The differences between recorded and actually drilled burdens and spacings are shown in
Table 12 and Figure 34 and 35.
37
Table 12: Comparison of recorded and measured burdens and spacing planned value (company) monitored values blastnumber burden spacing burden spacing
blast 1 3,5 3,7 notmeasured
notmeasured
blast 2 3,5 4 notmeasured
notmeasured
blast 3 3,5 3,8 3,28 3,55 blast 4 3,5 3,8 3,19 3,35 blast 5 3,5 3,8 2,73 3,57 blast 6 3,5 3,8 3,44 3,40 blast 7 3,2 3,4 3,39 2,55 blast 8 3,4 3,8 3,60 3,24 blast 9 3,4 3,6 4,94 3,15
blast 10 notmeasured
notmeasured 3,69 3,04
0
1
2
3
4
5
6
blast 3 blast 4 blast 5 blast 6 blast 7 blast 8 blast 9
blast number
bur
den
[m]
planned burdenmeasured burden
Figure 34: Comparison of recorded and measured burdens

38
Beside the burdens in blast 7, 8 and 9 the recorded values are higher than the actually drilled
values. This effect can also be seen in the blasted area that belongs to each borehole, which is
calculated by multiplying the burden and the spacing for every blast (Table 13 and Figure 36).
Table 13: Comparison of recorded and monitored average blasted area per hole planned value (company) monitored values blastnumber burden spacing burden spacing
blast 1 3,5 3,7 notmeasured
notmeasured
blast 2 3,5 4 notmeasured
notmeasured
blast 3 3,5 3,8 3,28 3,55 blast 4 3,5 3,8 3,19 3,35 blast 5 3,5 3,8 2,73 3,57 blast 6 3,5 3,8 3,44 3,40 blast 7 3,2 3,4 3,39 2,55 blast 8 3,4 3,8 3,60 3,24 blast 9 3,4 3,6 4,94 3,15 blast 10 not measured not measured 3,69 3,04
0
1
2
3
4
5
6
blast 3 blast 4 blast 5 blast 6 blast 7 blast 8 blast 9
blast number
spac
ing
[m]
recorded spacingmeasured spacing
Figure 35: Comparison of recorded and measured spacings

39
Only in blast 9 the monitored value is actually bigger than the recorded value. In all other
blasts the difference between the recorded and actually monitored area lies between 1,3 m²
(blast 8) and 3,6 m² (blast 5) per hole.
These values can be explained by many factors:
o Because of irregularities of the wall, additional holes have to be drilled in front of the
first row, to make sure the material gets blasted, which reduces burden for this special
area;
o If suddenly the driller reaches a talc-zone, these holes don’t get charged in order to
avoid mixing talc and waste material, which of course increases the spacing for the
neighbouring holes;
o In five of the ten documented blasts, the holes were drilled parallel to the wall,
whereas the shot-firer turned the direction of blast with the delay time of the
detonators by 45°, which of course changes the actual effective burdens and spacings.
Figure 37 and 38 show this effect for better understanding.
0,02,04,06,08,0
10,012,014,016,018,0
blast 3 blast 4 blast 5 blast 6 blast 7 blast 8 blast 9
blast number
aver
age
blas
ted
area
/hol
e [m
²] recorded valuemonitored value
Figure 36: Comparison of recorded and monitored average blasted area per hole

40
An effect that results from this change of ignition sequence is that the powder factor and the
energy per borehole sometimes differs significantly, as the side spacings get very big and the
burdens very small (Figure 39 & 40).
Figure 37: Intended direction where muck should be thrown
5
58
7
7
6
6
4
4 910
9
8
17
10
11
11
12
12
13
13
14
14
15
15
16 17
16
Figure 38: Direction where the muck was actually thrown by changing the ignition sequence (delay numbers shown)

41
Nevertheless the change of ignition sequence had probably no effect on the blast result,
because the explosive anyway was not distributed more regularly on the holes before the
change of ignition sequence. If the blasting pattern was drilled more precise, this change
could have influenced the blast strongly, even in disadvantageous way, by producing a lot of
fines on one hand and a lot of boulders on the other hand.
0,0100,0200,0300,0400,0500,0600,0700,0800,0900,0
1000,0
1 3 5 7 9 11 13 15 17 19 21 23 25 27
hole number
[g/t]
after change of ignitionsequencebefore change if ignitionsequence
Figure 39: Different powder factors before and after the change of ignition sequence for blast 9
0,0
50,0
100,0
150,0
200,0
250,0
1 3 5 7 9 11 13 15 17 19 21 23 25 27
hole number
ener
gy/b
oreh
ole
[kJ/
m³] after change of
ignition sequence
before change ofignition sequence
Figure 40: Different energy/borehole before and after the change of ignition sequence for blast 9

42
6.3. POWDER FACTOR
The analysis of the shot-firer records concerning the powder factor showed that he calculated
the powder factor with an average rock density of 2,5 g/cm³. Therefore in the following
Table 14 and Figure 41 the planned powder factor [g/t] is also calculated with 2,6 g/t like in
all other calculations of the thesis. Table 14: Comparison from the shot-firer's and the monitored powder factor
planned value monitored value blast number [g/t] [g/t] blast 3 not calculated 147,7 blast 4 127,9 154,6 blast 5 138,5 190,4 blast 6 not calculated 152,1 blast 7 147,1 189,6 blast 8 130,8 131,4 blast 9 not calculated 144,7 blast 10 not calculated 144,2
For blast 3, blast 6, blast 9 and blast 10 no records are available.
Only 2 values of the monitored powder factors are quite high, ranging around 190 g/t, all
others are around 150 g/t which is the desired value from the company. The shot-firer’s record
show a lower powder factor, probably because he calculated with the documented burdens
and spacings from the drill operator, which, as was already seen, do not always correspond
with reality.
020406080
100120140160180200
blast 3 blast 4 blast 5 blast 6 blast 7 blast 8 blast 9 blast 10
blast number
pow
der f
acto
r [g/
t]
recorded valuesmonitored values
Figure 41: Comparison of recorded and planned powder factors

43
6.4. MASS OF EXPLOSIVES
It was also tried to compare the recorded column design as the shot-firer sketched it on his
drawing of the blast to the actual monitored one. This was done for blast 8 and 9. In blast 8
the shot-firer’s record says the holes were charged with 4 cartridges of gelatine explosives,
3,7 stemming and the rest anfo. The amount of explosive that would fit into such a hole is
compared to the actual charging in Figure 42.
The same was done for blast 9, where the shot-firer’s record says the holes were charged with
4 cartridges emulsion explosives, 3,6 m stemming and the rest with anfo. In Figure 43 the
0,0
1,0
2,0
3,0
4,0
5,0
6,0
7,0
8,0
1 3 5 7 9 11 13 15 17 19 21 23 25 27 29 31 33 35 37 39
hole number
expl
osiv
es [k
g/m
]
kg explosives chargedkg explosives recorded
Figure 42: Comparison of mass explosive recorded and charged for blast 8
0,0
2,0
4,0
6,0
8,0
10,0
12,0
14,0
1 3 5 7 9 11 13 15 17 19 21 23 25 27
hole number
expl
osiv
es [k
g/m
] kg explosives chargedkg explosives recorded
Figure 43: Comparison of mass explosive recorded and charged for blast 9

44
amount of explosive that would fit in such a hole is again compared to the actual charging. To
be able to compare this two situations better special holes in blast 9 that were very short, were
taken out.
Most times the mass of explosives charged is higher than the mass of explosives recorded by
the shot-firer. One reason for that is that the amount of explosive per hole is regulated from
the shot-firer’s experience. The sketch of the charge the shot-firer is drawing is only a very
imprecise one, that’s why his values of mass of explosives per meter do not vary that much.
His sketch just shows the charge of one hole to represent between 30 and 40 holes.
6.5. VIBRATIONS
Table 15 and Figure 44 show a comparison of the company’s precalculated vibration values,
my own precalculated values and the actual measured ones.
Table 15: Comparison of vibration values precalculated
values (company) precalculated
valuesmeasured
valuesblast number [mm/s] [mm/s] [mm/s] blast 1 4,35* 1,73* <1* blast 2 4,10 6,09 2,22 blast 3 4,90 6,93 8,94 blast 4 2,30 5,32 2,35 blast 5 3,74 5,44 4,23 blast 6 4,25 7,37 4,41 blast 7 7,00 7,24 2,1 blast 8 6,35 3,52 2,54 blast 9 3,77 6,86 4,11 blast 10 not available 6,36 - * values for different measuring locations, therefore no comparison possible ** values from company's measuring device

45
Except blast 8 the company’s precalculated vibration values are always lower than my values.
This is because the company precalculates the vibration values with an average amount of
explosives per delay time, whereas I precalculated the values for the maximum instantaneous
charge per delay, because I knew from my documentation exactly the amount of explosive for
every hole, whereas the shot-firer just divides the total amount of explosive by the number of
holes blasted that got the same delay.
Nevertheless all my precalculated values except one are higher than the actual measured ones,
which is an advantage, because it always creates a safety pillow.
0,001,00
2,003,00
4,005,00
6,007,00
8,009,00
10,00
blast 2 blast 3 blast 4 blast 5 blast 6 blast 7 blast 8 blast 9
blast number
vib
ratio
n ve
loci
ties
[mm
/s]
predictedvalues companypredictedvaluesmeasuredvalues
Figure 44: Comparison of vibration values

46
7. THE STATE OF THE ART IN DRILLING AND BLASTING
7.1. PLANNING A BLAST
The modern way to design a blast is a computerized blast design. But it should not be
forgotten, that for the state of the art of planning a blast much more than a computer-software
is needed to do the work properly. Quite a number of aspects like geology, burden and
spacing, used explosive, initiation-system, initiation sequence and many more have to be
taken care of. Therefore it is advisable to build up an own management system for the process
“drilling and blasting”. Here all experiences and collected data can be stored and new findings
can be added. Especially in the drilling and blasting design, which is normally done by young
engineers, who’s area of responsibility change often and who might do the job for just a few
years, a lot of information is lost through the job fluctuation.
7.1.1. REVIEW ON THE PLANNING PROCESS OF THE BLAST
A blast design should be done by a person with sufficient engineering knowledge about
blasting. Surely the driller who by now decides where each blast hole is drilled, has collected
a lot of knowledge through his working years, but won’t have the same overview as a well
trained engineer. No two blasts are the same, so accordingly no two blasts can be drilled in the
same way.
It should be also said that someone who designs the blast with a database in his background
has access to much more helpful information that can influence the design and where to place
the holes. After the planning process the engineer can review the design, maybe get a second
opinion on his first plan and then redo the whole process again. The driller who drills his hole
will probably not think about the position of the hole again after it is drilled, but will proceed
to drill the next hole.
7.2. SURVEYING OF THE WALL
Nowadays two systems of surveying the wall are available. The first one is the laser scanner,
who creates a very detailed picture of the wall, but has some disadvantages. The investment
costs are very high, the scanning of the wall is very time consuming and it creates an
enormous amount of data that has to be stored somewhere.
Secondly there is the photogrammetry, like the system from the 3G-company. It is very
flexible, fast to use and sufficiently accurate and has the big advantage, compared to the laser
scanner, that it shows colours, which is a really helpful instrument for interpreting possible
risky parts in the wall.

47
7.2.1. REVIEW ON THE ACTUAL PROCESS OF SURVEYING THE WALL
The already available 3G-system was still in the introduction phase of the operating procedure
at the quarry when the data gathering was conducted and therefore not used as much as
possible. A more intensive use would have shown that
o Firstly: at some walls where the toe of the wall was not cleared off, the burden of the
lower parts of the hole show an enormous burden of more than eight meters (Figure
12) and
o Secondly: In many cases the drilled length is much higher than actually necessary. An
example for this excessive length drilling is shown in Figure 29 where the drilled
length is 12 m whereas only 9.2 m are necessary.
The following two calculations in Table 16 show the possible drill length savings for one
month:Table 16: Two examples for a possible drill length saving Case 1: holes are on average 2 m too long number of holes holes are on average 10 m long Blast 1 35 Blast 2 45 Blast 3 31 Blast 4 45 Blast 5 37 Blast 6 44 Blast 7 47 Blast 8 64 Blast 9 28 Blast 10 44
possible drill meter savings for one month
Sum 420 840 => one could have drilled another 84 holes more Case 2: holes are on average 1.5 m too long
possible drill meter savings for one month
630 => one could have drilled another 63 holes more
Table 16 shows that in case 1 another 84 hole could have been drilled, which is about the
amount of holes for another two blasts. This means a saving of about 20 % in drilling lengths
and costs.

48
7.3. DRILLING
From a technical point of view there are 2 systems available: Tophammer drilling machines
and Down the Hole Hammer drilling machines. Which one to use is most times a matter of
the length of the drill hole, which is shown in Figure 45.
As can be seen tophammer machines are mostly used up to drilling lengths of 15 to 20 meters.
For longer holes it is advisable to use Down the Hole (DTH) hammer machines, because of
their higher penetration rate. Another aspect distinguishes the two systems. Because of the
physical size of the DTH Hammer, hole diameters start here at about 90 mm and go up to
200 mm, whereas Tophammers start at 35 mm and end at 127 mm.
7.3.1. SMART RIG SYSTEM
The newest achievement in automation of surface crawlers is the SmartRig System, developed
by Atlas Copco (Figure 47). It is characterised by the following new specifications:
� SmartRig control system
� The AutoRAS (automatic rod adding systems)
� ROC Manager and MWD (Measure While Drilling)
� GPS Navigation
� Silenced Version for urban areas
0 5 10 15 20
Depth [m]
Pene
tratio
n ra
te
DTH HammerTophammer
Figure 45: Difference between DTH-hammer and tophammer in relation to the penetration rate

49
The SmartRig control system uses electrical signals to control the hydraulic valves. This
reduces the number of hydraulic components by 30 % compared to normal Hydraulic Control
Systems (HCS) and the noise level for the operator. All control gauges are replaced by a
display unit which results in more space in the cab and increases visibility for the operator.
This Control System includes an anti jamming function which reduces wear of material and
prolongs service intervals. Further more it comes with a laser plane as a reference height to
make sure all hole are drilled to the same depth and an automatic feed positioning to set up
the boom to predefines angles with just one button.
The AutoRAS drills all holes to predefined depths and allows the operator to take care of
other duties as maintenance checks during the drilling process.
The ROC Manager is a PC software to plan drill patterns which then can be transferred to the
drillrig using a data card.
The Measure While Drilling System automatically logs parameters, like hole depth,
penetration rate, feed, percussion and rotary pressure. Together with the ROC manager these
data can be used for analysis of rock properties and can be even displayed graphically in
slices through the bench.
Using the GPS navigation there is no need to mark the holes manually anymore. The operator
just drives the drillrig to predefined coordinates, which come from the planed blast pattern of
the ROC manager. Together with the hole navigation system the GPS makes it possible to
drill all holes to the same direction compared to conventional systems where the drillrig is
positioned with a landmark in the distance (see Figure 46).
Wall
Directions of boreholes using conventional positioning
Directions of boreholes using Hole Navigation System
Drillrig
Figure 46: Comparison of conventional positioning and HNS

50
There is also a silenced version especially for urban areas available. Therefore the boom is
enclosed with a frame of lightweight aluminium, which reduces noise levels of the drillrig by
10 dB(A).
In the future the system will be even able to drill without an operator and drive from hole to
hole automatically.
7.3.2. REVIEW ON THE ACTUAL DRILLING
Referring to the actual bench height of ten meters it should be possible to drill much more
accurate with the available surface crawler. Hole deviations therefore should not be bigger
than 20 cm. A possibility is to install a guiding rod as the first rod to minimise deviations.
Figure 47: Atlas Copco Roc F9 SmartRig Surface Crawler, Source [7]

51
7.4. MEASURING BOREHOLE DEVIATIONS
The only reliable way to make a statement about the quality of the drilled boreholes is a
deviation measurement with a system like the Boretrack-System.
There is always a safety risk present if you don’t know where exactly your boreholes are
drilled. Especially if the geology you have do drill your hole in is as irregular and the rock as
jointed as it is in this mine. The possibility of a hole that is drilled with insufficient burden is
therefore always a flyrock hazard.
7.5. DETONATORS
Nowadays the trend goes definitely into the direction of electronic detonators, like the ikon-
system of Orica for example (Figure 48).
Each detonator contains a
programmable computer chip.
After attaching the detonator to a
wire, the logger that is also
connected to the wire, recognises
the detonator, tests its functionality
and assigns it with a delay time.
Up to this time there is no way that
the detonator can initiate, because
the logger doesn’t have enough
energy to do so. To initiate the
detonators the blaster is needed,
which is connected to the logger
and who needs a separate key.
7.5.1. REVIEW ON THE ELECTRIC DETONATORS
The now used electric detonators are not comparable to electronic detonators referring to their
accuracy of delays and number of possible different delays. Especially if you have to take
special care of vibrations because of neighbouring houses you should not use one delay time
for two different holes if at the same time you don’t want to reduce the number of holes per
blast.
Figure 48: The ikon-system of Orica, showing the electronic detonator, the blaster, the logger and the planning software, Source [10]
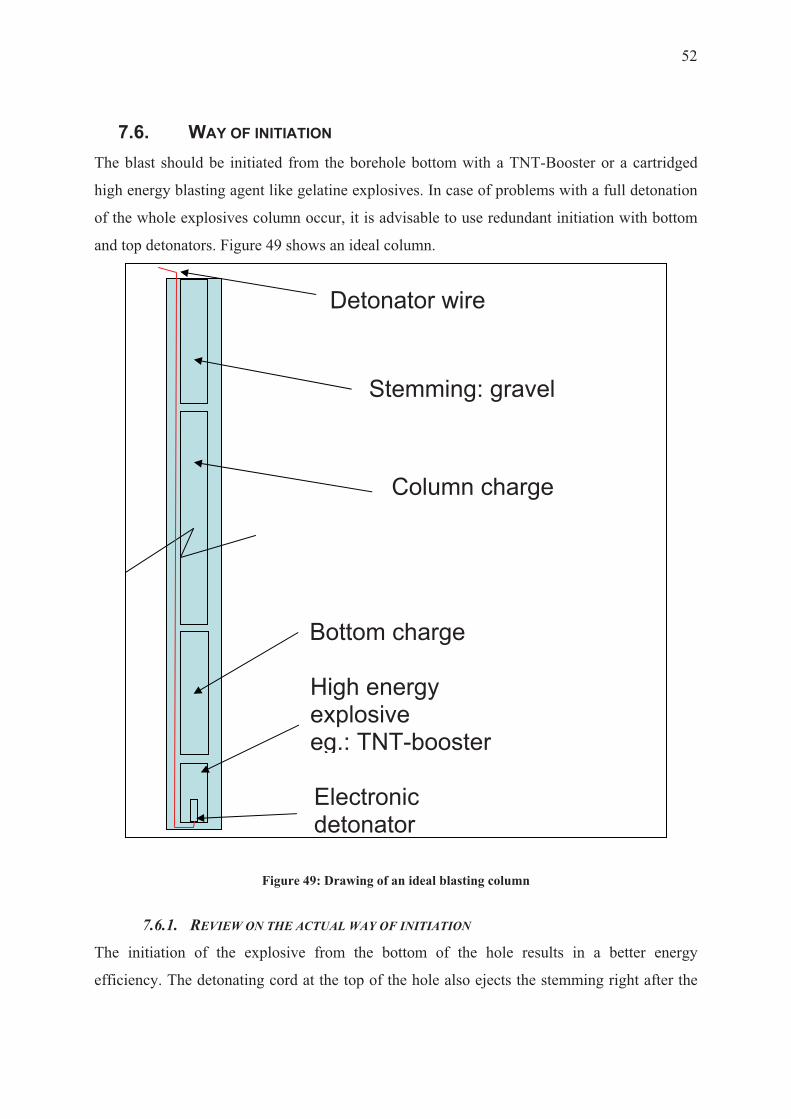
52
7.6. WAY OF INITIATION
The blast should be initiated from the borehole bottom with a TNT-Booster or a cartridged
high energy blasting agent like gelatine explosives. In case of problems with a full detonation
of the whole explosives column occur, it is advisable to use redundant initiation with bottom
and top detonators. Figure 49 shows an ideal column.
Figure 49: Drawing of an ideal blasting column
7.6.1. REVIEW ON THE ACTUAL WAY OF INITIATION
The initiation of the explosive from the bottom of the hole results in a better energy
efficiency. The detonating cord at the top of the hole also ejects the stemming right after the
Bottom charge
High energy explosiveeg.: TNT-booster
Column charge
Stemming: gravel
Electronicdetonator
Detonator wire

53
initiation and cannot do what it is assigned for, namely to act like a closure for the hole and
keep the gas pressure inside the borehole as long as possible.
7.7. BLASTING AGENT/COLUMN DESIGN
Concerning the kind of blasting agent there are some possibilities:
� Anfo explosives
� Slurry explosives
� Emulsion explosives or
� Heavy-Anfo explosives
From the described options Heavy Anfo is the newest one, although it can not be said, that
this is best one. The explosive should be chosen in a way to best fit the rock. This can only be
done by experimental trying.
7.7.1. REVIEW ON THE COLUMN DESIGN
There is no clear rule how the column should be loaded and it does not only depend on the
rock but also very much on the person that charges the holes. Sometimes the difference
between loaded holes is more than one bag (25 kg) of Anfo although the holes got the same
length and are just more widened from the drilling process, which results that more space is
available for explosives.
7.8. LOADING THE HOLES
State of the art in loading the holes is using an adequate tool, depending on the kind of
explosive. If you are using bulk emulsion explosives a pump truck is recommended.
Explosives manufactures offer such systems also for anfo. It is also possible to use a trailer
which could be pulled by the trucks available on site. Such a system is shown is Figure 50. It
is equipped with a 3000 liters tank for anfo and two 100 liters tanks for fuel oil. It is able to
mix and charge between 25 – 100 kg of explosives per minute. The charging unit also comes
with its own power supply, which makes it even independent from the truck.
.

54
7.8.1. REVIEW ON LOADING THE HOLES
With regard to a healthy and in the length of time not harmful working condition, it should be
said, that carrying 25 kg bags of anfo is not advised. This is also consistent with Luzenac’s
occupational health act which says:” Employee health is a top priority for Luzenac and it uses
best available health and safety practices appropriate to its operations. …”, Source [9]
7.9. DOCUMENTATION OF THE BLAST
State of the art in documentation of the blast is much more than the
“Sprengarbeitenverordnung” regulates. It should be the goal not only to have to document the
blast but to be able to benefit from the documentation. Therefore it is meaningful to film or
make pictures of the blast.
Without sufficient documentation a lot of information on already fired shots is lost, which
would help in the planning process of further blasts.
7.10. DOCUMENTATION OF THE BLASTING RESULT
State of the art in documenting the blasting result would be to do this by making written notes
and photos. An example for such a written documentation is shown in Table 17.
Figure 50: Example of an anfo trailer from DynoNobel, Source [8]

55
Table 17: Possible documentation sheet for the blasting result
Documentation of the Blasting Success Number of holes: Date of blast: Time: First impression [from 1 (good) to 5 (bad)] Muck shape [sketch] Muck throw [from 1 (far) to 5 (close)] Fragmentation of muck [from 1 (even) to 5 (uneven)] Number of boulders Any backbreak Extent of backbreak [m] Any visible missfires More notes
If you want to measure the blasting result the best thing to do is to measure the muckpile
shape and the achieved fragmentation. This can be done by surveying the muck pile which is
very time intensive. Another way to measure the fragmentation is to scan each truck with
muck using a camera and post-process the pictures with an appropriate software.
7.10.1. REVIEW ON DOCUMENTATION OF THE BLASTING RESULT
Unfortunately a lot of knowledge is lost by not documenting a fired blast. Written information
can be very helpful in planning future blasts and also assists different shot-firers to get
information from blasts they didn’t fire.

56
7.11. GROUND VIBRATIONS AND NOISE MEASUREMENTS
The state of the art and the regulatory requirements in Austria are to measure ground
vibrations. Noise levels should be monitored regularly.
Regular information for the neighbours about the blasting work meets the standards in today’s
blasting practice. This can be done by:
� Organising regular information meetings with neighbours,
� Sending them information by mail or
� Setting up an information hotline.
7.11.1. REVIEW ON THE ACTUAL STATE IN GROUND VIBRATIONS AND NOISE
MEASUREMENTS
The measuring of the ground vibrations is done quite well. Noise levels should be measured
from time to time and especially when delicate blasts are fired. To make sure the noise levels
keep low, detonating cords should always be cut away and not hang out of holes or boulders
and covered with sufficient material. Moreover the initiation of the column from the borehole
bottom reduces noise levels because the produced energy that also produces the noise is kept
as long as possible in the borehole.
Moreover the company should try to make further use of the ground vibration data, instead of
just measuring them and filing them away.
The contact to neighbours could be intensified.

57
8. GAP ANALYSISThis part of the thesis should describe what has to be done to come from today’s practice in
drilling and blasting to the ideal situation that was presented in chapter 7.
8.1. LAYOUT OF THE BLASTING WORK
In order to reach the status of the state of the art it is necessary to build up a management
system for the complete planning process and the acquisition of all the relevant information.
These comprise:
� Surveying of the wall and the drilled boreholes
� Planning and designing of a blast with an appropriate software
� Measuring of the borehole deviation
� Documentation of already blasted sites
� Adequate communication with neighbours
� Noise and Vibration monitoring
8.2. SURVEYING THE WALL
There is no further investment necessary. It is only advised to use the photogrammetric
system more often in order to reduce holes that are drilled too long and know about the actual
burdens.
8.3. DRILLING
As the SmartRig-System is one of the big technological developments, the actual drilling
machine should be traded in to get a Roc F9 C.
8.4. QUALITY OF THE BOREHOLES
It is advised to measure the hole deviation regularly. This can be done by either purchasing a
system similar to the Boretrack-System. Maybe it is then even possible to buy such a system
in connection with a drill rig, where no extra time is consumed for the measuring, but
measuring is conducted by lifting up the drill rod, after drilling. Or it is also thinkable to
conclude a contract for example with the University of Leoben, who already possess such a
system, to measure hole deviations regularly.

58
8.5. DETONATORS/WAY OF INITIATION
To have the latest technology in initiation a changeover to electronic detonators should be
done. This should be accompanied by a complete redesign of the blast (burden, spacing, etc.)
with an initiation of the blasting agent from the bottom of the hole with a redundant detonator
if necessary.
8.6. BLASTING AGENT/COLUMN DESIGN
A test procedure should be started to find the explosive that fits the rock best respectively
results in the desired fragmentation with fewest costs.
It should be stated that such a new choice in blasting agents should only be done if it goes
hand in hand with a complete redesign of the blast, otherwise the positive effects won’t come
out that clearly.
8.7. LOADING THE HOLES
The purchase of an adequate charging tool is recommended. If a purchase is not wanted it is
also possible to make a service contract with one of the available explosives provider.
8.8. DOCUMENTATION OF THE BLAST
It would be necessary to buy a film camera or use the existing photo camera for a good
documentation of the blast. Further on this information should be technical processed and
stored to be able to go back and access data whenever needed.
8.9. DOCUMENTATION OF THE BLASTING RESULT
It should be started to document the blasting result with written forms (see example in chapter
7.10), making photos of the muck, any back breaks and other useful and visible information
one could benefit of later and store these data in well processed form which makes it easy to
access and use these data in the future.
8.10. GROUND VIBRATIONS AND NOISE
Ground vibrations should be measured further on. Also noise levels should be measured from
time to time which would be possible with the existing ground vibration measurement device.
Further on ground vibration data should be processed more detailed to evaluate a prediction
tool.

59
To intensify the contact to the neighbours it would be possible to send an email to all
neighbours that are interested about the actual blasting time simultaneously to the contact to
Mr. Reithofer, the neighbour whose house is within the safety radius of nearly all blasts.

60
9. ECONOMIC AND SAFETY BENEFITS
9.1. SURVEYING OF THE WALL
The economic benefits are clear: a more regular use can reduce drill lengths and drill costs up
to 20 % (see calculation in chapter 7.2.1)
The real good visualisation in colour of the actual burden for nearly every point of the wall is
an important safety aspect that can show possible flyrock areas early and make quick reacting
easy.
9.2. DRILLING
The advantages of the new drilling technology SmartRig are:
� There is no need to manually mark the drilling starting points, because of the GPS
navigation.
� Therefore the set-up time is much higher, which increases the rig utilisation and saves
time and money.
� An automatic feed alignment also reduces set-up time and eliminates operator errors,
because of predefined drillings angles.
� The automatic rod adding system makes it possible that the operator can carry out
maintenance checks or other duties while drilling, because there is no need for him to
stay in his cabin for the drilling process.
� The Rig Control System (RCS) adjusts power, feed and penetration rate to the
properties of the rock, which results in less bit wear and reduced fuel consumption up
to 30 %.
� The Measure While Drilling System logs important data for a rock property analysis,
which makes an adjustment of explosives to the rock more easy and results in more
efficient blasting and less explosives usage.
9.3. QUALITY OF THE BOREHOLES
On the economic side should be stated that better quality holes lead to a much more regular
fragmentation, less wear for the shovel, faster loading and less energy for further
comminution. Boreholes without deviations also lead to bigger possible drill patterns, which
reduces explosives costs and drilling footage.
From the safety advantages it is clear that better knowledge of the holes position lead to less
risk of very low burden and therefore reduces the flyrock hazard. Even the case of too much

61
burden has an unpleasant aspect: blasting energy cannot be used for fragmentation if the
burden is too big but will be transformed into vibration energy and may lead to damages on
surrounding buildings.
9.4. DETONATORS
The fact that all detonators are identical, before a delay time is allocated, simplifies
stockkeeping and eliminates the circumstance that a delay time can be out of stock. The high
variability of delay times makes well pre-designed blasts with software possible and allows
blasts with a higher number of holes without having to fear that vibrations increase. At the
same time bigger blasts mean less numbers of blasts, which not only reduces complains by
neighbours but is also a safety factor, because we might not forget that blasting is still a
highly risky process.
In addition more precise delay times result in better fragmentation and easier rock-handling.
9.5. WAY OF INITIATION
Better energy efficiency causes less explosives consumption and therefore a cost reduction.
Moreover an initiation of the blasting column from the bottom without a detonating cord at
the top results in less generation of noise and reduces the risk of flyrock from stemming
material due to blowouts.
9.6. BLASTING AGENT
The explosive that fits the rock best will probably result in less explosives consumption,
hence reduced explosives costs, although it is not said that the outcome of a test procedure to
find the best fitting explosive is not the actual used one.
9.7. LOADING THE HOLES
The whole charging process will be done within less time, because the workmen do not need
to carry the explosives to every hole. This fact also improves the physical stress on the
employees. Furthermore less manpower is needed. Whereas now the holes are charged by two
or three men, with the DynoNobel charging unit just one is needed.
A charging unit enables the operator to put exact the same amount of explosive into every
hole, which results in a better distribution over all holes, more homogeneous fragmentation,
less explosives consumption and therefore reduces explosives costs.

62
9.8. DOCUMENTATION OF THE BLAST
Filming or making photos of a blast is a very easy and not cost intensive instrument to
document a blast.
It could also be a good proof with regard to possible flyrock accusations of neighbours,
especially now that the new part of the mine in the south is much nearer to surrounding
houses, than it was before in the northern part, where just one neighbour was actually
affected.
9.9. DOCUMENTATION OF THE BLASTING RESULT
In order to follow the company’s goal of continuous improvements it is necessary to measure
what is actually done. Only by doing this it can be assured that any changes result in a
reduction of costs, namely explosives costs but also loading time and wear of diggers and
crushers.
9.10. NOISE AND VIBRATIONS
The benefits from a more intense use of already measured ground vibrations are to be able to
predict vibrations better and find out how the blast vibrations propagate in the various parts of
the rock mass stronger than other parts and what the possible reasons for this effect are. It is
feasible that differences occur when blasting after heavy rainfall or in dry periods. Even
effects from different temperatures in summer and winter are thinkable.
By doing this, areas that are sensitive in particular can be discovered and special care can be
taken with maximum amount of explosives fired at once, when blasting there.
Keeping the noise levels down at blasts is also important because neighbours are always
firstly frightened because of a sudden bang and the created air overpressure and not of
vibrations. A blast that can barely be heard is therefore always a blast that does not create too
much attention. This might not be an economic or safety benefit first, but saves a lot of
discomfort and therefore time which most times results in cost savings.
Concerning neighbours it can be an advantage when abutting owners know a lot of what is
going on especially about blasting, which in their view is always a threat to their property and
a lot of troubles don’t even arise. A good relationship between company and neighbours is
therefore most times a part that can influence the success of such a big project like a mining
operation, positively.

63
10. CONCLUSIONS
10.1. SHORT TERM REALISATION
All issues in this paragraph can be realised already this year, because either the company
already owns the necessary equipment or no further investments are needed to realise them.
Therefore the existing resources should be used better and more intense. This includes:
� The regular surveying of faces with the system of the 3G-company in order to be able
to adapt the borehole depth to the bench height.
� A reduction of borehole deviations.
� The trying out of other explosives and a change of initiation practice together with a
new design of the column with detonators at the bottom of the hole and if necessary
redundant detonators on the top of the charge.
� A stepwise extension of the existing blast pattern of at least 50 % of the now used area
per hole. This means from 12 m² to 18 m² blasted area per hole. This would be even
possible without changing the detonators or delay times. Only the drilling accuracy
has to be improved to reach this goal.
� The documentation of the blast and the blasting success with the existing photo
camera, combined with a written evaluation as it is shown in chapter 7.10.
� A better utilisation of the vibration data, that has to be gathered by law anyway.
� The start of a community information campaign to intensify the contact to all
neighbours. Especially to those, who will hear and feel the mine much more, because
the main extraction area moves from the northern part of the mine to the southern part
in the near future.
10.2. MIDDLE TERM REALISATION
Topics here may already call for investments and reorganisation of working procedure.
Therefore the timeframe is about two to four years. These comprise:
� The purchase of a technical tool that helps to make charging the holes easier, even
faster and healthier for the workmen, because they would not have to carry 25 kg bags
of explosives around anymore.
� The change from the existing electric detonators to electronic detonators, who allow
bigger blasts, without increasing ground vibrations. Moreover blasts should be
planned from then on with adequate software, which most times come with the
electronic detonators.

64
� The purchase of AC’s SmartRig-System, although it is relatively new on the market.
Besides the advantages that were discussed in chapter 9.2, the company would be one
of the first in the world to work with a new ground-breaking technology in surface
drilling.
10.3. LONG TERM REALISATION
The long term’s aim has to be to build up a well working management system for the whole
drilling and blasting process. All information for the design of each blast could be available
there and all gained information from fired blasts is returned to it. This system should be
aimed on continuous improvements of existing procedures in order to return not only more
profit but also to create and keep a work environment were people work willingly and safely.

65
BIBLIOGRAPHY1.) AtlasCopco press information, December 2006, SmartrigTM takes control
2.) AtlasCopco, Mining and contruction, Mechanised rock excavation with AtlasCopco, No 3, 2006
3.) European Federation of Explosives Engineers, 2005, Brighton, UK. Third EFEE world
conference on explosives and blasting
4.) European Federation of Explosives Engineers, September 10-12, 2003, Prague, Czech
Republic. Proceedings of EFEE second world conference on explosives blasting technique
5.) Gokhale, B V, 2003, Blasthole drilling technology
6.) Hagan P, Mort P, The University of New South Wales, Sydney, Australia, 2002, Guide to
Report Writing in the School of Mining Engineering
7.) http://img01.atlascopco.com/Standard/SearchResult_RecordInfoFrame.jsp?recordView=Searc
hResult_RecordInfo&catalogID=1&recordID=21109, 3rd of Jannuary 2007
8.) http://www.dynonobel.info/NR/rdonlyres/B1352474-52BF-40E7-
8D76_B07C2483762D/0/AnfoMixer_Ver1_2006_E.pdf, 3rd of Jannuary 2007
9.) http://www.luzenac.com/occupational_health.htm, 3rd January of 2007
10.) http://www.orica-germany.com/html/e_produkte_zund.htm, 3rd of Jannuary 2007
11.) International Society of Explosives Engineers, February 10-13, 2002, Las Vegas, Nevada USA.
Proceedings of the twenty-eighth annual conference on explosives and blasting technique,
Volume 1
12.) International Society of Explosives Engineers, February 10-13, 2002, Las Vegas, Nevada USA.
Proceedings of the twenty-eighth annual conference on explosives and blasting technique,
Volume 2
13.) International Society of Explosives Engineers, February 13-16, 2000, Anaheim, California USA.
Proceedings of the twenty-sixth annual conference on explosives and blasting technique,
Volume 1
14.) International Society of Explosives Engineers, February 13-16, 2000, Anaheim, California USA.
Proceedings of the twenty-sixth annual conference on explosives and blasting technique,
Volume 2
15.) International Society of Explosives Engineers, February 1-4, 2004, New Orleans, Louisiana
USA. Proceedings of the thirtieth annual conference on explosives and blasting technique,
Volume 1
16.) International Society of Explosives Engineers, February 1-4, 2004, New Orleans, Louisiana
USA. Proceedings of the thirtieth annual conference on explosives and blasting technique,
Volume 2
17.) International Society of Explosives Engineers, February 2-5, 2003, Nashville, Tennessee USA.
Proceedings of the twenty-ninth annual conference on explosives and blasting technique,
Volume 1

66
18.) International Society of Explosives Engineers, February 2-5, 2003, Nashville, Tennessee USA.
Proceedings of the twenty-ninth annual conference on explosives and blasting technique,
Volume 2
19.) International Society of Explosives Engineers, January 28-31, 2001, Orlando, Florida USA.
Proceedings of the twenty-seventh annual conference on explosives and blasting technique,
Volume 1
20.) International Society of Explosives Engineers, January 28-31, 2001, Orlando, Florida USA.
Proceedings of the twenty-seventh annual conference on explosives and blasting technique,
Volume 2
21.) Jukka Naapuri, Tamrock, 2005. Surface drilling and blasting
22.) Julius Kruttschnitt Mineral Research Centre, The University of Queensland, Australia, 1996,
Open pit blast design, analysis and optimisation
23.) Lecture notes to Sprengingenieurlehrgang, February 2006, Leoben, Austria
24.) Prof. Wang Xuguang, 2002, Rock Fragmentation by Blasting (China Society of Engineering
Blasting, Beijing General Research Institute of Mining and Metallurgy, China)
25.) Rabenwald mine, 2007. Personal provided information on mine geology. 8th of January 2007
26.) Rabenwald mine, 2007. Personal provided map of mine. 29th of January 2007
27.) Rabenwald mine, 2007. Personal provided records of the drill operator and the shot-firer. 31st
of January 2007

67
APPENDIX A: DRILL OPERATOR’S AND SHOT-FIRER’SBLAST RECORDS
Figure 51: Drill operator's record of the 2nd blast, Source [27]

68
Figure 52: Shot-firer's record of the 2nd blast, Source [27]

69
Figure 53: Shot-firer's plan of the 2nd blast, Source [27]
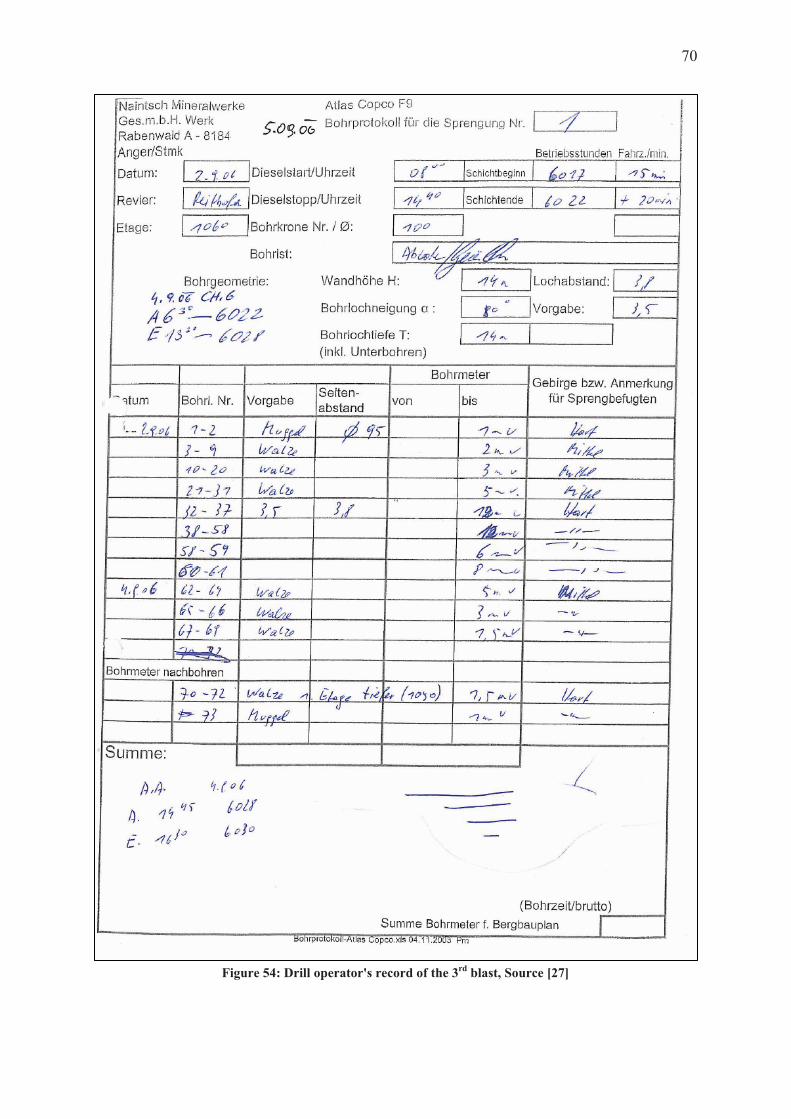
70
Figure 54: Drill operator's record of the 3rd blast, Source [27]

71
Figure 55: Shot-firer's record for the 3rd blast, Source [27]

72
Figure 56: Shot-firer's plan of the 3rd blast, Source [27]

73
Figure 57: Drill operator's record of the 4th blast, Source [27]

74
Figure 58: Shot-firer's record of the 4th blast, Source [27]

75
Figure 59: Shot-firer's record of the 4th blast, Source [27]

76
Figure 60: Drill operator's record of the 5th blast, Source [27]
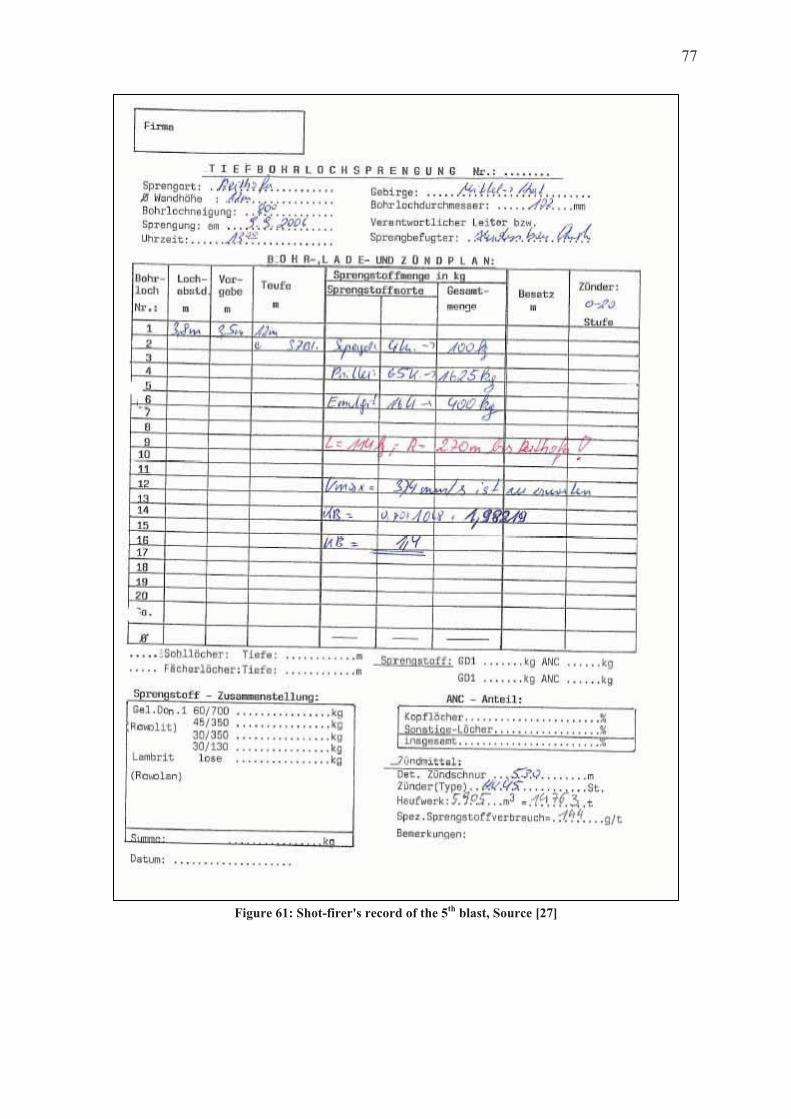
77
Figure 61: Shot-firer's record of the 5th blast, Source [27]
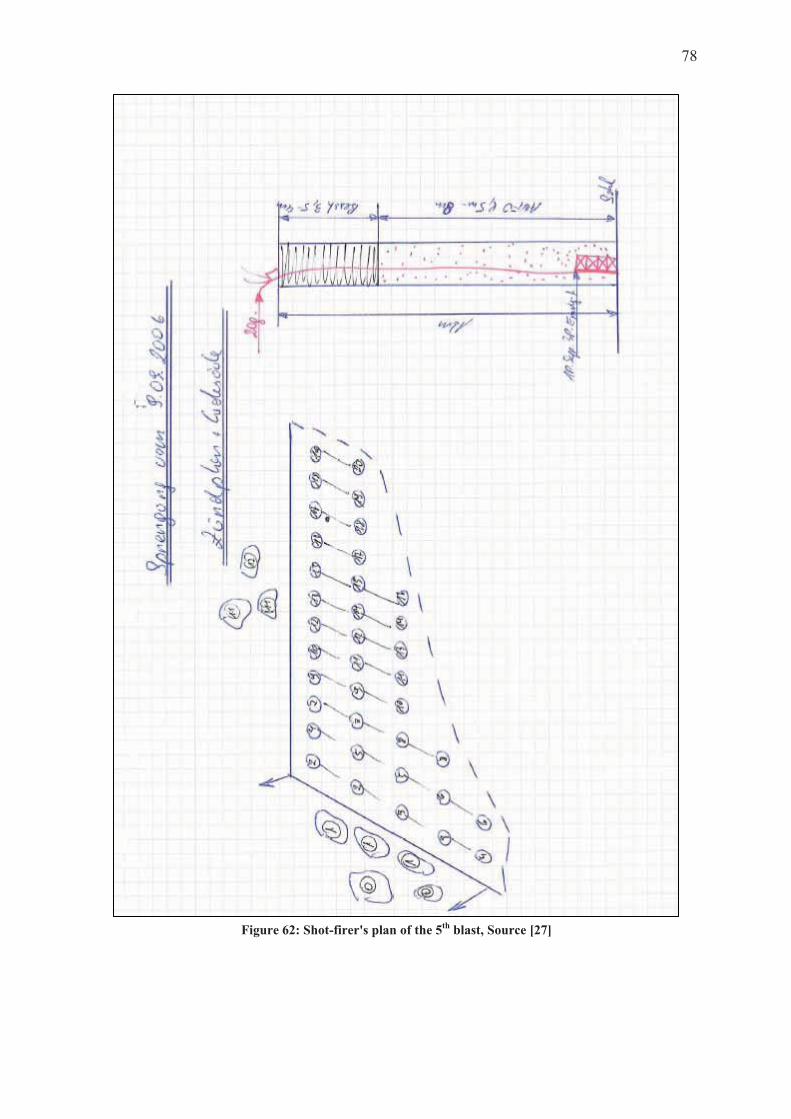
78
Figure 62: Shot-firer's plan of the 5th blast, Source [27]

79
Figure 63: Drill operator's record of the 6th blast, Source [27]

80
Figure 64: Shot-firer's record of the 6th blast, Source [27]
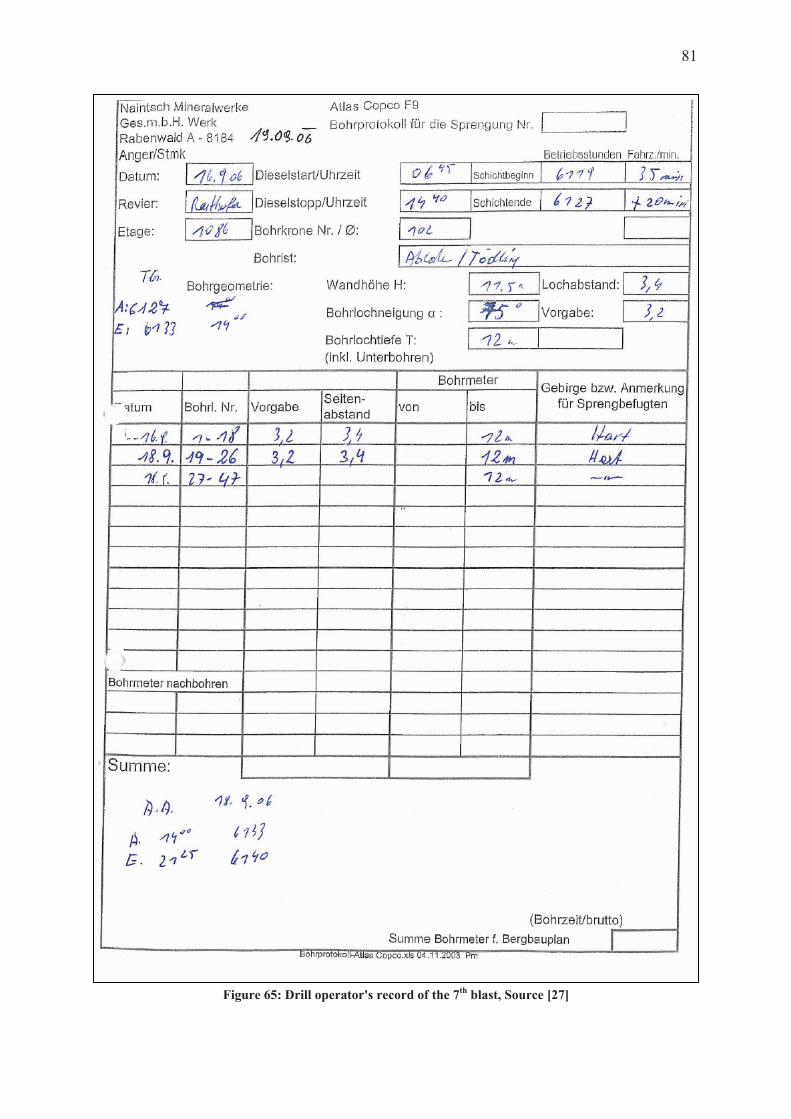
81
Figure 65: Drill operator's record of the 7th blast, Source [27]

82
Figure 66: Shot-firer's record of the 7th blast, Source [27]

83
Figure 67: Drill operator's record of the 8th blast, Source [27]

84
Figure 68: Shot-firer's record of the 8th blast, Source [27]

85
Figure 69: Shot-firer's plan of the 8th blast, Source [27]

86
Figure 70: Drill operator's record of the 9th blast, Source [27]
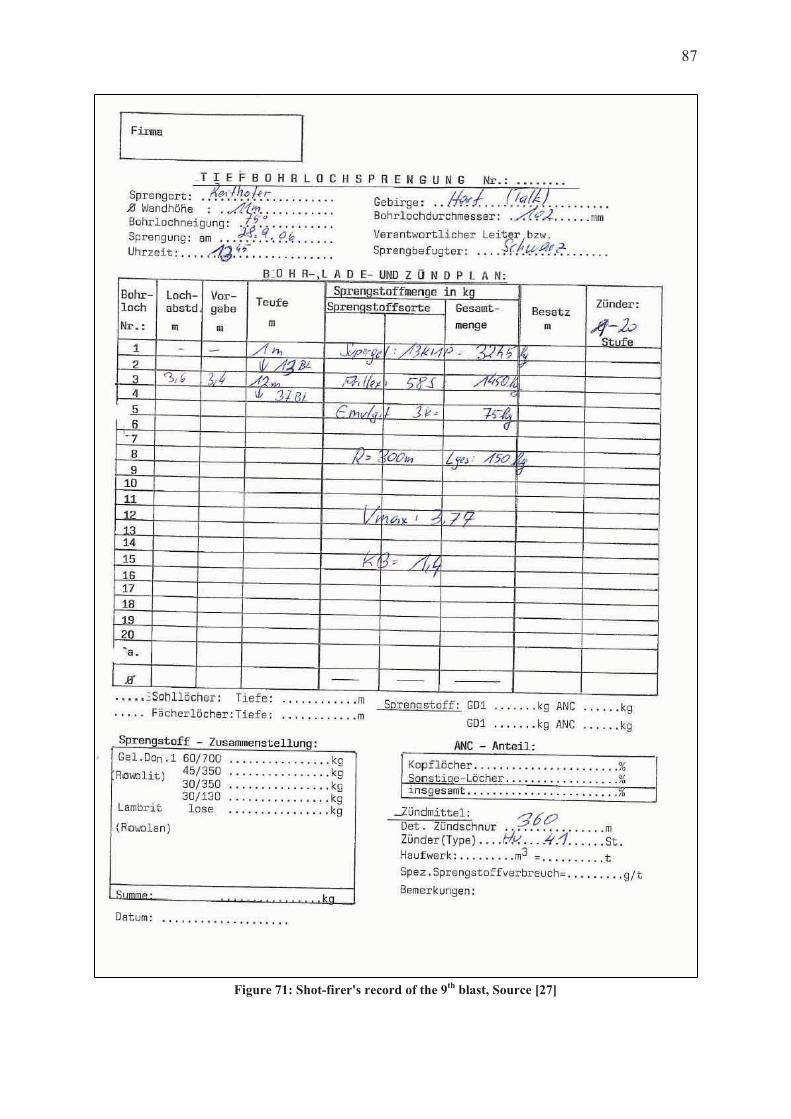
87
Figure 71: Shot-firer's record of the 9th blast, Source [27]
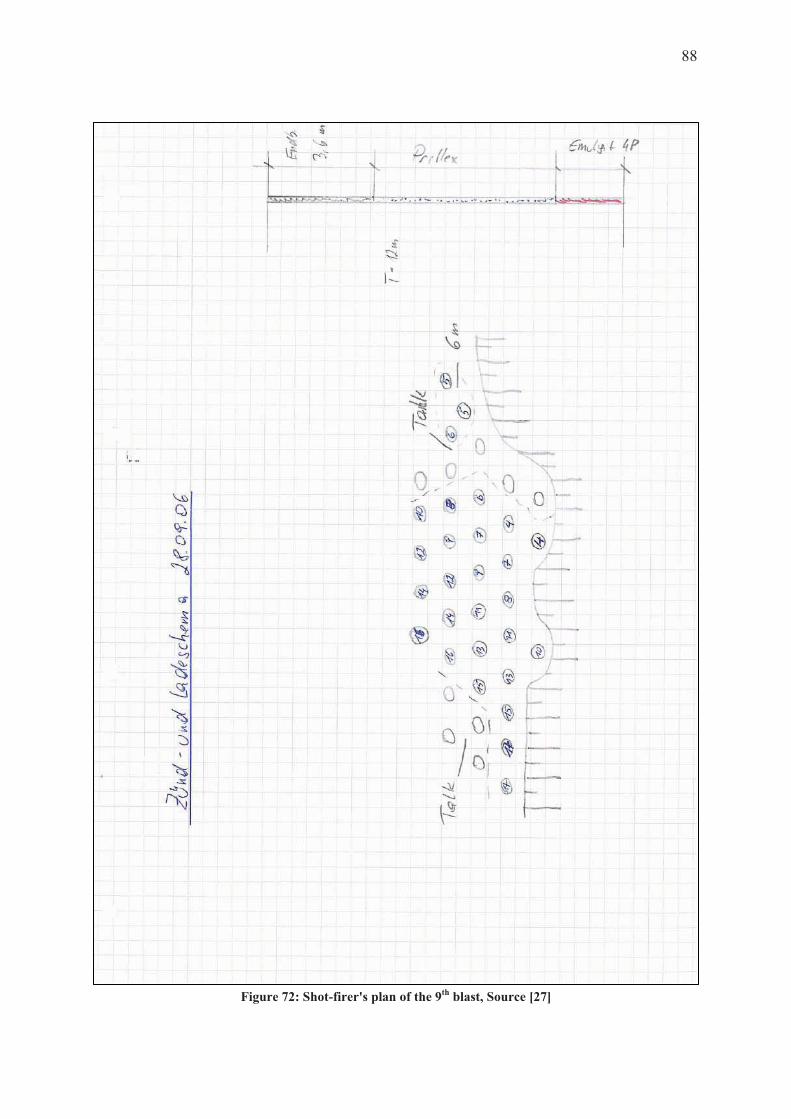
88
Figure 72: Shot-firer's plan of the 9th blast, Source [27]

89
APPENDIX B: VIBRATION EVENT REPORTS
Figure 73: Vibrations event report from the 4th blast, Source [27]
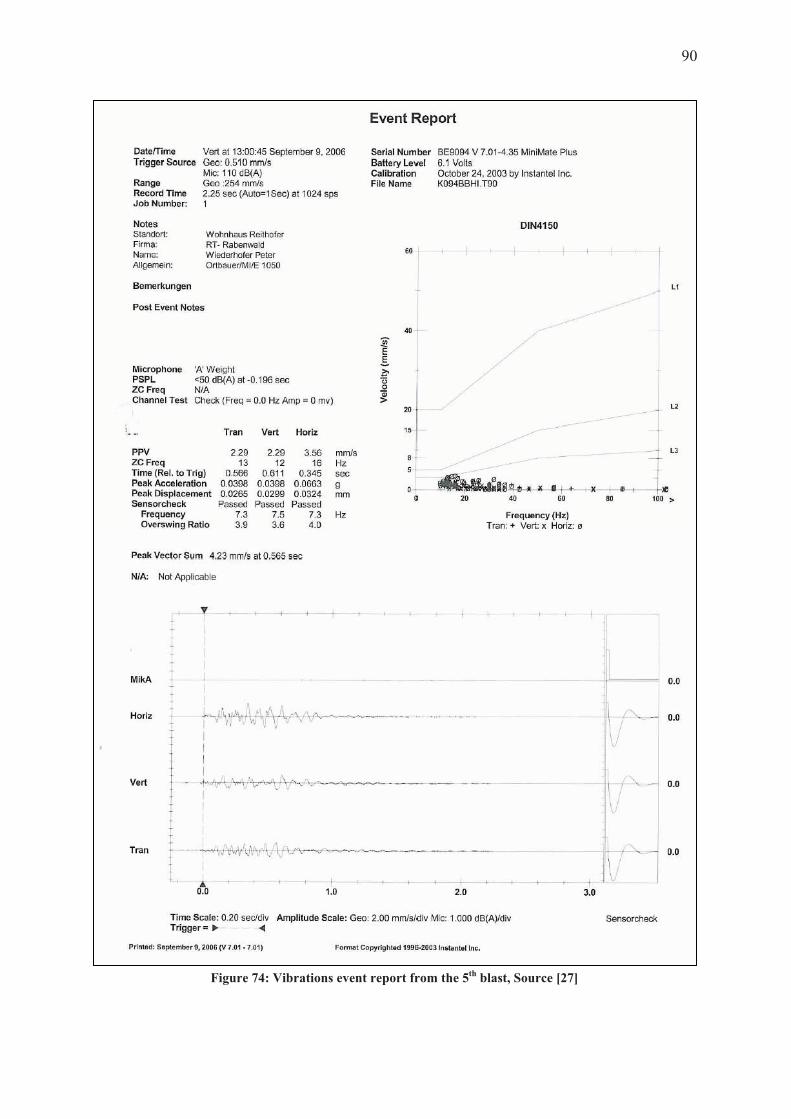
90
Figure 74: Vibrations event report from the 5th blast, Source [27]

91
Figure 75: Vibrations event report from the 7th blast, Source [27]

92
Figure 76: Vibrations event report from the 8th blast, Source [27]

93
APPENDIX C: SURVEYED SHOT PLANS
Figure 77: Surveyed shot plan of the borehole starting points from the 3rd blast
Figure 78: Surveyed shot plan for the borehole starting points from the 4th blast
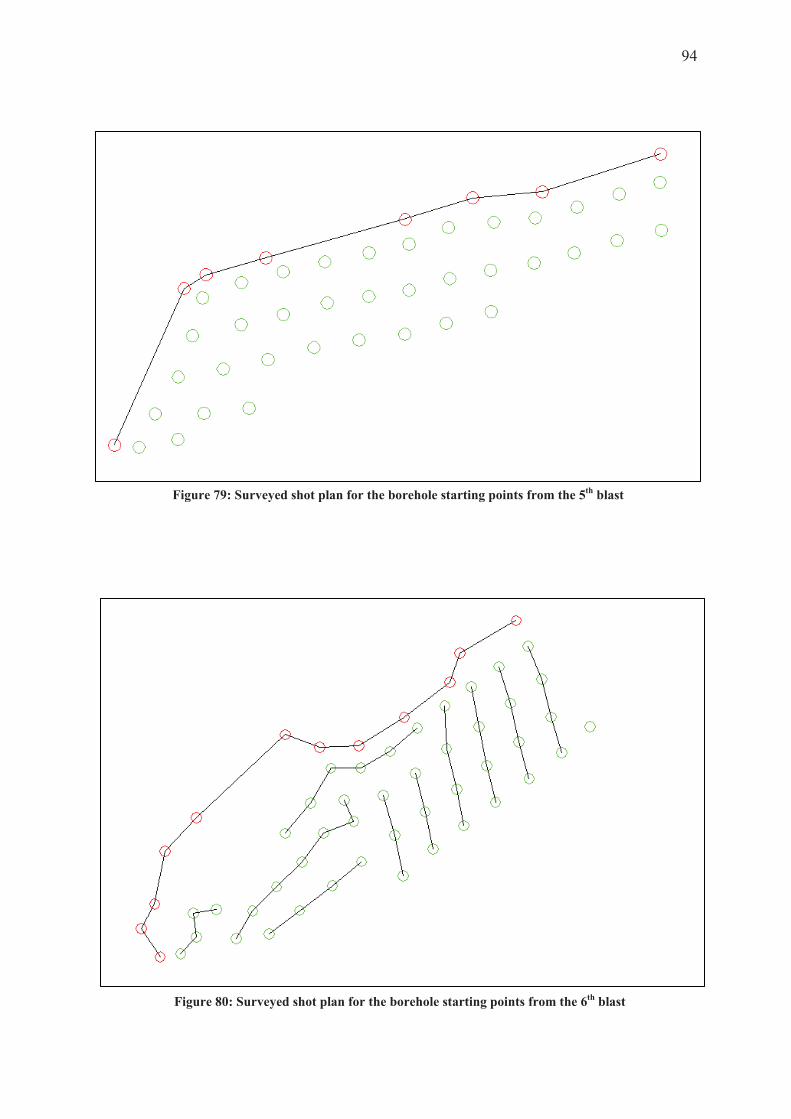
94
Figure 79: Surveyed shot plan for the borehole starting points from the 5th blast
Figure 80: Surveyed shot plan for the borehole starting points from the 6th blast

95
Figure 81: Surveyed shot plan for the borehole starting points from the 7th blast
Figure 82: Surveyed shot plan for the borehole starting points from the 8th blast
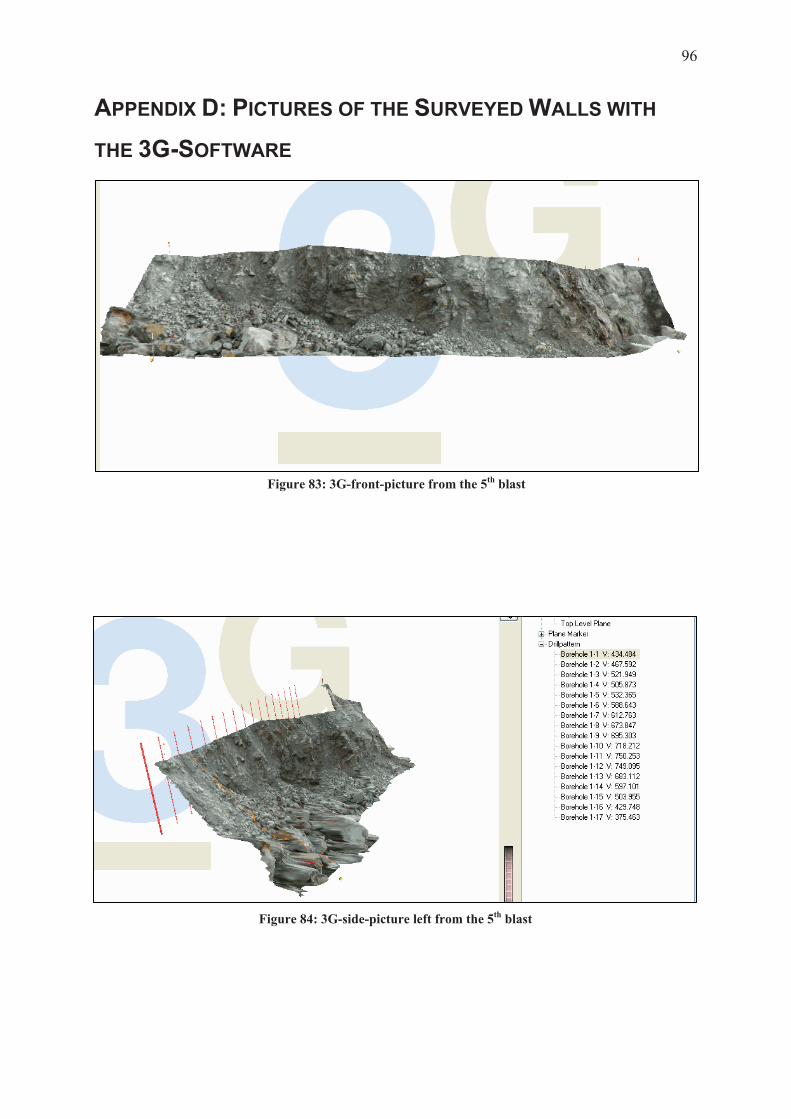
96
APPENDIX D: PICTURES OF THE SURVEYED WALLS WITH
THE 3G-SOFTWARE
Figure 83: 3G-front-picture from the 5th blast
Figure 84: 3G-side-picture left from the 5th blast

97
Figure 85: 3G-side-picture right from the 5th blast
Figure 86: Plan view of the wall from the 5th blast

98
Figure 87: 3G-front-picture of the 7th blast (left side)
Figure 88: 3G-side-picture of the 7th blast (left side)

99
From here on muck
Figure 89: Picture of the first borehole with burdens from the 7th blast (left side)
Figure 90: Plan view of the 7th blast (left side)

100
Figure 91: 3G-front-picture of the 7th blast (right side)
Figure 92: 3G-side-picture of the 7th blast (right side)

101
Figure 93: Picture of the first borehole with burdens from the 7th blast (right side)
From here on muck
Figure 94: Plan view of the 7th blast (right side)

102
Figure 95: 3G-front-picture of the 9th blast
Figure 96: 3G-side-picture from the 9th blast

103
Figure 97: Plan view from the 9th blast
Figure 98: 3G-front-picture of the 10th blast

104
Figure 99: 3G-side-picture of the 10th blast
Figure 100: Plan view of the 10th blast

105
APPENDIX E: DATA SHEETS FROM LOADING THE HOLESTable 18: Data sheet of the 2nd blast
Blast date 01.09.2006 (12:15) Bench: 1050
Charge Stemming No. Det. No. Gelatine Emulsion ANFO Height Kind Notes
(Cartridges) (Cartridges) (Bag) (m) 1 0 3 1,75 4 dill cuttings2 1 3 2 4 dill cuttings 3 2 3 2,25 3,6 dill cuttings 4 3 3 2 4 dill cuttings 5 5 3 2,5 3,5 dill cuttings 6 6 3 2 3,5 dill cuttings 7 8 3 2 4 dill cuttings 8 14 4 2,5 3,5 dill cuttings 9 16 3 2 3,5 dill cuttings
10 17 3 2 3,5 dill cuttings 11 19 3 2,25 3,5 dill cuttings 12 0 3 1,75 3,7 dill cuttings 13 1 3 2 3,5 dill cuttings 14 2 3 2 3,5 dill cuttings 15 4 3 2 3,5 dill cuttings 16 5 3 2 3,5 dill cuttings 17 7 3 2 3,5 dill cuttings water in hole 18 9 3 2 3,5 dill cuttings water in hole 19 10 3 2,25 3,5 dill cuttings 20 11 3 1,5 3,5 dill cuttings 21 12 3 2,25 3,5 dill cuttings 22 14 3 2,25 3,5 dill cuttings 23 16 5 1,75 3,5 dill cuttings 24 18 5 1 3,5 dill cuttings 25 0 3 2 3,5 dill cuttings stemming in between 26 2 3 2,5 3,5 dill cuttings stemming in between 27 3 3 1,75 3,5 dill cuttings 28 4 3 2 3,5 dill cuttings stemming in between 29 6 3 2,5 3,5 dill cuttings stemming in between 30 7 3 2,25 3,5 dill cuttings stemming in between 31 9 3 1,5 3 dill cuttings 32 11 3 2,25 3,5 dill cuttings 33 13 3 2 3,7 dill cuttings 34 15 3 2,25 4 dill cuttings 35 17 3 2 3,5 dill cuttings 36 18 3 1,25 3,5 dill cuttings 37 1 3 2,25 3,5 dill cuttings 38 8 3 1,5 3,6 dill cuttings 39 10 3 1,75 3,5 dill cuttings 40 12 3 2,25 3,5 dill cuttings 41 13 3 2 3,5 dill cuttings 42 15 3 2 3,5 dill cuttings

106
43 hole not loaded because blocked 44 19 3 2 3,5 dill cuttings 45 20 5 2 3,5 dill cuttings water in hole

107
Table 19: Data sheet of the 3rd blast
Blast date 5.9.2006 (13:45) Bench:1060
Charge Stemming No. Det. No. Gelatine Emulsion ANFO Height Kind Notes
(Cartridges) (Cartridges) (Bag) (m) 1 0 8 1,5 4 drill cuttings 2 0 8 1,5 4 drill cuttings 3 0 9,5 1,5 4 drill cuttings 4 1 4 2,5 3,8 drill cuttings 5 1 8,5 1,5 3,8 drill cuttings 6 2 10 1,5 4 drill cuttings 7 2 9 1,5 3,5 drill cuttings 8 3 5 2 3,6 drill cuttings 9 3 1,5 3 2,25 3,8 drill cuttings
10 4 1,25 4 2 3,8 drill cuttings 11 4 4 2,5 3,8 drill cuttings 12 5 4 2,25 3,8 drill cuttings 13 4 7 1,5 4,5 drill cuttings 14 5 7 1,75 3,6 drill cuttings 15 6 4 2,25 4 drill cuttings 16 6 4 2,25 3,8 drill cuttings 17 7 0,5 1,7 drill cuttings 18 7 4 2,25 3,8 drill cuttings 19 8 4 2,25 3,8 drill cuttings 20 8 4 2,5 3,8 drill cuttings 21 9 10 3,8 drill cuttings 22 9 4 2 3,8 drill cuttings 23 10 4 2,25 3,8 drill cuttings 24 10 1 1,5 3,5 drill cuttings 25 11 4 0,25 3 drill cuttings 26 11 8 1,25 4 drill cuttings 27 12 4 2 3,8 drill cuttings 28 12 3 1,25 3 drill cuttings 29 13 2 0,5 3 drill cuttings 30 14 6 1 3,1 drill cuttings 31 15 3 0,75 4 drill cuttings
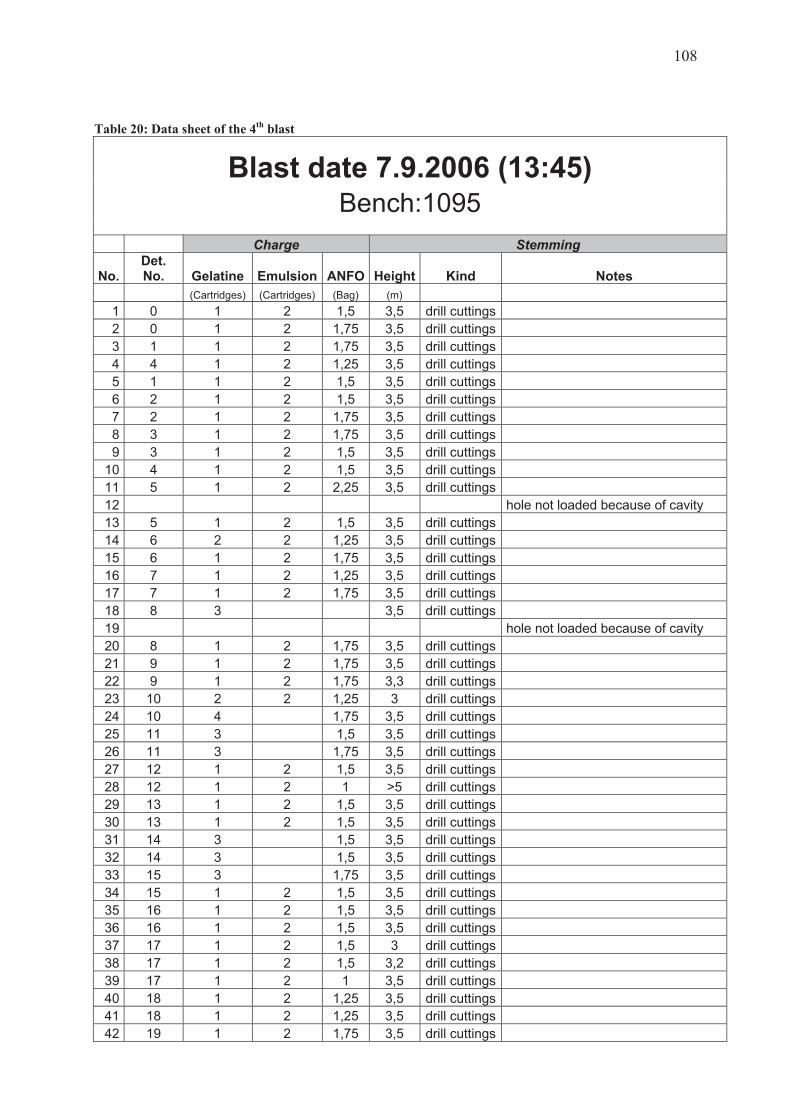
108
Table 20: Data sheet of the 4th blast
Blast date 7.9.2006 (13:45) Bench:1095
Charge Stemming
No.Det.No. Gelatine Emulsion ANFO Height Kind Notes
(Cartridges) (Cartridges) (Bag) (m) 1 0 1 2 1,5 3,5 drill cuttings2 0 1 2 1,75 3,5 drill cuttings 3 1 1 2 1,75 3,5 drill cuttings 4 4 1 2 1,25 3,5 drill cuttings 5 1 1 2 1,5 3,5 drill cuttings 6 2 1 2 1,5 3,5 drill cuttings 7 2 1 2 1,75 3,5 drill cuttings 8 3 1 2 1,75 3,5 drill cuttings 9 3 1 2 1,5 3,5 drill cuttings
10 4 1 2 1,5 3,5 drill cuttings 11 5 1 2 2,25 3,5 drill cuttings 12 hole not loaded because of cavity 13 5 1 2 1,5 3,5 drill cuttings 14 6 2 2 1,25 3,5 drill cuttings 15 6 1 2 1,75 3,5 drill cuttings 16 7 1 2 1,25 3,5 drill cuttings 17 7 1 2 1,75 3,5 drill cuttings 18 8 3 3,5 drill cuttings 19 hole not loaded because of cavity 20 8 1 2 1,75 3,5 drill cuttings 21 9 1 2 1,75 3,5 drill cuttings 22 9 1 2 1,75 3,3 drill cuttings 23 10 2 2 1,25 3 drill cuttings 24 10 4 1,75 3,5 drill cuttings 25 11 3 1,5 3,5 drill cuttings 26 11 3 1,75 3,5 drill cuttings 27 12 1 2 1,5 3,5 drill cuttings 28 12 1 2 1 >5 drill cuttings 29 13 1 2 1,5 3,5 drill cuttings 30 13 1 2 1,5 3,5 drill cuttings 31 14 3 1,5 3,5 drill cuttings 32 14 3 1,5 3,5 drill cuttings 33 15 3 1,75 3,5 drill cuttings 34 15 1 2 1,5 3,5 drill cuttings 35 16 1 2 1,5 3,5 drill cuttings 36 16 1 2 1,5 3,5 drill cuttings 37 17 1 2 1,5 3 drill cuttings 38 17 1 2 1,5 3,2 drill cuttings 39 17 1 2 1 3,5 drill cuttings 40 18 1 2 1,25 3,5 drill cuttings 41 18 1 2 1,25 3,5 drill cuttings 42 19 1 2 1,75 3,5 drill cuttings

109
43 19 1 2 1,25 3,5 drill cuttings 44 20 1 2 1,5 3,5 drill cuttings 45 20 1 2 1,75 3 drill cuttings

110
Table 21: Data sheet of the 5th blast
Blast date 9.9.2006 (13:00) Bench:1050
Charge Stemming No. Det. No. Gelatine Emulsion ANFO Height Kind Notes
(Cartridges) (Cartridges) (Bag) (m) 1 2 1 3 1,75 4 drill cuttings stemming in between 2 4 1 3 2 3,7 drill cuttings 3 7 1 3 2,25 3,5 drill cuttings 4 9 1 3 2,5 3,7 drill cuttings 5 10 1 3 2 3,7 drill cuttings 6 12 1 3 2 3,5 drill cuttings 7 13 1 3 1,75 3,5 drill cuttings 8 15 1 3 2 3,5 drill cuttings 9 16 1 3 2 4 drill cuttings
10 17 1 3 1,75 3,3 drill cuttings 11 18 1 3 2 3,8 drill cuttings 12 19 1 3 2 3,5 drill cuttings 13 2 1 3 2,25 3,8 drill cuttings stemming in between 14 5 1 3 2 3,5 drill cuttings 15 7 1 3 2 3,5 drill cuttings 16 9 1 3 1,75 3,5 drill cuttings 17 11 1 3 2 3,7 drill cuttings 18 12 1 3 2 3,5 drill cuttings 19 14 1 3 2 3,5 drill cuttings 20 15 1 3 2 3,5 drill cuttings 21 17 1 6 1,5 3,5 drill cuttings 22 18 1 6 1,5 4 drill cuttings 23 19 1 5 1,5 4 drill cuttings 24 20 1 16 0,25 3,5 drill cuttings 25 3 1 3 1,5 4 drill cuttings stemming in between 26 5 1 3 2,25 3,5 drill cuttings 27 8 1 3 2 3,5 drill cuttings 28 10 1 3 2,25 3,5 drill cuttings 29 11 1 6 1,5 3,5 drill cuttings 30 13 1 6 1,5 4 drill cuttings 31 14 1 6 1,5 3,5 drill cuttings 32 16 1 15 3,7 drill cuttings 33 3 1 3 1,75 4 drill cuttings 34 6 1 7 1,5 3,5 drill cuttings 35 8 1 6 2 3,8 drill cuttings 36 4 1 3 1,75 3,5 drill cuttings 37 6 1 6 1,5 3,5 drill cuttings

111
Table 22: Data sheet of the 6th blast
Blast date 15.09.2006 (12:00) Bench: 1050
Charge Stemming No. Det. No. Gelatine Emulsion ANFO Height Kind Notes
(Cartridges) (Cartridges) (Bag) (m) 1 0 1 2 1,25 3,5 drill cuttings 2 0 1 2 1,75 3,5 drill cuttings 3 0 1 2 1,75 3,5 drill cuttings 4 1 1 2 1 3,5 drill cuttings 5 1 1 3,5 drill cuttings 6 1 2 1 3,5 drill cuttings 7 2 1 3 1,5 3,5 drill cuttings 8 1 2 3 1,5 3,5 drill cuttings 9 2 1 3 2 3,5 drill cuttings
10 5 1 3 1,75 3,5 drill cuttings 11 6 1 3 2 3,5 drill cuttings 12 8 1 3 2 3,5 drill cuttings 13 10 1 3 2 3,5 drill cuttings 14 12 1 3 2 3,5 drill cuttings 15 14 1 3 2 3,5 drill cuttings 16 4 1 3 2,25 3,5 drill cuttings 17 3 1 2 2 3,5 drill cuttings 18 3 1 2 1,25 3,5 drill cuttings 19 3 1 2 1,75 3,5 drill cuttings 20 2 1 3 1,75 3,5 drill cuttings 21 4 1 3 2 3,5 drill cuttings 22 6 1 3 2 3,5 drill cuttings 23 7 1 3 2 3,5 drill cuttings 24 9 1 3 2 3,5 drill cuttings 25 11 1 3 2 3,5 drill cuttings 26 13 1 3 2 3,5 drill cuttings 27 15 1 3 2 3,5 drill cuttings 28 5 1 3 1,25 3,5 drill cuttings 29 4 1 3 3 3,5 drill cuttings 30 5 1 4 2 3,5 drill cuttings 31 6 1 3 2,25 3,5 drill cuttings 32 7 1 4 2,25 3,5 drill cuttings 33 7 1 3 2,25 3,5 drill cuttings 34 9 1 3 2,5 3,5 drill cuttings 35 11 1 3 2 3,5 drill cuttings 36 13 1 4 2 3,5 drill cuttings 37 15 1 3 2 3,5 drill cuttings 38 8 1 3 1,5 3 drill cuttings stemming in between 39 10 1 3 1,75 3 drill cuttings stemming in between 40 12 1 3 1,5 3 drill cuttings stemming in between 41 14 1 3 1,5 3 drill cuttings stemming in between 42 16 1 3 2 3 drill cuttings stemming in between

112
43 17 1 3 1,25 3 drill cuttings stemming in between 44 17 1 3 1,75 3 drill cuttings stemming in between

113
Table 23: Data sheet of the 7th blast
Blast date 19.09.2006 (12:00) Bench: 1085
Charge Stemming No. Det. No. Gelatine Emulsion ANFO Height Kind Notes
(Cartridges) (Cartridges) (Bag) (m) 1 0 4 2 3,8 drill cuttings 2 0 4 2 3,5 drill cuttings 3 1 4 2 3,8 drill cuttings 4 1 4 1,75 3,5 drill cuttings 5 3 4 3 1,5 3,8 drill cuttings water in hole 6 4 4 2 3,8 drill cuttings 7 5 4 7 0,5 4 drill cuttings water in hole 8 7 4 2 1,5 3,8 drill cuttings water in hole 9 8 4 8 0,75 3,8 drill cuttings water in hole
10 2 4 2 3,8 drill cuttings 11 4 4 1,5 4,3 drill cuttings 12 5 4 2,5 4 drill cuttings 13 6 4 1,5 4 drill cuttings 14 8 4 6 1 4 drill cuttings water in hole 15 9 4 2 1,5 3,8 drill cuttings water in hole 16 2 4 2 1,5 4 drill cuttings water in hole 17 3 4 4 1,25 4 drill cuttings water in hole 18 5 4 2 1,25 4,2 drill cuttings water in hole 19 6 4 2,25 3,8 drill cuttings 20 7 4 2,25 2,25 3,8 drill cuttings water in hole 21 9 4 2 1,25 3,8 drill cuttings water in hole 22 9 4 7 0,5 3,8 drill cuttings water in hole 23 4 4 1 3,8 drill cuttings 24 6 4 2 4 drill cuttings
25 7 4 0,25 2 drill cuttings
hole got blocked after cartridges were loaded
26 8 4 1,5 4,5 drill cuttings 27 10 4 2 4 drill cuttings 28 11 4 2 4,2 drill cuttings 29 12 4 3 5 drill cuttings 30 13 4 2 2 5 drill cuttings 31 13 4 6 2 3,5 drill cuttings 32 14 4 2 4 drill cuttings 33 15 4 2 2 3,5 drill cuttings 34 16 4 2 4 drill cuttings 35 13 4 1,25 4,2 drill cuttings 36 14 4 1,5 4,2 drill cuttings 37 15 4 1,5 4 drill cuttings 38 17 11 2 0,25 4 drill cuttings 39 10 4 2,25 3,8 drill cuttings 40 11 4 2 4 drill cuttings 41 12 10 3 4 drill cuttings

114
42 12 10 3 3,5 drill cuttings 43 14 10 3 4 drill cuttings 44 10 4 2 1 4 drill cuttings 45 11 4 2 1,5 4 drill cuttings 46 11 10 3 4 drill cuttings 47 15 4 3 0,75 4 drill cuttings

115
Table 24: Data sheet of the 8th blast
Blast date 26.09.2006 (13:45) Bench: 1050 new south part of the mine
Charge Stemming No. Det. No. Gelatine Emulsion ANFO Height Kind Notes
(Cartridges) (Cartridges) (Bag) (m) 1 13 2,5 1,25 3,5 drill cuttings 2 12 2,5 1,25 3,5 drill cuttings 3 9 2,5 1,5 3,5 drill cuttings 4 8 2,5 1,25 3,5 drill cuttings 5 7 2,5 1,25 3,5 drill cuttings 6 6 2,5 1,25 3,5 drill cuttings 7 5 2,5 1,5 3,5 drill cuttings 8 4 2,5 1,25 3,5 drill cuttings 9 4 2,5 1,25 3,5 drill cuttings
10 3 2,5 1,25 3,5 drill cuttings 11 14 2,5 1,5 3,5 drill cuttings 12 13 2,5 1,25 3,5 drill cuttings 13 12 2,5 1,25 3,5 drill cuttings 14 10 2,5 1 3,5 drill cuttings 15 8 2,5 1,25 3,5 drill cuttings 16 7 2,5 1,25 3,5 drill cuttings 17 6 3,5 1,25 3,5 drill cuttings 18 5 2,5 1 3,5 drill cuttings 19 5 2,5 1 3,5 drill cuttings 20 15 2,5 1 3,5 drill cuttings 21 14 2,5 1,25 3,5 drill cuttings 22 12 2,5 1,5 3,5 drill cuttings 23 10 2,5 1,5 3,5 drill cuttings 24 9 2,5 1,5 3,5 drill cuttings 25 8 2,5 1,5 3,5 drill cuttings 26 6 2 1,75 3,5 drill cuttings 27 9 3 2 3,5 drill cuttings 28 10 4 2,5 3,9 drill cuttings 29 13 4 2,5 3,9 drill cuttings 30 14 4 2,5 3,9 drill cuttings 31 15 4 2,5 3,9 drill cuttings 32 16 4 2,5 3,9 drill cuttings 33 16 4 2,5 3,9 drill cuttings 34 17 4 2,5 3,9 drill cuttings 35 17 4 2,5 3,9 drill cuttings 36 16 4 2,5 3,9 drill cuttings 37 15 4 2,5 3,9 drill cuttings 38 14 4 2,5 3,9 drill cuttings 39 13 4 2,5 3,9 drill cuttings 40 3 2,5 1,25 3,3 drill cuttings 41 2 2,5 1,25 3 drill cuttings 42 2 2 1,25 3 drill cuttings

116
43 1 2 1 3 drill cuttings 44 1 2 0,75 3 drill cuttings 45 1 2 0,75 2,8 drill cuttings 46 0 1 0,75 2,8 drill cuttings 47 0 1 0,5 2,8 drill cuttings 48 0 1 0,5 2,8 drill cuttings 49 0 1 0,125 2,8 drill cuttings 50 0 1 0,125 2,5 drill cuttings 51 drill cuttings does not exist 52 drill cuttings hole blocked 53 1 2 1 2,8 drill cuttings 54 1 2 1 2,8 drill cuttings 55 2 2 1 3 drill cuttings 56 2 2,5 1,25 3,5 drill cuttings 57 2 2,5 1,5 3,3 drill cuttings 58 3 2,5 1,25 3,5 drill cuttings 59 3 2,5 1,25 3,5 drill cuttings 60 4 2,5 1,25 3,5 drill cuttings 61 4 2,5 1,25 3 drill cuttings 62 5 2,5 1,25 3 drill cuttings 63 5 2,5 1,5 3 drill cuttings 64 7 2,5 1 3,5 drill cuttings

117
Table 25: Data sheet of the 9th blast
Blast date 28.09.2006 (13:45) Bench: 1040
Charge Stemming No. Det. No. Gelatine Emulsion ANFO Height Kind Notes
(Cartridges) (Cartridges) (Bag) (m) 1 17 4 2,5 3,5 drill cuttings 2 15 4 2 3,5 drill cuttings 3 13 4 2,25 3,5 drill cuttings 4 11 4 2,5 3,5 drill cuttings 5 9 4,5 2,75 3,5 drill cuttings 6 10 4 2,5 3,5 drill cuttings 7 8 11 3,25 3,5 drill cuttings 8 7 4 2,75 3,5 drill cuttings 9 4 4 2,25 3,5 drill cuttings
10 5 4 2,25 3,5 drill cuttings 11 5 2 6 3,5 drill cuttings 12 4 2 6 3,5 drill cuttings 13 6 4 2,75 3,5 drill cuttings 14 7 14 2 2,75 3,5 drill cuttings 15 9 7 8 2,75 3,5 drill cuttings 16 11 4 2,25 3,5 drill cuttings 17 13 4 2,25 3,5 drill cuttings 18 15 4 2 3,5 drill cuttings 19 16 4 2 3,5 drill cuttings 20 14 4 2,25 3,5 drill cuttings 21 12 4 2 3,5 drill cuttings 22 10 4 2,5 3,5 drill cuttings
23 8 5 1,5 3,5 drill cuttings
cavity, therefore stemming in between
24 6 2 6 2,25 3,5 drill cuttings 25 12 4 2,25 3,5 drill cuttings 26 14 4 2,25 3,5 drill cuttings 27 16 4 2,25 3,5 drill cuttings 28 17 4 2,25 3,5 drill cuttings

118
Table 26: Data sheet of the 10th blast
Blast date 05.10.2006 (13:45) Bench: 1050
Charge Stemming No. Det. No. Gelatine Emulsion ANFO Height Kind Notes
(Cartridges) (Cartridges) (Bag) (m) 1 0 2 2 2 3,5 drill cuttings 2 0 2 2 2 3,5 drill cuttings 3 0 2 2 2,25 3,5 drill cuttings 4 1 2 3 2,25 3,5 drill cuttings 5 1 2 2 2 3,5 drill cuttings 6 1 2 2 1,5 3,3 drill cuttings 7 hole blocked, not charged 8 2 2 2 2,25 3,3 drill cuttings 9 2 2 2 1,75 3,3 drill cuttings
10 2 2 2 2,25 3,5 drill cuttings 11 3 2 2 2,25 3,5 drill cuttings 12 3 2 2 1,75 3,5 drill cuttings 13 3 2 4 1,25 3,5 drill cuttings 14 4 2 2 2 3,5 drill cuttings 15 4 2 2 1 3,5 drill cuttings 16 4 2 2 2 3,5 drill cuttings 17 5 2 2 1,75 2,8 drill cuttings 18 5 2 2 2,5 3,5 drill cuttings 19 5 2 2 1,25 3 drill cuttings 20 6 2 4 3,5 drill cuttings 21 6 2 1 1 3 drill cuttings 22 6 1 2 1 3 drill cuttings 23 4 2 2 1,75 3,5 drill cuttings stemming in between 24 5 2 2 2 3,5 drill cuttings 25 7 2 4 1,75 3,5 drill cuttings 26 7 2 2 2,25 3,5 drill cuttings 27 10 2 2 1,75 3,5 drill cuttings stemming in between 28 10 2 2 2 3,5 drill cuttings 29 11 2 2 2,25 3,5 drill cuttings 30 11 2 2 0,75 3,5 drill cuttings 31 12 2 2 1,5 3,5 drill cuttings stemming in between 32 12 2 2 2 3,5 drill cuttings 33 13 2 2 0,75 2 drill cuttings 34 13 2 2 1,5 3,5 drill cuttings stemming in between 35 14 2 2 1,5 3,5 drill cuttings 36 15 2 9 3 drill cuttings water in hole 37 7 2 10 3,5 drill cuttings water in hole 38 drill cuttings hole blocked, not charged 39 8 2 2 1 3 drill cuttings 40 8 1 1 1 3 drill cuttings 41 8 1 1 1,25 3 drill cuttings 42 9 1 0,5 2,5 drill cuttings

119
43 9 1 0,75 2,5 drill cuttings 44 9 1 0,75 2,5 drill cuttings