optimisation of lactic acid fermentation of york cabbage for the development of potential probiotic...
TRANSCRIPT

Original article
Optimisation of lactic acid fermentation of York cabbage for the
development of potential probiotic products
Amit K. Jaiswal, Shilpi Gupta & Nissreen Abu-Ghannam*
School of Food Science and Environmental Health, College of Sciences and Health, Dublin Institute of Technology, Cathal Brugha Street, Dublin
1, Ireland
(Received 8 December 2011; Accepted in revised form 24 February 2012)
Summary In this study, York cabbage was used as the sole substrate for the lactic acid (LA) fermentation with
Lactobacillus plantarum. York cabbage was blanched at 95 �C for 12 min to inactivate surface microflora
prior to fermentation. To achieve an optimal fermentation condition that would result in higher release of
phytochemicals and antioxidant (AO) capacity in the broth, Box-Behnken design integrating a desirability
approach was used. A second-order polynomial equation was developed, indicating the effect of solute ⁄ liquidratio, agitation rate and fermentation time on desired parameters. The optimised factors were used for
fermenting York cabbage to obtain maximum bacterial growth, LA, polyphenols and AO capacity. There
was �5 log cfu mL)1 increment in bacterial growth after fermentation, whereas LA production reached up
to 4.97 mg mL)1. Results showed that fermentation retains 95–98% and 90–95% of TPC and AO capacity,
respectively. During refrigerated storage (4 �C), the cell numbers, bioactive components and acidity were
maintained till 15-day storage.
Keywords Antioxidant capacity, HPLC, lactic acid bacteria, polyphenols, response surface methodology, York cabbage.
Introduction
There are several approaches applied in the foodindustry or home to render raw vegetable productspalatable and extending their shelf life while the originalsensory and nutritional properties are maintained asmuch as possible within the constraints put forward bymicrobial safety. Among the various processing options,lactic acid (LA) fermentation is considered as a valuableprocessing method for maintaining and improving thesafety, nutritional and sensory properties of vegetables(Buckenhuskes, 1997; Apas et al., 2008; Calo-Mataet al., 2008). In addition, there are reports that theapplication of lactic acid bacteria (LAB) as probioticshas proven to exert a range of health-promotingactivities such as immunomodulation, enhancement ofresistance against pathogens and reduction in bloodcholesterol levels (Heenan et al., 2002; de Vries et al.,2006).There is a wide range of vegetable-based fermented
products worldwide such as sauerkraut, cucumberpickles, olives; Egyptian pickled vegetables, kim-chi,Thai pak-sian-dong, Chinese hum-choy, Malaysianpickled vegetables and Malaysian tempoyak. A fewreports also have emphasised the fermentation of
Brassica vegetables and mainly focused on spontaneousfermentation of white cabbage and their antioxidant(AO) activity (Kusznierewicz et al., 2008; Sun et al.,2009; Martınez-Villaluenga et al., 2012).Growth and product formation during fermentation
by microorganisms can be affected by solid to liquidratio (S ⁄L ratio), agitation rate and fermentation time.Thus, it is important to optimise the different fermen-tation parameters to obtain maximum growth of LAB.The ‘one-at-a-time-approach’ that is frequently used toobtain high yields of the desired metabolic products in amicrobial system is extremely time-consuming when anumber of factors have to be optimised; and moreover,it disregards the complex interactions between variousphysiochemical parameters (Abdel-Fattah et al., 2005).Statistical experimental design is an efficient approach tofind out the optimal conditions for the targetedresponse. Response surface methodology (RSM) is acollection of mathematical and statistical techniques forsearching optimum conditions of factors for desirableresponses, and for evaluating the relative significance ofseveral affecting factors even in the presence of complexinteractions (Yin et al., 2010; Zhang & Mu, 2011).This work is part of an ongoing project to evaluate the
potential of Irish Brassica vegetables as a substrate forthe development of a probiotic-based product. However,because of the complexity of vegetables, a systematic*Correspondent: E-mail: [email protected]
International Journal of Food Science and Technology 2012 1
doi:10.1111/j.1365-2621.2012.03010.x
� 2012 Dublin Institute of Technology. International Journal of Food Science and Technology � 2012 Institute of Food Science and Technology
approach is needed to identify the factors, which wouldallow the growth of LAB initially so that these studiescan form a platform for the fermentation of vegetableslater with probiotic strains. The use of probiotic bacteriaas starter culture is not very common as this mightcompromise the potential health benefits of the probioticstrain and affect the technological suitability of thestrain. York cabbage (Green cabbage) was selected as amodel vegetable for this study owing to their abundancein Ireland, high polyphenolic content and AO capacity.This study was, therefore, aimed at optimisation of
LAB fermentation using York cabbage as a substrate.RSM was applied, and a nonlinear response surfacemodel was proposed for the optimisation of fermentedYork cabbage product with high LAB, LA content,TPC, TFC and AO capacity. Shelf life of the productwas also carried out by evaluating the cell viability, LAcontent, pH and phytochemical constituents.
Materials and methods
Plant materials and their preparation
Fresh Irish York cabbage was purchased from a localsupermarket in Dublin in January 2011. Fifteen to 18York cabbage heads (20–22 kg) were randomly selectedand trimmed off their outer leaves and stem. The headswere then divided into four segments, and the centralcore was removed. The segments were chopped into0.5 · 5–6 cm pieces, using a vegetable cutting machine.A pooled batch of about 15 kg cabbage was storedunder dark refrigerated conditions (4 �C) as the rawmaterial.
Culture and Inoculum preparation
Lactobacillus plantarum ATCC 8014 was purchasedfrom Medical Supply Company, Dublin, Ireland. Theculture was maintained at )70 �C in 20% glycerolstocks and grown in Man Rossa de Sharpe [MRS(Scharlau Chemie, Barcelona, Spain)] broth at 37 �C.For the preparation of the inoculum, 25 mL of sterileMRS broth was inoculated with 1 mL of thawed stockculture and incubated at 37 �C for 12–14 h. This wasthen serially diluted 100 times to obtain working culturecontaining 5–6 log CFU mL cells as determined byplate counts.
Fermentation based on Box-Behnken design (BBD)
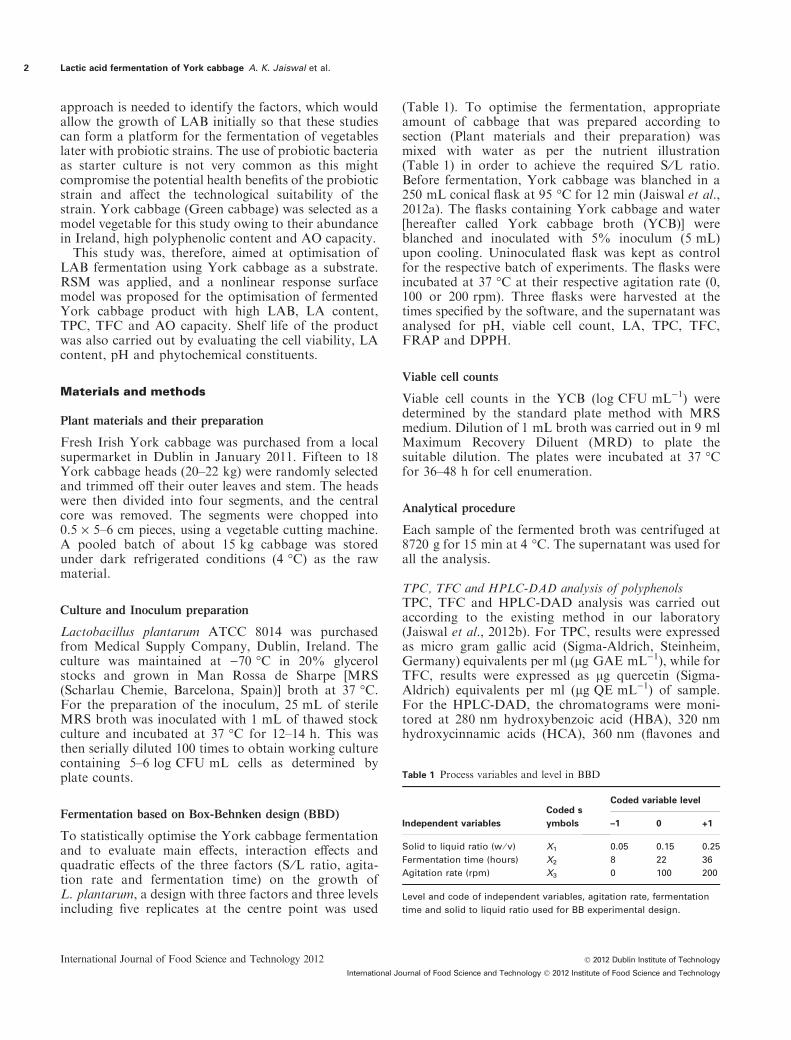
To statistically optimise the York cabbage fermentationand to evaluate main effects, interaction effects andquadratic effects of the three factors (S ⁄L ratio, agita-tion rate and fermentation time) on the growth ofL. plantarum, a design with three factors and three levelsincluding five replicates at the centre point was used
(Table 1). To optimise the fermentation, appropriateamount of cabbage that was prepared according tosection (Plant materials and their preparation) wasmixed with water as per the nutrient illustration(Table 1) in order to achieve the required S ⁄L ratio.Before fermentation, York cabbage was blanched in a250 mL conical flask at 95 �C for 12 min (Jaiswal et al.,2012a). The flasks containing York cabbage and water[hereafter called York cabbage broth (YCB)] wereblanched and inoculated with 5% inoculum (5 mL)upon cooling. Uninoculated flask was kept as controlfor the respective batch of experiments. The flasks wereincubated at 37 �C at their respective agitation rate (0,100 or 200 rpm). Three flasks were harvested at thetimes specified by the software, and the supernatant wasanalysed for pH, viable cell count, LA, TPC, TFC,FRAP and DPPH.
Viable cell counts
Viable cell counts in the YCB (log CFU mL)1) weredetermined by the standard plate method with MRSmedium. Dilution of 1 mL broth was carried out in 9 mlMaximum Recovery Diluent (MRD) to plate thesuitable dilution. The plates were incubated at 37 �Cfor 36–48 h for cell enumeration.
Analytical procedure
Each sample of the fermented broth was centrifuged at8720 g for 15 min at 4 �C. The supernatant was used forall the analysis.
TPC, TFC and HPLC-DAD analysis of polyphenolsTPC, TFC and HPLC-DAD analysis was carried outaccording to the existing method in our laboratory(Jaiswal et al., 2012b). For TPC, results were expressedas micro gram gallic acid (Sigma-Aldrich, Steinheim,Germany) equivalents per ml (lg GAE mL)1), while forTFC, results were expressed as lg quercetin (Sigma-Aldrich) equivalents per ml (lg QE mL)1) of sample.For the HPLC-DAD, the chromatograms were moni-tored at 280 nm hydroxybenzoic acid (HBA), 320 nmhydroxycinnamic acids (HCA), 360 nm (flavones and
Table 1 Process variables and level in BBD
Independent variables
Coded s
ymbols
Coded variable level
–1 0 +1
Solid to liquid ratio (w ⁄ v) X1 0.05 0.15 0.25
Fermentation time (hours) X2 8 22 36
Agitation rate (rpm) X3 0 100 200
Level and code of independent variables, agitation rate, fermentation
time and solid to liquid ratio used for BB experimental design.
Lactic acid fermentation of York cabbage A. K. Jaiswal et al.2
International Journal of Food Science and Technology 2012 � 2012 Dublin Institute of Technology
International Journal of Food Science and Technology � 2012 Institute of Food Science and Technology

flavonols) and 520 nm (anthocyanins); and completespectral data were recorded in the range of 220–600 nm.
Determination of individual sugars, total sugar content andorganic acidsTotal sugars in the centrifuged test samples wereestimated by the phenol-sulphuric acid method (duBoiset al., 1956). Analysis of organic acid and individualsugars was done on an Alliance HPLC (Waters, e2695Separation module) equipped with an auto sampler andcontroller with dual pump. The detection system con-sisted of a Waters-486 UV detector (210 nm) andWaters-410 differential refractometer connected in aseries. A 20 lL of sample was injected into a compart-ment set at 65 �C containing Rezex ROA-Organic acidH+(8%) (350 · 7.8 mm; Phenomenex, Cheshire, UK)column fitted with a guard column (50 · 7.8 mm;Phenomenex) at a flow rate of 0.6 mL min using0.005 m H2SO4 as the mobile phase. Respective stan-dards were used to identify and quantify sugars andorganic acids contents in the samples.
Antioxidant capacity analysisIn this study, two different methods [2,2-Diphenyl-1-picrylhydrazyl free radical scavenging capacity (DPPHRSC) and Ferric reducing AO potential (FRAP) assaywere used for the estimation of total AO capacity of thefermented YCB. The analysis was carried out asreported elsewhere (Rajauria et al., 2010). For theDPPH RSC, ascorbic acid was used as a referencecompound, and the results were expressed as microgram ascorbic acid equivalents per ml (lg AscE mL)1)YCB. Trolox (Sigma-Aldrich) was used as a standardfor FRAP assay, and the results were expressed as microgram Trolox equivalents per mL (lg TE mL)1) of YCB.
Statistical analysis
All the experiments were carried out in triplicate andreplicated twice unless stated. Results are expressed asmean values ± standard deviation (SD). Data from theBBD were subjected to a second-order multiple regres-sion analysis using least-squares regression to obtain theparameter estimated for the mathematical model. Theregression analysis and analysis of variance (anova)were carried out using the STATGRAPHICS CenturionXV. Values of P < 0.05 were considered as statisticallysignificant.
Results and Discussion
Before the statistical optimisation of different parame-ters, preliminary analysis was carried out with variousS ⁄L ratios and fermentation time, and on the basis ofthese results, 0.05–0.25% (w ⁄v) for S ⁄L ratio and(8–36 h) fermentation time was chosen to perform the
present factorial analysis. Results showed that both S ⁄Lratio and fermentation time had significant effects onbacterial growth and LA production. It was also evidentthat some other organic acids were also produced duringthe fermentation such as propionic acid and citric acid.It is worth remarking that the total sugar contentreduced continuously as the bacterial population in-creased with fermentation time, which ranging from25.00 to 56.45% after 8–36 h of fermentation. Amongthe individual sugars, glucose and fructose were tracedin the YCB. A concentration of 0.44 mg mL)1 glucosewas estimated at S ⁄L ratio of 0.05%, which increased to1.90 mg mL)1 as the S ⁄L ratio increased to 0.25%. Asimilar trend was observed for fructose, which increasedfrom 0.72 to 2.90 mg mL)1 as the S ⁄L ratio increasedfrom 0.05 to 0.25%. It was observed that fermentationled to a sharp depletion in the glucose level in YCB asthere was no glucose traced after 36 h of fermentation,whereas at 22 h fermentation, only S ⁄L ratio of 0.25showed traces of glucose (0.07 mg mL)1). A similartrend was also shown by fructose as after 22 h offermentation as S ⁄L ratio of 0.25% showed0.43 mg mL)1.Fermentation resulted in a slight reduction in the
TPC, TFC and AO capacity, but the change was notsignificant. Earlier studies have reported that strictlycontrolled fermentation by some isolated strains oflactic bacteria resulted in no change in the AO potencyof final sauerkraut compared to fresh vegetable (Tolo-nen et al., 2004). Nonetheless, the results obtained inthis study were encouraging as LAB grew well in theYCB and the phytochemical content, and AO capacitywas almost retained after fermentation.
Statistical optimisation
Effect of process variables on bacterial growthThe effect of all the studied factors on the growth ofL. plantarum is shown in Table 2. Experimental resultsfor L. plantarum growth were fitted to a full quadraticsecond-order polynomial equation by applying multipleregression analysis (Eqn 1).
þ 4:357 þ 24:975� X1 þ 0:193� X2 þ 0:0047
� X3 � 55:425� X21 � 0:1607� X1 � X2 � 0:0027
� X1 � X3 � 0:00215� X22 � 0:000042� X2
� X3 � 0:000014� X23
ð1Þwhen the values of X1–X3 were substituted in theaforementioned equation, the predicted log CFU mL)1
for L. plantarum was obtained. To determine thesignificance of different variables and their interactions,Pareto charts and P-values were used. The length of thebars is proportional to the absolute magnitude of the
Lactic acid fermentation of York cabbage A. K. Jaiswal et al. 3
� 2012 Dublin Institute of Technology International Journal of Food Science and Technology 2012
International Journal of Food Science and Technology � 2012 Institute of Food Science and Technology
estimated effects coefficients, while the dashed linerepresents the minimal magnitude of statistically signif-icant effects (95% of the confidence interval) withrespect to response. Pareto chart (Fig. 1a) shows thatamong the variables used in this study, X1 (S ⁄L ratio)and X2 (fermentation time) had significant effect onbacterial growth. The P-values also indicated theinteraction strength of each parameter. The smaller theP-values are, the bigger the significance of the corre-sponding coefficient. Corresponding P-values also sug-gest that these two parameters are significantly differentfrom zero at the 95.0% confidence level. Therefore, theycan act as limiting factors and a small variation will alterthe growth of L. plantarum to a considerable extent.The lack-of-fit test is designed to determine whether
the selected model is adequate to describe the observeddata, or whether a more complicated model should beused. The value of 0.0868 for lack of fit implies that itwas not significant comparing to the pure error and thatthe model equation was adequate for predicting theL. plantarum growth. The fitness of the model wasfurther confirmed by a satisfactory value of R2, whichwas calculated to be 0.966, indicating that 96.60% of thevariability in the response could be predicted bythe model. The adjusted R2 statistic was 92.23%. Thestandard error of the estimate is a measure of the accu-racy of predictions. The standard error of the estimateshows the SD of the residuals to be 0.154. Mean
absolute error (MAE) measures how close the predic-tions are to the eventual outcomes. The MAE of 0.136was the average value of the residuals.Furthermore, the predicted log CFU mL)1 by the
final quadratic model, along with the correspondingvalues observed, is given in Table 2. The agreementbetween the log CFU mL)1 predicted by the model andthe experimental data is very strong as shown by a highvalue of R2 (0.966). The three-dimensional responsesurfaces were generated to study the interaction betweenthe three factors tested and to visualise the combinedeffects of factors on the growth of LAB (not shown).The effect of interaction of the three components ongrowth of L. plantarum was tested by contour plots forall possible combinations of factors, keeping one factorconstant at a time. The interactions between thevariables can be inferred from the shapes of the contourplots (Yu et al., 2008). Circular contour plots indicatethat the interactions between the variables are negligible.In contrast, elliptical ones indicate the evidence of theinteractions. An increase in log cfu mL)1 was seen withan increase in the fermentation time and S ⁄L ratio up to36 h and 0.17, respectively. The response value becomesconstant with a further increase in the S ⁄L ratio.Similarly, contour plots between time and agitation(Fig. S1a) showed a positive effect on fermentation timeuntil 36 h, whereas there was no effect was seen as therate of agitation increased.
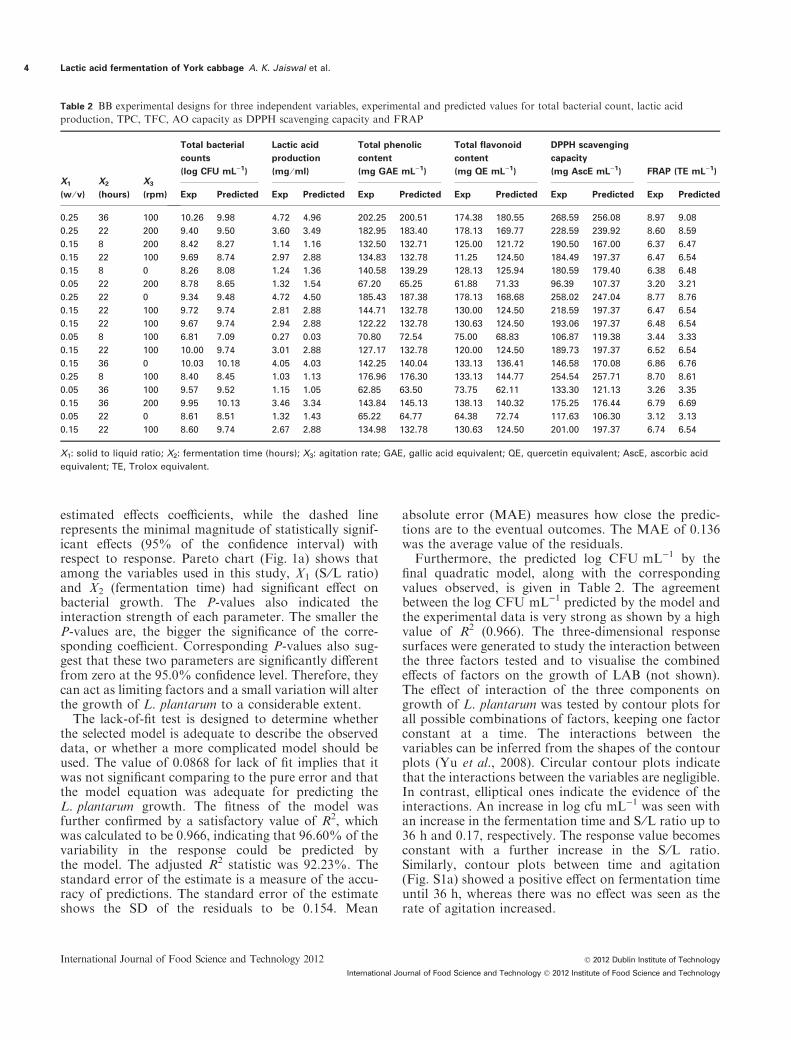
Table 2 BB experimental designs for three independent variables, experimental and predicted values for total bacterial count, lactic acid
production, TPC, TFC, AO capacity as DPPH scavenging capacity and FRAP
X1
(w ⁄ v)
X2
(hours)
X3
(rpm)
Total bacterial
counts
(log CFU mL)1)
Lactic acid
production
(mg ⁄ ml)
Total phenolic
content
(mg GAE mL)1)
Total flavonoid
content
(mg QE mL)1)
DPPH scavenging
capacity
(mg AscE mL)1) FRAP (TE mL)1)
Exp Predicted Exp Predicted Exp Predicted Exp Predicted Exp Predicted Exp Predicted
0.25 36 100 10.26 9.98 4.72 4.96 202.25 200.51 174.38 180.55 268.59 256.08 8.97 9.08
0.25 22 200 9.40 9.50 3.60 3.49 182.95 183.40 178.13 169.77 228.59 239.92 8.60 8.59
0.15 8 200 8.42 8.27 1.14 1.16 132.50 132.71 125.00 121.72 190.50 167.00 6.37 6.47
0.15 22 100 9.69 8.74 2.97 2.88 134.83 132.78 11.25 124.50 184.49 197.37 6.47 6.54
0.15 8 0 8.26 8.08 1.24 1.36 140.58 139.29 128.13 125.94 180.59 179.40 6.38 6.48
0.05 22 200 8.78 8.65 1.32 1.54 67.20 65.25 61.88 71.33 96.39 107.37 3.20 3.21
0.25 22 0 9.34 9.48 4.72 4.50 185.43 187.38 178.13 168.68 258.02 247.04 8.77 8.76
0.15 22 100 9.72 9.74 2.81 2.88 144.71 132.78 130.00 124.50 218.59 197.37 6.47 6.54
0.15 22 100 9.67 9.74 2.94 2.88 122.22 132.78 130.63 124.50 193.06 197.37 6.48 6.54
0.05 8 100 6.81 7.09 0.27 0.03 70.80 72.54 75.00 68.83 106.87 119.38 3.44 3.33
0.15 22 100 10.00 9.74 3.01 2.88 127.17 132.78 120.00 124.50 189.73 197.37 6.52 6.54
0.15 36 0 10.03 10.18 4.05 4.03 142.25 140.04 133.13 136.41 146.58 170.08 6.86 6.76
0.25 8 100 8.40 8.45 1.03 1.13 176.96 176.30 133.13 144.77 254.54 257.71 8.70 8.61
0.05 36 100 9.57 9.52 1.15 1.05 62.85 63.50 73.75 62.11 133.30 121.13 3.26 3.35
0.15 36 200 9.95 10.13 3.46 3.34 143.84 145.13 138.13 140.32 175.25 176.44 6.79 6.69
0.05 22 0 8.61 8.51 1.32 1.43 65.22 64.77 64.38 72.74 117.63 106.30 3.12 3.13
0.15 22 100 8.60 9.74 2.67 2.88 134.98 132.78 130.63 124.50 201.00 197.37 6.74 6.54
X1: solid to liquid ratio; X2: fermentation time (hours); X3: agitation rate; GAE, gallic acid equivalent; QE, quercetin equivalent; AscE, ascorbic acid
equivalent; TE, Trolox equivalent.
Lactic acid fermentation of York cabbage A. K. Jaiswal et al.4
International Journal of Food Science and Technology 2012 � 2012 Dublin Institute of Technology
International Journal of Food Science and Technology � 2012 Institute of Food Science and Technology

Effect of process variables on lactic acid productionThe second-order polynomial equation (Eqn 2) obtainedto predict the LA production is:
� 1:958þ 16:573� X1 þ 0:172� X2 � 0:0015
� X3 � 41:0� X21 þ 0:501� X1 � X1 � 0:028
� X1 � X1 � 0:0035� X21 � 0:001� X1 � X1
þ 0:001� X21
ð2Þ
A comparison of predicted and experimentally ob-tained values can be seen in Table 2. As can bevisualised from the Pareto chart, eight factors haveP-values <0.05, indicating that they are significantlydifferent from zero at the 95.0% confidence level. Thus,all the factors are important for the LA production anda small variation can alter the content. The value of0.0774 for lack of fit implies that it is not significantcomparing to the pure error and that the modelequation was adequate for predicting the LA. The R2
statistic indicates that the model as fitted explains98.78% of the variability in LA production. Theadjusted R2 statistic is 97.23%. The standard error ofthe estimate shows the SD of the residuals was 0.139.The MAE of 0.129 was the average value of theresiduals. The three-dimensional response surface alsoconfirms the interaction (elliptical-shaped contours)between the factors studied (Fig. S1b). An increase inLA production was seen with an increase in thefermentation time up to 36 h and S ⁄L ratio up to 0.25(not shown). Similarly, contour plots between time andagitation showed a positive effect of both these factorson log cfu mL)1 up to 36 h and 90 rpm, respectively.
Effect of process variables on phytochemical contentThe second-order polynomial equations for TPC (Eqn3) and TFC (Eqn 4) are the following:
þ 51:945þ 769:857� X1 � 1:917� X2 � 0:06995
� X3 � 957:975� X21 þ 5:936� X1 � X2 � 0:112
� X1 � X3 þ 0:0256� X22 þ 0:0017� X2 � X3
þ 0:0002� X23
ð3Þ
þ 52:55þ 626:3� X1 � 0:768� X2 � 0:174� X3
� 1045:0� X21 þ 7:589� X1 � X2 þ 0:063� X1
� X3 þ 0:001� X22 þ 0:001� X2 � X3 þ 0:001� X2
3
ð4Þ
Values of X1-X3 were substituted in the aforemen-tioned equation, and comparison of predicted andexperimentally obtained values is presented in Table 2.Corresponding Pareto chart for TPC (Fig. 1c) and TFC(not shown) showed that in both cases, only S ⁄L ratiohas significant (P > 0.05) influence on phytochemicals.P-value for lack of fit in the anova table was greater orequal to 0.05 (0.9657 for TPC and 0.1526 TFC), and themodel appeared adequate for the observed data at the95.0% confidence level. In the case of TPC, the R2
indicates that the model as fitted explains 98.96% of thevariability. The adjusted R2 was 97.63%. The standarderror of the estimate shows the SD of the residuals to be8.58, and the MAE of 2.64 is the average value of the
0 4 8 12 16 20Standardized effect
ACC:Agitation
BCCCABBBAA
A:S/L ratioB:Time
0 5 10 15 20 25 30Standardized effect
BCCCAC
C:AgitationAABBAB
B:TimeA:S/L ratio
0 4 8 12 16 20Standardized effect
ACC:Agitation
CCBCBB
B:TimeABAA
A:S/L ratio
(b)(a)
(c) (d)
0 3 6 9 12 15Standardized effect
B:TimeABAC
C:AgitationAABCBBCC
A:S/L ratio
+–
Figure 1 Pareto chart showing the effect of
solid to liquid ratio (w ⁄ v), agitation rate
(rpm) and fermentation time (h) on (a) bac-
terial counts, (b) lactic acid production, (c)
TPC, (d) DPPH scavenging capacity. Line
crossing the bar represents significant effect
(P < 0.05) of process parameters.
Lactic acid fermentation of York cabbage A. K. Jaiswal et al. 5
� 2012 Dublin Institute of Technology International Journal of Food Science and Technology 2012
International Journal of Food Science and Technology � 2012 Institute of Food Science and Technology

residuals. Results showed that increase in S ⁄L ratioincreased the TPC; whereas there was no effect of theother studied factors. While in the case of TFC, R2 andadjusted R2 were 95.34% and 89.34%, respectively. Thestandard error of the estimate shows the SD of theresiduals to be 8.68. The MAE of 6.92 was the averagevalue of the residuals. Three-dimensional contour plotsalso confirmed that there was no interaction betweenvariables and increase in S ⁄L ratio clearly had asignificant effect on the TPC (Fig. S1c) and similartrends observed for TFC (Fig. S1d).
Effect of process variables on AO capacityA quadratic second-order polynomial equation wasobtained for DPPH by applying multiple regressionanalysis (Eqn 5) and predicted polynomial model forDPPH:
þ 58:9048þ 820:072� X1 þ 0:962� X2 þ 0:315
� X3 � 343:679� X21 � 0:6038� X1 � X2
� 0:205� X1 � X3 � 0:027� X22 þ 0:0034
� X2 � X3 � 0:0019� X23
ð5Þ
A comparison of predicted and experimentally ob-tained values can be seen in Table 2. CorrespondingP-values showed (X1) (S ⁄L ratio) and (X3 · X3) (agita-tion · agitation) to be significant model terms withP-values <0.0001 and 0.0441, respectively, demonstrat-ing that the models were highly significant. The P-valueof 0.1003 implied that the lack of fit was insignificantrelative to the pure error owing to noise. The R2 whichwas 93.06% represented satisfactory correlation be-tween actual values and predicted ones. The adjusted R2
value was 84.15%. The standard error of the estimateshows the SD of the residuals to be 13.28. The MAE of11.36 was the average value of the residuals.The software generated the following regression
equation, which demonstrates the empirical relationshipbetween S ⁄L ratio, fermentation time and agitation formaximum FRAP value in terms of coded units:
þ 1:35669þ 43:1971� X1 � 0:0284082� X2
þ 0:00202071� X3 � 56:05� X 21 þ 0:0803571
� X1 � X2 � 0:006� X1 � X3 þ 0:0059693
� X 22 � 0:00001� X2 � X3 � 0:0001� X 2
3
ð6Þ
The anova of the quadratic regression models for allthe parameters showed that the three effects haveP-values<0.05, indicating that they were significantly differentfrom zero at the 95.0% confidence level. The R2 and
adjustedR2 values of themodelwere 99.78%and99.50%,respectively, and there was no significance in the lack of fit(P = 0.2488) in the model. The standard error of theestimate shows the SD of the residuals to be 0.115. TheMAE of 0.074 was the average value of the residuals.Because the P-value was>5.0%, there was no indicationof serial autocorrelation in the residuals at the 5.0%significance level. This indicated that the models could beused to predict responses. The quadratic models gener-ated for the system found the S ⁄L ratio to be significant(P < 0.05) for maximum FRAP. Pareto chart for DPPHscavenging capacity (Fig. 1e) and FRAP (not shown)confirmed that S ⁄L ratio has a linear effect on DPPHscavenging capacity and FRAP value. Response surfacecontour plots of DPPH scavenging capacity (Fig. S1e)and FRAP value (Fig. S1f) indicate that the significantinteractions between S ⁄L ratio and AO capacity, fermen-tation time and agitation were not significant factors.
Optimisation of the fermentation conditions
As the aim was to achieve higher bacterial growth, LAproduction, phytochemical content and AO capacity,the goal was set to ‘maximise’ with importance ‘5’. Thevalues of responses were converted to a desirabilityfunction. The desirability values of the minimum andmaximum yields were configured as 0 and 1, respec-tively. Applying the desirability function with all pre-selected goals for each factor gave the specific value forall responses, which are presented in Fig. 2. Theoptimised factors were as follows: fermentation time36 h, S ⁄L ratio 0.25 g mL)1 and agitation rate 100 rpm.The software optimised bacterial growth was9.98 cfu mL)1, LA production 4.97 mg mL)1, TPC200.50 lg GAE mL)1, TFC 180.51 lg QE mL)1 andAO capacity 256.05 lg AscE mL)1 (DPPH AO system)and 9.08 lg TE mL)1 (FRAP AO system).
0 0.05 0.1 0.15 0.2 0.25Solid to liquid ratio
0 10203040
Time0
0.20.40.60.8
1
Des
irabi
lity
Desirability0.00.10.20.30.40.50.60.70.80.91.0
Figure 2 Response surface plots representing the effect of solid ⁄ liquidratio (w ⁄ v), fermentation time (h) and agitation rate (rpm) on overall
desirability (high bacterial growth, lactic acid production, TPC, TFC,
DPPH scavenging capacity and FRAP). Agitation is constant at
100 rpm.
Lactic acid fermentation of York cabbage A. K. Jaiswal et al.6
International Journal of Food Science and Technology 2012 � 2012 Dublin Institute of Technology
International Journal of Food Science and Technology � 2012 Institute of Food Science and Technology

Finally, for their validation, duplicate confirmatoryexperiments were conducted using the optimised param-eters. Experimentally obtained values of bacterialgrowth, LA production, TPC, TFC, DPPH scavengingcapacity and FRAP value were 10.31 log cfu mL)1, 5.21mg mL)1, 209.5 lg GAE mL)1, 180.7 lg QE mL)1,232.3 lg AscE mL)1, 8.96 lg TE mL)1, respectively.There was �5 log cfu mL)1 increment in bacterialgrowth after fermentation. The growth of LAB in theYCB was comparable with the results obtained fromprevious workers in cabbage juice and other vegetables.Yoon et al. (2006) reported a maximum growth ofL. plantarum of 109 CFU mL)1 in cabbage juice. Gard-ner et al. (2001) reported 1010 cfu mL)1 growth ofmixed LAB in carrot, cabbage, beet and onion vegetablemixtures after 72 h of fermentation. The results areclosely related with the data obtained from optimisationanalysis, resulting in a very good agreement. Thedifference between the experimental and model pre-dicted values was <5% for all the six responses. Thisaffirms that the models developed are adequate forpredicting the responses. Therefore, BBD along with thedesirability function could be effectively used to opti-mise the S ⁄L ratio, fermentation time and agitation ratefor maximising the targeted responses.
Shelf life analysis
There was a complete absence of any Enterobacteria ormoulds in the fermented broth during the 30 days ofstorage. The stability of L. plantarum during storage wasmonitored, and a reduction of 2.14 ± 0.43 log cfu mL)1
was seen at the end of the 30-day storage. However, therewas no significant difference in the log cfu mL)1 up to15 days of storage and the cell numbers started decliningonly after that. These results indicated that L. plantarumwas capable of surviving for 15 days under high acidicconditions during storage at 4 �C. The LA contentremained constant for the first week after which a slightreduction of�5% was observed until 2 weeks. However,storage beyond 2 weeks resulted in a continuous reduc-tionwith the content significantly reducing (P < 0.05) by34.4%at the end of 30 days. Initially, the pHwas 3.49 andremained almost constant up to 2 weeks. A slight increasein the pH value was seen after third week, which was notsignificant (P > 0.05). Initially, the TPC and TFC valuewas 209.5 lg GAE mL)1, 180.7 lg QE mL)1, respec-tively. There was a slight reduction in the values after20 days, which were further retained for the next 10 daysof storage. No significant (P > 0.05) change in the AOcontent was observed upon the 30 day of storage.
Effect of fermentation on individual groups of polyphenols
The HBA derivatives was quantified at 280 nm andexpressed as gallic acid equivalents (GAE), HCA
derivatives at 320 nm and expressed as chlorogenic acidequivalents, and flavones and polymethoxylated flav-ones at 360 nm and expressed as rutin equivalents (RE).The chromatogram (Figure S2) showed that five peakswere identified as HBA derivatives, ten peaks as HCAderivatives, three peaks as flavones and two as poly-methoxy flavonoid. From the chromatogram, clearlythere was no significant effect of LA fermentation onindividual phenolic groups. Prior to fermentation, theconcentration of HBA, HCA, flavones and methoxylat-ed flavonoid was 26.48 ± 0.39 lg GAE mL)1, 32.04 ±0.46 lg QE mL)1, 13.94 ± 0.04 lg RE mL)1 and 0.99± 0.06 lg RE mL)1, respectively. This value remainedalmost constant during the fermentation as the concen-tration of different phenolic groups estimated was27.06 ± 0.66 lg GAE mL)1,32.87 ± 2.06 lg QE mL)1, 13.75 ± 1.09 lg RE mL)1,0.94 ± 0.03 lg RE mL)1 for HBA, HCA, flavones andmethoxylated flavonoid, respectively. The sum of all thephenolic groups before and after fermentation was73.45 ± 0.09 and 74.63 ± 2.53, respectively.
Conclusion
The results of the present study indicate that L. planta-rum grew well in YCB and there was �5 log cfu mL)1
increment in bacterial growth after 36 h of fermentation.S ⁄L ratio, agitation rate and fermentation time wereoptimised by RSM to achieve conditions that result inhigher release of phytochemicals and AO capacity in thefermented broth as well maximum bacterial growth andLA production. Application of RSM in optimisation ofLA fermentation helps in cutting down on time andresources for identifying the optimum value for differentfactors and allows better understanding of the interac-tion between the variables. HPLC analysis for thepolyphenols revealed that fermentation retains all thepolyphenols contents, which is a good indication for thefermented product development.
Acknowledgment
The authors would like to acknowledge funding fromthe Irish government under the Technological SectorResearch Scheme (Strand III) of the National Develop-ment Plan.
References
Abdel-Fattah, Y.R., Saeed, H.M., Gohar, Y.M. & El-Baz, M.A.(2005). Improved production of Pseudomonas aeruginosa uricase byoptimization of process parameters through statistical experimentaldesigns. Process Biochemistry, 40, 1707–1714.
Apas, A.L., Arena, M.E., Draksler, D. & Gonzalez, S.N. (2008).Utilization of sugarcane industrial residues as animal food andprobiotic medium. Journal of Bioscience and Bioengineering, 106,363–367.
Lactic acid fermentation of York cabbage A. K. Jaiswal et al. 7
� 2012 Dublin Institute of Technology International Journal of Food Science and Technology 2012
International Journal of Food Science and Technology � 2012 Institute of Food Science and Technology

duBois, M., Gilles, K.A., Hamilton, J.K., Rebers, P.A. & Smith, F.(1956). Colorimetric method for determination of sugars and relatedsubstances. Analytical Chemistry, 28, 350–356.
Buckenhuskes, H.J. (1997) Fermented vegetables. In: Food Microbi-ology: Fundamentals and Frontiers, 2nd edn (edited by P.D. Doyle,L.R. Beuchat & T.J. Montville). Pp. 595–609. Washington, DC:ASM Press.
Calo-Mata, P., Arlindo, S., Boehme, K., de Miguel, T., Pascoal, A. &Barros-Velazquez, J. (2008). Current applications and future trendsof Lactic acid bacteria and their bacteriocins for the biopreservationof aquatic food products. Food and Bioprocess Technology, 1, 43–63.
Gardner, N.J., Savard, T., Obermeier, P., Caldwell, G. & Champagne,C.P. (2001). Selection and characterization of mixed starter culturesfor lactic acid fermentation of carrot, cabbage, beet and onionvegetable mixtures. International Journal of Food Microbiology, 64,261–275.
Heenan, C.N., Adams, M.C., Hosken, R.W. & Fleet, G.H. (2002).Growth medium for culturing probiotic bacteria for applications invegetarian food products. LWT – Food Science and Technology, 35,171–176.
Jaiswal, A.K., Gupta, S. & Abu-Ghannam, N. (2012a). Kineticevaluation of color, texture, polyphenols and antioxidant capacity ofIrish York cabbage after blanching treatment. Food Chemistry, 131,63–72.
Jaiswal, A.K., Abu-Ghannam, N. & Gupta, S. (2012b). A comparativestudy on the polyphenolic content, antibacterial activity andantioxidant capacity of different solvent extracts of Brassica oleraceavegetables. International Journal of Food Science and Technology, 47,223–231.
Kusznierewicz, B., Smiechowska, A., Bartoszek, A. & Namiesnik, J.(2008). The effect of heating and fermenting on antioxidantproperties of white cabbage. Food Chemistry, 108, 853–861.
Martınez-Villaluenga, C., Penas, E., Sidro, B., Ullate, M., Frias, J. &Vidal-Valverde, C. (2012). White cabbage fermentation improvesascorbigen content, antioxidant and nitric oxide production inhib-itory activity in LPS-induced macrophages. LWT – Food Science andTechnology, 46, 77–83.
Rajauria, G., Jaiswal, A.K., Abu-Ghannam, N. & Gupta, S. (2010).Effect of hydrothermal processing on color, antioxidant and freeradical scavenging capacities of edible Irish brown seaweeds. Inter-national Journal of Food Science and Technology, 45, 2485–2493.
Sun, Y.P., Chou, C.C. & Yu, R.C. (2009). Antioxidant activity oflactic-fermented Chinese cabbage. Food Chemistry, 115, 912–917.
Tolonen, M., Rajaniemi, S., Pihlava, J.M., Johansson, T., Saris, P.E.J.& Ryhanen, E.L. (2004). Formation of nisin, plant-derived biomol-ecules and antimicrobial activity in starter culture fermentations ofsauerkraut. Food Microbiology, 21, 167–179.
de Vries, M.C., Vaughan, E.E., Kleerebezem, M. & de Vos, W.M.(2006). Lactobacillus plantarum-survival, functional and potential
probiotic properties in the human intestinal tract. InternationalDairy Journal, 16, 1018–1028.
Yin, H., Fan, G. & Gu, Z. (2010). Optimization of culture parametersof selenium-enriched yeast (Saccharomyces cerevisiae) by responsesurface methodology (RSM). LWT – Food Science and Technology,43, 666–669.
Yoon, K.Y., Woodams, E.E. & Hang, Y.D. (2006). Production ofprobiotic cabbage juice by lactic acid bacteria. Bioresource Tech-nology, 97, 1427–1430.
Yu, L., Lei, T., Ren, X., Pei, X. & Feng, Y. (2008). Response surfaceoptimization of l-(+)-lactic acid production using corn steep liquoras an alternative nitrogen source by Lactobacillus rhamnosusCGMCC 1466. Biochemical Engineering Journal, 39, 496–502.
Zhang, C. & Mu, T. (2011). Optimisation of pectin extraction fromsweet potato (Ipomoea batatas, Convolvulaceae) residues withdisodium phosphate solution by response surface method. Interna-tional Journal of Food Science and Technology, 46, 2274–2280.
Supporting Information
Additional Supporting Information may be found in theonline version of this article:Figure S1. Response surface plots representing the
effect of solid to liquid ratio (w ⁄v), fermentation time (h)and agitation rate (rpm) on (a) bacterial counts (b) lacticacid production (c) total phenolic content (TPC) (d)total flavonoid content (TFC) (e) DPPH scavengingcapacity (f) FRAP value. Agitation is constant at100 rpm.Figure S2. HPLC–DAD polyphenolic profiles at
280 nm for the fermented and unfermented (BlanchedYork cabbage) broth; (a) overlay spectra of fermentedand unfermented York cabbage, (b) insight showing 2–8 min of chromatogram and (c) insight showing 20–35 min of chromatogram. 1-hydroxybenzoic acid; 2-hydroxycinnamic acids; 3-flavones; 4-methoxylated fla-vonoid.Please note: Wiley-Blackwell are not responsible for
the content or functionality of any supporting materialssupplied by the authors. Any queries (other than missingmaterial) should be directed to the corresponding authorfor the article.
Lactic acid fermentation of York cabbage A. K. Jaiswal et al.8
International Journal of Food Science and Technology 2012 � 2012 Dublin Institute of Technology
International Journal of Food Science and Technology � 2012 Institute of Food Science and Technology