optimisation of amylase and xylanase addition depending on ... · optimisation of amylase and...
TRANSCRIPT

673
Optimisation of amylase and xylanase addition depending on white flour amylase activity Davor M. Lončar1, Vladimir S. Filipović2, Jelena S. Filipović3 1Superlab-manufacturing, sales and service of analytical equipment, Belgrade, Serbia 2University of Novi Sad, Faculty of Technology, Novi Sad, Serbia 3University of Novi Sad, Institute of food technology, Novi Sad, Serbia
Abstract In this study the effect of different quantities of added amylase to white wheat flourscharacterized with different activities of naturally existing amylases is tested. Responsesurface methodology is chosen to test the effects of main applied technological para-meters on bread quality responses. Independent variables are chosen to be: quantity ofadded amylase and bulk fermentation time, while analysed responses are: specific volume,grain structure, bulk fermentation. Bread quality responses are statistically significant,while predicted and observed responses correspond very well, which allows good predict-ion of bread quality parameters based on applied technological parameters and flour char-acteristics. Score analysis shows that optimum quantity of amylase addition regardingbread quality depends on the activity of naturally existing amylases. Optimal quantity of added xylanase in bread samples made from both flour types is 0.004%. Xylanase imp-roved properties of white wheat bread and the higher effect is experienced with flour thathas more active naturally existing amylases. Addition of amylase has statistically signific-antly increased a* values of crust. Addition of xylanase has statistically significantly dec-reased values of b* in comparison to the respective bread sample with only added amylase.
Keywords: flour amylase activity, fungal amylase, xylanase, bread characteristics.
SCIENTIFIC PAPER
UDC 664.641.12:664.644.5:66
Hem. Ind. 70 (6) 673–683 (2016)
doi: 10.2298/HEMIND150814004L
Available online at the Journal website: http://www.ache.org.rs/HI/
The supply of population with food products is closely related to climate conditions. Wheat bread is staple food in many countries. Wheat flour quality is significantly affected by temperature and amount of rain during grain growing season [1]. Baking perform-ance of wheat has been ascribed to the gluten proteins and starch. To accomplish better dough handling and uniform bread quality, common baker’s practice is using the additives that, among other constituents, contain enzymes. Starch and non-starch carbohydrate-hydrolysing enzymes are used in the bread making industry as bread improvers. The purpose of using enz-ymes such as amylases, lipases and xylanases in baking is to change the dough rheology, improve the quality of the final product and retard staling [2,3].
The baking industry began using enzymes in 1970s, and their use increased rapidly in 1980s and 1990s as new enzyme products were developed [4]. The most commonly used enzyme is α-amylase, but proteases and cellulases are also in practise. Xylanase has been introduced in 2000s owing to their potential effective-ness in bread making [5]. Microbial enzymes can be of great help to improve the consumers’ acceptance to
Correspondence: V. Filipović, University of Novi Sad, Faculty of Tech-nology; Bul. cara Lazara 1, 21000 Novi Sad, Serbia. E-mail: [email protected] Paper received: 14 August, 2015 Paper accepted: 14 January, 2016
bread with desirable properties and can be added as processing aids/additives which can be easily inact-ivated by the baking time-temperature treatment.
Amylases are enzymes that catalyse amylose and amylopectin in starch as well as starch derivatives such as dextrin and oligocarbohydrates. In wheat, two types of amylases can be active: α- and β-amylase. Endo-amylase or α-amylase catalyses hydrolysis in random manner in the interior of starch molecule. This action causes the formation of linear and branched oligo-saccharides of various chain lengths and helps forming dextrin and maltose. In healthy and non-sprouted wheat grains the α-amylase is negligible in activity. Exo-amylase or β-amylase acts from non-reducing end of the polysaccharide chain cleaving maltose residues [6] and, contrary to α-amylase, it is active both in healthy and damaged wheat β-amylase [7] but its activity differs. It is mostly dependent on wheat cultivar, weather conditions during growing season, wheat dis-eases and sprouting. The ratio of α- and β-amylase activity influences the quality of bread. The excess of α- against β-amylase leads to the formation of sticky dough and dark coloured bread. In bread making the general point of adding amylases to flour was to gen-erate fermentable compounds, mainly maltose, in case amylase activity is low [7], but amylases have been used for improving dough-handling properties and enhancing bread quality [8,2]. Moreno-Ancillo et al. [9]

D.M. LONČAR et al.: AMYLASE AND XYLANASE ADDITION FOR WHITE FLOUR AMYLASE ACTIVITY Hem. ind. 70 (6) 673–683 (2016)
674
recognized α-amylase as aeroallergen in exposed workers. Twenty years ago, Vanhanen et al. [4] con-firmed that industrial enzymes in baking used as addi-tives in powdered form pose a risk of sensitisation.
In baking, xylanase transforms water-insoluble hemicellulose into soluble form, which binds water in the dough, therefore decreasing dough firmness, imp-roving dough handling properties and enhancing bread quality [10,11]. The improved handling properties and stability of the dough are obtained by xylanase action on both soluble and insoluble hemicellulose molecules in flour, whereby improving the elasticity of gluten network, crumb structure and bread volume. These can be used for all types of bread as an alternative to, or in combination with, emulsifiers. It is worth stressing that these enzymes may also contribute to eliminating the use of chemical additives such as bromates which have been banned by most of countries [12,13]. It is also reported that, depending on the origin, xylanases act differently [14]. Thus xylanase from: Thermotoga mari-time Aspergillus niger var awamori has been found to improve the specific volume and crumb structure; Aspergillus foetidus has remarkable influence in water absorption, i.e. less water was needed for xylanase sup-plemented dough that had similar consistency without stickiness; and Thermomyces lauginosus CAU44 was recognized to increase moisture content of fresh bread [12]. Similar influence in bread making was experienced with recombinant xylanase XYNYG. Zhan et al. [13] also pointed at the proper concentration of xylanase. More authors, such as Butt et al. [12], Diaconescu et al. [3] and Kaltsa et al. [2] experienced that synergistic effects of xylanase with other enzyme provide better results as compared to its sole use.
As there is not much evidence about optimum amylase quantity in relation to flour enzyme activity, the main purpose of this study is to: estimate the effect of different quantities of added amylase to white wheat fours characterized with different activities of naturally existing amylases on bulk fermentation and selected parameters of bread quality (specific volume, grain structure, crumb firmness and crust colour); to propose mathematical models of dependence of sel-ected bread quality parameters and technological para-meters; and to test synergistic effects of different quantities of xylanase with amylase at optimum com-bination of used technological parameters for quantity of added amylase and bulk fermentation time.
MATERIAL AND METHODS
Materials The following ingredients were used in bread pre-
paration:
Two samples of commercial white flour with dif-ferent amylase activity and gluten quality were sup-plied by local millers representing typical differences in flour quality that crop season. Flour 1 (from “Danubius” Novi Sad, Serbia) is characterized with: ash 0.50% d.m., farinograph absorption 59.2%, ekstensograph area 97 cm2, amylograph peak viscosity 685 AU, total and pre-existing reducing sugars 1.77 and 0.48% d.m., respect-ively. Flour 2 (from “Fidelinka” Subotica, Serbia) is char-acterized with: ash 0.52% d.m., farinograph absorption 57.2%, ekstensograph area 64 cm2, amylograph peak viscosity 365 AU, total and preexisting reducing sugars 2.71 and 0.59% d.m., respectively. Baker’s yeast (com-pressed) commercial product, “Fermin” Senta, Serbia. Salt, commercial product. VERON M4 – fungal α-amyl-ase from Aspergillus oryzae, supplied from ABF ingre-dients, AB Enzymes, Germany, declared enzyme activity 1728 AZ/g. VERON 292 – xylanase from Aspergillus niger, supplied from ABF ingredients, AB Enzymes, Ger-many, declared enzyme activity min 1701 XylH/g.
Methods Ash and dough rheology (farinogramm, ekstenso-
gramm and amylogramm) were determined in accord-ance with national Regulations on the physical and chemical methods of analysis for quality control of grain, milling and bakery products, pasta and deep fro-zen dough [15].
Reducing sugars expressed as maltose content (total and pre-existing) were determined according to Berliner and Schmidt method cited in national Regul-ations [15]: flour is 60 min extracted with water (flour:water ratio = 1:10) in rotating thermostat at 27 °Ϲ, amylases are inactivated with concentrated sulfuric acid, then filtered. To 15 ml of filtrate 5 ml of sodium hydroxide solution (1.0 mol/l) is added, than boiled exactly 5 min and rapidly cooled. Color is determined by spectrophotometer (Minolta Chroma Meter (Chroma meter CR-400, Konica, Minolta, Tokyo, Japan)). The int-ensity of color is indicating the quantity of reducing sugars, i.e., maltose generated by active amylases. From calibration curve made with different quantities of maltose, content of reducing sugars, expressed as maltose, can be determined. In case of pre-existing reducing sugars determination, at the moment of adding water to the flour sample, activity of naturally existing amylases is inactivated with certain amount of sulfuric acid. The difference between total and pre-existing reducing sugars point at the activity of natur-ally exiting amylases in flour.
Bread making formula: tin bread was prepared using 100 g of flour and straight dough method in accordance with AACC method [16], with the exception of bulk fermentation duration which was 20, 40 or 60 min. The formulation of the loaf used in this study inc-luded: 100% flour, 2.0% yeast, 2.0% salt and water

D.M. LONČAR et al.: AMYLASE AND XYLANASE ADDITION FOR WHITE FLOUR AMYLASE ACTIVITY Hem. ind. 70 (6) 673–683 (2016)
675
according to farinograph absorption. The enzymes were added to the formulation at following levels: amylase 0 (control), 1 and 2 g/100 kg flour, i.e., 0, 0.001 and 0.002% and xylanase 0, 3, 4 and 5 g/100 kg flour, i.e., 0, 0.003, 0.004 and 0.005%. Bread was baked approximately 20 min in Chopin laboratory oven at 240 °Ϲ, until the mass of baked bread ranged between 135 and 137 g.
Bread quality evaluation The quality of bread was characterized by specific
volume, grain structure, crumb firmness quality and crust colour.
Specific volume. The specific volume of bread was determined 24 h after baking using the millet seed dis-placement method in triplicate. The specific volume was calculated by dividing the bread volume (ml) by its mass (g) according to AACC method 50-55 [16].
Grain structure. This parameter was sensory eval-uated by a panel of 10 trained panelists. Panelists scored bread crumb elasticity with scores from 0.0 (not acceptable) to 4.5 (the best) and grain structure from 0.0 (not acceptable) to 2.5 (the best). Presented num-erical value is the sum of mentioned scores: the lowest value is 0.0 and the highest 7.0.
Crumb firmness. Bread crumb firmness measure-ments were made with a texture analyser (TA-XT2, Stable Micro Systems, England). The parameters used in the instrumental texture analysis were: slices (25 mm thickness) were compressed to 6 mm using a 35 mm diameter aluminium plunger with a 5 kg load cell. The rate of compression was 1.7 mm s–1. The com-pression curves (distance vs. force) were plotted and the force readings (in Newton) at 25% compression were taken as a measure of firmness in accordance with AACC method 74-09 [16]. Two slices were ana-lysed from each loaf.
Colour measurement. The crust colour of bread was measured by the Minolta Chroma Meter (CR-300). The results were recorded by a*, b* and L* at three differ-ent points on bread crust.
Statistical analysis Response surface methodology (RSM) was selected
to estimate the main effect of quantity of added amyl-ase and bulk fermentation time on bread quality para-meters. The accepted experimental design was accord-ing to Box and Behnken’s [17] full factorial design. The independent variables were the quantity of added amylase (X1) (0%; 0.001 and 0.002%) and bulk ferment-ation time (X2) (20, 40 and 60 min). The dependent variables observed were the responses: specific volume (ml/(g/g)), Y1, grain structure, Y2, and crumb firmness (g), Y3. A model was fitted to the response surface generated by the experiment. The model used was function of the variables:
Yk= fk (Quantity of added amylase, Bulk fermentation time) (1)
The following second order polynomial (SOP) model was fitted to the data. Two models of the following form were developed to relate three responses (Y) to two process variables (X):
2 22
0 12 1 21 1
k k ki i kii i ki i
Y X X X Xβ β β β= =
= + + + , k = 1–3 (2)
where: βkn are constant regression coefficients; Y, specific volume, grain structure or Crumb firmness; X1, quantity of added amylase and X2, bulk fermentation time.
Analysis of variance (ANOVA) and RSM were per-formed using StatSoft Statistica program for Windows, ver. 10 [18]. The model was obtained for each depen-dent variable (or response) where factors were rejected when their significance level was less than 95%.
Score analysis Score analysis uses min-max normalisation of bread
quality responses and transfer them from their unit system in new dimensionless system which allows further mathematical calculation of different types of responses [19]. Maximum value of normalised score present optimum values of responses (specific volume, grain structure and crumb firmness), and points to opti-mum combination of used technological parameters of quantity of added amylase and bulk fermentation time.
( )( )
min1
max min
Specific volume Specific volumeSpecific volume Specific volume
iiS
−=
− (3)
( )( )
min2
max min
Grain structure Grain structureGrain structure Grain structure
iiS
−=
− (4)
( )( )
min3
max min
Crumb firmness Crumb firmness1
Crumb firmness Crumb firmnessi
iS−
= −−
(5)
( )1 2 3
3i i i
iS S S
S + += (6)
[ ]max optimumiS → (7)
RESULTS AND DISCUSSION
In Table 1 mean values and standard deviations of the parameters of bread quality (specific volume, grain structure and crumb firmness) made from flour 1 and flour 2 as responses of the variation of quantity of amylases addition and bulk fermentation time are shown. Quantity of amylases ranged from 0 to 0.002%, while bulk fermentation time ranged from 20 to 60 min.

D.M. LONČAR et al.: AMYLASE AND XYLANASE ADDITION FOR WHITE FLOUR AMYLASE ACTIVITY Hem. ind. 70 (6) 673–683 (2016)
676
The highest values of specific volume (4.37±0.05 ml/g) and grain structure (5.6±0.09) were achieved in bread samples made from flour 1 with the highest quantity of added amylase (0.002%) and the shortest time of bulk fermentation (20 min). That bread sample also had lowest value of crumb firmness (110.91±17.12 g), Table 1. These data are highlighting the statistically significantly positive contribution of added amylase in case wheat flour is characterized with lower or opti-mum amylase activity (peak viscosity in optimum range and the small difference between total and pre-existing sugars, 450–690 AU and 0.48, respectively [7]). How-ever, in samples of bread made from flour 2 (Table 1), which is characterized with higher amylase activity, the highest values of specific volume (4.66±0.03 ml/g) and grain structure (5.4±0.05) were achieved in bread samples with the quantity of added amylase of 0.001% and longest time of bulk fermentation (60 min). These data clearly indicate that if amylase activity of flour is high, quantity of added amylase need to be tested. The lowest value of crumb firmness (137.59±19.19 g) was achieved in bread sample of the same added quantity of amylase and the shortest time of bulk fermentation (20 min).
Table 2 shows the results of ANOVA of the RSM models which were developed on the basis of the expe-rimental results provided in Table 1. In the method,
SOP in form of Eq. (2), for the prediction of the function (1) was used.
In bread samples made from flours 1 and 2 values of specific volume were statistically significantly influ-enced by both varied parameters, where the quantity of added amylase was the more influential than bulk fermentation time, thus pointing at the importance of long term supply of fermentable sugars to the yeasts during bread making process [7].
Both SOP linear terms, for quantity of added amyl-ase and bulk fermentation time statistically significantly contributed to the forming of the model in both bread samples. Both quadratic terms and cross product were not statistically significant in bread samples made from flour 1. However, in bread samples made from flour 2 quadratic term quantity of added amylase, statistically significantly contributed also to the forming of the model. Other quadratic term for bulk fermentation time and cross product were not statistically significant. Residual variance was not statistically significant in both samples, indicating that applied mathematical model of dependence of specific volume from quantity of added amylase and bulk fermentation time was adequate, where also high level of determination coef-ficients R2 of 0.9905 and 0.9852 indicated on good fit of SOP model with measured experimental values.
ANOVA test showed that values of grain structure for samples made from flours 1 and 2 were statistically
Table 1. The effect of amylase addition on bread quality made from Flour 1 and Flour 2; different letters in the superscript in the same column of the table indicate on statistical significant difference between values at the level of significance of p < 0.05 (based on post-hoc Fisher LSD test)
Sample Bulk fermentation time, min Specific volume, ml/g Grain structure Crumb firmness, g Flour 1
Control, 0% of amylase addition
20 4.15±0.05a 4.1±0.10a 145.10±34.10a
40 4.05±0.04b 3.7±0.07b 183.72±20.88b
60 3.93±0.02c 3.6±0.08b 261.53±30.22c
With 0.001% of amylase addition
20 4.24±0.06d 5.0±0.03c 128.54±19.98a
40 4.12±0.05ae 4.6±0.04d 152.12±31.03ab
60 4.08±0.03be 4.2±0.07a 155.37±29.20ab
With 0.002% of amylase addition
20 4.37±0.05f 5.6±0.09e 110.91±17.12c
40 4.26±0.01d 4.8±0.08f 128.64±10.20b
60 4.20±0.04ad 5.0±0.05c 149.29±19.63ab
Flour 2 Control, 0% of amylase addition
20 4.15±0.05a 4.1±0.05a 245.30±34.40c
40 4.30±0.01dg 4.8±0.07f 193.90±22.18b 60 4.35±0.04fg 5.2±0.10g 149.52±15.93ab
With 0.001% of amylase addition
20 4.51±0.01h 5.2±0.09g 137.59±19.19a
40 4.55±0.05h 5.3±0.07gh 140.19±17.17a 60 4.66±0.03i 5.4±0.05h 141.38±18.90a
With 0.002% of amylase addition
20 4.49±0.05h 4.9±0.07cf 150.45±20.10ab
40 4.50±0.04h 5.1±0.06cg 143.28±18.13a 60 4.55±0.03h 4.8±0.09f 141.30±15.92a

D.M. LONČAR et al.: AMYLASE AND XYLANASE ADDITION FOR WHITE FLOUR AMYLASE ACTIVITY Hem. ind. 70 (6) 673–683 (2016)
677
significantly influenced by both technological para-meters, with the same levels of significance as in the case of specific volume. As in the case of the response of specific volume both SOP linear terms, for quantity of added amylase and bulk fermentation time statis-tically significantly contributed to the forming of the model. All other terms of the SOP were not statistically significant for samples from flour 1. At samples made from flour 2 quadratic term for quantity of added amyl-ase, linear term for bulk fermentation time, as well as, the cross product statistically significantly contributed to the forming of the model. Insignificant residual vari-ance, with high value of R2 of 0.9691 and 0.9586 indi-cated on good fit of the proposed mathematical model for Grain structure with experimental data.
Testing the response of crumb firmness showed that both technological parameters statistically insig-nificantly affected values of crumb firmness. The same as in two previous cases in samples made from flour 1, both SOP linear terms, statistically significantly con-tributed to the forming of the model, while other terms were not statistically significant. Quantity of added amylase statistically insignificantly affected values of
crumb firmness, while bulk fermentation time statis-tically insignificantly affected values of crumb firmness in control sample (with no added quantity of amylase). SOP linear term for quantity of added amylase statis-tically significantly contributed to the forming of the model, while other terms were not statistically signific-ant. As with the previous responses, in both bread samples residual variance was not significant and together with high enough R2 of 0.9262 and 0.8989 point at good fit of proposed model for crumb firmness with experimental data.
Regression coefficients of SOP models for the three responses of the bread quality made from flours 1 and 2, with indicated statistical significance of each coeffici-ent are shown in table 3.
Figures 1a–c and 2a–c show graphical presentation of SOP Eq. (5), for the results presented in Table 3. From these graphics, trends of the influence of varied parameters of quantity of added amylase and bulk fermentation time on specific volume, grain structure and crumb firmness can be observed. In the case of the bread samples made from flour 1 the increase of quan-tity of added amylase increased values of specific
Table 2. Analysis of variance of the responses of the bread quality made from flours 1 and 2; *statistically significant at level of significance of p < 0.05; nsnot statistically significant; df1 – degrees of freedom
Term Technological parameters df1 Sum of squares for Flour 1 Sum of squares for Flour 2 Specific
volume, ml/g Grain
structure Crumb
firmness, gSpecific
volume, ml/g Grain
structure Crumb
firmness, gQuadratic Quantity of added
amylase 1 0.000356ns 0.035556ns 637.60ns 0.067222* 0.467222* 1910.24ns
Bulk fermentation time 1 0.000672ns 0.093889ns 26.35ns 0.000006ns 0.035556ns 6.48ns Linear Quantity of added
amylase 1 0.081667* 2.666667* 6767.71* 0.091267* 0.081667ns 3936.77*
Bulk fermentation time 1 0.050417* 0.601667* 5498.85* 0.028017* 0.240000* 1704.88ns Cross product Quantity of added
amylase, bulk fermentation time
1 0.000625ns 0.002500ns 1522.95ns 0.004900ns 0.360000* 1876.19ns
Error Residual variance 3 0.001286ns 0.108611ns 1152.54ns 0.002878ns 0.051111ns 1061.43ns Total sum of squares 8 0.135022 3.508889 15606.01 0.194289 1.235556 10495.99
R2 0.9905 0.9691 0.9262 0.9852 0.9586 0.8989
Table 3. Regression coefficients of SOP models for three responses of the bread quality made from flours 1 and 2; *statistically significant at level of significance of p < 0.05; nsnot statistically significant
Coef-ficient
Flour 1 Flour 2 Y1
(Specific volume) Y2
(Grain structure) Y3
(Crumb firmness) Y1
(Specific volume)Y2
(Grain structure) Y3
(Crumb firmness) β0 4.31* 5* 109ns 4* 3* 279* β11 13333.33ns –133333ns 17855000ns –183333* –483333* 30905000ns β22 0,00ns 0ns 0ns 0ns –0ns 0ns β1 65.00ns 983ns –30270ns 560* 1683* –130740* β2 –0.01ns –0ns 2ns 0ns 0ns –2ns β12 0.62ns –1ns –976ns –2ns –15* 1083ns

D.M. LONČAR et al.: AMYLASE AND XYLANASE ADDITION FOR WHITE FLOUR AMYLASE ACTIVITY Hem. ind. 70 (6) 673–683 (2016)
678
volume and grain structure while decreasing values of crumb firmness. The highest values of specific volume and grain structure and the lowest values of crumb firmness were obtained at the shortest durations of bulk fermentation (Figure 1). For bread samples made from flour 2 the highest values of specific volume and grain structure and the lowest values of crumb firm-ness were obtained at the longest durations of bulk fer-mentation and addition of lower concentration of amylase (0.001%), Figure 2a–c.
Score analysis is also applied for optimisation of the varied applied parameters of quantity of added amyl-ase and bulk fermentation time. On Figure 3 score values of bread quality responses in dependence of varied quantity of added amylase and bulk ferment-ation time are shown. Maximum obtained score value for bread samples made from flour 1, are experienced with maximum addition of amylase during the shortest period of bulk fermentation. In case of bread samples made from flour 2, maximum score values, or optimum bread quality was obtained with lower addition of
amylase during the longest period of bulk ferment-ation. These data are experimental data are consistent with Kaltsa et al. [2] who stated that appropriate levels of fungal α-amylase improve the crumb structure and texture.
In the Table 4 mean values and standard deviations of bread quality parameters, made from flours 1 and 2, respectively, using optimum set of technological para-meters derived from Figure 3a (0.002% amylase addi-tion) and b (0.001% amylase addition), as responses of the variation of quantity of xylanase addition, are shown. Quantity of xylanases ranged from 0.003 to 0.005%.
Xylanase addition statistically significantly increased specific volume, where bread sample with the highest obtained value of 4.88±0.07 and 4.95±0.09 ml/g were the one with 0.004% of xylanase addition. Data are consistent with results of more authors: Butt et al. [12], Jaekel et al. [10], Ciocan-Andronic and Constantinescu [11].
a) b)
c) Figure 1. Response surface plot of quantity of added amylase and Bulk fermentation time on: a) specific volume,
b) grain structure and c) crumb firmness, of the bread samples made from flour 1.

D.M. LONČAR et al.: AMYLASE AND XYLANASE ADDITION FOR WHITE FLOUR AMYLASE ACTIVITY Hem. ind. 70 (6) 673–683 (2016)
679
a) b)
c) Figure 2. Response surface plot of guantity of added amylase and bulk fermentation time on: a) specific volume, b) grain structure and c)
crumb firmness, of the bread samples made from flour 2.
a) b)
Figure 3. Contour plots of score values of bread quality responses in dependence of varied quantity of added amylase and bulk
fermentation time for bread samples made from: a) flour 1 and b) flour 2.
D.M. LONČAR et al.: AMYLASE AND XYLANASE ADDITION FOR WHITE FLOUR AMYLASE ACTIVITY Hem. ind. 70 (6) 673–683 (2016)
680
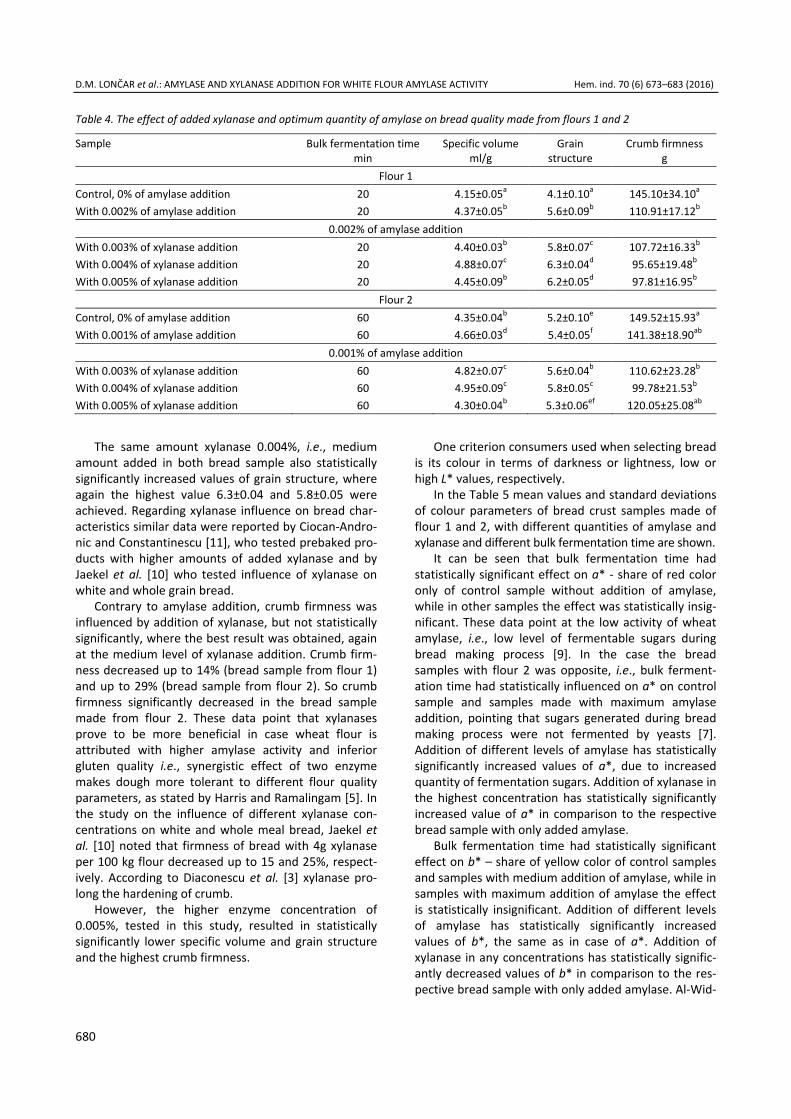
Table 4. The effect of added xylanase and optimum quantity of amylase on bread quality made from flours 1 and 2
Sample Bulk fermentation time min
Specific volumeml/g
Grain structure
Crumb firmness g
Flour 1 Control, 0% of amylase addition 20 4.15±0.05a 4.1±0.10a 145.10±34.10a
With 0.002% of amylase addition 20 4.37±0.05b 5.6±0.09b 110.91±17.12b
0.002% of amylase additionWith 0.003% of xylanase addition 20 4.40±0.03b 5.8±0.07c 107.72±16.33b With 0.004% of xylanase addition 20 4.88±0.07c 6.3±0.04d 95.65±19.48b With 0.005% of xylanase addition 20 4.45±0.09b 6.2±0.05d 97.81±16.95b
Flour 2 Control, 0% of amylase addition 60 4.35±0.04b 5.2±0.10e 149.52±15.93a
With 0.001% of amylase addition 60 4.66±0.03d 5.4±0.05f 141.38±18.90ab
0.001% of amylase addition With 0.003% of xylanase addition 60 4.82±0.07c 5.6±0.04b 110.62±23.28b With 0.004% of xylanase addition 60 4.95±0.09c 5.8±0.05c 99.78±21.53b With 0.005% of xylanase addition 60 4.30±0.04b 5.3±0.06ef 120.05±25.08ab
The same amount xylanase 0.004%, i.e., medium
amount added in both bread sample also statistically significantly increased values of grain structure, where again the highest value 6.3±0.04 and 5.8±0.05 were achieved. Regarding xylanase influence on bread char-acteristics similar data were reported by Ciocan-Andro-nic and Constantinescu [11], who tested prebaked pro-ducts with higher amounts of added xylanase and by Jaekel et al. [10] who tested influence of xylanase on white and whole grain bread.
Contrary to amylase addition, crumb firmness was influenced by addition of xylanase, but not statistically significantly, where the best result was obtained, again at the medium level of xylanase addition. Crumb firm-ness decreased up to 14% (bread sample from flour 1) and up to 29% (bread sample from flour 2). So crumb firmness significantly decreased in the bread sample made from flour 2. These data point that xylanases prove to be more beneficial in case wheat flour is attributed with higher amylase activity and inferior gluten quality i.e., synergistic effect of two enzyme makes dough more tolerant to different flour quality parameters, as stated by Harris and Ramalingam [5]. In the study on the influence of different xylanase con-centrations on white and whole meal bread, Jaekel et al. [10] noted that firmness of bread with 4g xylanase per 100 kg flour decreased up to 15 and 25%, respect-ively. According to Diaconescu et al. [3] xylanase pro-long the hardening of crumb.
However, the higher enzyme concentration of 0.005%, tested in this study, resulted in statistically significantly lower specific volume and grain structure and the highest crumb firmness.
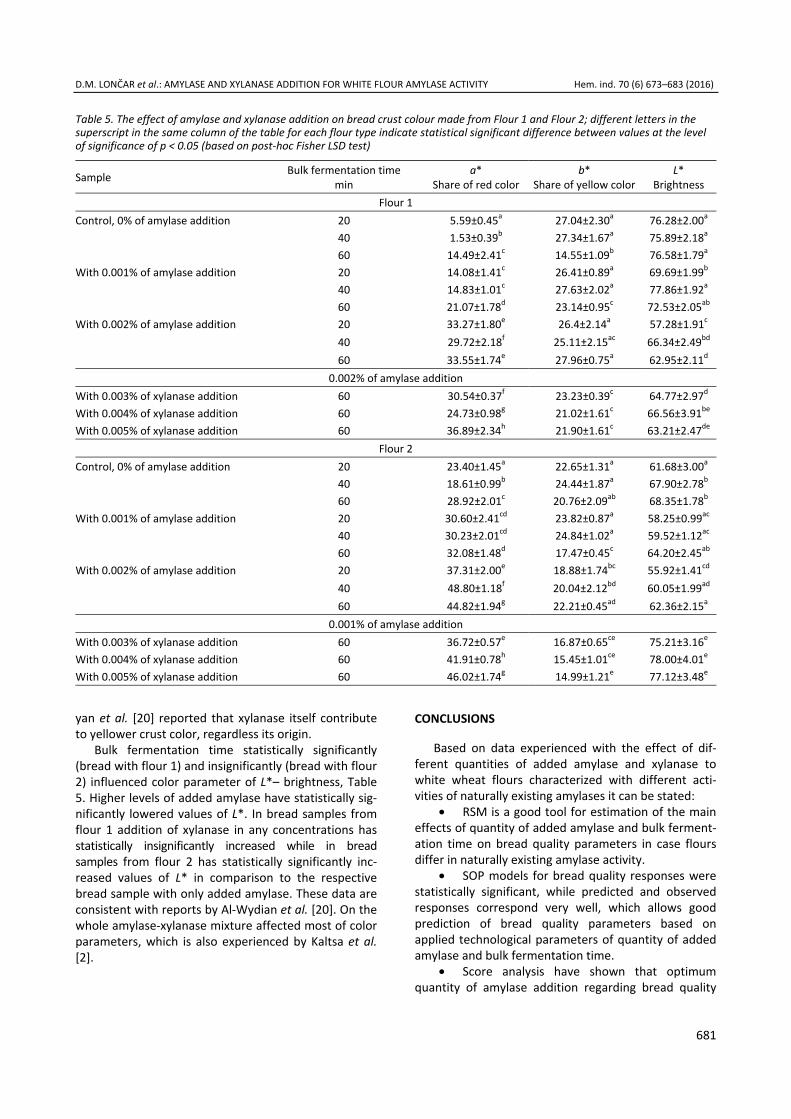
One criterion consumers used when selecting bread is its colour in terms of darkness or lightness, low or high L* values, respectively.
In the Table 5 mean values and standard deviations of colour parameters of bread crust samples made of flour 1 and 2, with different quantities of amylase and xylanase and different bulk fermentation time are shown.
It can be seen that bulk fermentation time had statistically significant effect on a* - share of red color only of control sample without addition of amylase, while in other samples the effect was statistically insig-nificant. These data point at the low activity of wheat amylase, i.e., low level of fermentable sugars during bread making process [9]. In the case the bread samples with flour 2 was opposite, i.e., bulk ferment-ation time had statistically influenced on a* on control sample and samples made with maximum amylase addition, pointing that sugars generated during bread making process were not fermented by yeasts [7]. Addition of different levels of amylase has statistically significantly increased values of a*, due to increased quantity of fermentation sugars. Addition of xylanase in the highest concentration has statistically significantly increased value of a* in comparison to the respective bread sample with only added amylase.
Bulk fermentation time had statistically significant effect on b* – share of yellow color of control samples and samples with medium addition of amylase, while in samples with maximum addition of amylase the effect is statistically insignificant. Addition of different levels of amylase has statistically significantly increased values of b*, the same as in case of a*. Addition of xylanase in any concentrations has statistically signific-antly decreased values of b* in comparison to the res-pective bread sample with only added amylase. Al-Wid-
D.M. LONČAR et al.: AMYLASE AND XYLANASE ADDITION FOR WHITE FLOUR AMYLASE ACTIVITY Hem. ind. 70 (6) 673–683 (2016)
681
yan et al. [20] reported that xylanase itself contribute to yellower crust color, regardless its origin.
Bulk fermentation time statistically significantly (bread with flour 1) and insignificantly (bread with flour 2) influenced color parameter of L*– brightness, Table 5. Higher levels of added amylase have statistically sig-nificantly lowered values of L*. In bread samples from flour 1 addition of xylanase in any concentrations has statistically insignificantly increased while in bread samples from flour 2 has statistically significantly inc-reased values of L* in comparison to the respective bread sample with only added amylase. These data are consistent with reports by Al-Wydian et al. [20]. On the whole amylase-xylanase mixture affected most of color parameters, which is also experienced by Kaltsa et al. [2].
CONCLUSIONS
Based on data experienced with the effect of dif-ferent quantities of added amylase and xylanase to white wheat flours characterized with different acti-vities of naturally existing amylases it can be stated:
• RSM is a good tool for estimation of the main effects of quantity of added amylase and bulk ferment-ation time on bread quality parameters in case flours differ in naturally existing amylase activity.
• SOP models for bread quality responses were statistically significant, while predicted and observed responses correspond very well, which allows good prediction of bread quality parameters based on applied technological parameters of quantity of added amylase and bulk fermentation time.
• Score analysis have shown that optimum quantity of amylase addition regarding bread quality
Table 5. The effect of amylase and xylanase addition on bread crust colour made from Flour 1 and Flour 2; different letters in the superscript in the same column of the table for each flour type indicate statistical significant difference between values at the level of significance of p < 0.05 (based on post-hoc Fisher LSD test)
Sample Bulk fermentation time min
a* Share of red color
b* Share of yellow color
L* Brightness
Flour 1 Control, 0% of amylase addition 20 5.59±0.45a 27.04±2.30a 76.28±2.00a
40 1.53±0.39b 27.34±1.67a 75.89±2.18a 60 14.49±2.41c 14.55±1.09b 76.58±1.79a
With 0.001% of amylase addition 20 14.08±1.41c 26.41±0.89a 69.69±1.99b 40 14.83±1.01c 27.63±2.02a 77.86±1.92a 60 21.07±1.78d 23.14±0.95c 72.53±2.05ab
With 0.002% of amylase addition 20 33.27±1.80e 26.4±2.14a 57.28±1.91c 40 29.72±2.18f 25.11±2.15ac 66.34±2.49bd 60 33.55±1.74e 27.96±0.75a 62.95±2.11d
0.002% of amylase additionWith 0.003% of xylanase addition 60 30.54±0.37f 23.23±0.39c 64.77±2.97d With 0.004% of xylanase addition 60 24.73±0.98g 21.02±1.61c 66.56±3.91be With 0.005% of xylanase addition 60 36.89±2.34h 21.90±1.61c 63.21±2.47de
Flour 2 Control, 0% of amylase addition 20 23.40±1.45a 22.65±1.31a 61.68±3.00a
40 18.61±0.99b 24.44±1.87a 67.90±2.78b 60 28.92±2.01c 20.76±2.09ab 68.35±1.78b
With 0.001% of amylase addition 20 30.60±2.41cd 23.82±0.87a 58.25±0.99ac 40 30.23±2.01cd 24.84±1.02a 59.52±1.12ac 60 32.08±1.48d 17.47±0.45c 64.20±2.45ab
With 0.002% of amylase addition 20 37.31±2.00e 18.88±1.74bc 55.92±1.41cd 40 48.80±1.18f 20.04±2.12bd 60.05±1.99ad 60 44.82±1.94g 22.21±0.45ad 62.36±2.15a
0.001% of amylase addition With 0.003% of xylanase addition 60 36.72±0.57e 16.87±0.65ce 75.21±3.16e With 0.004% of xylanase addition 60 41.91±0.78h 15.45±1.01ce 78.00±4.01e With 0.005% of xylanase addition 60 46.02±1.74g 14.99±1.21e 77.12±3.48e
D.M. LONČAR et al.: AMYLASE AND XYLANASE ADDITION FOR WHITE FLOUR AMYLASE ACTIVITY Hem. ind. 70 (6) 673–683 (2016)
682
was 0.002 and 0.001% for bread made from flour with optimum and high natural amylases, respectively. Also optimum bulk fermentation time was 20 and 60 min for bread made from flour with optimum and high natural amylases, respectively.
• Optimum level of xylanase addition in dough formula was 0.004%, regardless flour characteristics. Xylanase improved properties of white wheat bread and synergism between xylanase and amylase provide better bread characteristics as compared to amylase sole use, particularly in case flour is attributed with higher amylase activity.
Addition of different levels of amylase has statis-tically significantly increased a* and b* values of crust, regardless flour sample. Addition of xylanase in any concentrations has statistically significantly decreased values of b* in comparison to the respective bread sample with only added amylase. Effect of enzymes on color parameter L* depend upon flours quality.
REFERENCES
[1] P. Dvořáková, I. Burešová, S. Kráčmar, R. Havliková, Relationship between amylase activity in rye flour and bread quality, Int. J. Biol. Biomed. Eng. 8 (2012) 174–178
[2] O. Kaltsa, T. Georgopoulos, S. Yanniotis, I. Mandala, Effect of Enzyme Blends and Dough Strengthening Emulsifier on Extending the Shelf Life of Sandwich Bread Applying Response Surface Methodology, IJEIT 3 (2013) 149–160.
[3] D. Diaconescu, M. Zdremtan, M. Mester, L. Halmagean, M. Balint, A study on the influence of some biogenic effectors on bread staling. Sensory evaluation, J. Agroalim. Proc. Technol.19 (2013) 247–252.
[4] M. Vanhanen, T. Toumi, H. Hokkanen, O. Tupasela, A. Toumainen, P.C. Holmberg, M. Leisola, H. Nordman, Enzyme exposure and enzyme sensitisation in the bak-ing industry, Occup. Environ. Med. 53 (1996) 670–676.
[5] A.D. Harris, C. Ramalingam, Xylanases and its Appli-cation in Food Industry: A Review, J. Exp. Sci. 1 (2010) 1–11.
[6] M.A Naidu, P. Saranraj, Bacterial Amylase: A Review, Int. J. Pharm. Biol. Sci. Arch. 4 (2013) 274–287.
[7] E.J. Pyler, L.A. Gorton, Baking Science and Technology, Sosland Publishing Company, Kansas City, MO, 2008, pp. 20–27, 362–376.
[8] S. Yurdugul, N.A. Pancevska, G.G. Yildiz, F. Bozoglu, The influence of a cellulase bearing enzyme complex from anaerobic fungi on bread staling, Rom. Agric. Res. 29 (2012) 271–279.
[9] Á. Moreno–Ancillo, C. Dominguez–Noche, A.C. Gil-Adra-dos, P.M. Cosmes, Bread eating induced oral angio-edema due to α-amylase allergy, J. Invest. Allergal. Clin. Immunol. 14 (2004) 346–347.
[10] L.Z. Jaekel, C.B. Da Silva, B.C. Steel, Y.K. Chung, Influence of xylanase addition on the characteristics of loaf bread prepared with white flour or whole grain wheat flour, Ciênc. Technol. Aliment., Campinas, 32 (2012) 844–849.
[11] D.D. Ciocan-Andronic, G. Constantinescu, Influence of the Addition of Xylanase on the Quality of Wheat Prebaked, Ann. Food Sci. Technol. 14 (2013) 193–198.
[12] M.S. Butt, M. Tahir-Nadeem, Z. Ahmad, M.T. Sultan, Xylanases and Their Applications in Baking Industry, Food Technol. Biotechnol. 46 (2008) 22–31.
[13] F.X. Zhan, Q.H. Wang, S.J. Jiang, G.M. Zhang, Y.H. Ma, Developing a xylanase XYNYG from Plectosphaerella cucumerina for baking by hetrologously expressed in Kluyveromyces lactis, BMC Biotechnol. 14 (2014) 107– –115.
[14] T. Collins, A. Hoyoux, A. Dutron, J. Goris, B. Genot, T. Dauvrin, F. Arnaut, C. Gerday, G. Feller, Use of glycoside hydrolase family 8 xylanases in baking, J. Cereal. Sci. 43 (2006) 79–84.
[15] Regulations on the physical and chemical methods of analyses for quality controlof grain, milling and bakery products, pasta and deep frozen dough, Official gazette 78/1988, 1988 (in Serbian).
[16] American Association Of Cereal Chemists – AACC. Approved methods of the American Association of Cereal Chemists, 9th ed., AACC, St. Paul, MN, 1995.
[17] G.E.P. Box, D.W. Behnken, Some New Three Level Designs for the Study of Quantitative Variables, Technometrics. 2 (1960) 455–475.
[18] Statistica (Data Analysis Software System) 2010, v. 10, StatSoft, Inc, Tulsa, OK (www.statsoft.com)
[19] T. Jayalakshmi, A. Santhakumaran,. Statistical Normal-ization and Back Propagation for classification. IJCTE 3 (2011) 89–93.
[20] O. Al-Widyan, M. H. Khataibeh, K. Abu-Alruz, The Use of Xxylanases from Different Microbial Origin in Bread making and Their Effects on Bread Qualities, J. Appl. Sci. 8 (2008) 672–676.
D.M. LONČAR et al.: AMYLASE AND XYLANASE ADDITION FOR WHITE FLOUR AMYLASE ACTIVITY Hem. ind. 70 (6) 673–683 (2016)
683
IZVOD
OPTIMIZACIJA DODATAKA AMILAZE I KSILANAZE U ZAVISNOSTI OD AMILAZNE AKTIVNOSTI BELOG BRAŠNA Davor M. Lončar1, Vladimir S. Filipović2, Jelena S. Filipović3
1Superlab D.O.O., Beograd, Srbija 2Univerzitet u Novom Sadu, Tehnološki faklutet, Novi Sad, Srbija 3Univerzitet u Novom Sadu, Naučni institut za prehrembene tehnologije, Novi Sad, Srbija
(Naučni rad)
U ovom istraživanju ispitan je uticaj dodatka različitih količina amilaze u belopšenično brašno koje je posedovalo različite nivoe aktivnosti prirodno prisutneamilaze. Izabrana je metoda odzivne površine za ispitivanje glavnih uticaja pri-menjenih tehnoloških parametera na parametre kvaliteta hleba. Za nezavisnopromenljive veličine odabrane su: količina dodate amilaze (0; 0,001 i 0,002%) i vreme fermentacije u masi (20, 40 i 60 min). Za zavisno promenljive veličineodabrane su: specifična zapremina hleba, struktura pora i čvrstoća sredine.Modeli sa polinomima drugog stepena fitovani su prema eksperimentalno dobi-jenim odzivnim površinama. Odzivi modela koji se odnose na kvalitet hleba sustatistički značajni, pri čemu su pretpostavljeni i dobijeni odzivi bili u dobroj kore-laciji, što omogućava dobro pretpostavljanje parametara kvaliteta hleba u zavis-nosti od primenjenih tehnoloških parametara i karakteristika brašna. Score analizapokazuje da optimalna količina dodate amilaze u odnosu na kvalitet hleba zavisi od aktivnosti prirodno prisutne amilaze u brašnu. Za hlebove koji se prave odbrašna sa nižom (ili optimalnom) amilaznom aktivnošću, optimalan dodatak amil-aze je 0,002%, a vreme fermentacije u masi 20 min, dok za hlebove koji se prave od brašna sa visokom amilaznom aktivnošću, optimalan dodatak amilaze je0,001%, a vreme fermentacije u masi 60 min. Optimalna količina dodate ksilanazeu uzorke hleba napravljenih od obe vrste brašna je 0,004%. Dodatak ksilanaze jepoboljšao karakteristike hleba. Dodatak različitih količina amilaze statistički zna-čajno je povećao a* vrednosti za koru. Dodatak ksilanaze u bilo kojoj količini jestatistički značajno smanjio b* vrednosti u poređenju sa uzorcima hleba sa doda-tom samo amilazom.
Ključne reči: Aktivnost amilaze brašna •Amilaza • Ksilanaza • Karakteristike brašna