optimal use of hybrid feedstock, switchgrass and shale gas, for the simultaneous production of
TRANSCRIPT

1
Optimal use of Hybrid feedstock,
Switchgrass and Shale gas, for the
Simultaneous Production of Hydrogen and
Liquid Fuels
Mariano Martína, 1, Ignacio E. Grossmannb
Departamento de Ingeniería Química. Universidad de Salamanca. 37008 , Salamanca (Spain)
Department of Chemical Engineering. Carnegie Mellon University Pittsburgh, PA, 15213
Abstract.
In this paper, we present a superstructure optimization approach for the integration of the simultaneous
production of liquid fuels and hydrogen from switchgrass and shale gas. The process is based on Fischer-
Tropsch technology in which the shale gas is reformed with steam, while the switchgrass is gasified and reformed
(with steam or partial oxidation). The raw gas is cleaned up, including removal of the sour gases, and its
composition is adjusted (using either water gas shift reaction or pressure swift adsoprtion) and the liquid fuels are
obtained in an FT reactor. The heavy liquids are upgraded using hydrocracking to increase the yield towards FT-
diesel. A sensitivity study on the raw material prices reveals that production costs for the biomass-shale gas
facility are below $1/gal as long as biomass price is below $100/t and the price of the shale gas is not higher than
$11.5 /MMBTU. Furthermore, hydrogen is produced as long as the demand for liquid fuels is met and there is
enough shale gas available.
Keywords: Energy, Biofuels, Shale gas, Alternative fuels, Diesel, Fisher – Tropsch
1 Corresponding author. Tel.: +34 923 294479 Email address: [email protected] (M. Martín)
2
1.-Introduccion
Over the last decades there has been an effort to develop alternative fuels for transportation. Bioethanol
and biodiesel are the most promising due to their compatibility with the current supply chain and automobiles.
However, there are a number of challenges to overcome, mainly due to the large demand of fuels and the limited
production capacity of biofuels as a result of the need for large harvesting areas, or to switch from first to second
generation biofuels to avoid competition with the food chain. Thus, in the short time hybrid first and second
generation biofuels, using corn grain and stover for the production of bioethanol [1] or biomass – fossil fuel
feedstock [2-4] can be used to reduce the dependency on fossil fuels and to serve as a bridge between the
technologies.
Recently a new source of fossil fuels has been found, shale gas. Shale gas is natural gas that is trapped
within shale formations, fine-grained sedimentary rocks. The discovery of the shale gas in the US has greatly
decreased the price of natural gas and its volatility, with values as low as $2/MMBTU (January 2002 and again
from February 2012 onwards) in contrast to the high values of $16/MMBTU in January 2006 [5]. In 2009, 87% of
the gas consumed in the US was produced domestically. In this way the availability of large quantities of shale
gas will further allow the United States to consume a predominantly domestic supply of gas. Thus, the supply of
natural gas is not as dependent on foreign producers as is the case of crude oil, and therefore its supply is less
vulnerable to interruptions. According to the EIA Annual Energy Outlook 2011, the United States has 2,552 trillion
cubic feet (Tcf) of potential natural gas resources. Natural gas from shale resources, considered uneconomical
just a few years ago, accounts for 827 Tcf of this resource estimate, more than double the estimate published last
year [6,7].
Bioethanol production from switchgrass via thermochemical routes is becoming promising as a substitute
for gasoline in terms of production cost [8], in spite of the higher investment required compared to the biochemical
route [9]. Biodiesel from algae is also the focus of development by academia, government and industry; e.g.
ExxonMobil announced a $600 million program [10-12]. However, the use of Fischer-Tropsch technologies from
biomass alone have received less attention due to the lower yield from lignocellulosic biomass, higher production
cost compared to the production of ethanol from the same raw material and higher investment cost compared to
biodiesel [4, 8, 10, 13-16]. However, the FT technology allows the simultaneous production of FT diesel and
3
green gasoline yielding a flexible plant. We can help bridge the gap between current fuels and biofuels by using
Fischer-Tropsch (FT) technology with a hybrid source of syngas, shale gas and switchgrass so that we improve
the economics and the sustainability, while increasing the production capacity of synthetic liquid fuels, reducing
the dependency on crude oil, while producing hydrogen as a byproduct, taking also into account the fact that we
need a certain amount of hydrogen for the upgrade of FT-liquids.
In this paper, we propose a superstructure optimization approach and a sensitivity analysis for the
conceptual design and optimal operation of multiproduct facilities from hybrid feedstock, lignocellulosic
switchgrass and shale gas using the FT technology. The goal is to optimize the superstructure to decide on the
technology to use (which process units and their interconnections) and to determine the product distribution and
the operating conditions that maximize the FT-diesel production, while minimizing the energy input as a function
of the availability and price of raw materials (biomass and shale gas devoted to this task), and byproduct price
(hydrogen). The proposed model will make it possible to evaluate the competitiveness of such hybrid production
facilities compared to the use of biomass only and current fossil fuels in a flexible market arena, as well as to
determine the limiting scenarios. We consider switchgrass since it is the raw material of choice by the DOE due to
its harvesting possibilities in the US and its high yield to biofuels. Furthermore, as discussed above, shale gas is
currently widely available in the US at low cost. We first construct a superstructure embedding the various
process units involved in syngas production from the two sources, as well as the synthesis of liquid fuels based
on FT technology considering various alternatives for some of the processes. The optimization of the system is
formulated as a mixed-integer nonlinear programming (MINLP) problem, where the model involves a set of
constraints representing mass and energy balances for all the units in the system as well as design correlations.
Next, we perform heat integration of the resulting process, developing the heat exchanger network followed by a
detailed economic evaluation to determine the production cost of liquid fuels as a function of the raw material and
byproduct prices and its availability.
The paper is organized as follows. Section 2 describes the hybrid process for the production of liquid
fuels and hydrogen from shale gas and lignocellulosic switchgrass. The methodology is presented in section 3
together with the assumptions for modeling the different units and the solution procedure for the optimization
problem. In section 4 we present the results and finally, in section 5 we draw some conclusions on the price limits
for the raw materials so that the products of this hybrid facilities are competitive.

4
2. Overall Process Description The process consists of five different parts. First, the shale gas is reformed with steam to produce raw
syngas. Part of the gas is needed to heat up the furnace since steam reforming is endothermic. On the other
hand the swichgrass is gasified. Based on previous work [8], we select indirect gasification followed by reforming
(either with steam or partially oxidized [17] ) to remove the hydrocarbons generated. The solids are removed
together with NH3 in a wet scrubber and the gas is compressed. At this point, both sources of raw syngas are
mixed. The traces of hydrocarbons are removed in a PSA system with a bed of Silica gel. Next, the composition
may need to be adjusted to a molar ratio of H2:CO from 1 to 2 according to the results by Wang et al [18]. Three
alternatives are considered: water gas shift reactor, bypass and hybrid membrane / PSA for H2 (with a bed of
oxides). The split fraction depends on the performance of the gasifier, the shale gas and the tar reformer, which
may make this composition adjustment redundant. In case of an excess of hydrogen, it exits the system through
the hybrid membrane / PSA.
The third part corresponds to the removal of sour gases, CO2 and H2S. According to the study by Martin
& Grossmann [8] two technologies operating in sequence are considered for this task: the absorption of the sour
gases in monoethanol amine (MEA) followed by a PSA system with a bed of Zeolite 5A .
Figure 1.- Superstructure for the production of FT- Diesel from shale gas and switchgrass
Once the gas is purified, the syngas consisting of H2 and CO is used in the Fischer-Tropsch synthesis to
produce liquid hydrocarbons using a catalyst of iron or cobalt. The operating conditions are to be optimized (ratio
of H2 and CO and operating temperature at the reactor). The synthetic diesel is produced in addition to gasoline,
gas products, and heavy fuels [19]. The optimal operating pressure is assumed to be 30 atm according to
experimental results [18].
Finally, the FT liquids produced are separated from the water by gravity separation and refined to
different fuels using atmospheric distillation. The heavy products can be hydrotreated to increase the yield to
diesel [20]. The results from Bezergianni et al. [21] are used to provide a model for the hydrocracking of the
heavy oil. Figure 1 shows the superstructure embedding the different alternatives.

5
3.- Process Design Method: Modelling assumptions.
The optimization of the production of liquid fuels and hydrogen is formulated as a mixed-integer
nonlinear programming (MINLP) problem. The units are modelled using mass and energy balances, chemical
equilibria, rules of thumb, and design equations with special attention to the reactors (Shale gas reformer, FT,
WGSR and Hydrocracking). The components in the system belong to the set J = { Wa, Met, But, Gasoline,
Diesel, Wax, C6H6, MEA, Tars, CO2, CO, O2, N2, H2, H2S, NH3, CH4, C2H2, C2H4, C2H6, SO2, C, H, O, S, N,
Olivine, Char, Ash }. In this section we present the main assumptions for modelling the different units based on
extensive literature research so that the models are simple but reasonably accurate. Further details for
switchgrass gasification, gas clean up and synthesis can be found in a previous paper by the authors (Martin &
Grossmann 2011). Here we only present a brief description of these stages. The solution to the problem yields
the steady state operation of the production facility presented in section 2. The objective is to maximize the
production of liquid fuels depending, mainly, on the main operating costs related to the raw materials and energy.
For the optimal flowsheet and operating conditions for each scenario, we perform heat integration developing the
heat exchanger network followed by a detailed economic evaluation to determine the production cost of liquid
fuels and product distribution.
3.1.-Switchgrass pretreatment
The pre-treatment stage consists of washing the incoming feed of switchgrass to remove dirt and dust. A
small amount of the wash water (1%) is assumed to stay with the feed. It is assumed that 0.5 kg of washing water
is needed to wash 1 kg of switchgrass. The washing step takes place at ambient temperature. Then, the grass is
partially dried by means of a mechanical press that is able to remove 90% of the water that goes with the
switchgrass. In order for the gasification to be effective, a reduction in the size of the grass is needed. However,
the size required is larger, around 10 mm requiring 30kWh/t [22].
3.2.-Switchgrass gasification Many different alternatives can be found in the literature for gasification [23]. In this paper we consider
only the indirect gasification based on previous results [8] where further details can be found. The switchgrass
6
from the grinding stage enters the gasifier together with steam and olivine, that provides the energy. The gas
generated, calculated based on the empirical correlations given by Phillips et al [24], and the solids (chair and
olivine) exit at 890ºC and 1.6 bar. The solids are separated in a cyclone. The gas is cleaned in subsequent steps.
The solids go to a second chamber, the combustor, which operates at 995ºC and where the char is burned to
provide the energy to reheat the sand. Air can be used due to the fact that the combustion takes place in a
different chamber. A make-up of sand is needed. The solids, mainly olivine, are separated from the gases in a
cyclone and recycled to the gasifier. The combustion gas is cleaned from ash and cooled down from where
energy can be obtained for the process. The model for this system is based on the experimental results by
Phillips et al. [24].
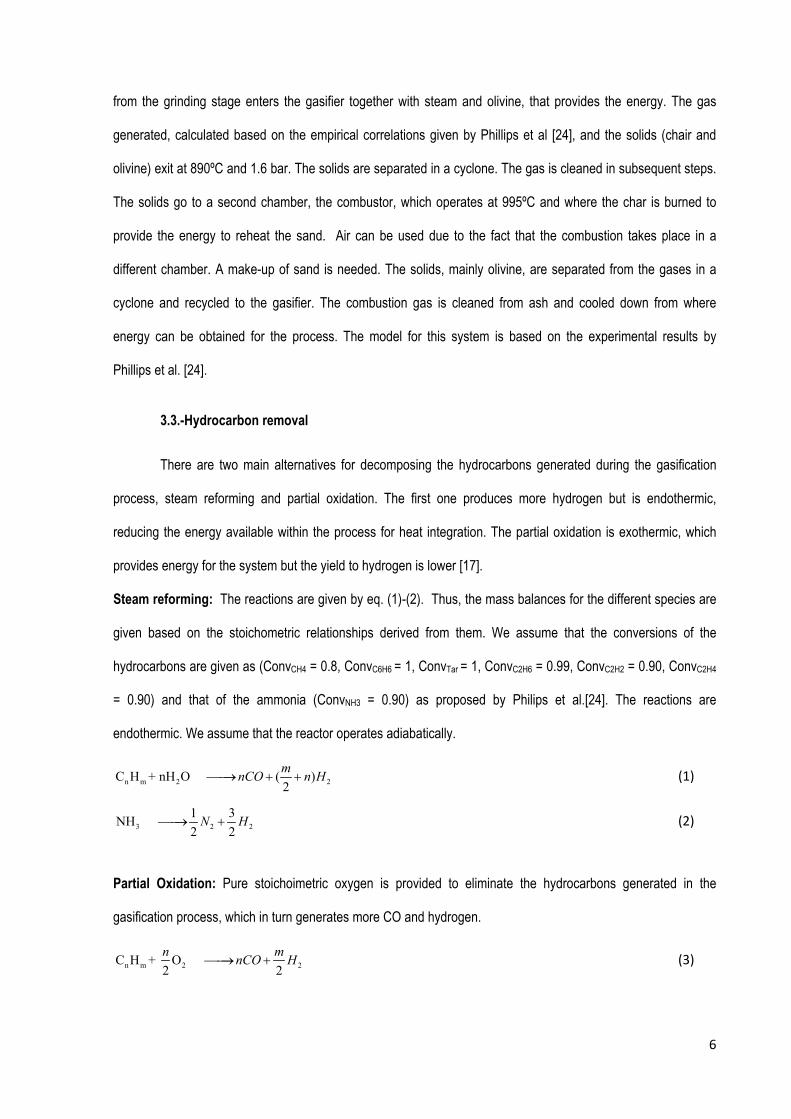
3.3.-Hydrocarbon removal
There are two main alternatives for decomposing the hydrocarbons generated during the gasification
process, steam reforming and partial oxidation. The first one produces more hydrogen but is endothermic,
reducing the energy available within the process for heat integration. The partial oxidation is exothermic, which
provides energy for the system but the yield to hydrogen is lower [17].
Steam reforming: The reactions are given by eq. (1)-(2). Thus, the mass balances for the different species are
given based on the stoichometric relationships derived from them. We assume that the conversions of the
hydrocarbons are given as (ConvCH4 = 0.8, ConvC6H6 = 1, ConvTar = 1, ConvC2H6 = 0.99, ConvC2H2 = 0.90, ConvC2H4
= 0.90) and that of the ammonia (ConvNH3 = 0.90) as proposed by Philips et al.[24]. The reactions are
endothermic. We assume that the reactor operates adiabatically.
n m 2 2C H + nH O ( )2mnCO n H→ + + (1)
3 2 21 3NH 2 2
N H→ + (2)
Partial Oxidation: Pure stoichoimetric oxygen is provided to eliminate the hydrocarbons generated in the
gasification process, which in turn generates more CO and hydrogen.
n m 2 2C H + O 2 2n mnCO H→ + (3)
7
The mass balances of the species in the tar are calculated based on the conversions of the
hydrocarbons and that of the ammonia following the stoichiometric relationships given by eqs (2)-(3). The
conversions of the different hydrocarbons (Conv_i) are taken to be the same as in the report by Philips et al.
(2007) based on the results by Vernon et al. and Deutschmann & Schmidt [25-26]. The process is exothermic and
we assume that the energy generated is used to generate steam.
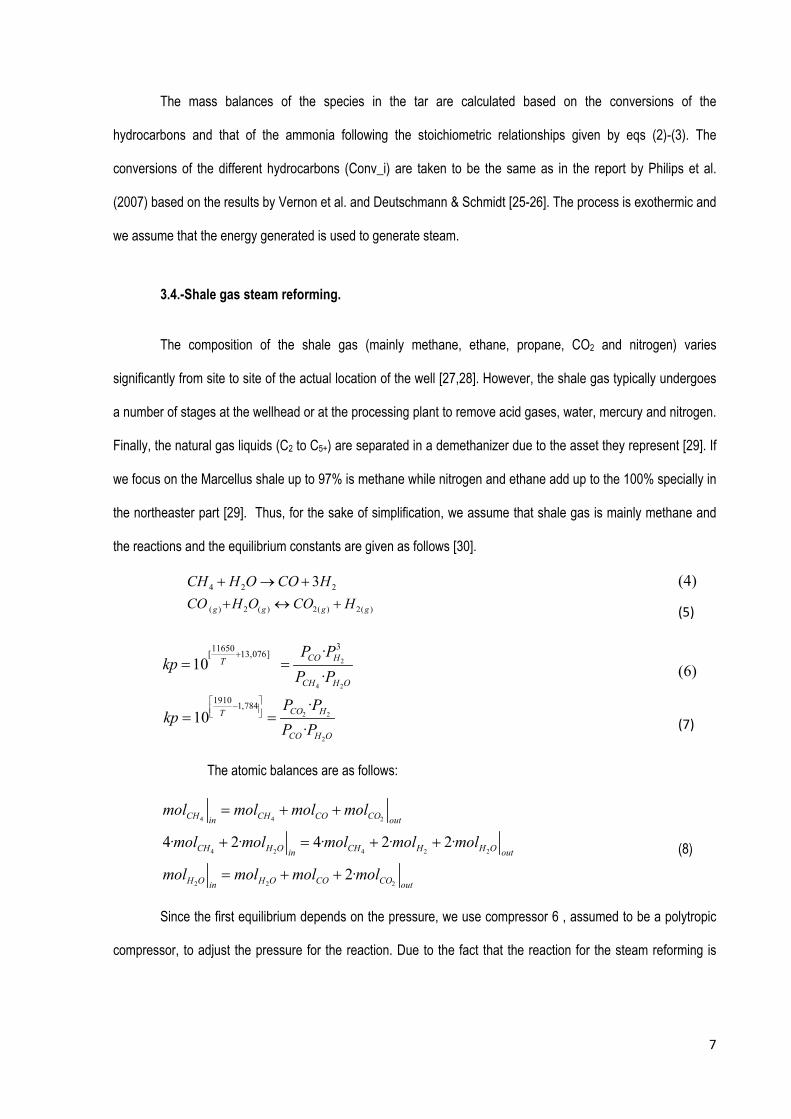
3.4.-Shale gas steam reforming. The composition of the shale gas (mainly methane, ethane, propane, CO2 and nitrogen) varies
significantly from site to site of the actual location of the well [27,28]. However, the shale gas typically undergoes
a number of stages at the wellhead or at the processing plant to remove acid gases, water, mercury and nitrogen.
Finally, the natural gas liquids (C2 to C5+) are separated in a demethanizer due to the asset they represent [29]. If
we focus on the Marcellus shale up to 97% is methane while nitrogen and ethane add up to the 100% specially in
the northeaster part [29]. Thus, for the sake of simplification, we assume that shale gas is mainly methane and
the reactions and the equilibrium constants are given as follows [30].
4 2 23CH H O CO H+ → + (4) ( ) 2 ( ) 2( ) 2( )g g g gCO H O CO H+ ↔ + (5)
2
4 2
311650[ 13,076] ·10
·CO HT
CH H O
P Pkp
P P+
= = (6)
2 2
2
1910 1,784 ·10
·CO HT
CO H O
P Pkp
P P
− = = (7)
The atomic balances are as follows:
4 4 2
4 2 4 2 2
2 2 2
4· 2· 4· 2· 2·
2·
CH CH CO COin out
CH H O CH H H Oin out
H O H O CO COin out
mol mol mol mol
mol mol mol mol mol
mol mol mol mol
= + +
+ = + +
= + +
(8)
Since the first equilibrium depends on the pressure, we use compressor 6 , assumed to be a polytropic
compressor, to adjust the pressure for the reaction. Due to the fact that the reaction for the steam reforming is
8
endothermic, we have to burn part of the natural gas, separated in Spl3, to provide the energy to keep the
temperature constant
( , 2, 2)*( )out
ref
T
prod f Ti
Q fc i Tar Mix H CpdT= ∆ +∑ ∫ (9)
( , 2, 2)*( )out
ref
T
prod f Tj entradas i
Q fc i Tar Mix H CpdT=
= ∆ +∑ ∑ ∫ (10)
Q(Tar2)= (Q_prod-Q_reac); (11) fc(CH4,Spl3,Tar2) = Q(Tar2) /PCI_gas; (12) The gas coming out of the reformer is sent to the purification stage before the PSA system for removal of
hydrocarbon traces.
Figure 2.-Scheme of shale gas reforming
3.5.-Clean up This stage is divided in two. We first eliminate the solids (Ash, Char and Olivine) and NH3 using a
scrubber that operates at 1.2 bar and 40ºC requiring 0.25 kg of freshwater per m3 of gas [31]. The gas leaves the
scrubber saturated with water and no solids nor NH3 and is prepared for the second stage, a PSA system that
operates at 25 ºC and 4.5 bar using silica gel as adsorbent where the last traces of hydrocarbons are eliminated
[32]. Thus, we compress the gas assuming polytropic behaviour, and cool it down. Due to the low temperature,
water condenses before the PSA adsorption beds and it is discharged. The PSA system is modeled as two beds,
one operating and the second one in regeneration to allow continuous operation of the plant.
3.6.-Composition adjustment.
Once the gas has been cleaned up, the ratio between CO and H2 may need to be adjusted so that the
feed to the FT-reactor is appropriate for the optimal production of the diesel fraction. This step is complementary
to the usage of shale gas and the composition of the gas from the gasification where a primary adjustment may
be provided. In order to perform such adjustment, we consider three alternatives. The first one is the use of water
gas shift to reduce the amount of CO by producing more H2. The second is a simple bypass where the
composition remains unchanged. Finally, a hybrid membrane/PSA system is proposed to remove hydrogen
based on recent results in the literature [33,34].

9
Water Gas Shift Reaction (WGSR): The reaction taking place in the water shift reactor, eq (13), is widely known:
2 2 2CO+ H O CO H←→ + (13)
The mass balance that models the reactor is based on the conversion, which depends on the molar ratio
of steam to CO and the operating temperature. Thus, using the experimental data by Choi & Stenger [35], we
developed a correlation [36] to predict the conversion as function of both parameters so that the model can be
solved in steady state. The energy generated in the reaction is used to generate steam.
Bypass: It may be possible that the stream does not need any adjustment in the CO:H2
H2 Membrane / PSA system: The stream to be treated in the membrane / PSA system for the recovery of
hydrogen has to be adjusted in terms of temperature, 25 ºC, and pressure, 4.5 bar assuming that there is a 10%
loss in the previous PSA system. The compression is modelled assuming polytropic behaviour to determine the
final temperature and energy required. As a result of the cooling, water condenses. The amount condensed is
determined by the saturation conditions of the exiting gas. In this PSA it is assumed that only hydrogen is
eliminated from the stream with an efficiency of 100%. The other gases pass though. Finally, all the streams are
mixed adiabatically.
3.7.-CO2 removal The removal of CO2 and H2S is the last cleaning stage for the preparation of the syngas. According to
the results by Wang et al [18], the optimal pressure for diesel is 30 bar. This fact, together with the negative effect
of the H2S for the catalytic reaction and the results from a previous paper [8], defines the clean-up of the gas as
follows: the first stage is the PSA for the removal of CO2, and next the MEA absorption which provides with the
proper pressure for the Fischer-Tropsch reactor. Therefore, the gas is first treated in a PSA system to remove the
CO2 by adsorption on Zeolite 5A or 13X [37,38]. The operating conditions are 25 ºC and 4.5 bar. Thus, the
stream is compressed and cooled down. In this process water condenses too. The amount of water condensed is
given by the saturation conditions of the exiting gas, while the water vapor accompanying the CO2 is adsorbed
too. The cycle is short and the adsorption capacity is around 0.1kg of CO2 per kg of zeolite allows the removal of
95% of the CO2. The outlet of the PSA system must be further treated for the removal of H2S.

10
Typically the MEA systems operate at 29 ºC and elevated pressure, 29 bar [24,39,40-42]. The sour gas
is placed into contact adiabatically with the MEA (fresh and regenerated) in a contact column adiabatically. The
heat of reaction heats up the exiting streams. The liquid stream is treated to recover the amine in a distillation
column, while the gas can be directed to the synthesis. Due to the required increase in the pressure, a two-stage
compression system with inter cooling is proposed. Thus, the temperature after each of the compressors and the
energy required are calculated assuming adiabatic behavior with inter-cooling. Once the gas is at the desired
pressure, it has to be cooled down to 29 ºC. Thus, condensation is likely. The water is eliminated to avoid the
dilution of the solution of MEA. The characteristics of the solution of MEA needed to remove the CO2 and H2S are
taken from GPSA [39]. The recoveries of sour gases are 0.9 and 1 for CO2 and H2S, respectively. The gas phase
coming out of column 1 is calculated based on the separation efficiencies. The MEA with the sour gas is treated
in a distillation column to regenerate and recycle the amine, while the sour gases exit the column from the top.
The operation of this column is based on the experimental data and design conditions provided by the literature
[39-42].
3.8.-Synthesis
The general agreement for describing the mechanisms of the synthesis of liquid fuels is a stepwise chain
growth where the formation of higher hydrocarbons occurs through the dissociation of carbon monoxide so that
the surface species (at first, surface carbon) have the option of desorbing to produce an alkene, or to be
hydrogenated to desorb as an alkane, or to continue the chain growth process by adding another CH2. There are
a number of reactions that are undesirable such as the production of methane from syngas, or Bouduard
equilibrium. The valuable reaction is given by eq. (14) which is the most dominant reaction when using cobalt-
based FT catalyst, while in case of iron-based catalyst, the WGSR also takes place enabling the operation at a
lower temperature.
2 2
2 2 2
2
2 ; H 165 /
n m
FT
mnCO n H C H nH O
CO H CH H O kJ mol
+ + → +
+ →− −+ ∆ = −
(14)
The temperature and the ratio of CO and H2 are the variables that define the product distribution at the
FT-reactor. Thus, the operating conditions depend on the types and quantities of Fischer-Tropsch products

11
desired, ranging from either low (200–240 °C) or high (300–350 °C) temperatures, and pressures from 10 to 40
bar employing either cobalt or iron based catalysts. Currently iron based catalysts are used operating at high
temperatures for the production of gasoline and small hydrocarbons, while either cobalt based or iron based
catalyst that operate at low temperature (200–240 °C) are used for the production of diesel or heavier products
[20]. However, the iron catalyst provides high selectivity for C10 – C18, which means a high yield of diesel. Thus,
the gas from treatment must be heated up to the appropriate temperature, Tsynthesis.. Moreover, the reactions with
iron catalyst are usually conducted at 30 bar, which is convenient due to the fact that the MEA treatment is
already operating at that pressure, and thus, is the catalyst of choice. Furthermore, Fischer-Tropsch synthesis
requires careful control of the H2:CO ratio to satisfy the stoichiometry of the synthesis reactions, as well as to
avoid deposition of carbon on the catalysts (coking). While some reviews like van der Laan & Beenkakers [43]
and recent experimental by studies [18,44] report that the production of gasoline and diesel is enhanced for
H2/CO ratios from 1 to 2 and for optimal production of the diesel fraction. Some researchers report a minimum
ratio of 1.7 for iron catalysts [20]. In order to assess the effect of the uncertainty we decide to impose 1.7 as lower
bound for the ratio H2/CO.
To determine the operating conditions we assume that the Fischer-Tropsch reactor operates as a
polymerization reactor whose product distribution is given by the Anderson-Schulz-Flory (ASF) distribution
[43,46,47]. The fraction of mass of the hydrocarbons i = number of C, wi, depends on the probability of chain
growth, α. A conversion of 0.9 in CO is considered based on the results by Park & Norbeck [48]. According to
the literature [49], α is a function of the temperature, and the ratio CO to H2 . The fraction of Ci (wi.) is calculated
through eqs. (15)-(16)
1 2(1 ) ·iiw iα α−= − (15)
( )( )( )2
0.2332* 0.633 * 1 0.0039* T _ Synthesis 273 533 co
H co
yy y
α = + − + − +
(16)
We consider five main products from the distribution, C1-C2, C3-C4, gasoline, diesel and heavy products.
The product distribution is calculated out of the mass converted using the fraction of each calculated from eq. (15)
The distribution is to be optimized for the production of FT-diesel.
3.9.-Separation and hydrotreatment.

12
Fischer-Tropsch liquids can be refined to renewable (green) gasoline, diesel fuel depending on the
process conditions. The gas fractions are separated from the liquids by flash separation. In order to reduce the
losses of liquid fuel, the flash operates at the same pressure of the reactor, but the mixture is cooled down to
30ºC. Thus, we assume that we recover the gases and small hydrocarbons but not the liquids, gasoline, diesel,
wax and water. The gases could be further separated into methane and butane fractions, or can be used together
as flue gas to produce energy. For the economic analysis, we assume for simplicity that the gases are used as
flue gas since their purification to be sold as products or to be recycled is expensive and is not the objective of the
paper.
Three liquid fractions are considered, gasoline, diesel and heavier products which are fractionated in an
atmospheric distillation system. We heat up the feed to 220ºC. Typically these towers have 30 trays and the
operating temperatures are 125 ºC for the top (Gasoline), 220 ºC for the diesel and 280 ºC at the bottom [50] .
The reflux ratio is assumed to be 2 to be on the conservative side [51]. There is no reboiler, but steam is directly
injected and the energy consumption is due to the production of that steam, 0.18 kg of steam per kg of residue to
be on the safe side [51-54]. The bottoms of the column are treated to obtain more diesel using hydrocracking,
since it avoids the presence of aromatics in the diesel [20]. Based on the literature, we assume that only 7.5% of
the hydrogen that is fed to the reactor, 600 ft3 of hydrogen per bbl, remains with the products [50].To model the
yield and the products of the hydrocracking reactor we use the experimental data for the conversion and
selectivity as a function of the temperature from the paper presented by Bezergianni et al. [21] to develop a
reduced order model given by (17)-(18).
( )2X _ R3 0.000185714· T _ reactor3 0.128829·T _ reactor3 22.6931= − + (17)
( )2S _ diesel 0.00014286· T _ reactor3 0.099514·T _ reactor3 16.383= − + − (18)
The products of the hydrocraking are cooled down to 30 ºC in a flash so that the liquids (gasoline,
Diesel and heavy fractions) are recycled to the column to be separated while the excess of hydrogen is recycled
back to the reactor.
3.10.-Solution procedure. The MINLP model of the superstructure is decomposed into 2 NLP’s subproblems, whether the raw
syngas generated at the gasifier is either partially oxidized or follows steam reforming. Each NLP, consisting of
13
around 5,500 equations and 6,200 variables, is solved using GAMS 23.5 running in an Intel Core i-7 desktop
computer to optimize the production of synthetic diesel determining the operating conditions to be used at the
shale gas reformer, the operating pressure and the fraction of gas used to maintain adiabatic operation, the
WGSR, the Fischer-Tropsch reactor and the hydrocraking unit. The objective function to be maximized is given
by a simplified manufacturing cost involving the production of diesel and hydrogen and the energy and raw
materials consumption. We assume a selling price of diesel of $1 /kg for the objective function.
Z =(fc(Diesel)·1)- PSteam·(QPre-WGSR+ QPre -FT Reactor +Steam WGSR + Steam SR)+
PHy ·(fc(H2) -0.01·fc(Wax)·1.58) – PElect ,Compressor ii
W∑ -PShale fc(Shale)-PBiomass fc(Biomass) (19)
Thus, the main decision variables are the operating pressure and steam ratio at the shale gas reformer,
the split fraction at the water gas shift reactor and hydrogen PSA system for the composition adjustment, the
water gas shift operating conditions (temperature and amount of steam needed), the operating conditions in the
Fischer-Tropsch reactor (temperature and CO/H2 ratio), and the temperature at the hydrocracking unit.
Next, for each optimization run (scenario) given by the switchgrass, shale gas and hydrogen prices and
raw materials availabilities, heat integration is performed using SYNHEAT [55] to design the heat exchanger
network for the optimal recovery of the excess of energy, while minimizing the cooling needs of the facility.
Finally, a detailed economic evaluation based on Sinnot’s procedure [8, 56] is carried out in order to evaluate the
different scenarios and technological alternatives (the reforming processes), involving raw material cost,
maintenance, cost of utilities and chemicals, labor, annualized equipment cost and the cost for the management
of the facility, following Sinnot´s method [56]; see also previous papers by the authors for further details on
equipment pricing [8]. The prices for utilities are updated from the literature ($0.019/kg Steam; $0.057/ton cooling
water [57,58], $0.06/kWh [59], $0.021/kg Oxygen [60]. The generation of an excess of steam in the heat
integration stage is considered as a revenue of $0.0077/kgsteam [61].
We follow this procedure for a number of price levels for switchgrass (30 to 200 $/t), shale gas (0.5 to 5
times the base price of $4.6MMBTU, the stable one for natural gas before the impact of the shale gas [57], so
that the range captures the current price), hydrogen (0.5 to 1.5 the basis, $1.6/kg), with fixed or variable
availability of biomass, variable availability of Shale gas up to 50% or 100% of the availability of biomass for a
total of more than 100 experimental runs or scenarios.
14
4.-Results. 4.1.-Technology selection
The basic idea is that the production cost of FT diesel from switchgrass [16] has higher production cost
compared to biodiesel and bioethanol via gasification of switchgrass, and the investment is far larger than that for
a biodiesel production facility [8, 10, 16]. Thus, we propose the use of shale gas to not only increase the
production capacity of liquid fuels, but also to reduce the production costs to make it competitive with second
generation of bioethanol and biodiesel.
In this section we compare two technologies, steam reforming and partial oxidation of the gas generated
at the gasification of the switchgrass for different levels of shale gas availability to decide on the technology of
choice. Based on a previous paper by the authors [16] the use of partial oxidation results in lower yield to liquid
biofuels. Our aim is to increase the yield to liquid fuels, and thus we consider the use of shale gas as complement
for the switchgrass. To avoid that the natural gas be devoted to the production of hydrogen increasing the
profitability of the process but with a lower yield to synthetic liquid fuels, we fix the minimum capacity of the plant
that operates using partial oxidation to be at least 85% of the liquid fuel capacity obtained when using steam
reforming.
Figures 3 and 4 show the distribution of products and the biofuel yield (in mass percentage) for the use
of steam reforming, while Figures 5 and 6 present the same variables but for the use of partial oxidation. We see
that in general steam reforming of the raw syngas from the gasifier provides higher yields, while the only small
advantage is a slightly higher production of hydrogen in case of partial oxidation. If we compare the production
costs, see Figure 7, steam reforming is cheaper when biomass is the main raw material. As the ratio
biomass/shale gas reaches 2 both technologies results in similar production costs take to the same values.
Beyond this ratio, partial oxidation is more profitable. However, the idea of using shale gas as a complementary
source suggests the use of steam reforming. On the other hand, if our aim changes, the suggested technology

15
should have been the partial oxidation. At this point, due to the uncertainty in selling the flue gas obtained, we did
not consider it as an extra credit in terms of revenue.
Figure 3 Product distribution SR
Figure 4. Bio fuel yield (SR)
Figure 5 Product distribution (PO)
Figure 6 Bio fuel yield (PO)
Figure 7. Effect of the shale gas feed to the production cost.
4.2.- Sensitivity analysis
The highest yield to biofuels and hydrogen provides an advantage for the steam reforming of the gas
coming from the gasifier to help substitute the use of crude oil as source of fuels for the automotive industry.
Thus, we focus on this option to evaluate the effect of the prices of the raw materials, biomass and shale gas, the
price of the byproduct hydrogen, as well as the effect of the availability of shale gas and biomass. As we
mentioned above, our aim is to produce liquid fuels in a sustainable way. The idea is to use shale gas to
complement the biomass as raw material, and thus serve as a bridge between fossil fuels and bio-based ones.
We divide this section in three parts. The first deals with fixed biomass feedstock where we use the shale gas,
depending on its price, to complement the production of liquid fuels and hydrogen. In the second section we allow
the optimization to decide on the amount of biomass to be used depending on its price and the price of the shale
gas. Finally, in section 3 we allow larger availability of shale gas up to 1:1 the maximum availability of the
biomass as an extreme case. Needless to say, this last case is the less sustainable of the three.
1.- Fixed biomass feedstock.
We use shale gas to increase the production of diesel substitutes up to the production capacity of most
bioethanol plants, around 60MMgal/yr. This value corresponds to the typical size of a bioethanol facility based on
the availability and harvesting possibilities of lignocellulosic material. Thus, we evaluate the simultaneous
production of liquid fuels and hydrogen for a fixed flow of biomass, 18kg/s, a feasible harvesting and processing
capacity whose yield is not enough to reach the desired liquid fuels production level [16]. We consider a variable
feedstock of shale gas, with a maximum availability of up to 50% of the biomass on a mass basis. In all cases we
found a liquid fuel distribution of 71% of FT-diesel and 29% of green gasoline. To facilitate the presentation of the
results, we divide them by evaluating the effects of the shale gas, the biomass and the hydrogen byproduct.

16
a) Effect of biomass and shale gas cost on the production level and cost
In Figure 8 we present the effect of the price of shale gas and biomass on the production of hydrogen
and the usage of shale gas. For low shale gas prices, all the available shale gas is used and the excess not
needed to meet the liquid fuels demand is devoted to the production of hydrogen. As the price increases, we can
find a breakpoint beyond which the use of shale gas is decreased, while at the same time the hydrogen
production is also reduced. As the biomass cost increases, the shale gas price at which hydrogen production is
cut decreases. This breakpoint point is interesting because for current biomass cost ($30/t to $50/t) it matches
the natural gas cost before the shale gas was found or exploited. As both raw material prices increases, the
system will only meet the demand of liquid fuels with no net hydrogen production.
Figure 8 Effect of shale gas and biomass prices effect on the usage of shale gas and hydrogen production
b) Effect of the price of hydrogen
Another interesing variable is the price of hydrogen. If the hydrogen price from 0.5 to 1.5 times the DOE
expected price of $1.58/kg (with biomass and shale gas at base prices) we see that there is no effect on the
consumption of shale gas. Hydrogen is a valuable byproduct, and therefore it should be produced as long as we
meet the liquid fuels demand (see Figure 9).
Figure 9 Effect of hydrogen price on its prodction and shale gas usage.
c) Effect of the demand on liquid fuels.
At this point we want to evaluate the responsiveness of the plant to a fluctuation in the demand of liquid
fuels. Thus, in this case we vary the production level of liquid fuels from 45MMgal/yr to 90MMgal/yr for fixed
availability of biomass (18kg/s), and for variable availability up to an extra 50% contribution from shale gas
(9kg/s). In Figure 10 we see that the production of gasoline increases linearly with that of FT-diesel, while the
hydrogen production decreases. The reason is that the resources are used to produce the liquid fuels instead of
hydrogen in order to meet the demand. In mass percentage, the increased demand of liquid fuels increases the
mass yield to biofuels (the sum of biomass and shale gas) from the raw materials, see Figure 11. This means that
the production of hydrogen is accompanied with the extra production of CO2 , and thus the total yield when
17
producing the hydrogen decreases since a larger fraction of the raw material is lost as CO2. However, the high
value of the hydrogen is what drives the production of hydrogen if there is enough raw material to meet the liquid
fuel demand. For all the cases the ratio of FT-diesel in the liquid fuels production remains constant at 71%.
Figure 10 Production of byproducts as funtion of the production of FT-Diesel
Figure 11. Biofules yield for differnt FT-diesel production levels In Figure 12 we can see that the production cost of liquid fuels increases as the shale gas increases.
This is due to the fact that as long as the shale gas lies below the value of $11.5/MMBTU, the excess that is not
needed to meet the liquid fuels demand is devoted to the production of hydrogen. However, as the shale gas
prices increases, we only use that which is requried to meet the liquid fuels demand, reducing the production of
hydrogen and increasing the production cost. In this figure we have not considered the flue gas as credit, but it
will reduce the production cost by 35-50% of the one shown on the Figure 12.
Figure 12.- Cost of liquid fuels
2 Variable usage of the biomass.
For this section we do not fix the amount of biomass to be used but we allow that the prices of the main
raw materials, biomass and shale gas, decide on the raw material of choice to meet the demand of liquid fuels.
a) Fixed production level of liquid fuels
The biomass price is volatile due to its variable seasonal availability. Therefore, our next study evaluates
the relative usage of raw materials in order to produce a fixed rate of liquid fuels, 60MMgal /yr (FT-diesel & green
gasoline) as a function of their prices. In this case we allow the production cost of biomass to reach $200/t
together with the fact that the biomass usage may be variable, up to 18kg/s, while the shale gas usage can reach
50% of the maximum availability of biomass (9kg/s) from $2.3/MMBTU.
As we can see in Figure 13 a), the full availability of biomass is used unless it reaches a cost higher than
$150/t and the shale gas price is kept below $5MMBTU. From that price on, the system tries to increase the yield
of total fuels by reducing the hydrogen production. In general, the usage of shale gas to meet the demand
decreases with its cost and for around the price previous to the explotation of the shale gas, a minimun amount of
it is recomended to meet the demand. Figure 13 b) shows that shale gas is used to its full availability until it
reaches a price of 2 or 3 times the base price, and the fraction that is not needed to meet the demand for lqiuid
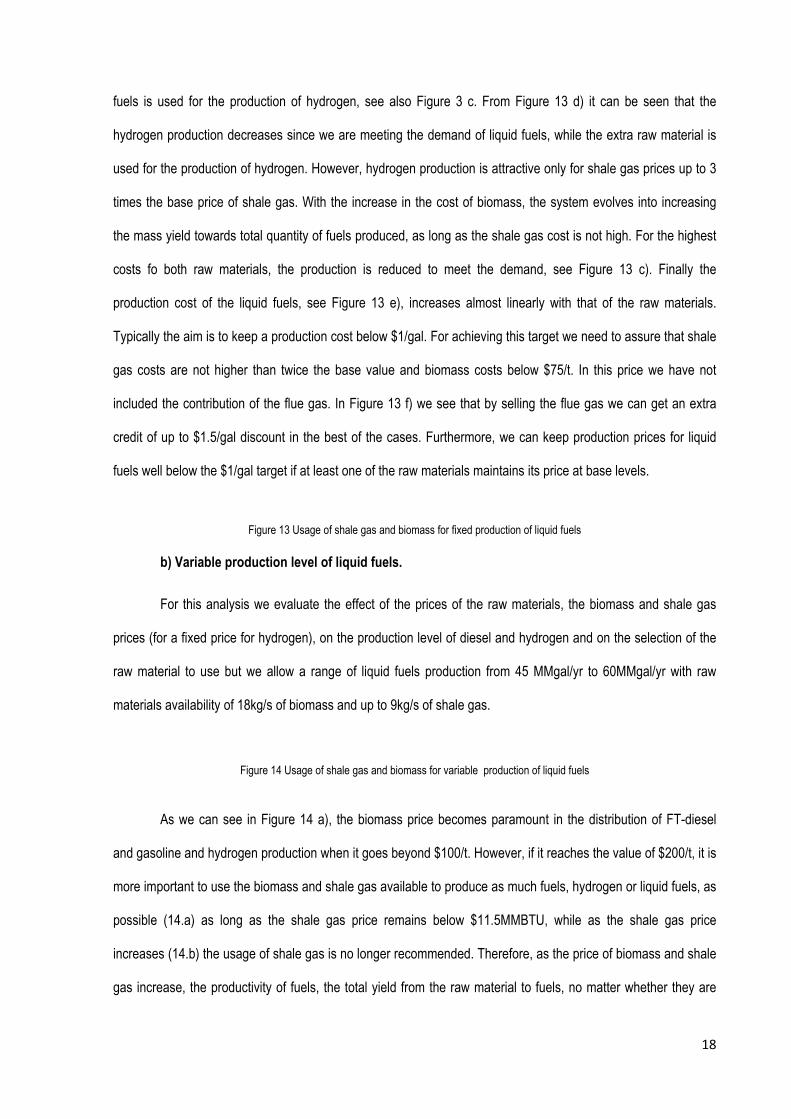
18
fuels is used for the production of hydrogen, see also Figure 3 c. From Figure 13 d) it can be seen that the
hydrogen production decreases since we are meeting the demand of liquid fuels, while the extra raw material is
used for the production of hydrogen. However, hydrogen production is attractive only for shale gas prices up to 3
times the base price of shale gas. With the increase in the cost of biomass, the system evolves into increasing
the mass yield towards total quantity of fuels produced, as long as the shale gas cost is not high. For the highest
costs fo both raw materials, the production is reduced to meet the demand, see Figure 13 c). Finally the
production cost of the liquid fuels, see Figure 13 e), increases almost linearly with that of the raw materials.
Typically the aim is to keep a production cost below $1/gal. For achieving this target we need to assure that shale
gas costs are not higher than twice the base value and biomass costs below $75/t. In this price we have not
included the contribution of the flue gas. In Figure 13 f) we see that by selling the flue gas we can get an extra
credit of up to $1.5/gal discount in the best of the cases. Furthermore, we can keep production prices for liquid
fuels well below the $1/gal target if at least one of the raw materials maintains its price at base levels.
Figure 13 Usage of shale gas and biomass for fixed production of liquid fuels b) Variable production level of liquid fuels.
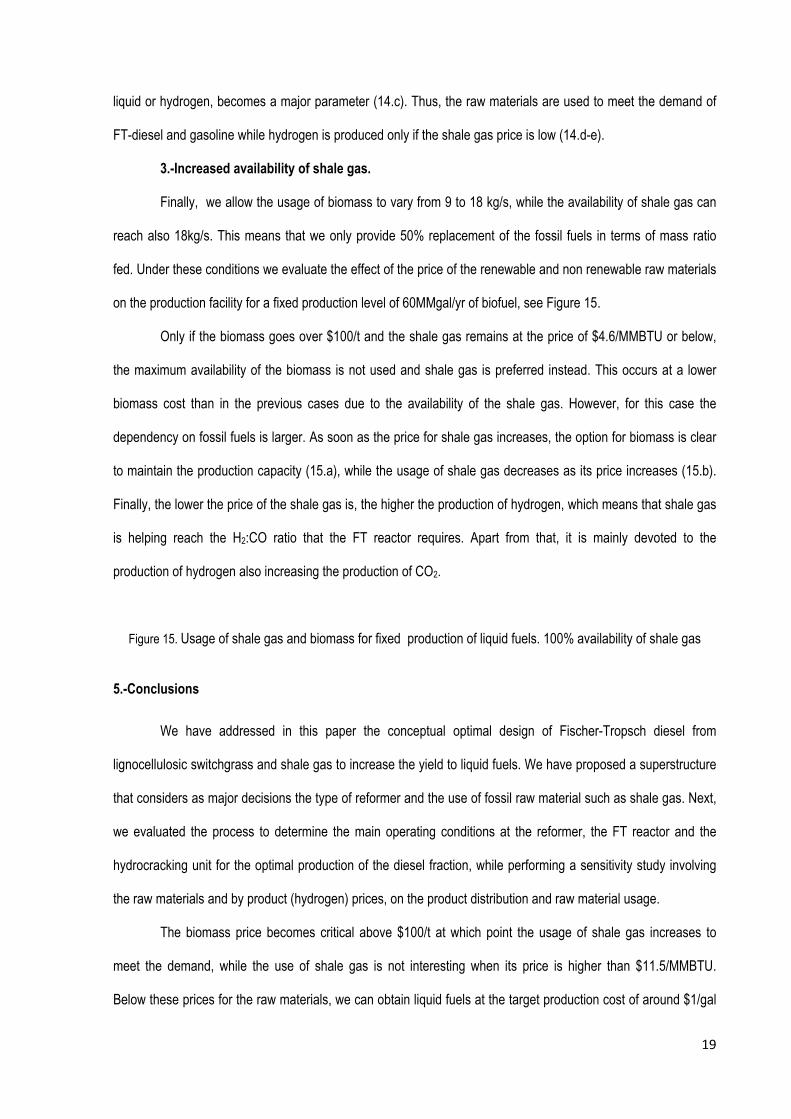
For this analysis we evaluate the effect of the prices of the raw materials, the biomass and shale gas
prices (for a fixed price for hydrogen), on the production level of diesel and hydrogen and on the selection of the
raw material to use but we allow a range of liquid fuels production from 45 MMgal/yr to 60MMgal/yr with raw
materials availability of 18kg/s of biomass and up to 9kg/s of shale gas.
Figure 14 Usage of shale gas and biomass for variable production of liquid fuels
As we can see in Figure 14 a), the biomass price becomes paramount in the distribution of FT-diesel
and gasoline and hydrogen production when it goes beyond $100/t. However, if it reaches the value of $200/t, it is
more important to use the biomass and shale gas available to produce as much fuels, hydrogen or liquid fuels, as
possible (14.a) as long as the shale gas price remains below $11.5MMBTU, while as the shale gas price
increases (14.b) the usage of shale gas is no longer recommended. Therefore, as the price of biomass and shale
gas increase, the productivity of fuels, the total yield from the raw material to fuels, no matter whether they are
19
liquid or hydrogen, becomes a major parameter (14.c). Thus, the raw materials are used to meet the demand of
FT-diesel and gasoline while hydrogen is produced only if the shale gas price is low (14.d-e).
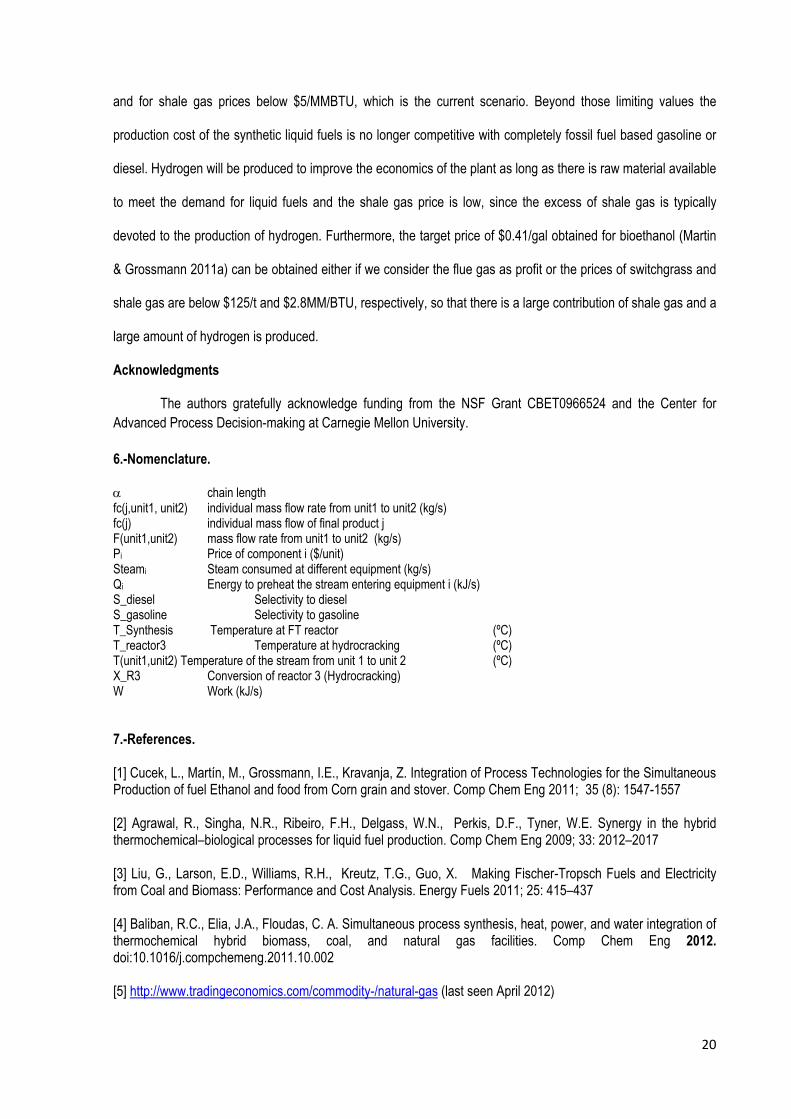
3.-Increased availability of shale gas.
Finally, we allow the usage of biomass to vary from 9 to 18 kg/s, while the availability of shale gas can
reach also 18kg/s. This means that we only provide 50% replacement of the fossil fuels in terms of mass ratio
fed. Under these conditions we evaluate the effect of the price of the renewable and non renewable raw materials
on the production facility for a fixed production level of 60MMgal/yr of biofuel, see Figure 15.
Only if the biomass goes over $100/t and the shale gas remains at the price of $4.6/MMBTU or below,
the maximum availability of the biomass is not used and shale gas is preferred instead. This occurs at a lower
biomass cost than in the previous cases due to the availability of the shale gas. However, for this case the
dependency on fossil fuels is larger. As soon as the price for shale gas increases, the option for biomass is clear
to maintain the production capacity (15.a), while the usage of shale gas decreases as its price increases (15.b).
Finally, the lower the price of the shale gas is, the higher the production of hydrogen, which means that shale gas
is helping reach the H2:CO ratio that the FT reactor requires. Apart from that, it is mainly devoted to the
production of hydrogen also increasing the production of CO2.
Figure 15. Usage of shale gas and biomass for fixed production of liquid fuels. 100% availability of shale gas
5.-Conclusions
We have addressed in this paper the conceptual optimal design of Fischer-Tropsch diesel from
lignocellulosic switchgrass and shale gas to increase the yield to liquid fuels. We have proposed a superstructure
that considers as major decisions the type of reformer and the use of fossil raw material such as shale gas. Next,
we evaluated the process to determine the main operating conditions at the reformer, the FT reactor and the
hydrocracking unit for the optimal production of the diesel fraction, while performing a sensitivity study involving
the raw materials and by product (hydrogen) prices, on the product distribution and raw material usage.
The biomass price becomes critical above $100/t at which point the usage of shale gas increases to
meet the demand, while the use of shale gas is not interesting when its price is higher than $11.5/MMBTU.
Below these prices for the raw materials, we can obtain liquid fuels at the target production cost of around $1/gal
20
and for shale gas prices below $5/MMBTU, which is the current scenario. Beyond those limiting values the
production cost of the synthetic liquid fuels is no longer competitive with completely fossil fuel based gasoline or
diesel. Hydrogen will be produced to improve the economics of the plant as long as there is raw material available
to meet the demand for liquid fuels and the shale gas price is low, since the excess of shale gas is typically
devoted to the production of hydrogen. Furthermore, the target price of $0.41/gal obtained for bioethanol (Martin
& Grossmann 2011a) can be obtained either if we consider the flue gas as profit or the prices of switchgrass and
shale gas are below $125/t and $2.8MM/BTU, respectively, so that there is a large contribution of shale gas and a
large amount of hydrogen is produced.
Acknowledgments
The authors gratefully acknowledge funding from the NSF Grant CBET0966524 and the Center for Advanced Process Decision-making at Carnegie Mellon University. 6.-Nomenclature. α chain length fc(j,unit1, unit2) individual mass flow rate from unit1 to unit2 (kg/s) fc(j) individual mass flow of final product j F(unit1,unit2) mass flow rate from unit1 to unit2 (kg/s) Pi Price of component i ($/unit) Steami Steam consumed at different equipment (kg/s) Qi Energy to preheat the stream entering equipment i (kJ/s) S_diesel Selectivity to diesel S_gasoline Selectivity to gasoline T_Synthesis Temperature at FT reactor (ºC) T_reactor3 Temperature at hydrocracking (ºC) T(unit1,unit2) Temperature of the stream from unit 1 to unit 2 (ºC) X_R3 Conversion of reactor 3 (Hydrocracking) W Work (kJ/s) 7.-References. [1] Cucek, L., Martín, M., Grossmann, I.E., Kravanja, Z. Integration of Process Technologies for the Simultaneous Production of fuel Ethanol and food from Corn grain and stover. Comp Chem Eng 2011; 35 (8): 1547-1557 [2] Agrawal, R., Singha, N.R., Ribeiro, F.H., Delgass, W.N., Perkis, D.F., Tyner, W.E. Synergy in the hybrid thermochemical–biological processes for liquid fuel production. Comp Chem Eng 2009; 33: 2012–2017 [3] Liu, G., Larson, E.D., Williams, R.H., Kreutz, T.G., Guo, X. Making Fischer-Tropsch Fuels and Electricity from Coal and Biomass: Performance and Cost Analysis. Energy Fuels 2011; 25: 415–437 [4] Baliban, R.C., Elia, J.A., Floudas, C. A. Simultaneous process synthesis, heat, power, and water integration of thermochemical hybrid biomass, coal, and natural gas facilities. Comp Chem Eng 2012. doi:10.1016/j.compchemeng.2011.10.002 [5] http://www.tradingeconomics.com/commodity-/natural-gas (last seen April 2012)
21
[6] http://geology.com/energy/shale-gas. [7] Sumi. L. Shale Gas:Focus on the Marcellus Shale. for the oil & gas accountability project/ earthworks, MAY 2008 [8] Martín, M., Grossmann, I.E. Energy optimization of lignocellulosic bioethanol production via gasification AIChE J 2011; 57(12): 3408- 3428 [9] Martín, M., Grossmann, I.E. Energy Optimization of Bioethanol Production via Hydrolysis of Switchgrass AIChE J. 2012; 58(5): 1538-1549 [10] Martín, M., Grossmann, I.E. (2012) Simultaneous optimization and heat integration for biodiesel production from cooking oil and algae. Ind. Eng. Chem Res DOI: 10.1021/ie2024596 [11 ] Jarvis E.E. (2008) Aquatic Species Program (ASP): Lessons Learned http://www.nrel.gov/biomass/pdfs/jarvis.pdf (last accessed June 2012) [12] http://www.exxonmobil.com/Corporate/energy_vehicle_algae.aspx (last seen June 2012) [13] Teles, U.M., Fernandes, F.A.N. Hydrocracking of Fischer – Tropsch Products. Optimization of Diesel and Nafta Cuts. Chem Biochem Eng Q 2008; 22: 227-231 [14] Kim, Y.H., Jun, K.-W., Joo, H., Han, C., Song, I.K. A simulation study on gas-to-liquid (natural gas to Fischer-Tropsch synthetic fuel) process optimization, Chem Eng J 2009; 155 (1-2): 427-432 [15] Swanson, R.M., Platon, A., Satrio, J.A:, Brown, R.C. Techno-economic analysis of biomass-to-liquids production based on gasification. Fuel 2010; 89 (Suppl. 1): S11-S19 [16] Martín, M., Grossmann, I.E. Process optimization of FT- Diesel production from biomass. Ind Eng Chem Res 2011b; 50 (23):13485–13499 [17] Rand, D.A.J., Dell, R.M. Hydrogen Energy Challenges and Prospects The Royal Society of Chemistry, Thomas Graham House, Science Park, Milton Road, Cambridge CB4 0WF, UK ISBN: 978-0-85404-597-6. 2008. [18] Wang, Y., Fan, W., Liu, Y., Zeng, Z., Hao, X., Chang, M., Zhang, C., Xu, Y., Xiang, H., Li, Y. Modeling of the Fischer–Tropsch synthesis in slurry bubble column reactors. Chem Eng Process 2008; 47: 222–228 [19] Opdal O. Skreiberg O. Production of synthetic biodiesel via Fischer-Tropsch synthesis Biomass-To-Liquids in Namdalen, Norway Project report by Olav A. Opdal Department of Energy & Process engineering Faculty of Engineering Science and Technology Norwegian University of Science and Technology. 2006 [20] Dry, M.E. The Fischer–Tropsch process: 1950–2000. Catal Today 2002; 71: 227–241 [21] Bezergianni, S., Kalogianni, A., Vasalos, I. A. Hydrocracking of vacuum gas oil-vegetable oil mixtures for biofuels production. Bioresour Technol 2009; 100: 3036–3042 [22] Mani, S. , Tabil, L.G., Sokhansanj, S. (2004) Grinding performance and physical properties of wheat and barley straws,corn stover and switchgrass. Biomass Bioener 2004; 27: 339 – 352 [23] Bridgwater, A.V. Renewable fuels and chemicals by thermal processing of biomass. Chem Eng J 2003; 91: 87–102 [24] Phillips, S., Aden, A., Jechura, J. and Dayton, D., Eggeman, T. Thermochemical Ethanol via Indirect Gasification and Mixed Alcohol Synthesis of Lignocellulosic Biomass. Technical Report, NREL/TP-510-41168, April 2007

22
[25] Vernon P.D.F., Green, M.L.H., Cheetham, A.K., Ashcroft, A.T. Partial oxidation of methane to synthesis gas Catal Lett 1990; 6(2): 181-186 [26] Deutschmann, O., Schmidt, L.D. Two-dimensional modeling of partial oxidation of methane on rhodium in a short contact time reactor Twenty-Seventh Symposium (International) on Combustion/The Combustion Institute, 2283–2291. 1998. [27] George, D:L. Bowles, E.B. Shale gas measurement and associated issues. Pipe and Gas J. 2011, 238 (7) http://www.pipelineandgasjournal.com/shale-gas-measurement-and-associated-issues?page=show (last accessed March 2012) [28] Bullin, K.A., Krouskop, P.E. (2009) Compositional variety complicates processing plans for US shale gas, Oil and Gas Journal. 107, 10. http://www.ogj.com/articles/print/volume-107/issue-10/special-report/compositional-variety-complicates-processing-plans-for-us-shale-gas.html [29]Goellner, J. F. Expanding the Shale Gas Infrastructure. CEP. August 2012. 49-52 [30] Roh, H-S., Lee, D.K., Koo, K.Y., Jung, U.H., Yoon, W.L. Natural gas steam reforming for hydrogen production over metal monolith catalyst with efficient heat-transfer. Int J Hydrogen 2010; 35 (3): 1613-1619 [31] Martelli, E., Kreutz, T., Consonni, S. Comparison of coal IGCC with and without CO2 capture and storage: Shell gasification with standard vs. partial water quench Energy Procedia . 2009; 1: 607-614 [32] Olofsson, I., Nordin, A.,
and Söderlind, U. Initial Review and Evaluation of Process Technologies and
Systems Suitable for Cost-Efficient Medium-Scale Gasification for Biomass to Liquid Fuels Ingemar ISSN 1653-0551 ETPC Report 05-02. 2005 [33] Neves, C. F. C, Schvartzman, M.M. A.M Separaçao de CO2 per meio da tecnología PSA Quim. Nova, 2005; 28: 622-628. [34] Choi, D., Chipman, D. C., Bents, S.C., Brown, R. C. A Techno-economic Analysis of Polyhydro-xyalkanoate and Hydrogen Production from Syngas Fermentation of Gasified Biomass Appl Biochem Biotechnol 2010; 160(4):1032-1046. [35] Choi, Y., Stenger, H. G. Water gas shift reaction kinetics and reactor modeling for fuel cell grade hydrogen J. Power Sources 2003; 124: 432–439 [36] Martín, M., Grossmann, I.E. Energy optimization of Hydrogen production from biomass. Comp Chem Eng 2011c; 35 (9): 1798-1806 [37] Ko, D., Siriwardane, R., and Biegler, L.T .Optimization of a Pressure-Swing Adsorption Process Using Zeolite 13X for CO2 Sequestration. Ind Eng Chem Res 2003; 42 (2): 339-348 [38] Reynolds, S., Ebner, A., Ritter, J. (2005) New Pressure Swing Adsorption Cycles for Carbon Dioxide Sequestration. Adsorption, 2005; 11 (Suppl. 1): 531-536 [39] GPSA Engineering_Data_Book FPS VERSION 21-10. 2004 [40] Nexant Inc. Equipment Design and Cost Estimation for Small Modular Biomass Systems, Synthesis Gas Cleanup, and Oxygen Separation Equipment Task 2: Gas Cleanup Design and Cost Estimates – Black Liquor Gasification Subcontract Report NREL/SR-510-39944 May 2006
23
[41] Nexant Inc. Equipment Design and Cost Estimation for Small Modular Biomass Systems, Synthesis Gas Cleanup, and Oxygen Separation Equipment Task 9: Mixed Alcohols From Syngas — State of Technology Subcontract Report NREL/SR-510-39947 May 2006 [42] Nexant Inc. Equipment Design and Cost Estimation for Small Modular Biomass Systems, Synthesis Gas Cleanup, and Oxygen Separation Equipment Task 2.3: Sulfur Primer Subcontract Report NREL/SR-510-39946 May 2006 [43] van der Laan, G.P., and Beenackers, A.A.C.M., Kinetics and selectivity of the Fischer-Tropsch synthesis: a literature review. Catal Revs Sci Eng 1999; 41: 255-318 [44] Mazzone, L.C.A., Fernandes, F.A.N. Modelling of Fischer – Tropsch synthesis in tubular reactor. Latin Am Appl Res 2006; 36: 141-148 [45] Schulz, H., Schaub, G., Claeys, M., and Riedel, T. Transient initial kinetic regimes of Fischer-Tropsch synthesis App Cat A 1999; 186: 215-227. [46] Fürnsinn, S., Ripfel, K., Rauch, R., Hofbauer, H. Diesel aus Holz - Die FS Synthese als zukunftsweisende Technologie zur Gewinnung flüssiger Brennstoffe aus Biomasse, 4. Internationale Energiewirtschaftstagung an der TU Wien, 2005 [47] Yuan W., Vaughan G.C., Roberts C.B., Eden M.R. Modeling and Optimization of Supercritical Phase Fischer-Tropsch Synthesis, Computer Aided Chemical Engineering, 2011; 29B: 1929-1933. [48] Park C. S. and Norbeck J. M. Synthetic diesel production from Carbonaceous Feed Stocks. 2009 www.eri.ucr.edu/ISAFXVCD/ISAFXVAF/SyDPCFS.pdf [49] Hyun-Seob, S., Ramkrishna, D., Trinh, S., Wright, H. Operating Strategies for Fischer-Tropsch Reactors: A Model-Directed Study, Korean J Chem 2004; 21: 308-317. [50] Speight, J.G. The Chemistry and Technology of Petroleum. 2nd Edition. Marcel Dekker Inc., New York. 1991. [51] Parkash, S. Refining Process Handbook. Gulf Professional Publishing Elseviewer. 2003 [52] Jones, D.S.J. Pujadó, P. R. Handbook of petroleum processing. Springer. 2006. [53] Marcel-Dekker Encyclopedia of Chemical Processing and Design, 1997 [54] More, R.K., Bulasara, V. K., Uppaluri, R., Banjara, V. R. Optimization of crude distillation system using Aspen Plus: Effect of binary feed selection on grass-root design. Chem Eng Res Des 2010; 88: 121–134 [55] Yee, T.F., Grossmann, I.E. Simultaneous optimization models for heat integration – II. Heat exchanger networks synthesis. Comp Chem Eng 1990; 28: 1165-1184. [56] Sinnot, R.K. Coulson and Richardson, Chemical Engineering. 3ªEd. Butterworth Heinemann, Singapur. 1999 [57] http://www.wtrg.com/daily/gasprice.html ( Aug 2011) [58] Franceschin, G., Zamboni, A:, Bezzo, F., Bertucco, A., Ethanol from corn: a technical and economical assessment based on different scenarios. Chem Eng Res Des 2008; 86 (5): 488-498 [59] Balat, M., Balat, H., Öz, C. Progress in bioethanol processing. Prog Energy Combust Sci, 2008; 34 (5): 551-573

24
[60] Forsberg, C. W. Gorensek, M.B. Relative Economic Incentives for Hydrogen from Nuclear, Renewable, and Fossil Energy Sources American Institute of Chemical Engineers Annual Meeting Salt Lake City; November 4–9, 2007 [61] Smith, R., Varbanov, P. What’s the price of Steam? CEP, 2005, July 29-33