optimal timing in trading japanese equity mutual funds ... · a comparative analysis shows that an...
TRANSCRIPT

91
Optimal Timing in TradingJapanese Equity Mutual Funds:
Theory and Evidence
Hiroatsu Tanaka and Naohiko Baba
Hiroatsu Tanaka: Faculty of Economics, University of Tokyo (E-mail: [email protected])
Naohiko Baba: Financial Markets Department, Bank of Japan (E-mail: [email protected])
This paper is a translation of the authors’ paper that appeared in the June 2003 issue of Kin’yuKenkyu (Monetary and Economic Studies). The translation was prepared in collaboration withSachiko Suematsu and Sayako Konno, Bank of Japan. We thank staff members of the Bank of Japan, particularly Toyoichiro Shirota, for helpful comments and suggestions. We benefited fromdiscussions with Professor Hitoshi Takehara and other participants at the workshop on the Japanesestock market held on May 17, 2002 by the Bank of Japan. We are also grateful to Professor MakotoSaito and two anonymous referees for their useful comments. The mutual fund data were providedby the Japan Investment Trust Research Institute.
MONETARY AND ECONOMIC STUDIES/OCTOBER 2003
This paper provides both theoretical and empirical analyses of marketparticipants’ optimal decision-making in trading Japanese equity mutualfunds. First, we build an intertemporal decision-making model underuncertainty in the presence of transaction costs. This setting enables us toshed light on the investors’ option to delay investment. A comparativeanalysis shows that an increase in uncertainty over the expected rate ofreturn on mutual funds has a negative impact not only on market partici-pants’ buying behavior but also on their selling behavior. In addition, aseveral percent increase in front-end loads and redemption fees is likely tochange the optimal holding ratio of mutual funds in investors’ portfolios,by up to 10 percent. Second, we empirically examine the theoretical impli-cations using daily transaction data of selected equity mutual funds inJapan. By estimating a panel data model, we conclude that for the sampleperiod, from August 2000 to July 2001, investment behavior has beenrational in light of our theoretical model. Our results suggest that investorsare likely to rationally postpone their purchases of equity mutual fundsunder the present circumstances of low expected returns, high degree ofuncertainty, and high trading costs.
Keywords: Mutual funds; Asset allocation; Fees; Uncertainty; Panel dataJEL Classification: G11, G12, G29
MONETARY AND ECONOMIC STUDIES/MARCH 2004
DO NOT REPRINT OR REPRODUCE WITHOUT PERMISSION.

I. Introduction
In recent years, demand for financial asset management services has picked up in Japan,as individuals have increasingly taken diversification of their financial asset holdingsmore seriously. In particular, equity mutual funds (hereafter, mutual funds) havebecome popular as an investment vehicle with the following features: (1) diversificationeffects through portfolio investment; (2) low transaction costs made possible throughscale merits stemming from managing large-scale portfolios; and (3) visibility of performance evaluation, which is measured by market prices. Mutual funds are also recognized as strategically important products for securities companies and other salescompanies, because they can charge commissions and trading fees on the outstandingamount of the funds’ net assets. Securities companies can thus enhance their profit-generating base from one that relies on trading fees generated from each order, or flow of trades, to one based on the outstanding amount of each fund’s net assets.
Contrary to expectations of increasing demand for mutual funds, the total out-standing amount of equity mutual funds stood at only ¥15 trillion at the end of 2001 amid the downturn in the Japanese economy and the equity markets. This figureis much less than the peak of ¥46 trillion at the end of 1989 during the speculative bubble period. In addition, demand for bond mutual funds, which had been on asteady rise, has recently waned. Investors have been selling these funds, as they lost confidence in the performance of these funds after some money market funds (MMFs) marked negative returns (Figure 1).1
These events highlighted the risks associated with mutual funds in Japan, leading tovarious attempts to examine the points at issue surrounding mutual funds in Japan.Most existing studies, however, have focused on ex post performance reviews of mutualfunds.2 Studies directly focusing on investors’ trading behavior have been rare.3
Also, arguments in this area seem confused, partly because understanding of investors’decision-making is still shallow. That is, on one hand, investors are called upon to bemore responsible for their investments, and this tendency is increasing the importanceof investor education. On the other hand, the typical investment guideline, stating that ideal asset management is to buy and hold assets over long periods almost blindly,no matter how market conditions change, seems to be widely accepted.
To shed light on how investors decide when to trade mutual funds, this papermodels the decision-making process of an investor who optimizes his or her asset
92 MONETARY AND ECONOMIC STUDIES/MARCH 2004
1. On September 17, 2001, the Meiji-Dresdner MMF marked negative returns due to the default of the MycalGroup. On November 29, 2001, the MMFs of four companies, including Nikko Asset Management and UFJPartners, also recorded negative returns.
2. Cai, Chan, and Yamada (1997) find that Jensen’s �, which, in loose terms, represents the profits from mutualfunds, takes a significantly negative value by examining the performance of domestic equity mutual funds withmulti-factor models. Such results may explain the low performance of domestic equity mutual funds in Japan,dubbed the “Japanese open-end puzzle” (Brown et al. [2001]). A recent study by Takehara and Yano (2001), however, find that these empirical results need some reservations in terms of statistical robustness. They show thatthe results may change depending on which variables are used as independent variables by estimating a similarmodel using the data from 1995, in which reforms in mutual funds regulation were launched. See Takayama(2000) for a comprehensive survey in this area.
3. Although such studies are not extensively done in Japan, that is not the case in the United States and European countries. Literature includes Chevalier and Ellison (1997), Gruber (1996), Sirri and Tufano (1998), and Zheng (1999).

holdings over a long-term horizon. Our model follows the dynamic asset allocationmodel of Constantinides (1986) and Dumas and Luciano (1991). Use of the dynamicmodel enables us to analyze investors’ optimal timing in trading mutual funds and thusexplore effects of transaction costs and uncertainty over expected returns on investors’trading strategies.4 That is, investors have the option to not only choose betweentrading and not trading “immediately,” but also delay trading, which we will call the“option to wait.” As a corollary to financial options, trading costs and uncertaintyover returns are expected to have a large impact on the value of the option to wait.Here, we should note the importance of distinguishing between two types of costs:(1) the costs imposed in each holding period, which change the equilibrium ratio ofmutual fund holdings; and (2) the trading costs imposed when buying and sellingmutual funds, which determine the timing of trading. In fact, we observe an upwardrevision trend for various transaction costs associated with equity mutual funds in Japan (Figure 2 and the Appendix).5 Also, the volatility of the Tokyo Stock
93
Optimal Timing in Trading Japanese Equity Mutual Funds: Theory and Evidence
4. As described later in Section III, in most existing studies, various transaction costs are lumped together and justsubtracted from total returns for convenience, regardless of when they are actually charged.
5. Deregulation in the mutual fund industry has moved forward since the 1990s. For example, (1) foreign mutualfunds were allowed to enter the Japanese markets in the early 1990s, and (2) authorized sellers, formerly restrictedto securities companies, were expanded to include banks and investment funds in the second half of the 1990s.Foreign mutual funds, however, continued to promote products attractive to securities companies, aiming toincrease their market share by making full use of their existing branch network and strong sales forces. This maypartly explain why front-end loads continued on an upward trend. Note here that the results shown in Figure 2cover only those for general domestic equity mutual funds and are averages across funds. As such, the increase in
Figure 1 Net Outstanding Amount of Mutual Funds
¥ trillions
Tokyo Stock Price Index (TOPIX) (right scale)
Equity mutual funds(left scale)
Bond mutual funds(left scale)
60
50
40
30
20
10
0
3,000
2,500
2,000
1,500
1,000
500
01988 89 90 91 92 93 94 95 96 97 98 99 012000

94 MONETARY AND ECONOMIC STUDIES/MARCH 2004
Figure 2 Transaction Fees of General Domestic Equity Mutual Funds
Percent3.5
3.0
2.5
2.0
1.5
1.0
0.5
0.0
Front-end loads (buying costs)Redemption fees (selling costs)Administrative fees (holding costs, annualized)
1990 91 92 93 94 95 96 97 98 99 2000
Price Index (TOPIX) seems to be higher recently (Figure 3).6 This paper explores how these changes influence investors’ trading behavior for mutual funds under theframework of dynamic asset allocation.
Furthermore, we will take one step forward to empirically examine the theoreticalimplications derived by our model. To this end, we will construct three fund flowindicators, (1) a turnover ratio, (2) a buying ratio, and (3) a selling ratio as dependentvariables in a panel data model where we control other factors specific to each fund.
This paper is organized as follows. Section II describes the theoretical model.Section III provides the results and implications of the theoretical model. Section IVestimates the empirical model, and Section V summarizes the implications of theempirical results. Section VI concludes the paper.
II. Modeling Investor Behavior
A. The ModelIn this section, we build a dynamic optimization model to analyze mutual fundinvestment strategies based on Constantinides (1986), and Dumas and Luciano
average front-end fees amid the recent introduction of no-load funds would lead to the observation that the loadfunds are generally charging higher fees and that the range of fees is becoming wider. In addition, various types ofdiscounts are given to attract investors.
6. Since there is no appropriate benchmark performance indicator for the entire equity mutual fund population, we use the volatility of the TOPIX as a proxy. Note that the uncertainty over future performance is important in this context and not the historical volatility. Therefore, we estimate the conditional standard deviation of daily returns on the TOPIX by GARCH (1, 1) in addition to the historical volatility of the TOPIX over the past60 days. But we found no significant differences between the two volatility measures.

(1991).7 The underlying assumptions are as follows. A representative investor’s portfolio comprises two types of assets: risk-free assets and risky mutual funds.8 Theinvestor rebalances his or her portfolio by buying and selling mutual funds to keepthe portfolio allocation in a certain optimal range.9 The investor gains utility by consuming a fixed proportion of his or her risk-free assets. The investor is risk-averse,and his or her utility function in each period is C (t )�/�, with the coefficient of relative risk aversion �̂ ≡ (1 − �)10 held constant, where C (t ) represents consumptionin period t. The investor makes investment decisions to maximize the discountedvalue of the future stream of expected utility. We define the investor’s maximumexpected utility U as
95
Optimal Timing in Trading Japanese Equity Mutual Funds: Theory and Evidence
Figure 3 Volatility of the TOPIX (Daily Basis, Annualized)
0.35
0.30
0.25
0.20
0.15
0.101995 96 97 98 99 2000 01
HV (average of previous 60 business days)Conditional st. dev. (GARCH (1,1))
7. Both Constantinides (1986) and Dumas and Luciano (1991) assume that trading costs are equal when buying and selling assets. In reality, however, front-end loads and redemption fees differ depending on mutual funds.Therefore, we will allow for the differences in costs in our model.
8. In reality, a portfolio will likely be composed of more than two assets. But the two-asset model will adequatelyconvey the essence of dynamic investment behavior in the presence of trading costs. For example, Leland (2000)derives similar results in a multiple asset setting, but the model is far less tractable.
9. Keeping the proportion of each asset ina certain range becomes the optimal strategy because we allow for both uncer-tainty over expected returns and the existence of transaction costs. We will elucidate this point in Section III, wherewe run some comparative static analyses. The model in this paper is consistent with actual transactions, where buyingand selling of mutual funds will entail certain costs: front-end loads and redemption fees, respectively. Meanwhile,typical dynamic portfolio selection models such as the Intertemporal Capital Asset Pricing Model (ICAPM) assumea frictionless market with no trading costs for the sake of convenience. As a result, we can solve for a unique equilibrium proportion of asset holdings, which investors maintain throughout their time horizon. Under this setup, investors promptly rebalance their asset allocation once the allocation deviates from the optimal one. Naturally,if the rebalancing costs in the model, �1 and �2, are assumed to be zero, the results will coincide with the ICAPM.
10. We assume � < 1 (≠ 0), or by definition, �̂ > 0.

� C (t )� U = max E0 ∫e −�t ——–dt , (1)0�
with � being a constant discount rate.In addition, the outstanding amount of mutual funds held by the investor is
denoted as VM, and risk-free assets, VF . When trading does not take place, VM followsa geometric Brownian motion, and VF grows at a constant rate of r, as shown inequations (2) and (3):
dVM = (�M − �C )VMdt + �MVMdz, (2)
dVF = rVFdt − Cdt = (r − �)VFdt , (3)
where �M denotes the drift parameter of VM, �C the administrative fees, �M the standard deviation parameter, and dz (= √dt
—, ∼ N (0, 1)) the increment of a
Wiener process. We further assume that the investor consumes a fixed proportion � of his or her risk-free assets each period. This simplified rule is also adopted in Constantinides (1986).11 Therefore, consumption in each period can be written asC ≡ �VF, and the dynamics of VF lead to equation (3).
B. Boundary Conditions for Trading Mutual FundsIn this subsection, we derive the optimal range of mutual fund holdings. In theabsence of trading costs, the optimal strategy is to trade the necessary amount of mutual funds whenever the asset allocation deviates from its optimal state (see also Footnote 10). In the presence of trading costs, however, the trade-off between(1) paying the costs accumulated through rebalancing the investor’s portfolio and (2) the opportunity costs stemming from deviation from its optimal state matters for the investor. Note that without trading costs, the investor need not consider theformer.12 This trade-off causes the investor to temporarily allow his or her portfolioallocations to deviate from the optimal state. Thus, the investor would keep the ratio of mutual fund holdings within an optimal range, rather than target a singleoptimum ratio. Figure 4 shows this behavior.
We now model the portfolio rebalancing behavior mathematically. Let ≡ VM /VF
denote the ratio of mutual fund holdings to risk-free asset holdings, both of whichare in terms of marked-to-market values, and let
–and – denote the upper and lower
boundaries. Then, when – ≤ ≤ –, the investor neither buys nor sells mutual funds,
96 MONETARY AND ECONOMIC STUDIES/MARCH 2004
11. In this paper, we calculate � from the optimal portfolio allocations derived by the ICAPM (see Footnote 10) andconsumption schedule. Constantinides (1986) uses a slightly different method, solving for � that maximizes theinvestor’s utility after giving the optimal portfolio allocations derived by the ICAPM. However, he points out that(1) imposing trading costs generates both a substitution and income effect on �, and which effect dominates is nota priori obvious, (2) simulation results show a small effect of trading costs on �, and (3) changes in the parameterssuch as risk aversion and uncertainty over the risky asset’s expected return have the same qualitative effects on �, withor without trading costs. Therefore, our treatment of � should not detract from our analysis of investor behavior.
12. Leland (2000) models this trade-off explicitly. In his models, he defines “tracking error” as the difference betweenthe investor’s utility from an optimal portfolio and that from a non-optimal one. The investor’s goal is to minimizehis loss function, which is defined as the sum of the tracking error and trading costs in rebalancing.

letting the ratio of mutual fund holdings fluctuate according to the dynamicsdescribed by equations (2) and (3). Moreover, the following no-arbitrage condition(4) holds for the maximum expected utility U.13 Applying Ito’s Lemma to equation(4), we get equation (5):
97
Optimal Timing in Trading Japanese Equity Mutual Funds: Theory and Evidence
13. Just multiplying both sides of the following Bellman equation by (1 + ��t )/�t and letting �t go to zero yieldsequation (4), which is a continuous-time version of the equation below:
C (VF ,VM, �, t )� 1 U(VF,VM, t ) = max ——————�t + ———–E [U(VF′, VM′, t + �t )VF,VM, �], � � 1 + ��t
Figure 4 Dynamic Investor Behavior
Ratio of mutual fund holdings
Optimal ratio of mutual fundholdings before changes
in expected returns
Optimal ratio of mutualfund holdings after changes
in expected returns
Changes in expected returns
Time
Ratio of mutualfund holdings
Time
Optimal holding ratiobefore changes inexpected returns
Actual path of mutualfund holdings
Optimal ratio after changesin expected returns
Changes in expected returns
[1] With No Trading Costs
[2] With Trading Costs
Note: Light-colored arrows denote buying of mutual funds, and shaded arrows denoteselling of mutual funds.
Note: Light-colored arrows denote buying of mutual funds, shaded arrows denote sellingof mutual funds, and the shaded band denotes the optimal holding range.

C � 1 ρU (VF ,VM) = —– + —–E [dU (VF ,VM)], (4)� dt
C � �M2
—– + (rVF − C )UF + (� − �C)VMUM + —–VM2UMM − �U = 0, (5)� 2
where UF ≡ U / VF,UM ≡ U / VM, and UMM ≡ U 2/ 2VM. When reaches the lower boundary –, the investor buys additional mutual funds
to raise . Conversely, when reaches the upper boundary –, the investor lowers by
selling part of his or her mutual fund holdings. We can incorporate this behavior intoour model by imposing boundary conditions on equations (4) or (5) in the followingmanner. At the lower boundary –, the investor will sell (1 + �1)dL units of risk-freeassets, and buy dL units of mutual funds,14 where �1 represents the front-end loadscharged when the investor buys mutual funds. This also implies that the amount oftotal assets will decrease by �1dL. For the dynamic optimal conditions to be satisfied,however, no jumps are allowed in the investor’s utility level before and after rebalanc-ing the portfolio. Therefore, equation (6-1) must hold at –. Equation (6-1) statesthat utility lies on a single indifference curve, regardless of changes in VF and VM,which implies that equation (6-1) is equivalent to equation (6-2):
U (VF––, VM–– ) = U (VF–– − (1 + �1)dL, VM–– + dL ), (6-1)
(1 + �1)UF (VF––, VM–– ) = UM (VF––, VM–– ), (6-2)
where VF–– and VM–– denote risk-free asset and mutual fund holdings at –, respectively.Note that VF–– andVM–– satisfy – =VM–– /VF––.
We can derive the following equations (7-1) and (7-2) for the upper boundary –
in a similar way:
U (VF
––, VM
––) = U (VF
–– + (1 − �2)dH, VM
–– − dH ), (7-1)
(1 − �2)UF (VF
––, VM
––) = UM (VF
––, VM
––), (7-2)
where VF
––and VM
––satisfy
– = VM
––/VF
––as above, and �2 denotes the redemption fees,
and dH the amount of mutual funds sold when reaches –.15 Equations (6) and
(7) are called “value-matching conditions.” To completely characterize the optimaltrading strategy, we need additional conditions (8) and (9):
98 MONETARY AND ECONOMIC STUDIES/MARCH 2004
where � denotes the switching parameter that represents the choice of whether or not to rebalance and VF′ andVM′ denote the states of VF and VM after time period �t . The left-hand side of equation (4) is the total return interms of utility the investor would require over an infinitesimal time period, discounted by �. The right-handside is the expected total return over an infinitesimal time period, the first term being income gain, and the secondterm being the capital gain or loss if negative. In this sense, the equality represents a no-arbitrage condition.
14. The amount of mutual funds bought at the lower boundary – is infinitesimal, as with the amount sold at theupper boundary
–. This is because the trading costs we consider here are proportional to the trading volume so
that the minimum amount of reallocation inherently becomes the optimum strategy. On the other hand, givenlump-sum trading costs, incentives to rebalance assets on a larger scale will arise.
15. We can incorporate trading behavior into equations (2) and (3) to obtain the following equations (2′ ) and (3′ ).These equations are called “regulated geometric Brownian motion”:

− (1 + �1)UFF (VF––, VM–– ) + UFM(VF––, VM–– )(8)= − (1 + �1)UMF (VF––, VM–– ) + UMM(VF––, VM–– ) = 0,
(1 − �2)UFF (VF
––, VM
––) − UFM(VF
––, VM
––)(9)= (1 − �2)UMF (VF
––, VM
––) − UMM(VF
––, VM
––) = 0.
These are the “smooth-pasting conditions.”16 These conditions ensure that no intertemporal arbitrage opportunities exist, and together with the value-matchingconditions, we can pin down the optimal boundaries, i.e., the optimal range ofmutual fund holdings.
To sum up, the optimal boundaries can be obtained by solving the partial differ-ential equation (6) subject to boundary conditions (6) through (9). Note that sinceU (VF ,VM) is homogeneous of degree �:
VMU (VF ,VM) ≡VF�u(—–) = VF
�u ( ). (10) VF
Hence, we can substitute equation (10) into (5) to obtain the following ordinary differential equation (11), which is much easier to handle:
1 —�M2 2u′′( ) + (� − �C − r + � )u′( ) − {� − �(r − �)}u ( )
2 � γ
+ —– = 0. (11)γ
Equation (11) has the general solution:
� γ
——————– + A1 s1 + A 2 s 2, (12)γ {� − �(r − �)}
where A1 and A 2 are free parameters to be determined, and s1 and s2 are the roots ofthe following quadratic equation (13):
�M2 �M
2
—–s 2 + (� − �C − r + � − —–)s − {� − �(r − �)} = 0. (13)2 2
99
Optimal Timing in Trading Japanese Equity Mutual Funds: Theory and Evidence
dVM = (�M − �C)VMdt + �MVMdz + dL − dH, (2′ )
dVF = (r − �)VFdt + (1 − �2)dH − (1 + �1)dL, (3′ )
where dL is positive when = – (zero otherwise), and dH is positive when = –
(zero otherwise).16. In mathematical terms, smooth-pasting conditions require the derivatives of the value function (or utility function
in our model) to take the same value at the boundary. Generally, smooth-pasting conditions are expressed by thefirst derivative of the value function, but when they are expressed by the second derivative as in equations (8) and(9), they are labeled “super-contact conditions.” See Dumas (1991) for details.

Note that conditions (6) to (9) can be rewritten in terms of using equation (10).Thus, substituting equation (12) into the rewritten expressions of (6) to (9) yields thefollowing equations:
(1 + �1){1 + a1(� − s1)–s1 + a 2(� − s2)–
s2}= a1s1–
s1−1 + a 2s2–s 2−1, (14)
(1 − �2){1 + a1(� − s1)–s1 + a 2(� − s2)
–s2}= a1s1
–s1−1 + a 2s2– s 2−1, (15)
−(1 + �1)2{� − 1 + a1(� − s1)(� − s1 − 1)–s1
+ a 2(� − s2)(� − s2 − 1)–s 2}
+ (1 + �1){a1(� − s1)s1–s1−1 + a2(� − s2)s2–
s 2−1} (16)= {a1s1(s1 − 1)–
s1−2 + a 2s2(s2 − 1)–s 2−2}
− (1 + �1){a1(� − s1)s1–s1−1 + a2(� − s2)s2–
s 2−1} = 0,
(1 − �2)2{� − 1 + a1(� − s1)(� − s1 − 1)–s1
+ a 2(� − s2)(� − s2 − 1)–s2}
−(1 − �2){a 1(� − s1)s1–s1−1 + a 2(� − s2)s2
–s2−1} (17)= −{a1s1(s1 − 1)
–s1−2 + a 2s2(s2 − 1)–s2−2}
+ (1 − �2){a1(� − s1)s1–s1−1 + a2(� − s2)s2
–s2−1} = 0,
where a1 ≡ A1{� − �(r − �)}/��, and a 2 ≡ A 2{� − �(r − �)}/��. We can find a solutionfor a1, a2, –, and
–using numerical methods.17
III. Theoretical Implications
A. Comparative Analysis of the Model In this section, we intuitively discuss the effects of the model parameters on mutualfund investment behavior by showing results of the comparative analysis (summa-rized in Figures 5 and 6).18 Instead of analyzing as such, we define the ratio ofmutual fund holdings to total asset holdings as � ≡ /(1 + ) (hereafter, the ratio ofmutual fund holdings) and focus on its response to changes in the model parameters.1. Front-end loads and redemption fees (�1, �2)a. SimilaritiesResults show that these trading costs influence the investor’s behavior in the followingtwo ways. First, the presence of the costs (�1, �2) creates an optimal range of mutualfund holdings as mentioned in the previous section. In other words, when trading
100 MONETARY AND ECONOMIC STUDIES/MARCH 2004
17. We use the Levenberg-Marquardt method included in Mathcad 2001 as a solving algorithm.18. The baseline values of parameters are set as follows:
r = 0.5 percent, �M = 4 percent, �M = 18 percent, � = −1, � = 12 percent, �1 = 2 percent, �2 = 1 percent, �C = 1.5 percent.
We conduct our analysis by varying each parameter in the following ranges while fixing the other parameters at their base values: �M(0 to 5 percent), �M(10 to 30 percent), �(−5 to −1), �1, �2, �C(0 to 4 percent each).Although the values are set somewhat arbitrarily, we think that they are as realistic as possible.

101
Optimal Timing in Trading Japanese Equity Mutual Funds: Theory and Evidence
Note: Baseline values of parameters: r = 0.5 percent, �M = 4 percent, �M = 18 percent, � = –1, � = 12 percent, �1 = 2 percent, �2 = 1 percent, and �C = 1.5 percent.
Figure 5 Simulation Results (1)
M
0.8
0.7
0.6
0.5
0.4
0.3
0.2
0.1
0.0
0.8
0.7
0.6
0.5
0.4
0.3
0.2
0.1
0.0
0.8
0.7
0.6
0.5
0.4
0.3
0.2
0.1
0.0
0.00
0
0.00
2
0.00
4
0.00
6
0.00
8
0.01
0
0.01
2
0.01
4
0.01
6
0.01
8
0.02
0
0.02
2
0.02
4
0.02
6
0.02
8
0.03
0
0.03
2
0.03
4
0.03
6
0.03
8
0.04
0
0.04
2
0.04
4
0.04
6
0.04
8
0.05
0
0.10
0
0.10
8
0.11
6
0.12
4
0.13
2
0.14
0
0.14
8
0.15
6
0.16
4
0.17
2
0.18
0
0.18
8
0.19
6
0.20
4
0.21
2
0.22
0
0.22
8
0.23
6
0.24
4
0.25
2
0.26
0
0.26
8
0.27
6
0.28
4
0.29
2
0.30
0
–1.0
0
–1.1
6
–1.3
2
–1.4
8
–1.6
4
–1.8
0
–1.9
6
–2.1
2
–2.2
8
–2.4
4
–2.6
0
–2.7
6
–2.9
2
–3.0
8
–3.2
4
–3.4
0
–3.5
6
–3.7
2
–3.8
8
–4.0
4
–4.2
0
–4.3
6
–4.5
2
–4.6
8
–4.8
4
–5.0
0
�
M�
�
Optimal holding ratio without costs
Optimal holding range in the presence of trading costs
Optimal holding ratio with administrative fees
Optimal holding ratio without costs
Optimal holding range in the presence of trading costs
Optimal holding ratio with administrative fees
Optimal holding ratio without costs
Optimal holding ratio with administrative fees
Optimal holding range in the presence of trading costs

102 MONETARY AND ECONOMIC STUDIES/MARCH 2004
Note: Baseline values of parameters: r = 0.5 percent, �M = 4 percent, �M = 18 percent, � = –1, � = 12 percent, �1 = 2 percent, �2 = 1 percent, and �C = 1.5 percent.
Figure 6 Simulation Results (2)
1
0.8
0.7
0.6
0.5
0.4
0.3
0.2
0.1
0.0
0.8
0.7
0.6
0.5
0.4
0.3
0.2
0.1
0.0
0.00
0
0.00
2
0.00
4
0.00
6
0.00
8
0.01
0
0.01
2
0.01
4
0.01
6
0.01
8
0.02
0
0.02
2
0.02
4
0.02
6
0.02
8
0.03
0
0.03
2
0.03
4
0.03
6
0.03
8
0.04
0
�
2
0.00
0
0.00
2
0.00
4
0.00
6
0.00
8
0.01
0
0.01
2
0.01
4
0.01
6
0.01
8
0.02
0
0.02
2
0.02
4
0.02
6
0.02
8
0.03
0
0.03
2
0.03
4
0.03
6
0.03
8
0.04
0
0.8
0.7
0.6
0.5
0.4
0.3
0.2
0.1
0.0
0.00
0
0.00
2
0.00
4
0.00
6
0.00
8
0.01
0
0.01
2
0.01
4
0.01
6
0.01
8
0.02
0
0.02
2
0.02
4
0.02
6
0.02
8
0.03
0
0.03
2
0.03
4
0.03
6
0.03
8
0.04
0
�
C�
Optimal holding ratio without costs
Optimal holding range in the presence of trading costs
Optimal holding ratio with administrative fees
Optimal holding ratio without costs
Optimal holding range in the presence of trading costs
Optimal holding ratio with administrative fees
Optimal holding ratio without costs
Optimal holding range in the presence of trading costs
Optimal holding ratio with administrative fees
costs increase, the investor becomes more reluctant to trade mutual funds even if his orher holdings deviate from the optimal level. Thus, front-end loads and redemption feesare possible factors that inhibit mutual fund transactions, but are not directly to blame for the low ratio of mutual fund holdings in the investor’s portfolio. In fact, when themarket values of mutual funds increase, the share of mutual fund holdings may bemaintained at a higher level than in the case with no trading costs.
Second, the optimal mutual fund holdings decrease on average in the presence oftrading costs. This can be confirmed by our numerical results that show both tradingcosts shift the no-transaction region toward risk-free asset holdings.19
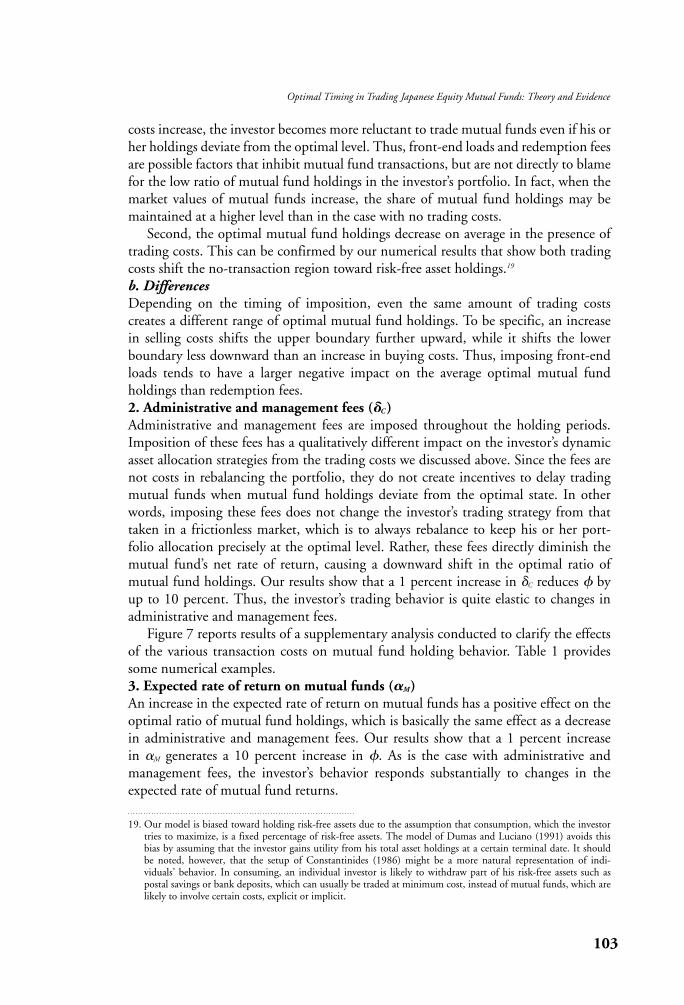
b. DifferencesDepending on the timing of imposition, even the same amount of trading costs creates a different range of optimal mutual fund holdings. To be specific, an increasein selling costs shifts the upper boundary further upward, while it shifts the lowerboundary less downward than an increase in buying costs. Thus, imposing front-endloads tends to have a larger negative impact on the average optimal mutual fundholdings than redemption fees. 2. Administrative and management fees (�C )Administrative and management fees are imposed throughout the holding periods.Imposition of these fees has a qualitatively different impact on the investor’s dynamicasset allocation strategies from the trading costs we discussed above. Since the fees arenot costs in rebalancing the portfolio, they do not create incentives to delay tradingmutual funds when mutual fund holdings deviate from the optimal state. In otherwords, imposing these fees does not change the investor’s trading strategy from thattaken in a frictionless market, which is to always rebalance to keep his or her port-folio allocation precisely at the optimal level. Rather, these fees directly diminish themutual fund’s net rate of return, causing a downward shift in the optimal ratio ofmutual fund holdings. Our results show that a 1 percent increase in �C reduces � byup to 10 percent. Thus, the investor’s trading behavior is quite elastic to changes inadministrative and management fees.
Figure 7 reports results of a supplementary analysis conducted to clarify the effectsof the various transaction costs on mutual fund holding behavior. Table 1 providessome numerical examples. 3. Expected rate of return on mutual funds (�M)An increase in the expected rate of return on mutual funds has a positive effect on theoptimal ratio of mutual fund holdings, which is basically the same effect as a decreasein administrative and management fees. Our results show that a 1 percent increase in �M generates a 10 percent increase in �. As is the case with administrative andmanagement fees, the investor’s behavior responds substantially to changes in theexpected rate of mutual fund returns.
103
Optimal Timing in Trading Japanese Equity Mutual Funds: Theory and Evidence
19. Our model is biased toward holding risk-free assets due to the assumption that consumption, which the investortries to maximize, is a fixed percentage of risk-free assets. The model of Dumas and Luciano (1991) avoids thisbias by assuming that the investor gains utility from his total asset holdings at a certain terminal date. It shouldbe noted, however, that the setup of Constantinides (1986) might be a more natural representation of indi-viduals’ behavior. In consuming, an individual investor is likely to withdraw part of his risk-free assets such aspostal savings or bank deposits, which can usually be traded at minimum cost, instead of mutual funds, which arelikely to involve certain costs, explicit or implicit.

4. Uncertainty over the expected rate of mutual fund returns (�M)In our model, uncertainty over the expected rate of mutual fund returns has a nega-tive effect on mutual fund holdings. One of the reasons is straightforward. Providedthe expected rates of return are the same among assets, the risk-averse investor obviously withdraws from holding riskier assets. This also holds for the case withcostless markets.
Also, trading costs play a significant role in amplifying this effect. The theory ofinvestment decisions under uncertainty in the presence of sunk costs20 states that firmshave the option to delay their investment decisions until uncertainty over future returns
104 MONETARY AND ECONOMIC STUDIES/MARCH 2004
Figure 7 Effects of Various Costs on the Optimal Mutual Fund Holding Ratio
0.70
0.65
0.60
0.55
0.50
0.45
0.40
0.35
0.30
0.25
0.00
0.01
0.02
0.03
0.04
0.05
0.06
0.07
0.08
0.09
0.10
0.11
0.12
0.13
0.14
0.15
0.16
0.17
0.18
0.19
0.20
0.21
0.22
0.23
0.24
0.25
Optimal holding range with buying costs
Optimal holding ratio without costs
Optimal holding range with selling costs
Optimal holding ratio with administrative fees
1, 2, C� � �
Table 1 Numerical Examples (Cost Change from Zero Percent to 3 Percent)
Percent
Front-end loads (�1) Redemption fees (�2)Administrative and
management fees (�C)
Change in upper 54 →56.5 ↑ 54 →57.3 ↑ 54 → 7.7 ↓boundary +2.5 +3.3 −46.3
Change in optimal 54 → 54 → 54 → 54 → 54 → 7.7 ↓holding ratio ±0 ±0 −46.3
Change in lower 54 →47.4 ↓ 54 →48.1 ↓ 54 → 7.7 ↓boundary −6.6 −5.9 −46.3
Notes: 1. Baseline values of parameters: r = 0.5 percent, �M = 4 percent, �M = 18 percent, � = –1, � = 12 percent, and �1 = �2 = �C = 0 percent.
2. Shadows show the existence of an optimal range in holding mutual funds.
20. One example of the representative literature in this field is Dixit and Pindyck (1994).

dissolves at least to some extent. In this setup, an increase in uncertainty will boost the value of the firms’ “waiting option,” which raises the lower boundary of optimalinvestment, inducing a stronger incentive to delay. The mechanism through whichtrading costs influence mutual fund investment can be similarly interpreted. In ourmodel, the investor has an option to rebalance his or her portfolio. By exercising thisoption by paying the costs, the investor can obtain utility from the optimally rebalancedportfolio minus utility from the pre-rebalanced portfolio (in other words, the oppor-tunity cost of delaying rebalance). The opportunity cost of delaying rebalance, Oc, isgiven by equation (18), and the “waiting option” value, F, is given by equation (19):21
T C *+rebalance
� − C *−rebalance
� Oct = Et ∫e −�(�−t )(————————)d� , (18)t �
F0 = max[E0[Oct]e −�t, 0] − Oc 0 . (19) t
“Wait” until the optimal timing t to rebalance Rebalanced immediately
Here, C *+rebalance denotes the maximum consumption flow that can be obtained through
optimal rebalancing, and C *−rebalance denotes the consumption flow that can be obtained
without rebalancing. � in equation (19) denotes the discount rate, and other notationsfollow those in the previous section. Note that the first term on the right-hand side ofequation (19) is an expression analogous to that of an American call option.
In line with the discussion above, the increase in uncertainty over mutual fundreturns boosts the “waiting option” value F0, inducing a greater incentive to delay rebalancing. Thus, the investor becomes more reluctant to both buy and sell mutualfunds. Together with the effects of the investor’s risk-averseness and the bias towardrisk-free assets ascribed to the investor’s consumption schedule, our model suggests substantially negative total effects of uncertainty on mutual fund holdings. In addition, the downward shift of the lower boundary of optimal mutual fund holdingsis likely to exceed that of the upper boundary. Figure 8 provides an intuitive image. Ournumerical analysis shows that the upper and lower boundaries shift downward by 45 percentage points (69 → 24 percent) and 49 percentage points (63 → 14 percent),respectively, in response to a 10 percentage point increase (12 → 22 percent) in �M. 5. Relative risk-averseness (�̂ )When the investor is more risk-averse, the investor will demand a higher return for taking the same risk. Therefore, the optimal ratio of mutual fund holdings should fall, other things equal. Determining its magnitude is not easy, however, sincepreceding studies are quite mixed over the values of estimated coefficient of relativerisk aversion �̂.22
105
Optimal Timing in Trading Japanese Equity Mutual Funds: Theory and Evidence
21. Note that the equations describe the investor’s decision to purchase mutual funds, but we can derive a similar expression for selling.
22. Typically, �̂ is estimated using the following method introduced by Friend and Blume (1975). They define �̂ as�̂ ≡ (E [rr] − rs )/(��), where E [rr] is the expected return on the risky asset, rs the return on the risk-free asset, � the standard deviation of rr, and � the share of risk assets. Estimation results of �̂ vary depending on the data as well as the formula used to calculate E [rr]. For example, �̂ is estimated as around 2 to 4 using a household data sample from 1987 to 1995 by Muramoto (1998), around 0.4 to 1.6 using the sample from 1987 to 1997 bythe Economic Planning Agency (1999), around 11 to 18 using a household sample from 1985 to 1997, oraround 2 to 4 using a life insurance company sample from 1985 to 1997 by Iwasawa (2000).

B. Issues Associated with Evaluating the Cost Burden in Trading Mutual FundsNow we will discuss the significance of adopting a multi-period optimization frame-work by providing some numerical examples. Mutual fund holdings usually incurdifferent types of costs at each phase of trading, namely, buying, holding, and selling.However, it is often assumed that all the relevant costs can merge into a single costmeasure. A typical method of constructing such a “total cost measure” is to firstassume an investment period, and then evenly distribute buying and selling costsacross the period. In other words, this method intends to treat these costs as holdingcosts. For example, if the front-end loads are 3 percent and the administrative fees are2 percent annually, the front-end loads are treated as 1 percent annual (3 percentdivided by three years) administrative fees. Therefore, the annual total cost turns outto be 3 percent (1 percent plus 2 percent).23
To allow for this simplified treatment, the investment horizon must be an exoge-nous constant. However, it is natural to assume that the optimal investment period isendogenously determined and flexibly revised depending on the market environment.In this regard, we can utilize our model24 to clarify the caveats of such a “total cost measure approach,” which converts buying and selling costs into holding costs that arethought of as a discount in the expected rate of mutual fund return.
106 MONETARY AND ECONOMIC STUDIES/MARCH 2004
Figure 8 Effects of Uncertainty
High
Low
Opt
imal
rat
io o
f mut
ual f
und
hold
ing
( )�
Increase in uncertainty ( )M�
Average holding ratio in the presence of trading costs
Optimal holding ratio under zero trading costs and uncertainty
Optimal holding ratio in the presence of trading costs (1) Risk averseness
lowers the optimal holding ratio
(2) A further bias toward risk-free assets in the presence of trading costs
23. This is the basic idea of the “total sharehold cost measure” used by the U.S. Investment Company Institute. See Rea and Reid (1998) for details.
24. See Constantinides (1986) for details of the method. It should be noted, however, that he has restricted his discussion to measuring liquidity premiums, while we adopt a somewhat different interpretation, using the modelto convert one-time buying and selling costs into periodic discounts under a dynamic optimization setup.

Consider the case where an investor endowed with only risk-free assets buysmutual funds entailing front-end loads. Since the costs are proportional to the pur-chased amount, the optimal strategy is to buy as little as possible. Thus, the investorwill buy just enough to satisfy the lower boundary of the optimal ratio of mutualfund holdings.
To evaluate the cost burden of the front-end loads that are evenly distributed over the holding time (note that our model assumes an infinite horizon), we need tocalculate how much of a discount the expected rate of mutual fund return requires to balance between the maximum expected utility when the investor is subjected tofront-end loads, and that gained without loads.
Now suppose the investor’s portfolio consists of only risk-free assets VF ,0. Then the investor rationally buys mutual funds up to the lower boundary of the optimalholding range. After this trading, the investor will have mutual funds VM––, which satisfies equation (20):
–VF ,0VM–– = —————–, (20)1 + (1 + �1)–
and risk-free assets VF––, which satisfies equation (21):
VF ,0VF–– = VF ,0 − (1 + �1)VM–– = ——————. (21)1 + (1 + �1)–
We further assume that the following equation holds:
1 (�M − �C − � − r )2� � −1 (VF ,0)�
U (VF––, VM–– ) = (——–) � − �r − ————————— ——–, 1 − � 2(1 − �)�M
2 �
(22)
where � denotes the discount rate we try to calculate. The left-hand side of equation(22) shows the maximum expected utility the investor can gain when the investorpays front-end loads to construct his or her portfolio at the lower boundary of theoptimal range of mutual fund holdings. The right-hand side shows the maximumexpected utility from the same portfolio in the absence of the loads.25 Equation (22)can be rewritten as equation (23), using equations (20), (21), and (10):
u (–) 1 (�M − �C − � − r )2� �−1 1——————— = (——–) � − �r − ————————— —.{1 + (1 + �1)–}� 1 − � 2(1 − �)�M
2 �
(23)
107
Optimal Timing in Trading Japanese Equity Mutual Funds: Theory and Evidence
25. The ICAPM (see Footnote 10) shows that the maximum expected utility, J , is expressed as follows (also seeMerton [1973] for details):
1 (� − r )2� �−1 (W0)�
J = (———)� − �r − —————– ——– . 1 − � 2(1 − � )�2 �

Now we can solve for � using – in equation (23) as the lower boundary calculated inSection II. Note that equations (22) and (23) show that � is endogenously deter-mined by such variables as the investor’s risk-averseness and uncertainty over themutual fund’s expected returns. For example, an increase in uncertainty over mutualfund returns implies a higher frequency of rebalancing and associated payment oftrading costs. This raises �. We are likely to underestimate � if we simply calculate itby distributing trading costs across some exogenous holding period, since we neglectthe possibility of any additional payments associated with rebalancing in the future.Table 2 provides some numerical examples.
The results in Table 2 show that the converted front-end loads � may be as highas 40 basis points depending on the level of uncertainty.26 As we assume an infiniteinvestment horizon, � will be approximately zero if we calculate according to thetypical over-simplified method. Therefore, the figures we have presented in Table 2can be interpreted as an additional discount due to the consideration of multi-periodoptimization strategy with rebalancing.
108 MONETARY AND ECONOMIC STUDIES/MARCH 2004
Table 2 Relationship between � and Uncertainty over Expected Returns
Percent
�M
15 20 25 30
Discount rate (�) (annualized) 0.28 0.32 0.36 0.40
Note: Baseline values of parameters: r = 0.5 percent, �M = 4 percent, � = –1, � = 12 percent, �1 = �2 = 2 percent, and �C = 1.5 percent.
From this equation, we can derive the right-hand side of equation (22) simply by substituting (1) the discountedexpected return on mutual funds net of administrative fees for the expected return on assets, �, in the above equation, and (2) the amount of risk-free assets the investor is initially endowed with, VF ,0 for the total asset amount,W0. Note that the total asset value remains VF ,0 on the right-hand side of equation (22), which corresponds to thecase of no loads. However, on the left-hand side, where we assume loads are imposed, the amount of total assets issmaller than the initial endowment as indicated below:
1 + –VF–– + VM–– = ——————–VF,0 < VF,0. 1 + (1 + �1)–
26. Constantinides (1986) concludes that the discount rate thus estimated has a second-order effect on equilibriumasset returns. Considering the current extremely low interest rate environment in Japan, however, we think thefigures are not negligible.
IV. Empirical Analyses
A. HypothesesThis section presents hypotheses to be tested using the data of Japanese equitymutual funds. To that end, we construct the following three fund flow indicators: (1) a mutual fund’s buying ratio, which is the amount of each fund bought dividedby the fund’s net asset value; (2) a selling ratio, the amount sold divided by the fund’snet asset value; and (3) a turnover ratio, the sum of the buying and the selling ratios.Our hypotheses are described below.

1. Hypothesis A: How do costs and uncertainty influence the turnover ratio? As discussed in Sections II and III, when front-end loads and redemption fees areimposed, the best strategy will be to allow for certain deviation from the optimalasset allocation, reducing the frequency of rebalancing compared with the case of notrading costs. To see if this theoretical hypothesis empirically holds, we will testwhether trading costs are negatively correlated with the turnover ratio.
Our model cannot determine the relationship between uncertainty and the turnoverratio, because an increase in uncertainty over returns has two offsetting effects on theturnover ratio. One increases the value of the investor’s “option to delay rebalancing,”which lowers the turnover ratio. The other diminishes the mutual fund’s risk-adjustedreturn, which leads to a lower optimal ratio of mutual fund holdings, a higher sellingratio, and by definition, a higher turnover ratio. The predominant effect should be singled out empirically. 2. Hypothesis B: How do costs and uncertainty influence the buying ratio?Following an argument similar to that in hypothesis A, trading costs, both front-endloads and redemption fees, should be negatively correlated with the buying ratio.Furthermore, the Section III results show that a downward shift of the lower boundary of optimal mutual fund holdings caused by an increase in front-end loads is larger than that caused by an increase in redemption fees. This implies that the buying ratio should be more sensitive to changes in front-end loads than to changes in redemption fees.
On the other hand, administrative fees do not generate incentives to delay purchases, as trading costs do. We should note, however, that administrative fees diminish the net expected rate of return on mutual funds, thereby causing adecline in the optimal ratio of mutual fund holdings. When trading costs are alsoincurred, the entire optimal holding range will shift downward and the buyingratio should fall accordingly. In particular, when mutual funds are held over long periods, the burden of administrative fees, which are imposed proportionallyto the length of possession, could become heavier than one-time trading costs. In such cases, changes in administrative fees are likely to have a significant impacton the buying ratio.27
An increase in uncertainty over mutual fund returns reduces the amount of optimal holdings for the risk-averse investor, which obviously implies a lower buyingratio. In addition, the value of the investor’s “option to delay rebalancing” rises, so hisor her tendency to be deterred from buying mutual funds should become stronger.To sum up, the negative response of the buying ratio to uncertainty over returnsshould be evident. 3. Hypothesis C: How do costs and uncertainty influence the selling ratio?As is the case with hypotheses A and B, an increase in either front-end loads orredemption fees raises the value of the “option to delay rebalancing.” This makes the investor more hesitant about buying or selling his or her mutual fund assets.Hence, the selling ratio should be lowered. In particular, an increase in redemption
109
Optimal Timing in Trading Japanese Equity Mutual Funds: Theory and Evidence
27. Our numerical analyses in Section III suggest that an increase in administrative fees has a significant negativeimpact on optimal mutual fund holdings when we assume an infinite investment horizon.

fees has a relatively large effect on the upper boundary of optimal mutual fund holdings, which implies a larger negative impact on the selling ratio.
Meanwhile, an increase in administrative fees reduces the net expected rate ofreturn and the optimal holding ratio accordingly, implying a greater possibility thatthe investor will sell his or her mutual fund assets, or a higher selling ratio.
The relationship between uncertainty over returns and the selling ratio is analogous to that described in hypothesis A. An increase in uncertainty may raise the value of the “option to delay rebalancing,” driving down the selling ratio.However, the optimal ratio of mutual fund holdings for the risk-averse investor will fall as well, and this positively impacts the selling ratio. The predominant effectcannot be predetermined.28
B. Some Reservations about Our HypothesesA key assumption behind our hypotheses is that all the relevant costs are merely sunkcosts for mutual fund investors. However, these costs can be thought of as the priceinvestors are willing to pay for various services that make mutual fund holdingsappealing. Therefore, it would be unfair to disregard these positive aspects of mutualfund costs. In this subsection, we briefly discuss two important roles the costs play to“encourage” mutual fund holding. They are “the function of supporting a costlysearch” and “the function of stabilizing portfolios.” 1. The function of supporting a costly search Sirri and Tufano (1998) asserts that high-fee funds spend more on reducing searchcosts that investors must bear to select appropriate funds from a pool of assets.Information gathering is an essential process in making investment decisions, andoften a costly one for an individual investor. In this regard, buying mutual funds may be a solution, because the investors can free themselves to some extent fromcostly search activities by choosing from a limited list of ready-made portfolios. Oncethey have invested, they may enjoy affiliated services that further curtail searchefforts, such as periodic reports on the current market environment, or investmentconsultation. Meanwhile, mutual funds can enjoy their scale merit in monitoringtheir portfolios or gathering information. Front-end loads and administrative fees arecharged partly for such a supportive function for reducing the investor’s search costs. 2. The function of stabilizing portfoliosAccording to Chordia (1996), trading costs, both front-end loads and redemption fees,dissuade investors from selling their mutual funds. They enable fund managers to construct efficient portfolios. Investors who sell their mutual funds impose negativeexternalities on investors who continue to hold the same funds for the following two reasons: (1) liquidation of securities results in unnecessary expenses, includingadverse selection costs in trading;29 and (2) this worsens the fund performance since the fund managers must keep a large cash position to prepare for selling by investors.
110 MONETARY AND ECONOMIC STUDIES/MARCH 2004
28. Note that our discussion contrasts with those based on the single-period CAPM, where uncertainty over returnsis assumed to be positively correlated with the selling ratio. We think such arguments are oversimplified in thedynamic context, since they neglect the former effect we explained.
29. These costs are, broadly, the profits raised by non-informed traders to compensate for losses from trading withinformed traders. See Glosten and Milgrom (1985) for more details.

One effective way to deal with the negative externalities is to dissipate liquidity risk byhaving a large body of investors. Another way is to impose trading costs, which we willdiscuss below.
When an investor needs liquidity, the investor will employ the less cost-bearingmethod by comparing the cost incurred by selling mutual funds with that of alter-native funding means. Imposition of trading costs on the fund will raise the formercost, thereby dissuading the investor from selling the fund to meet his or her liquiditydemand. Furthermore, when there exists information asymmetry between funds andinvestors about the investors’ selling possibilities, discriminating trading costs amongmutual funds can yield more efficient equilibrium than the case of uniform tradingcosts. To be specific, it can induce self-selection on the side of investors in the sensethat high-liquidity-risk investors choose low-fee and less efficient funds and viceversa. Successful structuring of trading costs yields a separating equilibrium.
Considering the positive aspects of mutual fund costs we discussed above, weshould add the following reservations:
(1) As long as investors think that front-end loads and administrative fees arecharged to compensate for investment services, they may not consider themmere sunk costs. As Sirri and Tufano (1998) argue, raising incentives of salescompanies to market mutual funds can lead to a decline in investors’ searchcosts.30,31 Such effects may dilute the relationship we discussed between tradingcosts and mutual fund trading behavior.
(2) Since front-end loads and redemption fees dissuade investors from sellingmutual funds, they enable fund managers to construct more efficient port-folios by keeping cash reserves as minimal as possible. This implies upwardpressure to the optimal ratio of mutual fund holding, partially offsetting theeffects assumed in hypothesis B.
C. Estimating the Empirical ModelThis subsection formulates regression models. The independent variables32 are variancesof the rates of return,33,34 front-end loads, redemption fees,35 administrative fees, and
111
Optimal Timing in Trading Japanese Equity Mutual Funds: Theory and Evidence
30. According to Sirri and Tufano (1998), if high mutual fund fees effectively reduce investors’ search costs, the negative correlation between fees and fund flows should be mitigated. They tested this null-hypothesis and concluded that the hypothesis cannot be rejected.
31. In Japan’s case, it is said that high front-end loads were an incentive of sales companies such as securities companies to conduct heavy marketing, encouraging investors to trade mutual funds as frequently as possible.This practice might lead to excessive turnover ratios. We will return to this issue later.
32. The studies examining mutual fund flows generally include some measures of each fund’s expected returns intheir model (see Remolona, Kleiman, and Gruenstein [1997] and Sirri and Tufano [1998] for examples). Oursimulation results show that expected returns may indeed have a significant impact on investment behavior.However, we exclude expected returns from our regression models to (1) focus on the effects of uncertainty and costs, both of which create a dynamics of investment behavior; (2) keep the model as simple as possible; and(3) avoid arbitrariness entailing estimation of expected returns.
33. The rate of return is defined as ln( fundpricet /fundpricet −1).34. As mentioned in Footnote 6, it is not the ex ante volatility that is important, but uncertainty over future perform-
ance. However, as the difference between the historical volatility (HV) and the conditional volatility estimated bythe GARCH model is not large, we use the HV to avoid additional assumptions.
35. We take natural logs of front-end loads and redemption fees, since our simulation results imply a non-linear relationship between these costs and fund flow indicators.

dummy variables that take one if the mutual funds can be bought at the bank counterand take zero otherwise.36,37 The dependent variables are three indices of mutual fund flows, (1) the turnover ratio, (2) the buying ratio, and (3) the selling ratio. The equations we estimate are as follows (see Table 3 for details of variables):
RitTRS = a 0 + a 1VARit + a 2 ln(Fi
ENT ) + a 3 ln(FiEXT ) + a 4Fi
RUN + a 5Bi + uit, (24)
RitENT = a 0 + a 1VARit + a 2ln(Fi
ENT ) + a 3 ln(FiEXT ) + a 4Fi
RUN + a 5Bi + uit , (25)
RitEXT = a 0 + a 1VARit + a 2ln(Fi
ENT ) + a 3ln(FiEXT ) + a 4Fi
RUN + a 5Bi + uit . (26)
Also, we estimate equations excluding the administrative fee FiRUN from the right-hand
sides38 of the above equations.
RitTRS = a 0 + a 1VARit + a 2ln(Fi
ENT ) + a 3ln(FiEXT ) + a 5Bi + uit , (27)
RitENT = a 0 + a 1VARit + a 2ln(Fi
ENT ) + a 3ln(FiEXT ) + a 5Bi + uit , (28)
RitEXT = a 0 + a 1VARit + a 2ln(Fi
ENT ) + a 3ln(FiEXT ) + a 5Bi + uit . (29)
112 MONETARY AND ECONOMIC STUDIES/MARCH 2004
36. Nikami (2001a) calculates a correlation between fund flows and the stock index for each sales channel. He found a positive correlation in the case of fund flows via securities companies, and a negative correlation for fund flows via banks. Therefore, we add a dummy variable to control for qualitative differences depending onsales channels.
37. Since our data set includes index and global equity funds, we estimated a model with dummy variables discriminating the fund type. None of them proved to be statistically significant, however.
38. We exclude administrative fees FiRUN for the following reasons. First, our hypotheses suggest that the coefficient of
administrative fees should not be statistically significant in model A. Second, we found a relatively high correla-tion, around 0.7, between the administrative fee and the front-end loads, which possibly incurs multicollinearity.For details, see the correlation matrix in Table 3.

The signs for each coefficient implied by hypotheses A to C and the estimationresults of the panel data analysis are summarized in Table 4.
D. Empirical Results Empirical results are reported in Tables 5, 6, and 7. The Lagrange multiplier (LM) specification test results39 show that the random effects model is more suitable than the
113
Optimal Timing in Trading Japanese Equity Mutual Funds: Theory and Evidence
Dependent variables Independent variables
RitTRS Rit
ENT RitEXT VARit Fi
ENT FiEXT Fi
RUN
Mean 0.270 0.145 0.126 3.196 2.465 0.129 1.254
St. dev. 0.495 0.371 0.297 2.370 0.681 0.201 0.396
VARit FiENT Fi
EXT FiRUN
VARit 1 0.282 0.098 0.100
FiENT 1 0.138 0.698
FiEXT 1 0.322
FiRUN 1
Table 3 Details of Variables
[1] Dependent Variables
RitENT : Buying ratio of mutual fund i in period t (yen amount of mutual funds bought/net asset
value, average of the previous five business days) Rit
EXT : Selling ratio of mutual fund i in period t (yen amount of mutual funds sold/net assetvalue, average of the previous five business days)
RitTRS : Turnover ratio of mutual fund i in period t (Rit
ENT + RitEXT )
[2] Independent Variables
VARit : Variance of the rate of return on mutual fund i (calculated for the previous 60 days,annualized)
FiENT : 1 + front-end loads on mutual fund i 1
FiEXT : 1 + redemption fees on mutual fund i
FiRUN : Administrative fees on mutual fund i (annualized)
Bi : Dummy for funds that hold bank selling routes (funds that hold the routes = 1, otherwise = 0)uit : Error term
[3] Data
Sample period: August 2000 to end-July 2001 (daily data) Sample size: 91 open-end equity mutual funds, comprising 75 general domestic equity funds,
6 index funds, and 10 general global equity funds. The sample funds were the 91largest funds in terms of outstanding net asset value at the end of March 2001.2
Notes: 1. We add one to the actual figures so that we can take logs when the cost is zero. 2. We omitted mutual funds that had missing data or recorded no changes, i.e., no buying or
selling occurred in the sample period. The aggregate net asset value of our sample funds atthe end of March 2001 was ¥4.6 trillion. This accounts for 31.9 percent of the total mutualfund industry (¥14.5 trillion), covering most of the major funds.
3. Figures in this table are shown as 100 times the original.
39. We use an LM test devised by Breusch and Pagan (1980) for testing the random effects model against the pooledOLS model. See Greene (2000) for details.
[4] Descriptive Statistics and Correlation Matrix3

114 MONETARY AND ECONOMIC STUDIES/MARCH 2004
[1] Regression Results
N = 91 (number of funds), T = 247 (period analyzed, from August 1, 2000 to July 31, 2001), NT = 22,477
Pooled OLS Pooled OLSOne-way One-way Two-way Two-way
(1) (2)random effect random effect random effect random effect
(1) (2) (1) (2)
a10.00853 0.00736 –0.00648 –0.00655 –0.01070 –0.01079
[6.126***] [5.306***] [–2.803***] [–2.834***] [–3.880***] [–3.910***]
a2–0.00121 –0.00206 –0.00136 –0.00210 –0.00140 –0.00211
[–7.198***] [–15.653***] [–1.260] [–2.460**] [–1.297] [–2.468**]
a3–0.00092 –0.00211 –0.00127 –0.00188 –0.00123 –0.00181
[–6.261***] [–9.986***] [–0.870] [–1.385] [–0.84] [–1.331]
a4–0.00092 — –0.00080 — –0.00076 —
[–8.200***] [–1.105] [–1.055]
a50.0011 0.00111 0.00114 0.00113 0.00114 0.00113
[16.160***] [15.952***] [2.539**] [2.501**] [2.543**] [2.507**]
a0 (constant) 0.00480 0.00480 0.00529 0.00526 0.00543 0.00540[28.346***] [28.298***] [5.010***] [4.958***] [5.118***] [5.070***]
R-squared 0.027 0.023 0.027 0.024 0.027 0.024
Note: Figures in brackets show t-values. ** denotes statistical significance at the 5 percent level, and *** at the 1 percent level.
Table 5 Regression Results A
Model A 1: RitTRS = a0 + a1VARit + a2ln(Fi
ENT ) + a3ln(FiEXT ) + a4Fi
RUN + a5Bi + uit
2: RitTRS = a0 + a1VARit + a2ln(Fi
ENT ) + a3ln(FiEXT ) + a5Bi + uit
[2] Specification Tests
Model (1) Model (2)One-way Two-way One-way Two-way
LM (Lagrange multiplier) test66,181.13*** 68,535.23*** 66,589.77*** 68,968.51***(Pooled OLS vs. random effect, H0: �u
2 = �v2 = 0)
Note: Figures show LM statistics. *** denotes statistical significance at the 1 percent level.
Table 4 Sign of Coefficients
[1] Sign of Coefficients Implied by Our Model
a1 a2 Magnitude a3 a4
Hypothesis (model) A ± − −Hypothesis (model) B − − < − −Hypothesis (model) C ± − > − +
Note: Hypotheses A to C are tested by models A to C, respectively.
[2] Sign of Coefficients Verified Empirically
a1 a2 Magnitude a3 a4
Hypothesis (model) A (1) − − −(2) − − −
Hypothesis (model) B (1) − − > − −(2) − − > −
Hypothesis (model) C (1) − − < + +(2) − − < +
Note: Shadows represent significance at the 10 percent level.

115
Optimal Timing in Trading Japanese Equity Mutual Funds: Theory and Evidence
pooled ordinary least squares (OLS) model for all our models.40 Therefore, we focus onthe coefficients of the random effects models, which corresponds to the shaded area.
First, let us see the results of hypothesis A. In the model including administrativefees, neither the coefficient sign of front-end loads nor redemption fees is statisticallysignificant, although the signs for both of the coefficients are consistent with ourhypothesis. Meanwhile, we cannot reject the null-hypothesis that the coefficient ofadministrative fees is zero, as our model suggests. On the other hand, when we exclude administrative fees, the significance level improves for coefficients of front-endloads and redemption fees. In particular, the coefficient of front-end loads becomes significant at the 5 percent level. Furthermore, the coefficient of uncertainty over fund returns is significantly negative, which can be interpreted as evidence of theinvestor’s “option to delay rebalancing.” The dummy variables indicating funds with a bank sales channel are significant at the 1 percent level for all models. Thus, the prevailing observation of a qualitative difference in fund flows between the bank sales channel and other channels is also supported.
[1] Regression Results
N = 91 (number of funds), T = 247 (period analyzed, from August 1, 2000 to July 31, 2001), NT = 22,477
Pooled OLS Pooled OLSOne-way One-way Two-way Two-way
(1) (2)random effect random effect random effect random effect
(1) (2) (1) (2)
a10.00652 0.00501 –0.00326 –0.00339 –0.00424 –0.00439
[6.313***] [4.862***] [–1.899*] [–1.969**] [–2.161**] [–2.238**]
a2–0.00009 –0.00119 –0.00019 –0.00121 –0.00020 –0.00121[–0.731] [–12.136***] [–0.242] [–1.913*] [–0.254] [–1.915*]
a3–0.00156 –0.00244 –0.00146 –0.00230 –0.00145 –0.00229
[–9.259***] [–15.550***] [–1.374] [–2.286**] [–1.363] [–2.266**]
a4–0.00119 — –0.00110 — –0.00110 —
[–14.214***] [–2.103**] [–2.084**]
a50.00140 0.00139 0.00141 0.00140 0.00141 0.00140
[27.199***] [26.760***] [4.329***] [4.174***] [4.324***] [4.172***]
a0 (constant) 0.00249 0.00249 0.00281 0.00277 0.00284 0.00280[19.853***] [19.754***] [3.660***] [3.518***] [3.690***] [3.552***]
R-squared 0.049 0.041 0.049 0.041 0.049 0.041
Note: Figures in brackets show t-values. * denotes statistical significance at the 10 percent level, ** at the 5 percentlevel, and *** at the 1 percent level.
Table 6 Regression Results B
Model B 1: RitENT = a0 + a1VARit + a2ln(Fi
ENT ) + a3ln(FiEXT ) + a4Fi
RUN + a5Bi + uit
2: RitENT = a0 + a1VARit + a2ln(Fi
ENT ) + a3ln(FiEXT ) + a5Bi + uit
[2] Specification Tests
Model (1) Model (2)One-way Two-way One-way Two-way
LM (Lagrange multiplier) test61,063.01*** 67,760.87*** 61,144.11*** 67,836.97***(Pooled OLS vs. random effect, H0: �u
2 = �v2 = 0)
Note: Figures show LM statistics. *** denotes statistical significance at the 1 percent level.
40. We disregard the fixed effects model because it fails to identify time-invariant mutual fund costs, which play animportant part in our model.

Next, let us turn to hypothesis B. In the model including administrative fees, the coefficient signs of front-end loads and redemption fees are consistent with thehypothesis, but they are not significant. When we exclude administrative fees, thecoefficients of these costs become significant, although we fail to verify the relativemagnitude that our hypothesis predicts. The coefficient of administrative fees is significantly negative, which is consistent with our model. We should note, however,that the magnitude of the coefficient is rather small compared with the coefficients ofother costs. Finally, the coefficient of uncertainty over fund returns supports ourhypothesis in every model, showing significantly negative values.
Last, we examine hypothesis C. Table 7 shows that the selling ratio and front-endloads have a significantly negative correlation as is implied by the hypothesis.Meanwhile, we cannot observe any significant relationship with redemption fees oradministrative fees. In more detail, signs for the latter coefficient are consistent withthe theory, but the latter did not satisfy our predictions. The coefficient of uncer-tainty is significantly negative in all models, implying the presence of the “option todelay rebalancing,” or dynamic optimization behavior in mutual fund trading.
116 MONETARY AND ECONOMIC STUDIES/MARCH 2004
[1] Regression Results
N = 91 (number of funds), T = 247 (period analyzed, from August 1, 2000 to July 31, 2001), NT = 22,477
Pooled OLS Pooled OLSOne-way One-way Two-way Two-way
(1) (2)random effect random effect random effect random effect
(1) (2) (1) (2)
a10.00201 0.00235 –0.00297 –0.00292 –0.00534 –0.00527
[2.388**] [2.797***] [–2.082**] [–2.050**] [–3.190***] [–3.147***]
a2–0.00112 –0.00087 –0.00117 –0.00089 –0.00119 –0.00089
[–10.992***] [–10.964***] [–2.210**] [–2.142**] [–2.253**] [–2.153**]
a30.00014 0.00033 0.00019 0.00042 0.00021 0.00046
[0.994**] [2.603***] [0.260] [0.633] [0.292] [0.690]
a4–0.00026 — 0.00030 — 0.00032 —[3.857***] [0.859] [0.914]
a5–0.00028 –0.000027 –0.00027 –0.00027 –0.00027 –0.00027
[–6.607***] [–6.518***] [–1.244] [–1.226] [–1.231] [–1.213]
a0 (constant) 0.00231 0.00231 0.00247 0.00248 0.00255 0.00256[22.511***] [22.507***] [4.773***] [4.812***] [4.903***] [4.941***]
R-squared 0.009 0.008 0.009 0.008 0.009 0.008
Note: Figures in brackets show t-values. ** denotes statistical significance at the 5 percent level, and *** at the 1 percent level.
Table 7 Regression Results C
Model C 1: RitEXT = a0 + a1VARit + a2ln(Fi
ENT ) + a3ln(FiEXT ) + a4Fi
RUN + a5Bi + uit
2: RitEXT = a0 + a1VARit + a2ln(Fi
ENT ) + a3ln(FiEXT ) + a5Bi + uit
[2] Specification Tests
Model (1) Model (2)One-way Two-way One-way Two-way
LM (Lagrange multiplier) test27,369.71*** 27,660.14*** 27,706.19*** 27,995.77***(Pooled OLS vs. random effect, H0: �u
2 = �v2 = 0)
Note: Figures show LM statistics. *** denotes statistical significance at the 1 percent level.

V. Empirical Implications
From our empirical analyses, we conclude that our results generally support thehypotheses proposed in Section IV.41 In this section, we summarize the implicationsof our empirical results.
First, Japanese investors basically consider mutual fund fees as sunk costs, eventhough these costs have such positive effects on mutual fund holdings as reducinginvestor search costs or stabilizing the fund portfolios.42
Second, mutual fund investors on the whole seem to exhibit rational trading behavior as implied by our dynamic asset allocation model. Anecdotal episodes say thatsales companies in Japan have traditionally encouraged investors to frequently switchfrom one fund to another, which enables sales companies to enjoy front-end loadincome from high turnover ratios. If this trend still exists, we should observe a positivecorrelation43 between front-end loads and fund flow measures. Our results show thatfund flow measures have a statistically significant negative correlation with front-endloads. This could be a sign of improvement in investors’ sub-optimal trading behavior,at least during the sample period. However, the fact that the absolute value of the coefficient of administrative fees is not larger than that of other fees may suggest thatinvestors have yet to fully understand the accumulative burden of ongoing costs associated with long-term investment. After all, the concept of asset management hasjust started to take root in Japan, and it will take some time for investors to assimilatethe necessary knowledge in making proper investment decisions.44
Third, the results may suggest an alternative explanation for the current sluggish-ness in the Japanese equity mutual fund market. During the sample period, startingfrom the middle of 2000, investors seemed to be hesitant to purchase mutual funds asa result of their dynamically optimal trading behavior. The existence of trading costs islikely to prompt investors to delay their investment decisions under uncertainty. Wherethere is downward pressure on prices, as in current Japanese equity funds, investorsrationally delay purchases until their mutual fund holdings hit the lower boundary of
117
Optimal Timing in Trading Japanese Equity Mutual Funds: Theory and Evidence
41. Note, however, that the results should be interpreted with some caution for the following reasons. First, the influ-ence of redemption fees on investment behavior is not straightforward. Investors may not find redemption fees tobe significant, as they are small for most mutual funds, ranging from zero to about 0.5 percent. Second, althoughcost figures are taken from the prospectus, these may not be the actual costs, given that an increasing number offunds have begun to waive their fees. For example, some funds offer discounts or rebates on front-end loads as areward to long-term holding, while others charge additional performance-based fees. Christoffersen (2001) pointsout that the practice of fee waiving in the United States is an effective method to set flexible performance-basedfees, circumventing the sub-optimal fixed fee structure of the industry. The same can also be noted for Japan.Nikami (2001b) suggests that funds usually prefer not to change contractual fees, since it will involve the cumbersome procedure of changing the prospectus.
42. Some point out that Japanese customers have a strong tendency to regard services as free, so they are not accustomed to paying for such services as investment consultation.
43. Sales companies have a greater incentive to promote the sale of funds that allow them to receive higher loads.Hence, positive correlation between front-end loads and the buying ratio is expected. Furthermore, the fact thatinvestors have been encouraged to switch from one fund to another implies that selling and buying usually gohand in hand. Needless to say, such relations contrast sharply with the dynamic optimal trading behavior we discussed in this paper.
44. The relatively small value of the coefficients of administrative fees may be ascribed to views that the fees compensate for high-quality services. But we do not think such an explanation is plausible, because it contradictsour results that the coefficients of front-end loads are significantly negative.

the optimal holding range. This will directly lead to lackluster demand for equitymutual funds. The upward trend in both costs and uncertainty over returns, which weshowed in Section I, should amplify this mechanism.45
VI. Concluding Remarks
This paper provided both theoretical and empirical analyses of market participants’optimal decision-making in trading Japanese equity mutual funds. First, we built anintertemporal decision-making model that incorporated trading costs. This settingenabled us to shed light on investors’ options to delay investment or the investors’waiting option. A comparative analysis showed that an increase in uncertainty overthe rate of mutual fund returns had a negative impact not only on market partici-pants’ buying behavior, but also on their selling behavior. Also, depending on thedegree of uncertainty over returns, a several percentage point increase in trading costswas likely to change the optimal share of mutual funds in investors’ portfolios, by upto 10 percentage points. These results cannot be obtained by analyses based on the single-period CAPM.
The merits of long-term investment seem to be over-emphasized recently in Japan,probably as a negative reaction to the fact that sales companies tended to encourageinvestors to heavily engage in short-term trades. However, we think that the idealinvestor is not the one who simply buys and blindly holds a mutual fund over a longperiod, but the one who can flexibly adjust his or her portfolio allocations, dependingon the market environment. In this sense, the investment strategy specified in this papermay be regarded as an ideal asset management policy for individual investors.
Second, we empirically examined the above theoretical implications using dailytransaction data of selected equity mutual funds in Japan. By estimating a panel datamodel, we concluded that at least for the sample period from August 2000 to July 2001,investment behavior has been rational. Our results may also provide a new explanationfor the sluggishness in equity mutual funds trading after the bursting of the bubbleeconomy. Investors are likely to be rationally postponing their purchases of equitymutual funds or exercising their waiting option under the present circumstances of lowexpected returns, higher degree of uncertainty, and high trading costs.
Finally, we should mention that our theoretical model should be interpreted withcare due to its simplified assumptions, such as introduction of a fixed consumptionrule, and tractable asset dynamics. As for the empirical analyses, we may not havebeen able to completely grasp the actual costs, since we used the contractual value ofmutual fund fees due to the limitation of data. Furthermore, this paper focuses onthe domestic demand structure of mutual funds. Thus, international comparisons areleft for future research.
118 MONETARY AND ECONOMIC STUDIES/MARCH 2004
45. As mentioned before, conventional CAPM analyses suggest that greater uncertainty leads to increased selling of funds.

APPENDIX: COSTS ASSOCIATED WITH EQUITY MUTUAL FUNDSAppendix Table 1 shows six types of explicit fees associated with trading and holdingequity mutual funds: front-end loads, administrative fees, managing fees, redemptionfees, sales fees, and taxes (in addition, there are brokerage fees associated with tradingmutual funds). Front-end loads can be thought of as service fees that sales companiescharge investors when selling mutual funds (some funds offer no-load products, wherefront-end loads are zero, but front-end loads for domestic equity mutual funds average 2 to 3 percent). Administrative and managing fees are deducted from mutualfunds on a daily basis during the period that investors hold funds. The fees are usuallya fixed percentage of net assets. The receivers of the fees are the sales company, theinvestment trust company, and the trustee. The percentage received by the sales company is the price paid by investors for information and for handling the dividendpayout. The percentage received by the investment trust company is the fee paid for costs such as administration and research, portfolio management, accounting, computer processing, personnel, and disclosure. The percentage received by the trusteeis the price for delivery of securities and cash, custody and management of securities,and bookkeeping of the transactions.
Investors pay redemption fees and sales fees when selling mutual funds. Redemptionfees are set to defray fund costs associated with investor redemption and paid directlyto the fund. Thus, from a seller’s perspective, they are purely sunk costs. Sales fees arealso charged when investors sell mutual funds, but since only few mutual funds chargethem, we will not consider them in this paper. Therefore, the costs we incorporate inour model are (1) front-end loads and redemption fees charged proportionally to theamount of transaction and (2) administrative fees charged on the net asset value.
Taxes, in the case of general open-end mutual funds, are charged as a 20 percentwithholding tax when dividends are paid out, and when capital gains are realizedfrom sales of mutual fund assets. For simplicity, we will also not consider these taxes.
119
Optimal Timing in Trading Japanese Equity Mutual Funds: Theory and Evidence
Appendix Table 1 Costs Associated with Equity Mutual Funds
Relevant period Fees, etc. Receiver entities
Funds are bought Front-end loads Sales company
Funds are held Administrative fees Sales company
Investment company
Trustee
Managing fees Investment company
Funds are sold Redemption fees, sales fees Mutual fund
Dividends are paid Taxes (income tax, local tax)
Funds are sold
Equities are traded Brokerage fees

Breusch, Trevor S., and Adrian R. Pagan, “The LM Test and Its Applications to Model Specification inEconometrics,” Review of Economic Studies, 47 (1), 1980, pp. 239–254.
Brown, Stephen J., William N. Goetzmann, Takato Hiraki, Toshiyuki Otsuki, and Noriyoshi Shiraishi,“The Japanese Open-End Puzzle,” Journal of Business, 74 (1), 2001, pp. 59–78.
Cai, Jun, K. C. Chan, and Takeshi Yamada, “The Performance of Japanese Mutual Funds,” Review ofFinancial Studies, 10 (2), 1997, pp. 237–273.
Chevalier, Judith, and Glenn Ellison, “Risk Taking by Mutual Funds as a Response to Incentives,”Journal of Political Economy, 105 (6), 1997, pp. 1167–1200.
Chordia, Tarun, “The Structure of Mutual Fund Charges,” Journal of Financial Economics, 41 (1),1996, pp. 3–39.
Christoffersen, Susan E. K., “Why Do Money Fund Managers Voluntarily Waive Their Fees?” Journalof Finance, 56 (3), 2001, pp. 1117–1140.
Constantinides, George M., “Capital Market Equilibrium with Transaction Costs,” Journal of PoliticalEconomy, 94 (4), 1986, pp. 842–862.
Dixit, Avinash, and Robert Pindyck, Investment under Uncertainty, New Jersey: Princeton UniversityPress, 1994.
Dumas, Bernard, “Super Contact and Related Optimality Conditions,” Journal of Economic Dynamicsand Control, 15 (4), 1991, pp. 675–685.
———, and Elisa Luciano, “An Exact Solution to a Dynamic Portfolio Choice Problem underTransaction Costs,” Journal of Finance, 46 (2), 1991, pp. 577–595.
Economic Planning Agency, Economic Conditions in Japan in 1999, 1999. Friend, Irwin, and Marshall E. Blume, “The Demand for Risky Assets,” American Economic Review,
65 (5), 1975, pp. 900–922.Glosten, Lawrence R., and Paul R. Milgrom, “Bid, Ask and Transaction Prices in a Specialist Market
with Heterogeneously Informed Traders,” Journal of Financial Economics, 14 (1), 1985, pp. 71–100.
Greene, William H., Econometric Analysis, 4th edition, New Jersey: Prentice Hall, 2000.Gruber, Martin J., “Another Puzzle: The Growth in Actively Managed Mutual Funds,” Journal of
Finance, 51 (3), 1996, pp. 783–810.Iwasawa, Yoshinori, “Seimei Hoken Kaisha no Saiteki Toshi Kodo to Risk Premium Puzzle (Optimal
Investment Behavior of Life Insurance Companies and the Risk Premium Puzzle),” in EijiOgawa, ed. Seimei Hoken Kaisha no Risk Kanri Senryaku (Risk Management Strategy for LifeInsurance Companies), Tokyo: Toyo Keizai Shimposha, 2000, pp. 33–44 (in Japanese).
Leland, Hayne E., “Optimal Portfolio Implementation with Transaction Costs and Capital GainTaxes,” IBER Working Paper, Institute of Business and Economic Research, December, 2000.
Merton, Robert C., “An Intertemporal Capital Asset Pricing Model,” Econometrica, 41 (5), 1973, pp. 867–887.
Muramoto, Tsutomu, Nihonjin no Kin’yu Shisan Sentaku (Portfolio Allocation of Japanese Investors),Tokyo: Toyo Keizai Shimposha, 1998 (in Japanese).
Nikami, Kiyoshi, “Saikin no Kojin Kokyaku no Doko (Recent Investment Behavior of IndividualInvestors),” Shoken Report (Securities Report), December, 2001a, pp. 1–8 (in Japanese).
———, “Toshin Hanbai no Henka ni tsuite (On the Changing Nature of Mutual Fund Sales),”Shoken Report (Securities Report), January, 2001b, pp. 1–7 (in Japanese).
Rea, John D., and Brian K. Reid, “Trends in the Ownership Cost of Equity Mutual Funds,” InvestmentCompany Institute Perspective, November, 1998.
Remolona, Eli M., Paul Kleiman, and Debbie Gruenstein, “Market Returns and Mutual Fund Flows,”Federal Reserve Bank of New York Economic Policy Review, 3 (2), Federal Reserve Bank of NewYork, July, 1997, pp. 33–52.
Sirri, Erik R., and Peter Tufano, “Costly Search and Mutual Fund Flows,” Journal of Finance, 53 (5),1998, pp. 1589–1622.
120 MONETARY AND ECONOMIC STUDIES/MARCH 2004
References

Takayama, Toshinori, “Waga Kuni Toshi Shintaku no Performance oyobi Hyoka: A Survey (EvaluatingPerformance of Equity Mutual Funds in Japan: A Survey),” Shoken Analyst Journal (SecuritiesAnalyst Journal), July, 2000, pp. 31–43 (in Japanese).
Takehara, Hitoshi, and Manabu Yano, “Macro Joken tsuki Pricing Model wo mochiita KabushikiToshin Shintaku no Performance Hyoka (Evaluating Performance of Equity Mutual FundsUsing Macro-Factor Conditional Pricing Models),” Keizai Zaimu Kenkyu (Economic andFinancial Research), 21 (1), 2001, pp. 4–22 (in Japanese).
Zheng, Lu, “Is Money Smart? A Study of Mutual Fund Investors’ Fund Selection Ability,” Journal ofFinance, 54 (3), 1999, pp. 901–933.
121
Optimal Timing in Trading Japanese Equity Mutual Funds: Theory and Evidence

122 MONETARY AND ECONOMIC STUDIES/MARCH 2004