optimal sensor placement for multi-phase flow rate estimation
TRANSCRIPT

Optimal Sensor Placement for Multi-Phase Flow
Rate Estimation Using
Pressure and Temperature Measurements
1
SPE Aberdeen Summit Series Seminar
Inwell flow surveillance and control: new frontiers
October 22, 2013, Aberdeen, UK
K. Kawaguchi1, SPE, M. Takekawa1, SPE, M. Ali2, H. Wada1, and T. Ohtani1
Yokogawa Electric Corporation1
Yokogawa Saudi Arabia Company2

Agenda
1. Introduction
2. Methodology
3. Example Analysis
4. Summary & Future Work
2
SPE Aberdeen Summit Series Seminar
Inwell flow surveillance and control: new frontiers
October 22, 2013, Aberdeen, UK
Optimal Sensor Placement for Multi-Phase Flow Rate Estimation Using P&T Measurements
K. Kawaguchi, M. Takekawa, M. Ali, H. Wada, and T. Ohtani

Introduction
For improved oil recovery, multi-lateral wells are becoming major in oil fields
Knowing the oil, gas & water (Multi-phase) flow rate from each well and lateral is crucial to optimize the production
3
SPE Aberdeen Summit Series Seminar
Inwell flow surveillance and control: new frontiers
October 22, 2013, Aberdeen, UK
Optimal Sensor Placement for Multi-Phase Flow Rate Estimation Using P&T Measurements
K. Kawaguchi, M. Takekawa, M. Ali, H. Wada, and T. Ohtani
??
?
?
?

Multi-Phase Flow Meter(MPFM)
Multi-phase flow is known to show complex behavior
Combination of sophisticated sensors are used in MPFM to measure gas, oil and water flow rates
Wide deployment of MPFMs to downhole condition is hard due to cost, reliability, and maintenance problems
4
SPE Aberdeen Summit Series Seminar
Inwell flow surveillance and control: new frontiers
October 22, 2013, Aberdeen, UK
Optimal Sensor Placement for Multi-Phase Flow Rate Estimation Using P&T Measurements
K. Kawaguchi, M. Takekawa, M. Ali, H. Wada, and T. Ohtani
Homogenizer
Electric
Capacitance
Meter
dPC1 C2
Cross Correlation
Velocity Meter
Venturi
Densitometer
Flow patterns in pipe Example Configuration of MPFM
Flow
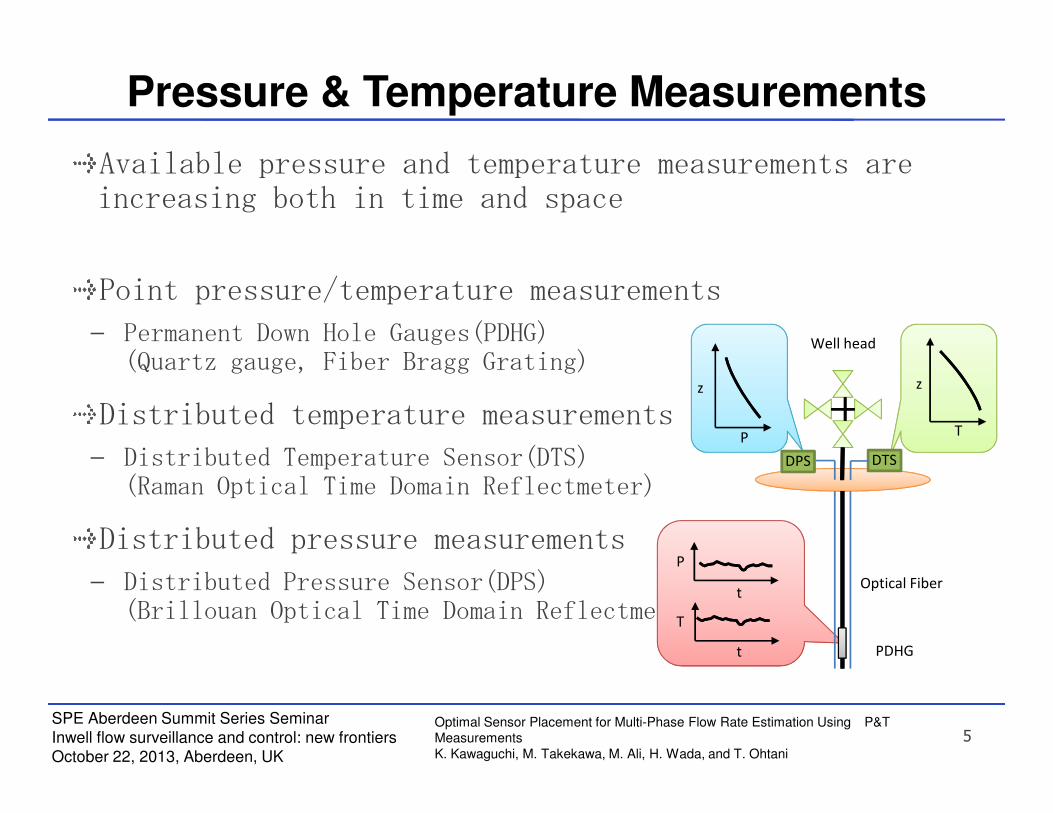
Pressure & Temperature Measurements
Available pressure and temperature measurements are increasing both in time and space
Point pressure/temperature measurements
Permanent Down Hole Gauges(PDHG)(Quartz gauge, Fiber Bragg Grating)
Distributed temperature measurementsz z
Well head
5
SPE Aberdeen Summit Series Seminar
Inwell flow surveillance and control: new frontiers
October 22, 2013, Aberdeen, UK
Optimal Sensor Placement for Multi-Phase Flow Rate Estimation Using P&T Measurements
K. Kawaguchi, M. Takekawa, M. Ali, H. Wada, and T. Ohtani
Distributed temperature measurements
Distributed Temperature Sensor(DTS)(Raman Optical Time Domain Reflectmeter)
Distributed pressure measurements
Distributed Pressure Sensor(DPS)(Brillouan Optical Time Domain Reflectmeter)
DPS DTS
PDHG
P T
P
T
t
t
Optical Fiber

Interest is growing to estimate multi-phase flow by means of soft-sensing
Naevdal et al. (2001)indicated the importance of P&T measurements
de Kruif et al. (2008) found difficulty estimating 3 phase flow using down hole P&T measurement only, but was able to estimate 2 phase flow using 6P&6T measurements
Lorentzen et al. (2010) found difficulty to estimate 2 phase flow using only BHP and BHT
Even for the 2 phase unilateral case, number and placement of required measurements are not clear
Soft-Sensing of Multi-Phase Flow
AuthorsNo. of
phases
Model Estimation
method
Well
setup
Sensor
Placement
Measurements
usedResult
covariance 3 inflow Yes 3 F, 21T, 6P, 4WC OK
6
SPE Aberdeen Summit Series Seminar
Inwell flow surveillance and control: new frontiers
October 22, 2013, Aberdeen, UK
Optimal Sensor Placement for Multi-Phase Flow Rate Estimation Using P&T Measurements
K. Kawaguchi, M. Takekawa, M. Ali, H. Wada, and T. Ohtani
Naevdal et
al. 20013 phase
3 fluid
model
covariance
matrix
analysis
3 inflow Yes 3 F, 21T, 6P, 4WC OK
5 lateral Yes 3 F, 9T, 24P OK
de Kruif et
al. 2008
2 phase
3 phase
Drift-
flux
model
Extended
Kalman Filter
Uni-lateral No 6 P, 6T
2 phase
OK
3 phase
NG
Bi-lateral No 6 P, 6T
2 phase
OK
3 phase
NG
Lorentzen et
al. 20102 phase
2 fluid
model
Ensemble
Kalman Filter
Uni-lateral No 1 BHP, 1 BHT NG
Bi-lateral No 2 T OK

Objective of the Study
Questions to be studied
How many P&T measurements are required to estimate the multiphase flow rates?
What combination of P&T measurements gives the best estimation while sensors are having uncertainty?
Analysis method
7
SPE Aberdeen Summit Series Seminar
Inwell flow surveillance and control: new frontiers
October 22, 2013, Aberdeen, UK
Optimal Sensor Placement for Multi-Phase Flow Rate Estimation Using P&T Measurements
K. Kawaguchi, M. Takekawa, M. Ali, H. Wada, and T. Ohtani
Analysis method
Simulation study using wellbore model capturing essential physics
Evaluation of estimation uncertainty through uncertainty propagation
Comparison of estimation uncertainty between different measurement combination to search for optimal placement of sensors
Example simulation
Uni-lateral, two-phase well as a start point

Model capturing essential physics of multiphase flow
Conservation equations for mixture fluid:
Phase behavior: Black oil model (Whitson & Brule 2000)
Wellbore Model
Qgzv
hvdx
d
dx
vdgvv
d
f
dx
dp
dx
vd
mmmm
mmmmm
m
mm
=
++
−−−=
=
2 :Energy
sin2
:Momentum
0 :Mass
2
2
ρ
ρθρ
ρ
ρ
outgoutooutout vvTp ,, ,,,
8
SPE Aberdeen Summit Series Seminar
Inwell flow surveillance and control: new frontiers
October 22, 2013, Aberdeen, UK
Optimal Sensor Placement for Multi-Phase Flow Rate Estimation Using P&T Measurements
K. Kawaguchi, M. Takekawa, M. Ali, H. Wada, and T. Ohtani
Phase behavior: Black oil model (Whitson & Brule 2000)
Velocity slip: Drift-flux model(Shi et al. 2005)
Friction factor: Moody friction factor
Heat transfer: Overall heat transfer modelinginoinin vvTp ,, ,,,
( ) ( ) ( ) ( )TphhTphhTpTp ggooggoo ,,,,,,, ==== ρρρρ θ
M
Mdmg vvCv += 0
( ),2000for 64
Re
Re
<= NN
f ( )3000for 7.18
2log274.11
Re
Re
10 >
+−= N
fNfε
( )geoTTdUQ −−= π

Linear Approximation
Wellbore model is linearized to derive the relation between uncertainty of measurements and multi-phase flow rates
Input condition vector(n Dim.):
Measurement vector(m Dim.):
Nonlinear model equation(m eq.): ( )vfw =
[ ]scgscofwfw qqTp ,, ,,,=v
[ ]1002110021 ,,,,,,, TTTppp LL=w
( )100100 ,Tp
M
9
SPE Aberdeen Summit Series Seminar
Inwell flow surveillance and control: new frontiers
October 22, 2013, Aberdeen, UK
Optimal Sensor Placement for Multi-Phase Flow Rate Estimation Using P&T Measurements
K. Kawaguchi, M. Takekawa, M. Ali, H. Wada, and T. Ohtani
Linear simultaneous equation:
Sensitivity Matrix:
wMv =
[ ]
∂
∂⋅==
= 00,
0,
vv
M
j
i
i
j
ijv
w
w
vM
( )11,Tp
( )22 ,Tp
M
M
( )scgscofwfw qqTp ,, ,,,
M
M
Linearization through Taylor expansion

Estimation Uncertainty Evaluation
Estimation
Estimation of vvvv (n dimension) are given by solving the inverse problem of Mv=wMv=wMv=wMv=w, given the measurement wwww(m dimension)
● m=n case:
● m>n case(least square solution):
Estimation Uncertainty
wMv1−=
( ) wMMMvT1T −
=
10
SPE Aberdeen Summit Series Seminar
Inwell flow surveillance and control: new frontiers
October 22, 2013, Aberdeen, UK
Optimal Sensor Placement for Multi-Phase Flow Rate Estimation Using P&T Measurements
K. Kawaguchi, M. Takekawa, M. Ali, H. Wada, and T. Ohtani
Standard deviation of estimations are evaluated given the measurement with sigma = 1% Gaussian noise.
● Measurement noise:
● Average estimations*:
● Standard deviations of estimations*:
(*evaluated with N=3,000 samples)
( )
−−=
2
0,
2
1exp
2
1
iiw
ii
w
i
wwwp
σπσ
∑=
=N
k
kii vN
v1
,
1
( )2
1
,
2
1
1∑
=
−−
=N
k
ikiv vvNi
σ

Example Well Setup
Typical gas/oil 2-phase vertical well as an example
Parameters obtained from a literature* Depth: 5,151 ft (1,570 m)
Diameter: 3 in (0.0762 m)
Oil density: 23 ˚API (915 kg/m3)
Oil production rate: 1,140 stb/d (181.2 m3/d)
Gas density: 0.80 SG (0.984 kg/m3)
Producing gas-oil ratio: 450 scf/stb(80.1 m3/m3)
11
SPE Aberdeen Summit Series Seminar
Inwell flow surveillance and control: new frontiers
October 22, 2013, Aberdeen, UK
Optimal Sensor Placement for Multi-Phase Flow Rate Estimation Using P&T Measurements
K. Kawaguchi, M. Takekawa, M. Ali, H. Wada, and T. Ohtani
Producing gas-oil ratio: 450 scf/stb(80.1 m3/m3)
Bottom Hole Pressure: 2,105 psig (14,614 kPa)
Bottom Hole Temperature**: 110 ˚F (43.3 ˚C)
Geothermal temperature gradient**: 6.79 ˚F/1,000 ft (1.23 ˚C/100 m)
Overall Heat Transfer Coefficient**: 100 W/m2 ˚F(180 W/m2 ˚C)
* Hasan, A.R. & Kabir, C.S., “Fluid flow and heat transfer in wellbores,” SPE, 2002
**Thermal parameters not described in Hasan & Kabir 2002 are assumed with reasonable value
5,1
51
ft

Simulated Profiles for the Example Well
0 500 1000 1500 2000 2500-6000
-5000
-4000
-3000
-2000
-1000
0
Pressure, psig
Dep
th,
ft
simulated data
field data
60 70 80 90 100 110 120-6000
-5000
-4000
-3000
-2000
-1000
0
Temperature, oF
Dep
th,
ft
fluid temperature
geothermal temperature
12
SPE Aberdeen Summit Series Seminar
Inwell flow surveillance and control: new frontiers
October 22, 2013, Aberdeen, UK
Optimal Sensor Placement for Multi-Phase Flow Rate Estimation Using P&T Measurements
K. Kawaguchi, M. Takekawa, M. Ali, H. Wada, and T. Ohtani
0 0.2 0.4 0.6 0.8 1-6000
-5000
-4000
-3000
-2000
-1000
0
Liquid holdup
Dep
th,
ft
0 1 2 3 4 5 6 7-6000
-5000
-4000
-3000
-2000
-1000
0
Velocity, ft/s
Dep
th,
ft
gas
liquid
Pressure, psig Temperature, oF
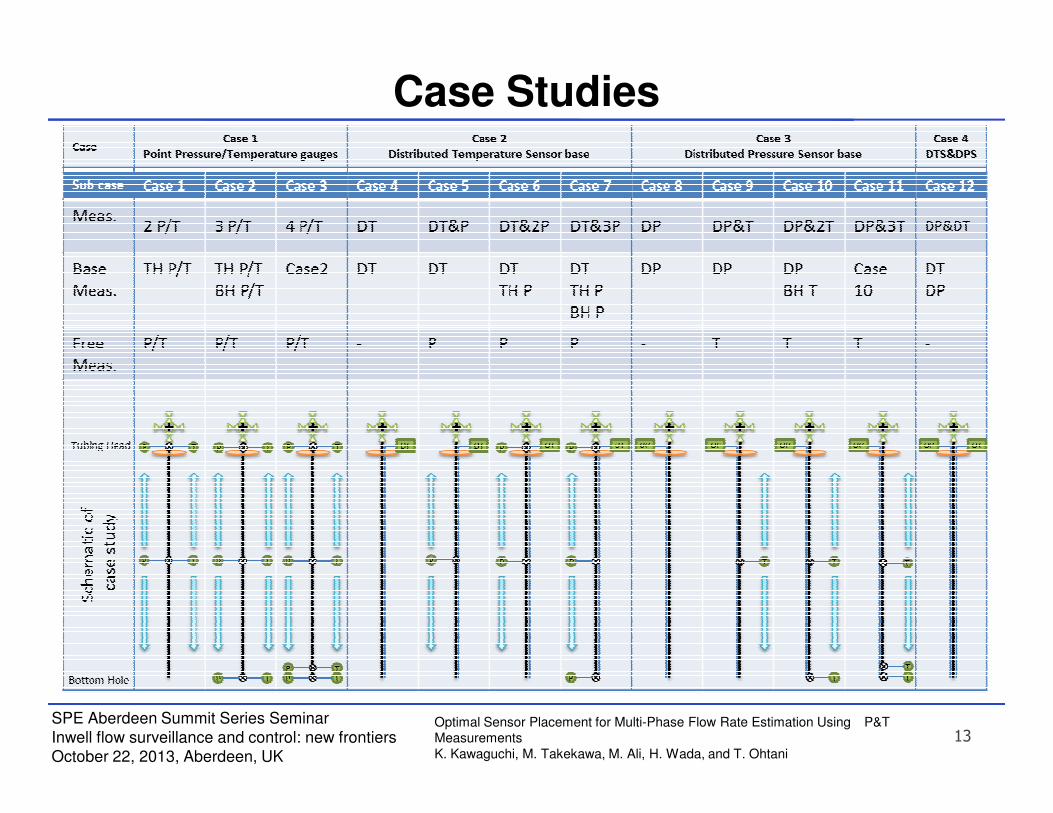
Case Studies
13
SPE Aberdeen Summit Series Seminar
Inwell flow surveillance and control: new frontiers
October 22, 2013, Aberdeen, UK
Optimal Sensor Placement for Multi-Phase Flow Rate Estimation Using P&T Measurements
K. Kawaguchi, M. Takekawa, M. Ali, H. Wada, and T. Ohtani
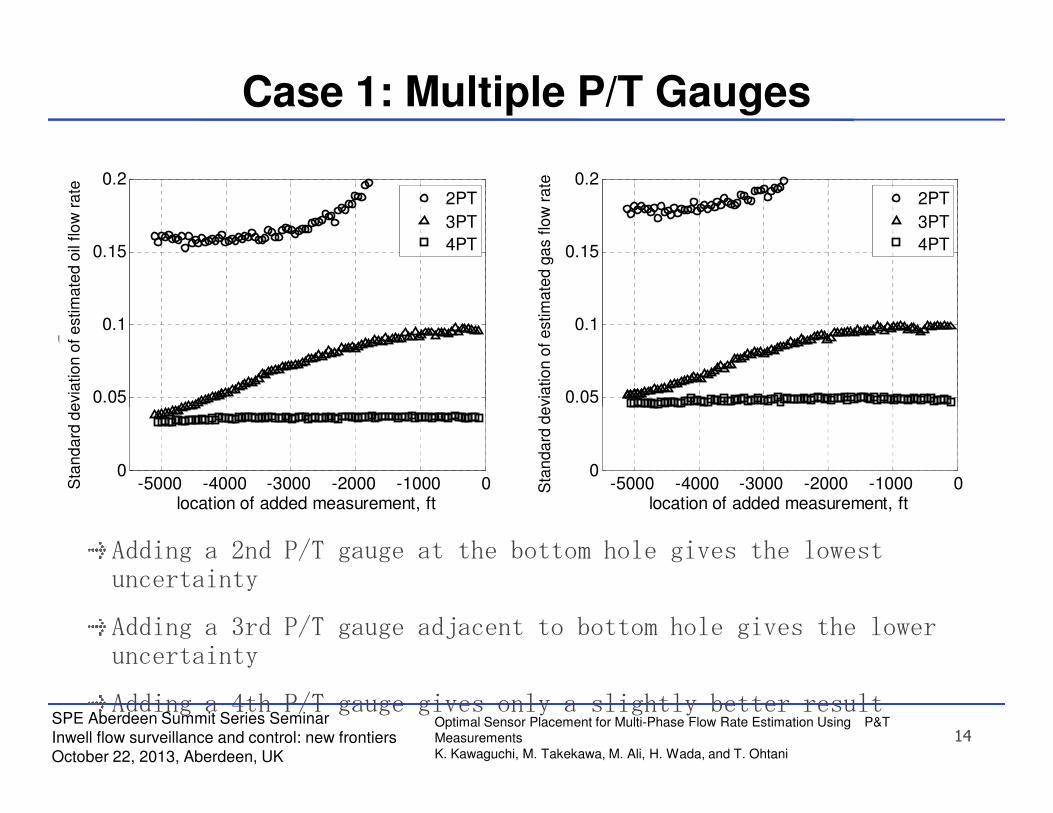
Case 1: Multiple P/T Gauges
0.05
0.1
0.15
0.2
σq
o,s
c
2PT
3PT
4PT
0.05
0.1
0.15
0.2
σq
g,s
c
2PT
3PT
4PT
Sta
nd
ard
de
via
tio
n o
f e
stim
ate
d o
il flo
w r
ate
Sta
nd
ard
de
via
tio
n o
f e
stim
ate
d g
as f
low
ra
te
14
SPE Aberdeen Summit Series Seminar
Inwell flow surveillance and control: new frontiers
October 22, 2013, Aberdeen, UK
Optimal Sensor Placement for Multi-Phase Flow Rate Estimation Using P&T Measurements
K. Kawaguchi, M. Takekawa, M. Ali, H. Wada, and T. Ohtani
Adding a 2nd P/T gauge at the bottom hole gives the lowest uncertainty
Adding a 3rd P/T gauge adjacent to bottom hole gives the lower uncertainty
Adding a 4th P/T gauge gives only a slightly better result
-5000 -4000 -3000 -2000 -1000 00
location of added measurement, ft
-5000 -4000 -3000 -2000 -1000 00
location of added measurement, ft
Sta
nd
ard
de
via
tio
n o
f e
stim
ate
d o
il flo
w r
ate
Sta
nd
ard
de
via
tio
n o
f e
stim
ate
d g
as f
low
ra
te

Case 2: DTS Base
0.02
0.04
0.06
0.08
0.1
σq o
,sc
DTS+P
DTS+2P
DTS+3P
0.02
0.04
0.06
0.08
0.1
σq
g,s
c
DTS+P
DTS+2P
DTS+3PDTS only: 0.064
DTS only: 0.034
Sta
nd
ard
de
via
tio
n o
f e
stim
ate
d o
il flo
w r
ate
Sta
nd
ard
de
via
tio
n o
f e
stim
ate
d g
as f
low
ra
te
15
SPE Aberdeen Summit Series Seminar
Inwell flow surveillance and control: new frontiers
October 22, 2013, Aberdeen, UK
Optimal Sensor Placement for Multi-Phase Flow Rate Estimation Using P&T Measurements
K. Kawaguchi, M. Takekawa, M. Ali, H. Wada, and T. Ohtani
DTS alone gives a fairly good result
Adding a P measurement at tubing head gives lowest uncertainty
Adding a 2nd P measurement has only a slight improvement
-5000 -4000 -3000 -2000 -1000 00
0.02
location of added measurement, ft
-5000 -4000 -3000 -2000 -1000 00
0.02
location of added measurement, ft
Sta
nd
ard
de
via
tio
n o
f e
stim
ate
d o
il flo
w r
ate
Sta
nd
ard
de
via
tio
n o
f e
stim
ate
d g
as f
low
ra
te
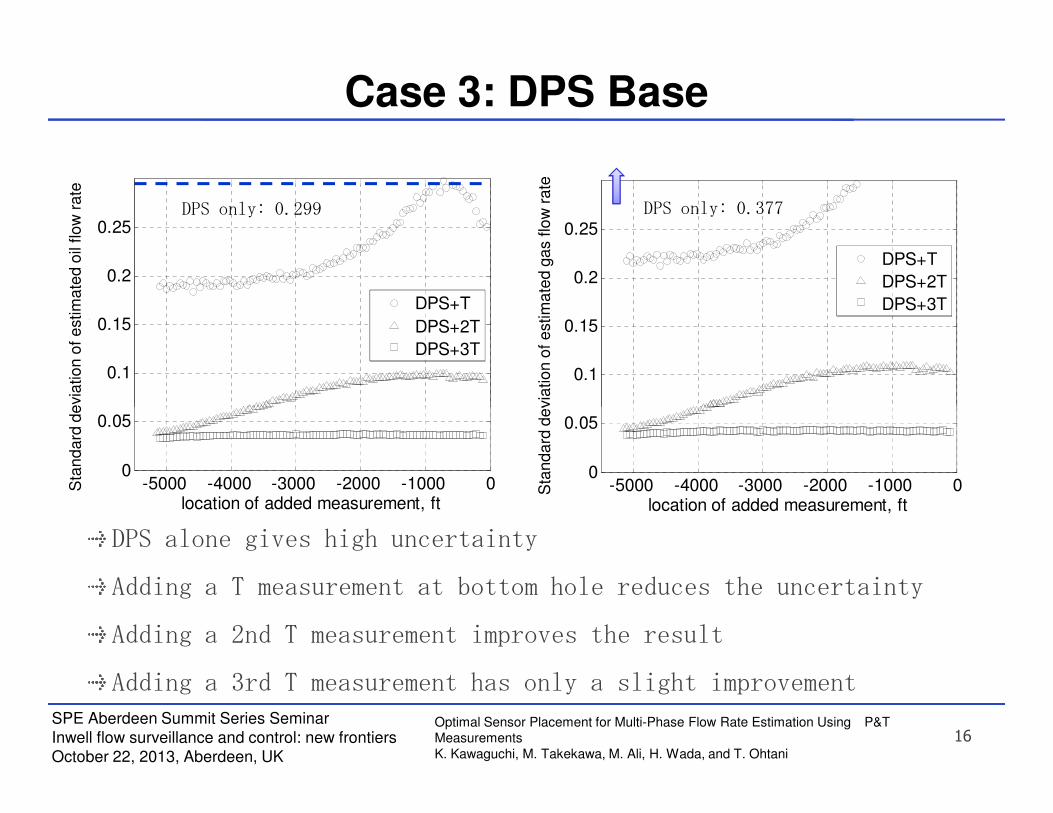
Case 3: DPS Base
0.1
0.15
0.2
0.25
σq
o,s
c
DPS+T
DPS+2T
DPS+3T
0.1
0.15
0.2
0.25
σq
g,s
c
DPS+T
DPS+2T
DPS+3T
DPS only: 0.377DPS only: 0.299
Sta
nd
ard
de
via
tio
n o
f e
stim
ate
d o
il flo
w r
ate
Sta
nd
ard
de
via
tio
n o
f e
stim
ate
d g
as f
low
ra
te
16
SPE Aberdeen Summit Series Seminar
Inwell flow surveillance and control: new frontiers
October 22, 2013, Aberdeen, UK
Optimal Sensor Placement for Multi-Phase Flow Rate Estimation Using P&T Measurements
K. Kawaguchi, M. Takekawa, M. Ali, H. Wada, and T. Ohtani
-5000 -4000 -3000 -2000 -1000 00
0.05
location of added measurement, ft
-5000 -4000 -3000 -2000 -1000 00
0.05
location of added measurement, ft
Sta
nd
ard
de
via
tio
n o
f e
stim
ate
d o
il flo
w r
ate
Sta
nd
ard
de
via
tio
n o
f e
stim
ate
d g
as f
low
ra
teDPS alone gives high uncertainty
Adding a T measurement at bottom hole reduces the uncertainty
Adding a 2nd T measurement improves the result
Adding a 3rd T measurement has only a slight improvement

Summary of Case Studies & Perspectives
17
SPE Aberdeen Summit Series Seminar
Inwell flow surveillance and control: new frontiers
October 22, 2013, Aberdeen, UK
Optimal Sensor Placement for Multi-Phase Flow Rate Estimation Using P&T Measurements
K. Kawaguchi, M. Takekawa, M. Ali, H. Wada, and T. Ohtani
Ideally, DTS&DPS gives the best estimation
If DTS is available, 1 or more additional P gauge is favorable.
If only P/T gauges are available, 3 or more P/T gauges are favorable

Summary & Future Work
Summary
Methodology for evaluating the estimation uncertainty were shown
Uncertainty of multi-phase flow rate estimation using P&T measurements are evaluated for example 2 phase well
Perspectives from an example analysis
● Ideally, DTS&DPS gives the best estimation
18
SPE Aberdeen Summit Series Seminar
Inwell flow surveillance and control: new frontiers
October 22, 2013, Aberdeen, UK
Optimal Sensor Placement for Multi-Phase Flow Rate Estimation Using P&T Measurements
K. Kawaguchi, M. Takekawa, M. Ali, H. Wada, and T. Ohtani
●
● If DTS is available, 1 or more additional P gauge is favorable.
● If only P/T gauges are available, 3 or more gauges are favorable
Future Work
Consideration of actual measurement uncertainty
Another well example to derive general perspective
Extension to 3 phase analysis

Acknowledgements
To Dr. Sami El-Ferik and Dr. Abdelsalam Al-Sarkhi of King Fahd University of Petroleum & Minerals for discussions and suggestions
19
SPE Aberdeen Summit Series Seminar
Inwell flow surveillance and control: new frontiers
October 22, 2013, Aberdeen, UK
Optimal Sensor Placement for Multi-Phase Flow Rate Estimation Using P&T Measurements
K. Kawaguchi, M. Takekawa, M. Ali, H. Wada, and T. Ohtani
To organizing committee of “SPE Aberdeen Summit Series Seminar Inwell flow surveillance and control: new frontier” for opportunity to make the presentation
Thank You
Slide 20
20
SPE Aberdeen Summit Series Seminar
Inwell flow surveillance and control: new frontiers
October 22, 2013, Aberdeen, UK
Optimal Sensor Placement for Multi-Phase Flow Rate Estimation Using P&T Measurements
K. Kawaguchi, M. Takekawa, M. Ali, H. Wada, and T. Ohtani
Thank You