optimal rotational load shedding via bilinear integer ... · the load shedding schedules for the...
TRANSCRIPT

OPTIMAL ROTATIONAL LOAD SHEDDINGVIA BILINEAR INTEGER PROGRAMMING
Atif Maqsood, Yu Zhang, and Keith CorzineDepartment of Electrical and Computer Engineering
University of California, Santa Cruz
Abstract—This paper addresses the problem of managingrotational load shedding schedules for a power distributionnetwork with multiple load zones. An integer optimizationproblem is formulated to find the optimal number and durationof planned power outages. Various types of damage costs areproposed to capture the heterogeneous load shedding preferencesof different zones. The McCormick relaxation along with aneffective procedure feasibility recovery is developed to solve theresulting bilinear integer program, which yields a high-qualitysuboptimal solution. Extensive simulation results corroborate themerit of the proposed approach, which has a substantial edgeover existing load shedding schemes.
I. INTRODUCTION
Over the last few decades, power consumption has beensteadily increasing around the world [1]. This can be attributedto a rise in availability of electrical and electronic devices aswell as social and cultural factors that promote our dependenceon those machines. For many developing countries, the fastpopulation growth is the main driver of increased energy con-sumption [2]. In addition, ludicrous electricity consumptionhas been recently observed due to large numbers of geo-distributed data centers and bitcoin mining machines [3].
The increased demand poses a heavy burden on our ag-ing and stressing energy infrastructure. Consider Pakistan asan example, which has the world’s sixth largest population(197 million), and two of the top twelve most populated citiesin the world [4]. With such a high population and limitedresources, it is no surprise that the demand for power inrecent years has consistently exceeded the generation capacityleading to shortfalls and blackouts [5], [6]. Efforts to increasethe power generation and replace the aging infrastructure tosupport higher levels of demand have been slow and hamperedby various financial and political factors [7].
As the utility company in Lahore, Pakistan, Lahore electricsupply company (LESCO) has been conducting the so-calledrotational load shedding in the city to deal with frequentshortfalls [8]. Load shedding is a premeditated power outagein some load zones when it is expected that the power supplycannot meet the demand. Rotational load shedding ensuresthat over the time horizon planned power outages will beshared across different zones in a pre-determined fashion.Refusing to implement rotational load shedding can result inunscheduled outages bringing major inconvenience, and evencatastrophic consequences like large-scale rolling blackouts.
Emails: {amaqsood,zhangy,corzine}@ucsc.edu.This work was supported by the Faculty Research Grant (FRG) of UC
Santa Cruz.
Fig. 1. Load management program for Lahore, Pakistani: As per AT&C lossesW.E.F 01-05-2018 [8].
Infrastructure such as distribution lines and transformers mayendure permanent damages due to overheating. It is thereforepreferred to shed load rather than take a risk of undesirableoutcomes [9].
According to LESCO’s most recent announcement, thereis a load shedding of 12 hours per day that is currentlyimplemented [10]. Over the last decade this number has beenvarying from 10 to 18 hours per day. Figure 1 shows the realdata for the load shedding schedules in Jan 2018 [8]. Over1500 feeders in the city are classified into five categories, someof which are further divided into different groups. Each groupexperiences a different schedule and total outage hours. Theduration of load shedding varies from 2 to 6 hours per day.At the moment, there are no standards for such a division andschedule variations for different zones. Hence, it is completelyup to the utility and local government to decide how to allocatethe unavoidable shortfalls among its customers. Figure 2 showsthe load shedding schedules for the lunar month of Ramadan in2018, where the outage patterns also varies based on the typeof load; i.e., industrial vis-a-vis residential load zones. Notethat even for residential zones, the load shedding varies from3.5 to 7 hours per day due to the increased power consumptionin summer.
Many developing countries have also been dealing withrolling blackouts via rotational load shedding. Egypt has ashortfall every summer since 2010 because of the high powerdemand and increased use of air conditioners and fans [11].Ghana has had year-long shortfalls and load shedding since2012, sometimes up to 12 hours a day [12]; see also the powercrisis in India and South Africa [13], [14]. The load sheddinghours recorded over a period of 3 months in Chennai are givenin [15]. The data show that there is no consistency of outagebut obvious pattern in the start time of power interruption that
742
Proceedings, APSIPA Annual Summit and Conference 2018 12-15 November 2018, Hawaii
978-988-14768-5-2 ©2018 APSIPA APSIPA-ASC 2018

Fig. 2. Lesco load management program for Lahore Ramadan 2018 on thebasis of AT&C losses with no load management during Seher, Iftar and Travihtimings [8].
indicates peak hours. Also the outage time is inconsistent. Inthe United States, e.g., Northern California, the investor-ownedutility Pacific Gas and Electric Company (PG&E) can conductrotating outages if the ISO deems it necessary [16]. Highpower demand is not the only reason for shortfall. Unexpecteddisasters that lead to failure in power generation sometimescan result in rolling blackouts and rotational load shedding;e.g., the 2011 Tohoku tsunami [17], the 2014 Ukraine crisis,and the 2015 North American heat wave. Clearly, the long-term solution for energy shortfall is to increase the generationcapacity, upgrade existing power infrastructure, and incentivizecustomers to reduce power usage during peak hours viademand response [18]. However, rotational load shedding willstill be a viable approach for some countries and regions tocope with shortfalls in the next few decades.
Focusing on this problem, the present paper proposes anoptimization framework aiming to minimize the total damagecost while respecting various load shedding preferences amongdifferent zones (see Section II). A relaxation technique isleveraged to linearize the bilinear terms, and yield a high-quality suboptimal solution (Section III). Section IV reportsthe numerical performance of the novel approach. Finally,concluding remarks are given in Section V.
II. PROBLEM FORMULATION
Consider a power distribution system consisting of N loadzones, which are indexed by n ∈ N := {1, 2, . . . , N}.We assume that each load zone can be shed independentlywithout affecting the rest of the system. Let kn and dn denotethe number of outages, and the duration (in hours) of eachoutage for the n-th zone, respectively. In addition, each zonehas a cost function Cn(kn, dn), which essentially reflects thedamage cost due to the load shedding.
A. Heterogeneous Load Shedding Costs
The modeling of the load shedding damage cost functionsrequires the knowledge of end users’ consumption habits, aswell as financial ramifications due to the loss of load. Anaccurate modeling can be challenging since the inconveniencecaused by load shedding sometimes is not necessarily relatedto financial losses. This however is out of the focus of thepresent work.
In this paper, we first classify all load zones as residential,commercial, and industrial areas that feature heterogeneousload shedding costs. Industrial zones often prefer few outagesof longer duration, rather than frequent outages of shortduration. This is due to the high cost of shut down and restartoperations, especially when large machines are involved. Incontrast, residential zones would prefer the other way becausemost residence and offices rely on backup power such as UPS,which can last for a few hours. Such practical preferences arecorroborated by the load shedding program in Figure 2; seealso the planned rolling blackouts in South Africa 2015 forsimilar preferences [19]. Specifically, the damage costs aremodeled as increasing functions in kn and dn, which mayserve as approximation of the true costs among zones. Forexample, an industrial zone 1 and a residential zone 2 cantake the following damage costs respectively
C1(k1, d1) = 1000k1 + 3000d1k1, (1a)C2(k2, d2) = 1000d2 + 100d2k2 . (1b)
The functions defined above show the relative preference thateach zone places on their load shedding schedules. Zone 1assigns a high weight cost for avoiding a large number offrequent outages while zone 2 gets high cost for outages withlong duration. Note that both cost functions have the productterm dn × kn which represents the total amount of time forloss of load. In this example zone 1 has a higher coefficientpenalizing the unavailability of power. This may reflect thefact that some utility companies would prefer to shed powerin residential zones rather than industrial ones.
A more general cost function is given as
Cn(kn, dn) := an,1dnkn + an,2dn + an,3kn, (2)
where the coefficients an,1, an,2, an,3 ∈ R+ reflect the loadshedding preference of each zone. These cost functions canalso vary with time of the day, season, and year. An outageof one hour may have different ramifications in summer andwinter, as well as during the day and night. Here we simplyconsider the worst case damage for the period considered.
The objective of the utility is to find the optimal dn andkn for each zone such that the overall damage cost can beminimized. We can simply consider minimizing the cumulativecost for all zones as given by
Ctot =N∑n=1
Cn. (3)
More complicated composite cost functions are applicable ifthe load shedding of a zone intensifies the damage in itsneighborhood zones.
B. Operational Constraints
Without any operational constraints the optimal decisionwould be to have no outages for any zones. This implies thatwe need to supply more power demand than the total gen-eration capacity. The long lasting overburdened infrastructuremay eventually lead to deterioration of voltage or frequency
743
Proceedings, APSIPA Annual Summit and Conference 2018 12-15 November 2018, Hawaii
and rolling blackouts. To avoid such dangerous consequences,we need to ensure that energy being shed is no less thanthe expected short fall, which is denoted by Esf . This hardconstraint can then be represented as
N∑n=1
dnknPaven ≥ Esf (4)
where P aven is the estimate of the average power consumed in
zone n. Note that the expected short fall is usually independentof the desired reliability, which can be obtained by predictingthe power generation and demand over a period of time; e.g.a season or a year. Estimate of the average power P ave
n can beobtained by widely used load forecasting methods; see [20].Apart from this operational condition, due to the practicallimits of outage duration dn and number of outages kn, wealso have the following two box constraints
0 ≤ kn ≤ kn, ∀n ∈ N (5)
dn ≤ dn ≤ dn, ∀n ∈ N . (6)
To promote the fairness among all zones, we further seta limit Cδ for the cost difference between each pair of twoadjacent zones, as given by the following constraint
|Cn(kn, dn)− Cn+1(kn+1, dn+1)| ≤ Cδ, ∀n ∈ N . (7)
III. SOLVING THE BILINEAR INTEGER PROGRAM
The minimum duration of each power outage is set to be 15minutes. Hence, the duration of each planned load sheddingbecomes 0.25dn while dn is an integer number. To this end,the task of optimal rotational load shedding can be formulatedas an optimization problem that minimizes the total loadshedding cost (3) subject to all operational constraints (4)-(7).The difficulty in solving the resulting optimization problemis two-fold: i) this is an integer program since both decisionvariables {dn, kn}n∈N are integer numbers; and ii) bilinearterms {dn × kn}n∈N are involved in the objective and someconstraints. Hence, off-the-shelf integer programming solversare not directly applicable.
A. McCormick relaxations
To deal with such a challenge, we leverage the McCormickrelaxations, and linearize each bilinear term by introducinga new variable wn := dn × kn; see e.g., [21]. Interestingly,for our particular problem, the new variable wn represents thetotal amount of time for planned load shedding in zone n;i.e., unavailability of power in hours. Replacing all bilinearterms with the introduced new variables, the relaxed problemis given as
min{wn,dn,kn}
N∑n=1
an,1wn +1
4an,2dn + an,3kn (8a)
s.t.1
4
N∑n=1
wnPaven − Esf ≥ 0 (8b)
0 ≤ kn ≤ kn, ∀n ∈ N (8c)
dn ≤ dn ≤ dn, ∀n ∈ N (8d)
dnkn ≤ wn ≤ dnkn, ∀n ∈ N (8e)
dnkn + kndn − kndn ≤ wn ≤ kndn, ∀n ∈ N (8f)∣∣an,1wn +1
4an,2dn + an,3kn − an+1,1wn+1
+1
4an+1,2dn+1 + an+1,3kn+1
∣∣ ≤ Cδ, ∀n ∈ N (8g)
wn, dn, kn ∈ Z+, ∀n ∈ N . (8h)
Note that the lower and upper limits of wn [cf. (8e)-(8f)]are derived by the limits of dn and kn via the McCormickenvelope. The factor 1/4 is introduced due to the fact that weset 15 minutes as the base unit of the outage time, and eachoutage duration is dn times of the base.
B. Feasible Solution Recovery
By using the McCormick relaxation, problem (8) becomesan integer program with linear objective function and con-straints, which can be dealt with integer solvers such asCplex and Gurobi. Let {k∗n, d∗n, w∗n}n∈N denote an op-timal solution to the relaxed problem (8). If w∗n = d∗nk
∗n
for n = 1, 2, . . . , N , then the relaxation is exact, and weessentially solve the original load shedding problem withthe bilinear terms. If the relaxation is inexact, the optimalsolution dn, kn violates the minimum short fall constraint, i.e.∑Nn=1 d
∗nk∗nP
aven < Esf .
In this case, we need an extra procedure to recover a feasiblesolution to the original problem. We multiple all outages witha factor such that the relative number of outages betweendifferent zones stay the same while the overall number ofoutages is increased to meet the shortfall. That is, i) keepingd∗n unchanged; and ii) rescaling k∗n and rounding it to thenearest integer
d∗n = d∗n (9)
k∗n =
⌊4Esf∑N
n=1 d∗nk∗nP
aven
k∗n
⌉. (10)
IV. NUMERICAL TESTS
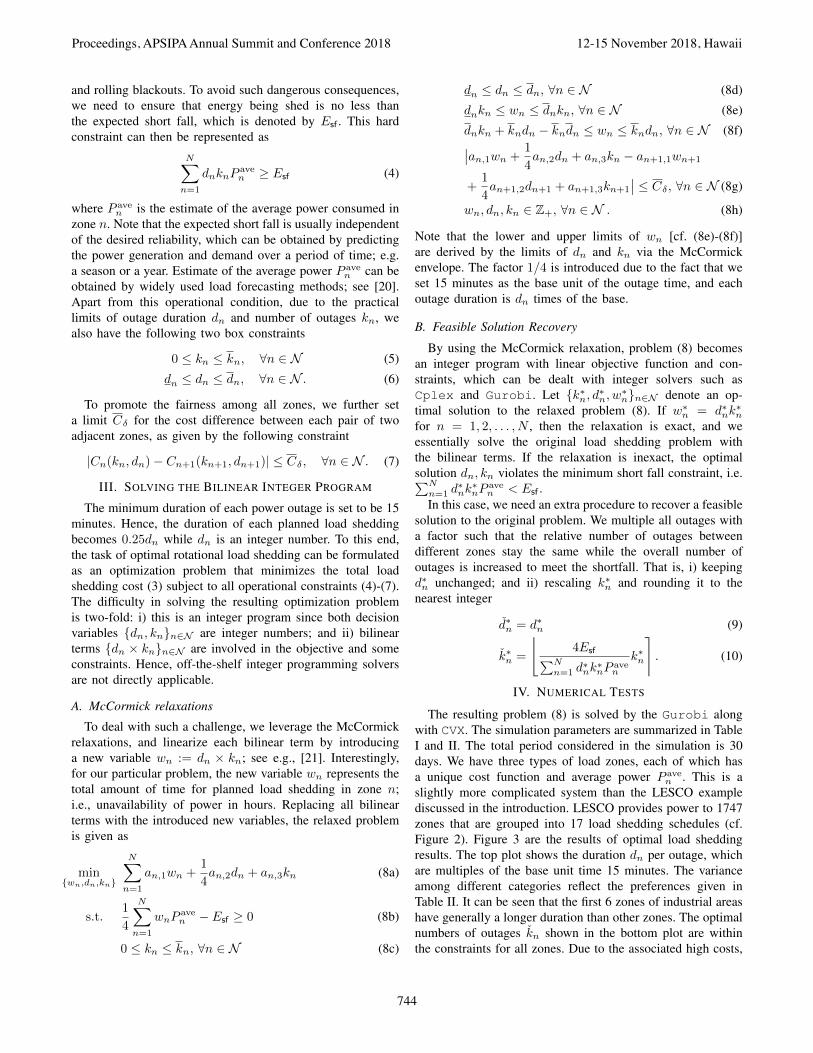
The resulting problem (8) is solved by the Gurobi alongwith CVX. The simulation parameters are summarized in TableI and II. The total period considered in the simulation is 30days. We have three types of load zones, each of which hasa unique cost function and average power P ave
n . This is aslightly more complicated system than the LESCO examplediscussed in the introduction. LESCO provides power to 1747zones that are grouped into 17 load shedding schedules (cf.Figure 2). Figure 3 are the results of optimal load sheddingresults. The top plot shows the duration dn per outage, whichare multiples of the base unit time 15 minutes. The varianceamong different categories reflect the preferences given inTable II. It can be seen that the first 6 zones of industrial areashave generally a longer duration than other zones. The optimalnumbers of outages kn shown in the bottom plot are withinthe constraints for all zones. Due to the associated high costs,
744
Proceedings, APSIPA Annual Summit and Conference 2018 12-15 November 2018, Hawaii
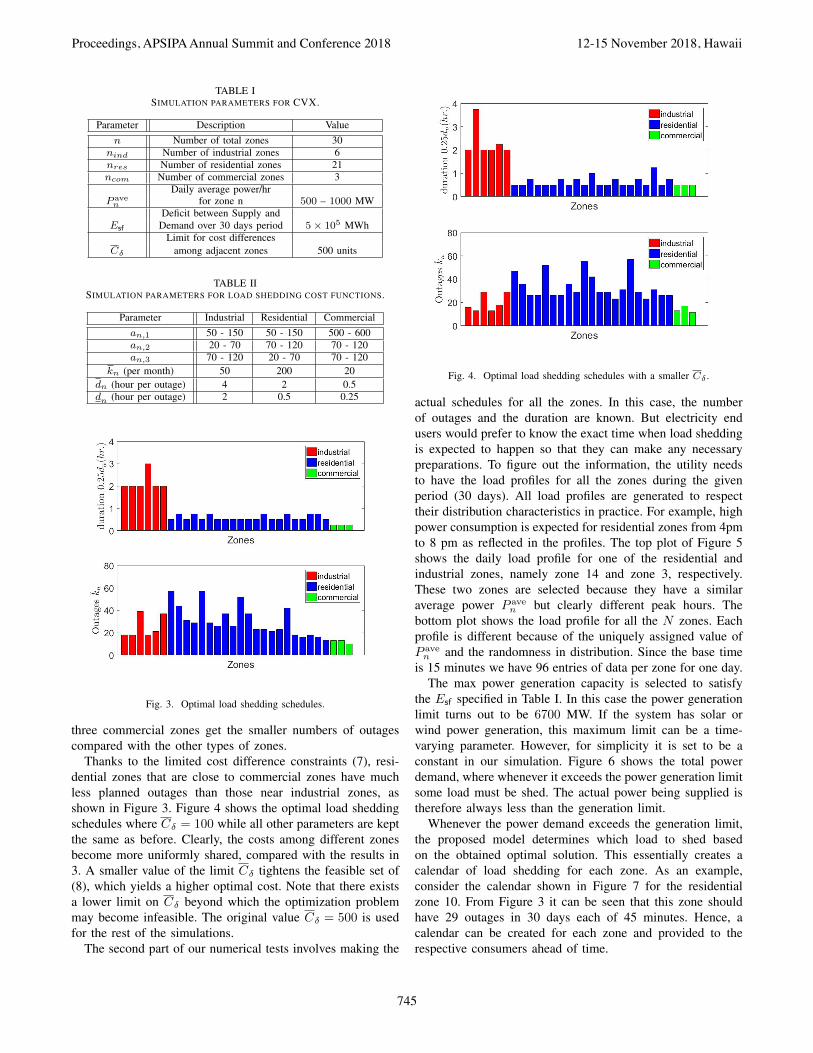
TABLE ISIMULATION PARAMETERS FOR CVX.
Parameter Description Valuen Number of total zones 30
nind Number of industrial zones 6nres Number of residential zones 21ncom Number of commercial zones 3
Daily average power/hrP aven for zone n 500 – 1000 MW
Deficit between Supply andEsf Demand over 30 days period 5× 10⁵ MWh
Limit for cost differencesCδ among adjacent zones 500 units
TABLE IISIMULATION PARAMETERS FOR LOAD SHEDDING COST FUNCTIONS.
Parameter Industrial Residential Commercialan,1 50 - 150 50 - 150 500 - 600an,2 20 - 70 70 - 120 70 - 120an,3 70 - 120 20 - 70 70 - 120
kn (per month) 50 200 20dn (hour per outage) 4 2 0.5dn (hour per outage) 2 0.5 0.25
Fig. 3. Optimal load shedding schedules.
three commercial zones get the smaller numbers of outagescompared with the other types of zones.
Thanks to the limited cost difference constraints (7), resi-dential zones that are close to commercial zones have muchless planned outages than those near industrial zones, asshown in Figure 3. Figure 4 shows the optimal load sheddingschedules where Cδ = 100 while all other parameters are keptthe same as before. Clearly, the costs among different zonesbecome more uniformly shared, compared with the results in3. A smaller value of the limit Cδ tightens the feasible set of(8), which yields a higher optimal cost. Note that there existsa lower limit on Cδ beyond which the optimization problemmay become infeasible. The original value Cδ = 500 is usedfor the rest of the simulations.
The second part of our numerical tests involves making the
Fig. 4. Optimal load shedding schedules with a smaller Cδ .
actual schedules for all the zones. In this case, the numberof outages and the duration are known. But electricity endusers would prefer to know the exact time when load sheddingis expected to happen so that they can make any necessarypreparations. To figure out the information, the utility needsto have the load profiles for all the zones during the givenperiod (30 days). All load profiles are generated to respecttheir distribution characteristics in practice. For example, highpower consumption is expected for residential zones from 4pmto 8 pm as reflected in the profiles. The top plot of Figure 5shows the daily load profile for one of the residential andindustrial zones, namely zone 14 and zone 3, respectively.These two zones are selected because they have a similaraverage power P ave
n but clearly different peak hours. Thebottom plot shows the load profile for all the N zones. Eachprofile is different because of the uniquely assigned value ofP aven and the randomness in distribution. Since the base time
is 15 minutes we have 96 entries of data per zone for one day.The max power generation capacity is selected to satisfy
the Esf specified in Table I. In this case the power generationlimit turns out to be 6700 MW. If the system has solar orwind power generation, this maximum limit can be a time-varying parameter. However, for simplicity it is set to be aconstant in our simulation. Figure 6 shows the total powerdemand, where whenever it exceeds the power generation limitsome load must be shed. The actual power being supplied istherefore always less than the generation limit.
Whenever the power demand exceeds the generation limit,the proposed model determines which load to shed basedon the obtained optimal solution. This essentially creates acalendar of load shedding for each zone. As an example,consider the calendar shown in Figure 7 for the residentialzone 10. From Figure 3 it can be seen that this zone shouldhave 29 outages in 30 days each of 45 minutes. Hence, acalendar can be created for each zone and provided to therespective consumers ahead of time.
745
Proceedings, APSIPA Annual Summit and Conference 2018 12-15 November 2018, Hawaii

Fig. 5. Daily load profiles.
Fig. 6. Simulation results for load shedding over one day.
Fig. 7. Load shedding calendar for zone 10 for one month.
Fig. 8. Planned outages with the sequencing algorithm.
Fig. 9. Load shedding calendar for zone 10 with the sequencing algorithm.
Next, we will compare our proposed model and approachwith some existing methods of load shedding. A common wayto schedule rotational load shedding is based on sequencing theload shed across all the zones [22]. This is the simplest way toensure that all the zones equally share the outages. The round-robin sequence {1, 2, . . . , N, 1, 2, ...} is chosen here while theduration for each outage is set to one hour. In other words, thefirst time when load has to be shed, zone 1 is shed for an hour.Then for zone 2, and so on and so forth. The resulting numbersof outages, and corresponding calendar for zone 10 are shownin Figure 8 and Figure 9, respectively. As expected the outagesare distributed equally. This calendar incidentally looks similarto the ones in Figure 1 and 2. This fact implies that Lesco mayimplement the sequencing algorithm to distribute the outagesamong groups within a zone. With exactly the same setup (allparameters and load profiles), the load shedding cost of thesequencing algorithm turns out to be 465,640 units while theoptimal cost of our proposed approach is 360,210 units, whichyields a 29% cost reduction.
Another way to distribute power outages is the so-calledequal power shedding, which assigns outages such that eachzone sheds roughly the same amount of power. Consequently,the zones with a larger power demand will have fewer planned
746
Proceedings, APSIPA Annual Summit and Conference 2018 12-15 November 2018, Hawaii

Fig. 10. Planned outages with the equal power shedding.
Fig. 11. Load shedding calendar for zone 10 with the equal power shedding.
outages. We simulate this method based on our setup, and itturns out that each zone sheds about 21, 086 MWh of energy.The duration of each outage for all zones is still fixed to beone hour. Figure 10 shows the resulting outages distributionwhile the load shedding calendar for zone 10 is given in Figure11. Our proposed approach has 36% cost reduction comparedwith this heuristic method.
V. CONCLUSIONS
This paper explores optimal rotational load shedding in thepresence of unavoidable power shortfalls. This is a challengingproblem affecting millions of people every day, especiallyin a few developing countries. Variations of cost functionsare proposed to model the heterogeneous preferences of loadshedding for different zones. The suboptimal load sheddingschedules are obtained by solving the formulated bilinearinteger program via the McCormick relaxations. The numer-ical tests show the effectiveness and performance gain ofthe proposed approaches. Future research directions aim athandling the uncertainty of the estimates of the shortfall andaverage power consumption.
REFERENCES
[1] Enerdata, “Global energy statistical yearbook 2017,” 2018. [Online].Available: https://yearbook.enerdata.net/
[2] J. Holdren, Population and environment. Kluwer Academic Publishers-Human Sciences Press, March 1991, vol. 12, ch. Population and theenergy problem, pp. 231–255.
[3] POWERCOMPARE, “Bitcoin mining now consuming more electricitythan 159 countries including Ireland & most countries in Africa,” 2017.[Online]. Available: https://powercompare.co.uk/bitcoin/
[4] P. Constable, “A disaster in the making: Pakistans population surgesto 207.7 million,” The Washington Post, September 2017. [Online].Available: https://wapo.st/2IQLmu9
[5] K. Kiani, “Power cuts return as shortfall touches7,000 mw,” Dawn News, May 2017. [Online]. Available:https://www.dawn.com/news/1331738
[6] S. M. Hali, S. Iqbal, W. Yong, and S. M. Kamran, “Impact of energysources and the electricity crisis on the economic growth: Policyimplications for pakistan,” Journal of Energy Tech. and Policy, vol. 7,no. 2, 2017.
[7] R. Aziz and M. B. Ahmad, “Pakistans power crisis,” Specialreport. United States Institute of Peace. http://www. usip.org/sites/default/files/SR375-Pakistans-Power-Crisis-The-Way-Forward.pdf, 2015.
[8] LESCO, “Load shedding / shutdown schedule,” 2018. [Online].Available: http://www.lesco.gov.pk/ShutdownSchedule
[9] T. Alzahawi, M. S. Sachdev, and G. Ramakrishna, “Time to voltagecollapse dependence of load shedding to avoid voltage collapse,” inElectrical Power and Energy Conf. (EPEC), 2017 IEEE. IEEE, 2017,pp. 1–5.
[10] “Lesco announces 12-hour load-shedding schedule,”Dunya News, November 2017. [Online]. Avail-able: http://dunyanews.tv/en/Pakistan/412805-LESCO-announces-12-hour-load-shedding-schedule
[11] K. Fahim and M. Thomas, “Blackouts in Egypt promptaccusations,” The New York Times, August 2014. [Online]. Avail-able: https://www.nytimes.com/2014/08/23/world/middleeast/blackouts-in-egypt-prompt-accusations.html
[12] E. Kwame, “24-hr light-out in new loadshed-ding timetable?” TV3Network, January 2015. [Online].Available: http://www.tv3network.com/business/24-hr-light-out-in-new-loadshedding-timetable
[13] C. McGreal, “Gold mines shut as south africa forced to rationpower supply,” The Guardian, January 2008. [Online]. Available:https://www.theguardian.com/world/2008/jan/26/southafrica.international
[14] A. K. Arya, S. Chanana, and A. Kumar, “Role of smart grid to powersystem planning and operation in india,” in Proceedings of Intl. Conf.on Emerging Trends in Engr. and Tech., 2013, pp. 793–802.
[15] T. Kogo, S. Nakamura, S. Pravinraj, and B. Arumugam, “A demandside prediction method for persistent scheduled power-cuts in developingcountries,” in IEEE PES Innovative Smart Grid Tech. Conf., Europe(ISGT-Europe), 2014, pp. 1–6.
[16] Pacific Gas and Electric Company, “Find your rotating outage block,”2018. [Online]. Available: https://goo.gl/higJKb
[17] P. Ferguson, “Tokyo region to face rolling blackoutsthrough summer,” CNN, March 2011. [Online]. Available:www.cnn.com/2011/WORLD/asiapcf/03/31/japan.blackouts/index.html
[18] S. Khemakhem, M. Rekik, and L. Krichen, “Optimal appliances schedul-ing for demand response strategy in smart home,” in 18th Intl. Conf. onSci. and Tech. of Automatic Control and Computer Engr. (STA). IEEE,2017, pp. 546–550.
[19] ESKOM, “Interpreting Eskom load-shedding stages,” 2018. [Online]. Available:http://loadshedding.eskom.co.za/LoadShedding/ScheduleInterpretation
[20] P. Chen, W. Li, Y. Chen, K. Guo, and Y. Niu, “A parallel evolutionaryextreme learning machine scheme for electrical load prediction,” inComputing Conference, 2017. IEEE, 2017, pp. 332–339.
[21] A. Gupte, S. Ahmed, M. S. Cheon, and S. Dey, “Solving mixedinteger bilinear problems using milp formulations,” SIAM Journal onOptimization, vol. 23, no. 2, pp. 721–744, 2013.
[22] R. Billinton and J. Satish, “Effect of rotational load shedding onoverall power system adequacy indices,” IEE Proceedings-Generation,Transmission and Distribution, vol. 143, no. 2, pp. 181–187, 1996.
747
Proceedings, APSIPA Annual Summit and Conference 2018 12-15 November 2018, Hawaii