optimal portfolio construction: a case study of nse the study aimed to construct an optimal...
TRANSCRIPT
© 2018 JETIR August 2018, Volume 5, Issue 8 www.jetir.org (ISSN-2349-5162)
JETIRA006093 Journal of Emerging Technologies and Innovative Research (JETIR) www.jetir.org 512
OPTIMAL PORTFOLIO CONSTRUCTION: A
CASE STUDY OF NSE
Dr. Simranjeet Kaur Sandhar*, Dr. Neetika Jain**, Ruchi Kushwah*** *Assistant Professor, Symbiosis University of Applied Sciences, Indore, (M.P.)
**Assistant Professor, Symbiosis University of Applied Sciences, Indore, (M.P.)
***Academic Associate, Indian Institute of Management, Indore,(M.P.)
Abstract-Portfolio construction is a widely-used theory on how investors can construct investment portfolios to maximise
expected returns and minimise risk. The practice of portfolio construction includes implementing an asset allocation strategy,
which involves balancing investment risk and return by adjusting the percentage of a portfolio allocated to each asset class. Asset
allocation is devised based on an investor’s risk tolerance, investment goals and investment timeframe.
An attempt is made here to get an insight into the idea embedded inSharpe’s single index model and to construct an optimal
portfolio empirically using thismodel. The study aimed to construct an optimal portfolio by using Sharpe’s single index model.
For this purpose the monthly closing prices of companies listed in NSE and NSE index (Nifty) for the period of Jan 2010 – Dec
2016 has been considered. Ultimately it is recommended that among the sample companies all the stocks are undervalued except
three stocks (Maruti, Tata Steel and HDFC) thus the investors can pick these stocks to revise their portfolio.
Keywords: Sharpe’s Single Index Model, Return and Risk Analysis, Risk Characteristic Line, Portfolio Analysis,
Optimal Portfolio Construction
1. Introduction
1.1 Investment
Investment is the commitment of money or capital to purchase financial instruments or other assets in order to gain profitable
returns in the form of interest, income, or appreciation of the value of the instrument. No doubt, investing one’s hard-earned
money is a risky business. Sure, there are investments that look like they don't carry huge risk of failure, but these won't get huge
amounts of dough. The basic rule of Investing applies everywhere-“Huge risk comes with Huge returns” and being aware of the
objectives and avenues of investment leads to financial security. If one wants to safe guard one's money against inflation and aim
it to grow, one need to select the right financial product for oneself. Investment is an art and a science, key to successful
investment is focused and effective investment planning. There are various options in which one can invest.
There are many investment options available in the market as Mutual Funds, Fixed Deposit, National Saving Certificate,
Public Provident Fund, stock Market, Gold, Silver, & Real estate.
1.2Portfolio The term portfolio refers to any collection of financial assets such as stocks, bonds, and cash. Portfolios may be held by
individual investors and/or managed by financial professionals, hedge funds, banks and other financial institutions. It is a
generally accepted principle that a portfolio is designed according to the investor's risk tolerance, time frame and investment
objectives. The monetary value of each asset may influence the risk/reward ratio of the portfolio and is referred to as the asset
allocation of the portfolio.
To successfully build a portfolio of impact investments, investors will need to assign an individual or a team to source,
commit to and manage this set of investments. As we will see in the examples below, institutional investors utilize different
organizational structures to establish these teams.
1.3 Portfolio Construction
Portfolio is the combination of securities such as a stock bonds and money market instrument. The process of blending
together the broad asset classes so as to obtain optimum return with minimum risk is called portfolio construction.
Diversification of investment helps to spread risk over many assets. A drive as mentioned, this study focuses only on the
construction part of an investment process and thus understands the theory behind portfolio construction is a prerequisite. In
particular, the portfolio constructed in this thesis build on the portfolio, the theory introduced in the seminal and heavily cited
study by Markowitz (1952).
Portfolio construction is an important aspect of building the right type of investment portfolio based on your long-
terminvestment objectives.A disciplined portfolio constructionprocess can help you meet your goals whilestriking a balance
between risk and return.Sound portfolio construction shouldmaintain and enhance your strategic assetallocation strategy and help
you avoid thepitfalls that often preventinvestors from reaching their goals.
When building an optimal investment portfolio (portfolio construction), your financial adviser will often recommend investing
in more than one asset class to diversify your portfolio and reduce risk. The percentage that you allocate to each asset class is
based on your risk tolerance, investment timeframe and objectives. This is known as asset allocation. The aim is to balance risk
and return by dividing assets between asset classes. An investor with a high tolerance for risk and a longer time horizon will
typically invest in a more aggressive portfolio - one that includes a higher component of equities, as illustrated below. Investors

© 2018 JETIR August 2018, Volume 5, Issue 8 www.jetir.org (ISSN-2349-5162)
JETIRA006093 Journal of Emerging Technologies and Innovative Research (JETIR) www.jetir.org 513
less comfortable with risk and with a shorter time horizon will typically opt for a more conservative asset allocation with a higher
component invested in bonds and cash.
A very brief introduction to his portfolio optimization theory is therefore provided with a specific focus on the two required
input; expected return and covariance matrix. In accordance with Markowitz (1952) and most portfolio theory assumes that in
comparing two stock with the same return, a rational investor prefer the one with the smaller variance. Similarly, in comparing
two stocks with the same variance (risk), the one with the larger return is preferable to a rational investor. When the comparison is
not so simple, as for example when one stock has both higher return and variance than another stock, the choice depend on the
investor’s level of risk tolerance. The investor must judge whether the additional return is worth the additional risk. Comparing
portfolios of stock is more complicated but Markowitz (1952).
Portfolio of stocks could be compared and constructed such that; no other portfolio has higher return for the same risk. No
other portfolio has lower risk for same return he called these portfolios efficient and developed computer algorithms to find all
efficient portfolio from a given set of stocks i.e. the efficient frontier. All the identified feasible portfolio minimizes risk for given
level of expected return and maximize expected return for a given level of risk.
Markowitz’s model is viewedas a classic attempt to develop a comprehensive technique to incorporate the concept
ofdiversification of investments in a portfolio as a risk-reduction mechanism; it has manylimitations that need to be resolved.In
1963 William F. Sharpe had developed a simplifiedSingle Index Model (SIM) for portfolio analysis taking cue from Markowitz’s
concept ofindex for generating covariance terms. This model gave us an estimate of a security’s returnas well as of the value of
index. Markowitz’s model was further extended by Sharpe when heintroduced the Capital Assets Pricing Model (CAPM)
(Sharpe, 1964) to solve the problembehind the determination of correct, arbitrage -free, fair or equilibrium price of an asset
(saysecurity).Sharpe’s Single Index Model is very useful to construct anoptimal portfolio by analyzing how and why securities
are included in an optimal portfolio,with their respective weights calculated on the basis of some important variables
underconsideration.
1.3.1Single index model Casual observation of the stock prices over a period of time reveals that most of the stock prices move with the market index.
When the sensex increase, stock prices also tend to increase and vice-versa. This indicate that some underlying factor affect the
market index as well as the stock prices, stock prices are related to the market index and this relationship could be used to
estimate the return on stock. Towards this purpose, the following equation can be used
𝑅𝑖= = ∝i + 𝛽𝑖𝑅𝑚+𝑒𝑖
𝑅𝑖 = expected return on security i
∝i = intercept of the straight or alpha co-efficient
𝑅𝑚 = The rate of return on market index
𝑒𝑖 =Error term
According to the equation, the return of a stock can be divided into two component, the return due to the market and return
independent of the market indicates the sensitiveness of the stock return to the changes in the market return.
The single index model is based on the assumption that stocks vary together because of the common movement in the stock
market and there are no effects beyond the market that account the stock co-movement.
1.4Portfolio Management
An investor considering investment in securities is faced with the problem of choosing from among alarge number of
securities. His choice depends upon the risk-return characteristics of individual securities.He would to choose the most desirable
securities. Again he faced the problem of deciding which securitiesto hold and how much to invest in each. The investor faces an
infinite number of possible portfolios or group of securities. The risk and return characteristics of portfolios differ from those of
individual securities combining to form of portfolio. The investor tries to choose the optimal portfolio taking into consideration
the risk-return characteristics of all possible portfolios.
Organizationally, Investors Manage Impact Portfolios in Different Ways
Some impact investors establish a separate portfolio with its own management team while others employ a “hub-spoke”
strategy where a centralized impact team partners with various portfolio managers across instrument types (such as fixed income
and equity) to manage the portfolio's multiple dimensions. Below we provide some more detail on some of the organizational
structures institutions have established to manage their impact portfolios.
Separate Team:
Some impact investment portfolios are managed by a separate team that will operate alongside program officers responsible
for grant-making, as is the case at foundations like the Rockefeller Foundation with program-related investment (PRI) teams,3 or
alongside the teams making investments into traditional assets as is the case at J.P. Morgan Social Finance.
“Hub-Spoke” Partnership:
Other organizations apply the impact thesis as an overlay strategy to the portfolios they manage. This structure is managed as
a partnership between a centralized team and the individual portfolio management teams to bring consistent oversight to the
cross-portfolio set of impact investments. This is the case for example at PGGM and TIAA-CREF.
Whole Institution:
Still others, mainly asset managers, have their entire institution dedicated to impact investments and split out the portfolios by
instrument, sector or asset type. This is the case, for example, at Bridges Ventures, a UK-based fund manager with real estate
portfolios and equity portfolios, and at Micro Vest, a US-based fund manager with portfolios separated by instrument type (debt

© 2018 JETIR August 2018, Volume 5, Issue 8 www.jetir.org (ISSN-2349-5162)
JETIRA006093 Journal of Emerging Technologies and Innovative Research (JETIR) www.jetir.org 514
and equity). The F.B. Heron Foundation has also committed to bringing their entire portfolio into impact investments, across a
diversified set of asset
1.5Portfolio Evaluation
This is a good time for a review of the academic literature on evaluatingportfolio performance, concentrating on professionally
managed investmentportfolios. While the literature goes back to before the 1960s,recent years have witnessed an explosion of
new methods for performanceevaluation and new evidence on the subject. We think thatseveral forces have contributed to this
renaissance. The demand forresearch on managed portfolio performance increased as mutual fundsand related investment vehicles
became more important to investorsin the 1980s and 1990s. During this period, equity investment becamewidely popular, as
401(k) and other defined-contribution investmentplans began to dominate defined-benefit plans in the United States.Under such
plans, individuals make their own investment choicesfrom a menu of employer-specified options.
• The Jensen Index (Jensen, 1968)
• The Sharp Index (Sharp, 1966)
• The Treynor Index (Treynor, 1965)
All three indices are based on the capital asset pricing model and they are in widespread use. The Jensen Index is a measure of
relative performance based on the security market line, whereas the Treynor and Sharp indices are based on the ratio of the return
to risk. It is generally assumed in the Jensen and Treynor Indices that stocks are priced according to the capital asset pricing
model. We know that capital asset pricing model theory proposes that the expected return on a risky investment is composed of
the risk free rate and a risk premium, where the risk premium is the excess market return over the risk free rate multiplied by beta.
The Jensen and Treynor indices deal with risk-adjusted performance stickle based within the framework of capital asset pricing
model and both are bounded by capital asset pricing model assumptions.
1.5.1The Jensen Index: It is an index that uses the capital asset pricing model (CAPM) to determine whether a money
manager outperformed a market index. In finance, Jensen’s index is used to determine the required (excess) return of a stock,
security or portfolio by the capital asset pricing model. Jensen index utilizes the security market line as a benchmark. In 1970’s,
this measure was first used in the evaluation of mutual fund managers. This model is used to adjust the level of beta risk, so that
riskier securities are expected to have higher returns. It allows the investor to statistically test whether portfolio produced an
abnormal return relative to the overall capital market.
1.5.2 The Treynor Index:In 1965, Treynor’s was the first researcher who computed measure of the portfolio performance. A
measure of a portfolio excess return per unit of risk is equal to the portfolio rate of return minus the risk free rate of return,
dividing by the portfolio beta. This is useful for assessing the excess return, evaluating investors to evaluate how the structure of
the portfolio to different levels of systematic risk will affect the return.
1.5.3 Sharpe Index: In 1966 Sharpe developed a composite measurement of portfolio performance which is very similar to
the Treynor measure. The only difference being the use of standard deviation instead of beta. The Sharpe index is a measure in
which we may measure the performance of our portfolio in a given period of time.
In Sharpe index, we must know three things, the portfolio return, and the risk free rate of return and the standard deviation of
the portfolio. Another thing is that for the risk free rate of return, we may use the average return (over the given period of time).
The standard deviation of the portfolio is measure the systematic risk of the portfolio.
2. REVIEW OF LITERATURE
2.1Expected Returns
Literature has suggested an infinite number of methods to estimate expected returns, see for example Merton (1980),
Campbell &Shiller (1988), Fama& French (1988), Lamont (1998), Lettau&Ludvigson (2001) and Thompson & Polk (2006).
Rashi Mehta (2006-2007) aimed at exploring the upcoming real estate market in India and determines whether there are
lucrative opportunities for investment in the market. The research study was split into six broad sections and an interview and
questionnaire method was adopted for conducting the primary research. The six research areas were; importance and growth of
the real estate industry in India, different avenues for investment in the sector, concerns regarding the sector, the role of the
Government, various capital sources available to realty developers and the future potential of the industry. The interviewees were
all representatives of the real estate market, comprising of real estate development companies, middlemen, i.e. property agents
and consultants and finally realty analysts specializing in forecasting the future market trends of the industry. The respondents of
the questionnaire comprised of the above along with consumers-the end-users of property.
JagannathMallick (2010) aimed at providing an understanding of the economic structure and structural changes in private
investment in the Indian economy. The overarching problem addressed in this study is whether onto identifiable structural
transformation has occurred due to economic reforms in India. What were the trends in private investment in India? Structural
transformation is confined to the shifting or movement of resources from one sector to another within the private economy. This
study utilized descriptive statistics like annual average growth rate, share and Z test statistics to find out the sect oral and sub-sect
oral contributions to the growth of private investment in India as well as to verify the structural changes. Further, it was found that
the contribution of producer services, which includes real estate, ownership of dwellings and business services, and others,
contributed to the growth of private investment in the service sector in India. In this context it is very important to study whether
or not identifiable structural transformations in terms of private occurred in India.
Cornell (1979) was among the first to propose using portfolioweights to measure the performance of trading strategies.
CopelandMayers (1982) modify Cornell’s measure and use it to analyzeValue Line rankings. Grinblatt and Titman (1993)
propose a weightbasedmeasure of mutual-fund performance. The intuition behind weight based performance measures can be

© 2018 JETIR August 2018, Volume 5, Issue 8 www.jetir.org (ISSN-2349-5162)
JETIRA006093 Journal of Emerging Technologies and Innovative Research (JETIR) www.jetir.org 515
motivated, following Grinblattand Titman (1993), with a single-period model where an investor maximizes the expected utility of
terminal wealth.
Which have examined similar strategies in equity and fixed income securities? Previous studies, suchas Jorion (1985), Chopra,
Hensel & Turner (1993) and Stevenson (1999, 2000a Finally two clear differences can be found between the results here and
those studies), have found similar results in that the classical tangency portfolios performs worst ex-ante, and while the use of
Bayes-Stein estimators does lead to improvements in performance, the best performance comes from the minimum-variance
strategy. These findings are however, not confirmed by the current study and are consistent with the findings of Stevenson
(2000c) in his analysis of the American real estate market. None of the alternative strategies consistently outperform the naïve or
market benchmarks, indeed in the individual periods the minimumvariance portfolio tends to perform worse than either of the
benchmarks and the alternative tangency portfolios. The contrast with the findings from the stocks markets is apparent. The
attractiveness of the minimum-risk strategy and the poor performance of the classical tangency approach have been linked to the
financial economics literature on contrarian strategies and mean reversion (Richards, 1997 and Stevenson, 1999, 2000a).
2.2 PORTFOLIO
Mandal, Niranjan(2013) in this research article an attempt has been made to explore the idea to construct an optimal portfolio
empirically using this model. Considering daily indices of BSE sensex as MPI along with the daily stock prices of the ten selected
public sector enterprises for the period of April 2001 to March 2011, the proposed mechanism formulates a unique cut off rate
and selects securities having 'excess-return to beta' ratio greater than or equals to the cut off rate. To arrive at the optimal
portfolio, proportion of investment in each of the selected securities is computed on the basis of its beta value, unsystematic risk,
risk free rate of return excess-return to beta ratio and cut off rate. It is found that SIM gives an easy mechanism of constructing
optimal portfolio and requires lesser input than the input requirement of Markowitz's model to achieve the risk and return of the
optimal portfolio. It is also observed that there is a significant difference between the total risk of the optimal portfolio under SIM
and that of under Markowitz's model.
Bartkus, EdverdasVaclovasPaleviciene, Aiste(2013) the author overviewed the portfolio optimization and evaluation models
and to apply them to form the different portfolios of securities on the Vilnius Stock Market and compare them in the factor of
conservativeness. There were used mean-risk models, such as Markowitz classic model, Mean Absolute Deviation model and
Mini Max model, to optimize the investment portfolio in this research. Studies of this research showed 8 indicators, which have
strongest linear dependence on shares return: VILIBOR interbank interest rate, consumer prices index, producer price index,
construction expenses price index, trade balance, foreign direct investments, gross domestic product and inflation. Multifactorial
analysis results showed that approved model to shares return data is not statistically reliable. Also, after further analysis there
were found that Markowitz and Mean Absolute Deviation models create more conservative and optimal portfolio compared to
MiniMax model, which is more suitable for aggressive and speculative investor.
Demowitz, Glen &Madhaven (2001) and Elton et al. (1993) review the impact of transaction costs while Sengupta (2003) tests
the impact of differences in investment horizon. However, more important is the theory’s sensitivity to the two required inputs;
expected returns and covariance matrix. Depending on the applied method, estimates of these inputs will suffer from estimation
error and/or specification error, both of which Chopra &Ziemba (1993) conclude will effect the portfolio optimization in such a
way that the resulting optimal portfolio is not the true optimal portfolio. Hence, it is of great interest to make the estimates as
good as possible in order to reduce this uncertainty.
MPT is an overall investment strategy that seeks to construct an optimal portfolio by considering the relationship between risk
and return (Correia et al., 2003). MPT is otherwise known as portfolio management theory (Reilly, 1989).
The main indicators used in MPT are the alpha and the beta of investment (Hobbs, 2001). Beta is a measurement of volatility
of an asset or a portfolio relative to a selected benchmark, usually a market index. A beta of 1.0 indicates that the magnitude and
direction of movements of returns for an asset or a portfolio are the same as those of the benchmark. A beta value greater than 1.0
indicates the higher volatility, and a beta value less than 1.0 indicates the lesser volatility when measured against the benchmark
(Yao etal., 2002).
This is the first step in developing a portfolio. At this initial stage, one needs to be able to select securities with the
potential for sustainable growth (Malkiel, 2003). Value investing refers to the determination or identification of a firm’s intrinsic
value11 (Buffet et al., 2002 and Bernstein, 1992). Value investing is an investment paradigm that generally involves the
identification and buying under-priced securities (Graham et al., 1962).
The goal of portfolio optimisation is to maximize the investor’s expected utility by taking into account all relevant information
(Sharpe, 2006). Expected utility refers to the total satisfaction received or experienced.
Sharpe shows that the index model can simplify the portfolio construction problem as proposed by Markowitz (Jacquier et al.,
2001). The simplification was achieved by introducing assumptions. This is shown by Ryan (1978: p. 90), who says that “(i)
index models owe their origin to a seminal paper by Sharpe which introduced a simple but far reaching modification to the basic
Markowitz framework. Sharpe added an additional assumption that observed covariance between the returns on individual
securities is attributable to the common dependence of security yields upon a single common external force – a market
index”.This is a simplified approach to portfolio formulation. Sharpe’s single model is discussed by a direct adaptation from Elton
et al., (2003).
3. RATIONALE OF STUDY
Portfolio construction is the combination of the Investment Philosophy; the research that has gone into the Investment
Process; the macro-analysis of the top down Asset Allocation; and the micro-research of the bottom up Investment

© 2018 JETIR August 2018, Volume 5, Issue 8 www.jetir.org (ISSN-2349-5162)
JETIRA006093 Journal of Emerging Technologies and Innovative Research (JETIR) www.jetir.org 516
Selection.Portfolio Construction is the most under-regarded of all of the investment stages as so many investors think of
investment as one product, strategy or sub-asset class; but it is one of the most important.
The paper aimed to construct an optimal portfolio by using Sharpe’s single index model. For this purpose the monthly closing
prices of companies listed in NSE and NSE index (Nifty) for the period of Jan 2010 – Dec 2016 has been considered. The
findings of this paper will be useful for policy makers, retail investors and other financial market participants.
4. OBJECTIVES OF THE STUDY
i. Risk – return analysis of individual securities listed in NSE.
ii. Allocate investment in different stocks considering risk-return criteria.
iii. Construct optimal portfolio using Sharpe single index model.
5. RESEARCH METHODOLOGY
5.1Data source
This study aims at constructing an optimal portfolio by using Sharpe’s single –index model. For this purpose monthly closing
price of share and monthly closing index value of the benchmark market index (Nifty) have been used for the period from,
January 2010 to December 2016. They were collected from website of NSE. This study takes 48 companies listed in NATIONAL
STOCK EXCHANGE (NSE) out of 50 companies because of unavailability of data. The study has used secondary data because it
pertains to historical analysis of reported financial data. Auction of 91 days Treasury bill has been used as proxy for risk-free rate.
The collected data were consolidated as per study requirement. Various statistical tools have been used to analyze data through
Microsoft excel software.
5.2 Sharpe’s single index model
The single index model assumes that co-movement between stocks is due to movement in the index. The basic equation
underlying the single index model is:
Ri = ∝i + βiRm+ ei
Where Riexpected return on security is i; ∝i is intercept of the straight line or alpha co-efficient (constant) ;β is slope of
straight line or beta co-efficient ;Rmis the rate of return on ,market index and ei is error term.
To analyze return characteristic of the stock, the monthly mean return is calculated the monthly return on each stock is
calculate as follows:
Rit =Pit
Pit −1
− 1
where Rit is the monthly return on stock i at time t; Pit is the monthly closing price of stock i at time t; and Pit -1 is the monthly
closing price of the stock i at time t-1.
The excess return is the difference between the expected return on the stock and the risk less rate of interest such as the rate
on a treasury bill ( here 11.25%p.a is considered as risk free rate based on 91 days treasury bill rate). For the purpose of analyzing
risk characteristic of the stock, systematic risk or beta is calculated. Beta measured how sensitive a stock return due to its
relationship with the return in the market.
𝛽𝑖 = 𝜎𝑖𝑚
𝜎𝑚2
Where 𝜎𝑖𝑚in the covariance of the stock ‘i’ with the market and 𝜎𝑚2 is the variance of the market return to calculate market
return NSE all share price index data is used.
The excess return to beta ratio measures the additional return on a security( excess selection of any stock is directly related to
its excess return-beta ratio: 𝑅𝑖 − 𝑅𝑓
𝛽𝑖
Where𝑅𝑖 = the expected return on stock i: 𝑅𝑓 = the return on riskless asset and 𝛽𝑖 = the expected change in the rate of return
on stocki associated with a 1% change in the market return.
Ranking of the stock (from highest to lowest) is done on the basis of their excess return to beta ratio. This ranking represents
the desirability of any stock’s inclusion in a portfolio. The selection of stock depends on a unique a cut-off rate such that all stock
with higher ratio ( 𝑅𝑖 − 𝑅𝑓)/𝛽𝑖of are included all stock with lower ratios are excluded. This cut-off point is denoted by c*. The
highest 𝐶𝑖value is taken as the cut-off point c*.
𝐶 𝑖 =
𝜎𝑚2 ∑
(Ri −Rf)βi
σei2
𝑛
𝑖=1
1 + 𝜎𝑚2 ∑ (
βi2
σei2 )
𝑛
𝑖=0
Where𝜎𝑚2 the variance in the market index andσi
2 the variance of a stock’s movement that is not associated with the movement
of the market index. This is usually referred to as a stock’s unsystematic risk.
After determining the securities to be selected, the investor should find out how much should be invested in each security. The
percentage invested in each security is
𝑧𝑖 = 𝛽𝑖
𝜎𝑒𝑖2 (
𝑅𝑖 − 𝑅𝑓
𝛽𝑖
) − 𝐶

© 2018 JETIR August 2018, Volume 5, Issue 8 www.jetir.org (ISSN-2349-5162)
JETIRA006093 Journal of Emerging Technologies and Innovative Research (JETIR) www.jetir.org 517
The first expression indicates the weight on each security and they sum up to one. The second expression determines the
relative investment in each security. The residual variance on each security 𝜎𝑖2plays an important role in determining the amount
to be invested each security.
After determining the weight on each security, beta and alpha on a portfolio are calculate in order to find out the portfolio
return and risk. Beta on a portfolio as a weighted average of the individual on each stock in the portfolio where the weights are the
function of the portfolio invested in each stock. Then
βp = ∑ Xi
𝑛
𝑖=1
βi
Similarly define the alpha on the portfolio as
∝p= ∑ Xi
𝑛
𝑖=1
∝i
The return on investor’s portfolio can be represented as
𝑅𝑝 = ∝𝑝+ 𝛽𝑝𝑅𝑚
And the risk of investor’s portfolio as
𝜎𝑝 = √𝛽𝑝2𝜎𝑚
2 + ∑ Xi2
𝑛
𝑖=1
σei2
6. DATA ANALYSIS AND FINDINGS
Firstlythe securities are ranked according to their excess return to beta ratio from highest to lowest;the entire
company offer less return then risk free rate, and then c is calculated in order to find out the optimum C𝑖 the highest C𝑖 value is considered as the optimum ci and this is known as the cut-off point c*.
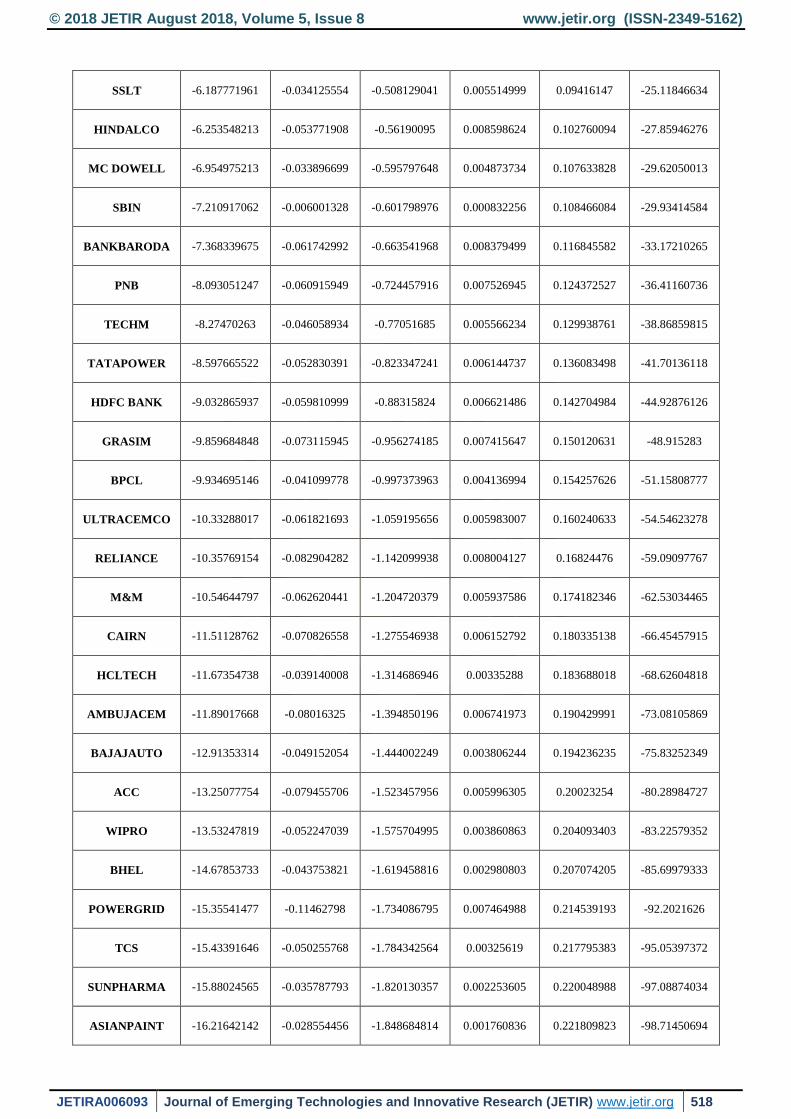
Table 1: Result of optimal portfolio from selected companies (January 2010 to December 2016)
COMPANY
NAME Ri-Rf/b
{(Ri-
Rf)*b}/var ∑{(Ri-
Rf)*b}/var Beta Sq/Var ∑Beta Sq/Var Ci
MARUTI 306.6220106 0.002014355 -2.192320319 6.56951E-06 0.237865193 -118.5912104
TATASTEEL -0.836902854 -0.001300419 -0.002440203 1.55385E-03 1.31662E-05 -0.14726622
HDFC -0.886621243 -0.000184925 -0.001485344 0.000208573 0.00176242 0.016812227
NTPC -3.326019425 -0.000596848 -0.002082192 0.000179448 0.001941868 -0.008514522
INDUSINDBK -4.070793645 -0.043150976 -0.045233168 0.010600138 0.012542006 -1.983613965
DLF -5.042979832 -0.060017881 -0.105251049 0.011901273 0.02444328 -4.903203506
JINDALSTEEL -5.146482798 -0.029202499 -0.134453549 0.005674263 0.030117543 -6.330835132
LT -5.389998389 -0.059573515 -0.194027063 0.011052603 0.041170146 -9.274956754
IDFC -5.431801845 -0.056561627 -0.25058869 0.010413051 0.051583197 -12.07513133
KOTAKBANK -5.910198081 -0.048404446 -0.298993136 0.008189987 0.059773184 -14.51523918
ICICI BANK -5.999000024 -0.072680199 -0.371673335 0.012115386 0.07188857 -18.19015318
AXISBANK -6.061876968 -0.056922863 -0.428596197 0.009390303 0.081278873 -21.07430421
TATAMOTOR -6.163105891 -0.04540729 -0.474003488 0.007367599 0.088646471 -23.38245291
© 2018 JETIR August 2018, Volume 5, Issue 8 www.jetir.org (ISSN-2349-5162)
JETIRA006093 Journal of Emerging Technologies and Innovative Research (JETIR) www.jetir.org 518
SSLT -6.187771961 -0.034125554 -0.508129041 0.005514999 0.09416147 -25.11846634
HINDALCO -6.253548213 -0.053771908 -0.56190095 0.008598624 0.102760094 -27.85946276
MC DOWELL -6.954975213 -0.033896699 -0.595797648 0.004873734 0.107633828 -29.62050013
SBIN -7.210917062 -0.006001328 -0.601798976 0.000832256 0.108466084 -29.93414584
BANKBARODA -7.368339675 -0.061742992 -0.663541968 0.008379499 0.116845582 -33.17210265
PNB -8.093051247 -0.060915949 -0.724457916 0.007526945 0.124372527 -36.41160736
TECHM -8.27470263 -0.046058934 -0.77051685 0.005566234 0.129938761 -38.86859815
TATAPOWER -8.597665522 -0.052830391 -0.823347241 0.006144737 0.136083498 -41.70136118
HDFC BANK -9.032865937 -0.059810999 -0.88315824 0.006621486 0.142704984 -44.92876126
GRASIM -9.859684848 -0.073115945 -0.956274185 0.007415647 0.150120631 -48.915283
BPCL -9.934695146 -0.041099778 -0.997373963 0.004136994 0.154257626 -51.15808777
ULTRACEMCO -10.33288017 -0.061821693 -1.059195656 0.005983007 0.160240633 -54.54623278
RELIANCE -10.35769154 -0.082904282 -1.142099938 0.008004127 0.16824476 -59.09097767
M&M -10.54644797 -0.062620441 -1.204720379 0.005937586 0.174182346 -62.53034465
CAIRN -11.51128762 -0.070826558 -1.275546938 0.006152792 0.180335138 -66.45457915
HCLTECH -11.67354738 -0.039140008 -1.314686946 0.00335288 0.183688018 -68.62604818
AMBUJACEM -11.89017668 -0.08016325 -1.394850196 0.006741973 0.190429991 -73.08105869
BAJAJAUTO -12.91353314 -0.049152054 -1.444002249 0.003806244 0.194236235 -75.83252349
ACC -13.25077754 -0.079455706 -1.523457956 0.005996305 0.20023254 -80.28984727
WIPRO -13.53247819 -0.052247039 -1.575704995 0.003860863 0.204093403 -83.22579352
BHEL -14.67853733 -0.043753821 -1.619458816 0.002980803 0.207074205 -85.69979333
POWERGRID -15.35541477 -0.11462798 -1.734086795 0.007464988 0.214539193 -92.2021626
TCS -15.43391646 -0.050255768 -1.784342564 0.00325619 0.217795383 -95.05397372
SUNPHARMA -15.88024565 -0.035787793 -1.820130357 0.002253605 0.220048988 -97.08874034
ASIANPAINT -16.21642142 -0.028554456 -1.848684814 0.001760836 0.221809823 -98.71450694

© 2018 JETIR August 2018, Volume 5, Issue 8 www.jetir.org (ISSN-2349-5162)
JETIRA006093 Journal of Emerging Technologies and Innovative Research (JETIR) www.jetir.org 519
BHARTIARTL -16.26555678 -0.055993632 -1.904678446 0.003442466 0.22525229 -101.9031738
GAIL -17.27469686 -0.045355242 -1.950033688 0.00262553 0.22787782 -104.4959006
LUPIN -19.39216717 -0.0244303 -1.974463987 0.001259802 0.229137623 -105.9018256
DRREDDY -19.43957974 -0.027731097 -2.002195085 0.001426528 0.23056415 -107.4979179
INFOSYS -19.91805832 -0.053124311 -2.055319396 0.002667143 0.233231293 -110.5595266
ITC -25.84230766 -0.042650133 -2.097969529 0.0016504 0.234881693 -113.0472828
CIPLA -28.99604453 -0.054558786 -2.152528315 0.001881594 0.236763287 -116.2435966
HINDUSTANILV
R -36.37705578 -0.039366157 -2.191894472 0.00108217 0.237845457 -118.5665686
ONGC -185.3382717 -0.002440203 -2.194334675 1.31662E-05 0.237858623 -118.7138348
From table 1 it can be seen that among 48 companies the optimum portfolio consist of investing in 3 companies which(𝑅𝑖 −𝑅𝑓)/βi is greater than a particular cut-off point c*. Here, the cut-off rate is
Table 1 clearly explains the result of empirical analysis. Only those securities are desirable in the portfolio, which have
positive excess return over risk free return. In short sales is not allowed, it is seen that the optimum portfolio consists of only 3
securities with the largest investment in MARUTI Company and smallest investment in HDFC.
The results are almost similar to the earlier result. All the securities which have excess return to beta ratio more than the cut-
off point are included in the portfolio and the securities included in the portfolio. Such portfolio is the optimum portfolio and the
securities included in the portfolio are the efficient securities.
The study that follows 48 stocks needs 494 numbers of input as against forMarkowitz model. So, it can be stated that
implementation of Markowitz model is much more time-consuming and more complex by the number of estimate required. And
the framework ofSharpe’s index model for optimal portfolio construction is very simple and useful. Theresults are almost similar
to the earlier result.
7. CONCLUSION
Risk and return play an important role in making any investment decision. This study aims at analyzing the opportunity that
are available for investors as per as returns are concerned and the investment of risk thereof while investing in equity of firms
listed in NATIONAL STOCK EXCHANGE. Sharpe’s index model was applied by using the monthly closing prices of 48
companies listed in NSE and NSE NIFTY for the period from January 2010 to December 2016.
The study came out with three stocks in the portfolio constructed as per Sharpe Index model and they were MARUTI,
TATASTEEL, HDFC, Out of these the highest investment allocation in MARUTI.
8. LIMITATIONS
This study attempts to construct an optimal portfolio by using Sharpe’s single-index model and thereby helps to make
investment decision. The current study however has some limitations. This study did not take into consideration the companies
that are not listed on the NSE and the companies that are listed and traded but stopped operation. This study used monthly data
rather than daily data. This study has successfully constructed an optimal portfolio consisting of 3 securities among various
sectors; future research mat concentrate on portfolio selection model and the development of new portfolio selection model and
policies.
REFERENCES
1. Banachewicz, KonradLucas, AndréVanDerVaart, Aad (2012) Finance 5, 27–34) to Brian Satterlee(2013)business course in
Investment 7,48-57.
2. Bo, HLensink,R., and Sterken, E., (2003) Uncertainty and Financing Constraints. European Finance Review, 7, 297-321.
3. Bond, S. and C. Meghir (1994) Financial Constraints and Company Investment, Fiscal Studies, 15, 2, 1-18.
4. Chopra, V. &Ziemba,W. 1993, "The Effect of Errors in Means, Variances andCovariances on Optimal Port-folio Choice",
Journal of Portfolio Management, vol. 19, no. 2, pp.6‐11.
5. Chopra, V.K., Hensel, C.R. and Turner, A.L. (1993) Massaging Mean Variance Inputs: Returns form Alternative Global
Investment Strategies in the 1980’s, Management Science, 39, 845-855.

© 2018 JETIR August 2018, Volume 5, Issue 8 www.jetir.org (ISSN-2349-5162)
JETIRA006093 Journal of Emerging Technologies and Innovative Research (JETIR) www.jetir.org 520
6. Cornell, B. (1979), ‘Asymmetric information and portfolio performance Measurement’.Journal of Financial Economics 7,
381–390
7. Correia, C., Flynn, D., Uliana, E. and Wormald, M. (2003) Financial Management, Fifth Edition, Juta& Co. Ltd.
8. Daniel, K., M. Grinblatt, S. Titman, and R. Wermers (1997), ‘Measuring mutual fund performance with characteristic-based
benchmarks’. Journal of Finance 52, 1035–1058
9. Domowitz ,I.,Glen, J.&Madhavan,A. 2001,"Liquidity,Volatility and EquityTrading Costs Across Countriesand Over Time",
International Finance, vol. 4, no. 2, pp. 221.
10. Elton,E.J., Grube r, M.J., Das, S &Hlavka, M. 1993, "Efficiency with Costly Information: A Reinterpretation of Evidence
from Managed Portfolios", The Review of Financial Studies, vol. 6, no.1,pp
11. Fazzari, S., Hubbard, R., and Petersen, B., (1988) Financing Constraints and Corporate Investment. Brooking Papers on
Economic Activity, 1, 141-195.
12. Grinblatt, M. and S. Titman (1989a), ‘Mutual fund performance: An analysis of quarterly portfolio holdings’.Journal of
Business 62, 393–416.
13. Grinblatt, M. and S. Titman (1989b), ‘Portfolio Performance evaluation: Old issues and new insights’.Review of Financial
Studies 2,393–422.
14. Grinblatt, M. and S. Titman (1993), ‘Performance measurement without benchmarks: An examination of mutual fund
returns’. Journal of Business 60, 97–112.
15. Grinblatt, M., S. Titman, and R. Wermers (1995), ‘Momentum strategies, portfolio performance and herding: A study of
mutual funbehavior’. American Economic Review85, 1088–1105
16. Hassett, K. A. (2007) Investment, in The Concise Encyclopedia of Economics, David R. Henderson (ed.), Liberty Fund, Inc.
17. Hoshi, T., A. K. Kashyap and D. Scharfstein (1990) The Role of Banks in Reducing the Cost of Financial Distress in Japan,
Journal of Financial Economics, 27, 1, 67-88.
18. Hubbard, R. G. (1998) Capital-Market Imperfections and Investment, Journal of Economic Literature, 36, 193-225.
19. Jensen, M. C. (1986) Agency Cost of Free Cash Flow, Corporate Finance, and Takeovers, American Economic Review, 76,
2, 323-329.
20. Jorge Cunha, Antonio Paisana (2012) Investment is an important economic18-457-97
21. Jorion, P. (1985) International Portfolio Diversification with Estimation Risk, Journal of Business, 58, 259-278.
22. Kim, J. (1999) The Relaxation of Financing Constraints by the Initial Public Offering of Small Manufacturing Firms, Small
Business Economics, 12, 191-202.
23. Mayers, D. and E. M. Rice (1979), “Measuring portfolio performance and the empirical content of asset pricing models”.
Journal of Financial Economics 7, 3–28.
24. Mizen, P., and Vermeulen, P., (2004) Corporate Investment and Financial Constraints: What Drives the Relationship?. ECB
Working Paper.
25. Myers, S. C. (1984) The Capital Structure Puzzle, Journal of Finance, 39, 575-592.
26. Myers, S. C. and N. S. Majluf (1984) Corporate Financing and Investment Decisions When Firms Have Information that
Investors Do Not Have, Journal of Financial Economics, 13, 2, 187-221.
27. Oliner, S. and G. Rudebusch (1992) Sources of the Financing Hierarchy for Business Investment and Agency Costs, Review
of Economics and Statistics, 74, 643-653.
28. Palenzuela, V., and Iturriaga, F., (1998) Déterminants Financiers de l'InvestissementenCapiatl Fixe: Le CasEspagnol. Revue
D'EconomieIndustrielle, 25-48.
29. Poterba, J. M. and L. H. Summers (1983) Dividend Taxes, Corporate Investment, and "q", Journal of Public Economics, 22,
136-167.
30. Rashi Mehta (2006-2007) this dissertation aims at exploring 22.189.54
31. Richards, A.J. (1997). Winner-Loser Reversals in National Stock Indices: Can They be Explained ?, Journal of Finance, 52,
2129-2144.
32. Schaller, H. (1993) Asymmetric Information, Liquidity Constraints and Canadian Investment, Canadian Journal of
Economics, 26, 552-574.
33. Sengupta, J.K. 2003, "Efficiency tests for mutual fund portfolios", Applied Financial Economics, vol. 13,no. 12, pp. 849.
34. Stefan Sackmann Dennis Kundisch and Markus Ruch (2013) 85.145.4932
35. Stevenson, S. (1999) Emerging Markets, Downside Risk & the Asset Allocation Decision, Paper presented at the Financial
Management Association annual conference, Orlando, Florida.
36. Stevenson, S. (2000a) Bayes-Stein Estimators and International Real Estate Asset Allocation, Paper presented at the Pacific -
Rim Real Estate Society annual meeting, Sydney, Australia and the American Real Estate Society annual meeting, Santa
Barbara, California.
37. Stevenson, S. (2000a) Bayes-Stein Estimators and International Real Estate Asset Allocation, Paper presented at the Pacific -
Rim Real Estate Society annual meeting, Sydney, Australia and the American Real Estate Society annual meeting, Santa
Barbara, California.
38. Stevenson, S. (2000c) The Out-of-Sample Performance of Optimal Portfolios: Empirical Tests with the NCREIF, Paper
presented at the American Real Estate Society annual meeting, Santa Barbara, California.
39. Stiglitz, J. E. and A. Weiss (1981) Credit Rationing in Markets with Imperfect Information, American Economic Review, 71,
3, 393-410.
40. Tobin, J. (1969) A General Equilibrium Approach to Monetary Theory, Journal of Money, Credit, Banking, 1, 1, 15-29.

© 2018 JETIR August 2018, Volume 5, Issue 8 www.jetir.org (ISSN-2349-5162)
JETIRA006093 Journal of Emerging Technologies and Innovative Research (JETIR) www.jetir.org 521
41. Zheng, L. (1999), ‘Is money smart? A study of mutual fund investors’ fund selection ability’. Journal of Finance 54, 901–
933.