optimal placement of switching and protection devices in...
TRANSCRIPT

Turk J Elec Eng & Comp Sci(2019) 27: 181 – 196© TÜBİTAKdoi:10.3906/elk-1806-130
Turkish Journal of Electrical Engineering & Computer Sciences
http :// journa l s . tub i tak .gov . t r/e lektr ik/
Research Article
Optimal placement of switching and protection devices in radial distributionnetworks to enhance system reliability using the AHP-PSO method
Masoud AMOHADI1 , Mahmud FOTUHI-FIRUZABAD2,∗
1Department of Electrical Engineering, Islamic Azad University, Science and Research Branch, Tehran, Iran2Department of Electrical Engineering, Sharif University of Technology, Tehran, Iran
Received: 18.06.2018 • Accepted/Published Online: 17.10.2018 • Final Version: 22.01.2019
Abstract: This paper presents a new method to determine the optimal number and locations of autorecloser andsectionalizer switches (AR/S) in distribution networks. The costs of AR/S investment, switch maintenance, andundistributed energy as well as reliability coefficients are considered in the objective function. Reliability parameterssuch as SAIFI, SADI, MAIFI, and ENS are evaluated in the case study system. As a new method, the weights of thereliability parameters are obtained by decision-makers using the analytical hierarchy process (AHP). The optimal size,type, and location of automatic switches are determined by minimizing the objective function using the particle swarmoptimization (PSO) algorithm. The effectiveness of the proposed method is tested by implementing it on two feeders ofIsfahan’s electric distribution network. The results indicate the efficiency and applicability of the proposed method.
Key words: AHP analysis, reliability parameters, objective function, PSO algorithm, autorecloser and sectionalizerswitches, optimal placement
1. IntroductionThe supply of stable and continuous energy for electrical customers has a vital role in our lives. Past experiencesshow that a high percentage of network interruptions are related to power distribution networks. Since mostof the faults that occur are transient, using automatic switching devices in appropriate points of the networkcan substantially reduce customer outages [1]. If automatic switches are used at optimal points of the system,undistributed energy (ENS) will be effectively reduced. When a fault occurs in a section of the system, theautorecloser disconnects the faulty section from the system. After a few moments, the autorecloser reconnectsthis section to the system. If the fault has not been resolved, the recloser operates for the second time andthe sectionalizer isolates the faulty section. There are various methods for determining the optimal points ofautomatic switches in distribution networks. A genetic algorithm (GA) based on cost/worth analysis was usedfor switch placement in distribution networks in [2]. The GA and PSO algorithms were used to determinethe optimal locations of automatic switching devices with minimum cost and maximum reliability in [3,4].A computer program was presented to reduce service blackouts using switching devices by using cost/worthanalysis in [5]. A scheme based on cost minimization was applied to obtain the locations of switching devicesin electrical distribution networks by using a GA in [6]. Reliability indices for customer services were studiedusing automatic control switches in a case study network [7]. Remote-controlled sectionalizers were placed inradial distribution systems to minimize the cost function in the mixed-integer linear programming method in∗Correspondence: [email protected]
This work is licensed under a Creative Commons Attribution 4.0 International License.181
AMOHADI and FIRUZABAD/Turk J Elec Eng & Comp Sci
[8]. The weights of the reliability indices obtained by the AHP algorithm were used to determine the optimallocation of switches in distribution networks in [9,10]. The GA and graph theory were used to specify thelocation of switching devices in radial distribution systems [11]. The PSO algorithm based on cost/worthanalysis was applied for switch placement. The locations and numbers of faults that occurred were consideredin order to specify autorecloser switches in a test system in [12]. The reliability parameters were improved byrelocating the switches based on minimization of customer outage costs in [13]. A GA approach was used toobtain optimal points of switching and protective equipment on a power distribution system in [14]. By useof sectionalizers in optimal points of the networks, SAIDI was reduced, while using autoreclosers as protectionequipment can significantly decrease SAIFI and MAIFI. The weights of the reliability parameters (SAIFI, SAIDI,and MAIFI) are obtained by decision-makers using the AHP algorithm as a new approach presented in thispaper. A reliability factor is defined based on the weight of the reliability parameters, and the cost function isformulated by using investment cost, maintenance cost, and undistributed energy cost. A PSO algorithm usingcost/reliability analysis is applied to determine the types, sizes, and locations of autoreclosers and sectionalizersin radial distribution networks [15,16]. A computer program is presented to implement the proposed method intwo sample feeders of Isfahan’s electric distribution network.
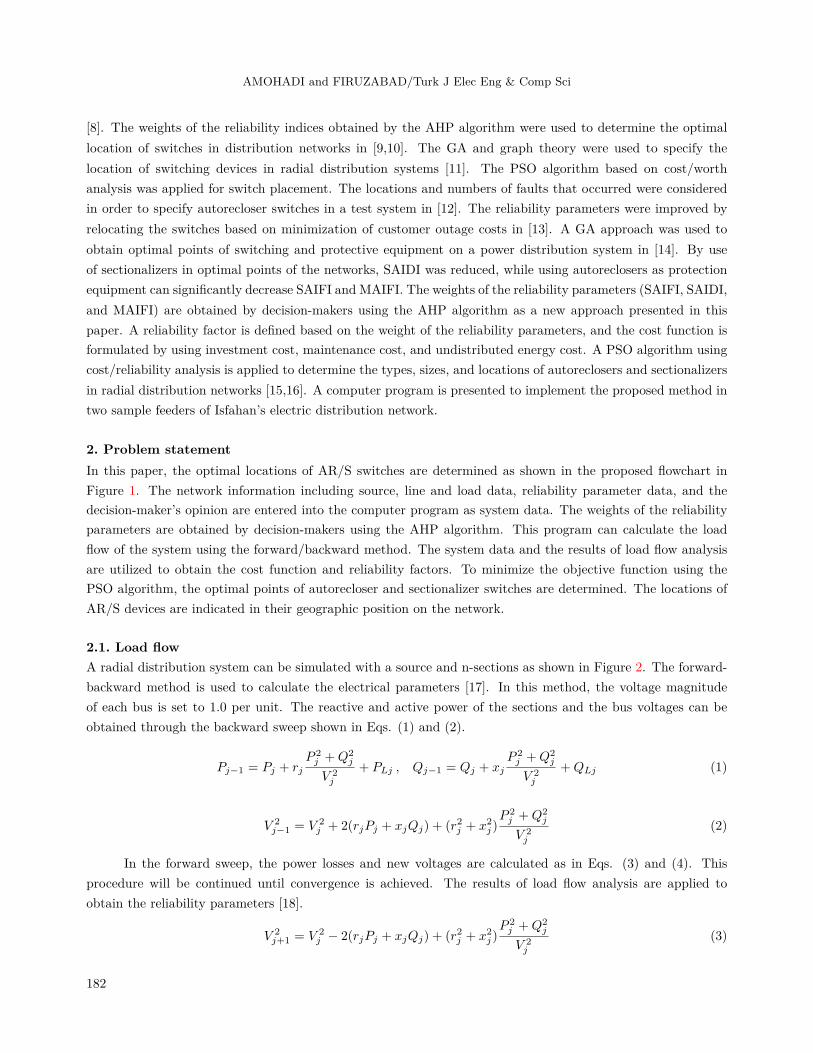
2. Problem statementIn this paper, the optimal locations of AR/S switches are determined as shown in the proposed flowchart inFigure 1. The network information including source, line and load data, reliability parameter data, and thedecision-maker’s opinion are entered into the computer program as system data. The weights of the reliabilityparameters are obtained by decision-makers using the AHP algorithm. This program can calculate the loadflow of the system using the forward/backward method. The system data and the results of load flow analysisare utilized to obtain the cost function and reliability factors. To minimize the objective function using thePSO algorithm, the optimal points of autorecloser and sectionalizer switches are determined. The locations ofAR/S devices are indicated in their geographic position on the network.
2.1. Load flowA radial distribution system can be simulated with a source and n-sections as shown in Figure 2. The forward-backward method is used to calculate the electrical parameters [17]. In this method, the voltage magnitudeof each bus is set to 1.0 per unit. The reactive and active power of the sections and the bus voltages can beobtained through the backward sweep shown in Eqs. (1) and (2).
Pj−1 = Pj + rjP 2j +Q2
j
V 2j
+ PLj , Qj−1 = Qj + xj
P 2j +Q2
j
V 2j
+QLj (1)
V 2j−1 = V 2
j + 2(rjPj + xjQj) + (r2j + x2j )P 2j +Q2
j
V 2j
(2)
In the forward sweep, the power losses and new voltages are calculated as in Eqs. (3) and (4). Thisprocedure will be continued until convergence is achieved. The results of load flow analysis are applied toobtain the reliability parameters [18].
V 2j+1 = V 2
j − 2(rjPj + xjQj) + (r2j + x2j )P 2j +Q2
j
V 2j
(3)
182

AMOHADI and FIRUZABAD/Turk J Elec Eng & Comp Sci
Start
System Data
End
AHP Algorithm Load Flow
Weights of Parameters Reliability Parameters
Objective Function (Fn)
Optimal Placement (PSO)
Number and Location
of Automatic Switches (AR/S) 1P Q, 2P Q, 0P Q = =
1
1
L
L
P
Q2
2
L
L
P
QLn
Ln
P
Q
0V 11
V2V n
n n
V2
Figure 1. Flowchart of the AR/S optimal placement. Figure 2. Single-line diagram of radial distribution sys-tem.
PLoss =∑n−1
j=1rj
(P 2j +Q2
j
V 2j
)(4)
2.2. Load centerThe load center is one of the major points in power distribution networks and all loads can be considered tobe located at that point. Experience shows that the optimal points for placement of transformers, capacitors,regulators, and reclosers are obtained to be near the load center. The load center point is calculated from Eq.(5) as follows:
Xlc =∑n
i=1Pi
Xi∑Pi
, Ylc =∑n
i=1Pi
Yi∑Pi
(5)
Here, n is the number of loads, Pi is the active power at bus i in KW, Xi and Yi are the geographic coordinatesof the load related to bus i, and Xlc and Ylc are the geographical coordinates of the load center.
2.3. Objective functionSwitching and protective devices such as reclosers and sectionalizers are used in power distribution networks toreduce system interruptions during the occurrence of a fault [19]. Using this equipment imposes some costs, asshown in Eq. (6).
TCn = (ICn +MCn − PERn) (6)
Here, TCn is the total cost for n years, INVCn is the price of buying automatic switches, MAINTCn is themaintenance cost, and PERn is the profit of reducing ENS for n years.
183

AMOHADI and FIRUZABAD/Turk J Elec Eng & Comp Sci
2.3.1. Investment costInvestment cost includes the cost of purchasing the equipment and installation costs as formulated in Eq. (7).
ICn = (CR_INV ·NR + CS_INV ·NS)(1 + IntR)n (7)
Here, n is the study period in years, INVC is investment cost, CR_INV is price of a recloser, NR is the numberof reclosers, CS_INV is price of a sectionalizer, NS is the number of sectionalizers, and IntR is annual interestrate.
2.3.2. Maintenance costMaintenance cost defines operation and service costs of AR/S switches as calculated in Eq. (8).
MCn =∑n
i=0(CRMNR + CSMNS)(1 + InfR)
i (8)
Here, n is the study period in years, MAINTC is the maintenance cost, CRM is the maintenance cost of reclosers,NR is the number of reclosers, CSM is maintenance cost of sectionalizers, NS is the number of sectionalizers,and InfR is the annual inflation rate.
2.3.3. The profit of undistributed energy reduction
When a permanent fault occurs, a specific amount of energy (known as ENS) is not delivered to the electricalcustomers. This energy is expressed by Eq. (9).
ECn =∑m
i=1Ci · Li · Ui (9)
Here, n is the study period in years, ENSC is the energy not supplied for m loads, Ci is the interruption cost in$/KWH, Li is the average energy in KW, and Ui is the interruption time in h/year. If AR/S switches are usedin power distribution networks, undistributed energy is decreased significantly. The profit gained by reductionin ENS is obtained as shown in Eq. (10).
PERn =∑n
i=1 K(ECw − ECS).ki
K = (1 + grf).(1 + IntR)(10)
Here, n is the study period in years, PERn is the profit of ENS reduction, ENSCw is the cost of ENS withoutany switches, ENSCS is the cost of ENS with automatic switches, grf is the annual load growth factor, intR isthe annual interest rate , and K is the coefficient of the equation.
2.3.4. Reliability indicesIn this paper, reliability parameters are described as SAIFI, SAIDI, and MAIFI. The system average interruptionfrequency index is called SAIFI and the per-unit value of SAIFI is defined as formulated in Eq. (11).
SAIFI =∑m
i=1
λi ·Ni
NT, SAIFI(p.u) =
SAIFIsSAIFIw
(11)
Here, m is the number of load buses, i is the failure rate in the ith branch (f/year), Ni is the number of customersconnected to load bus i, NT is the total number of loads, SAIFIW is SAIFI without any switches, and SAIFIS
184
AMOHADI and FIRUZABAD/Turk J Elec Eng & Comp Sci
is SAIFI with automatic switches installed. The system average interruption duration index is called SAIDIand the per-unit value of SAIDI is defined as formulated in Eq. (12).
SAIDI =∑m
i=1
Ui ·Ni
NT, SAIDI(p.u) =
SAIDIsSAIDIw
(12)
Here, Ui is the average restoration time in the ith branch (h/year), SAIDIW is SAIDI without any switches,and SAIDIS is SAIDI with automatic switches installed. MAIFI is defined as momentary average interruptionfrequency index and the per-unit value of the MAIFI index is formulated in Eq. (13).
MAIFI =∑m
i=1
γi ·Ni
NT, MAIFI(p.u) =
MAIFIsMAIFIw
(13)
Here, i is the average rate of momentary interruptions at load point i (m.f/year), MAIFIW is MAIFI withoutany switches, and MAIFIS is MAIFI with automatic switches installed.
The weights of the reliability parameters are obtained by decision-makers consisting of operators, engi-neers, and managers using the AHP method. These weights are defined as SAIFIw, SAIDIw, and MAIFIw, tobe discussed in Section 4.1.2. To obtain the optimal location and number of AR/S switches, it is necessary tooptimize the cost function (TCn) and reliability factors (RFa or RFw).
2.3.5. Objective function
As defined in Eq. (6), the total cost consists of investment cost, maintenance cost, and the profit of ENSreduction. The average of the reliability parameters (RFa) and the reliability factor based on weights of indices(RFw) can be formulated using Eq. (14). The objective function (Fn) is defined as the minimum value of totalcost and weight-reliability factor as formulated in Eq. (15).
RFa = (SAIFIp.u+ SAIDIp.u+ MAIFIp.u)/3RFw = SAIFIw .SAIFI + SAIDIw. SAIDI +MAIFIw .MAIFI
(14)
Fn = min(TC,RFw) (15)
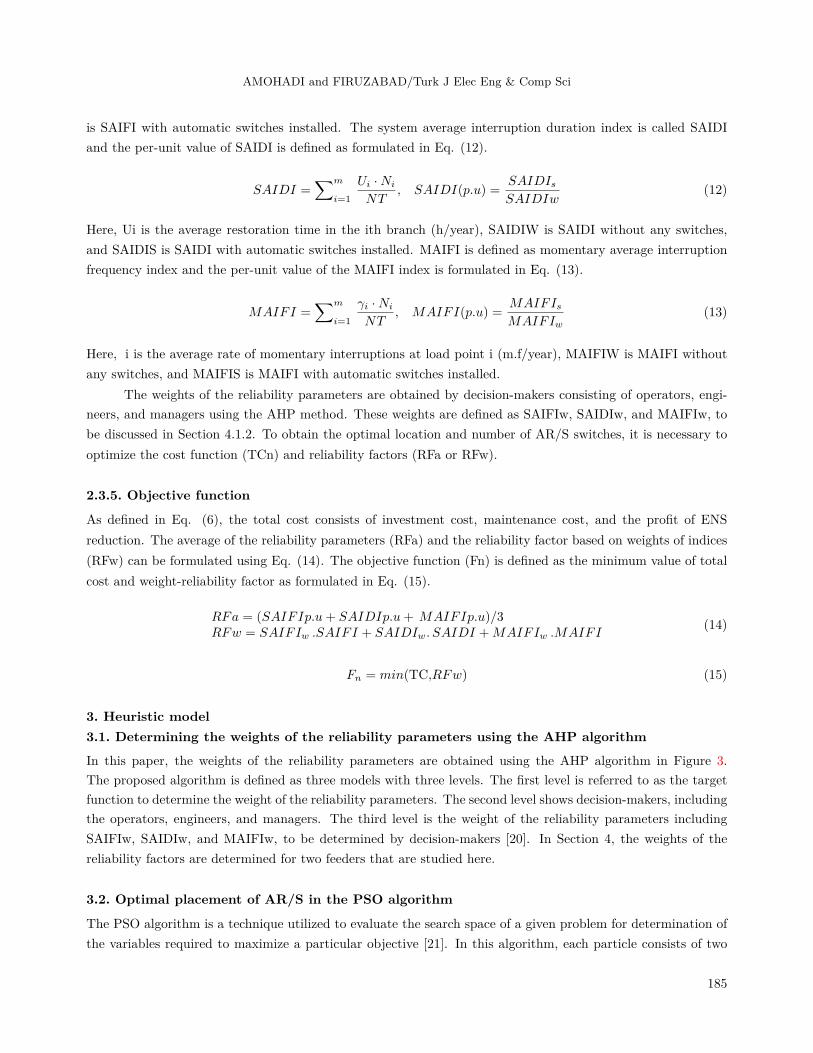
3. Heuristic model3.1. Determining the weights of the reliability parameters using the AHP algorithm
In this paper, the weights of the reliability parameters are obtained using the AHP algorithm in Figure 3.The proposed algorithm is defined as three models with three levels. The first level is referred to as the targetfunction to determine the weight of the reliability parameters. The second level shows decision-makers, includingthe operators, engineers, and managers. The third level is the weight of the reliability parameters includingSAIFIw, SAIDIw, and MAIFIw, to be determined by decision-makers [20]. In Section 4, the weights of thereliability factors are determined for two feeders that are studied here.
3.2. Optimal placement of AR/S in the PSO algorithm
The PSO algorithm is a technique utilized to evaluate the search space of a given problem for determination ofthe variables required to maximize a particular objective [21]. In this algorithm, each particle consists of two
185
AMOHADI and FIRUZABAD/Turk J Elec Eng & Comp Sci
Determination of the weight of the reliability indices
Operators Engineers Managers
SAIDIwSAIFIw MAIFIw
Figure 3. Determination of the weights of reliability indices in the AHP algorithm.
parameters: position parameter xik (consisting of candidate solution and its fitness) and velocity parameter vik,where k is the number of repetitions for the ith particle. The PSO algorithm maintains the best fitness valueobtained among all particles, called the global best fitness (gbest), and the candidate solution that obtains thisfitness is called the best global position (pbest).This scheme consists of three steps:1) Particle fitness determination,2) Updating the position and global best fitnesses,3) Updating particle position and velocity.This process is repeated to obtain the optimal condition. The swarm updates its velocity and position variablesthrough Eqs. (16) and (17).
v(t+ 1) = v(t) + c1r1,t [pbest − x(t)] + c2r2,t [gbest − x(t)] (16)
x(t+ 1) = x(t) + v(t+ 1) (17)
Here, t is the iteration number, v(t) is particle velocity, x(t) is particle position, pbest is the best particlesolution, gbest is the global best solution at iteration number, r1,t and r2,t are random numbers (0<r1,t<1,0<r2,t<1), and c1 and c2 are effective factors in the algorithm’s convergence rate (and usually c1=c2=2). Twoconditions are considered for automatic switches in this paper (0: no switch installation and 1: switch installa-tion).There are three states in each location defined as:a) Autorecloser switches.b) Sectionalizer switches.c) None of the automated switches.
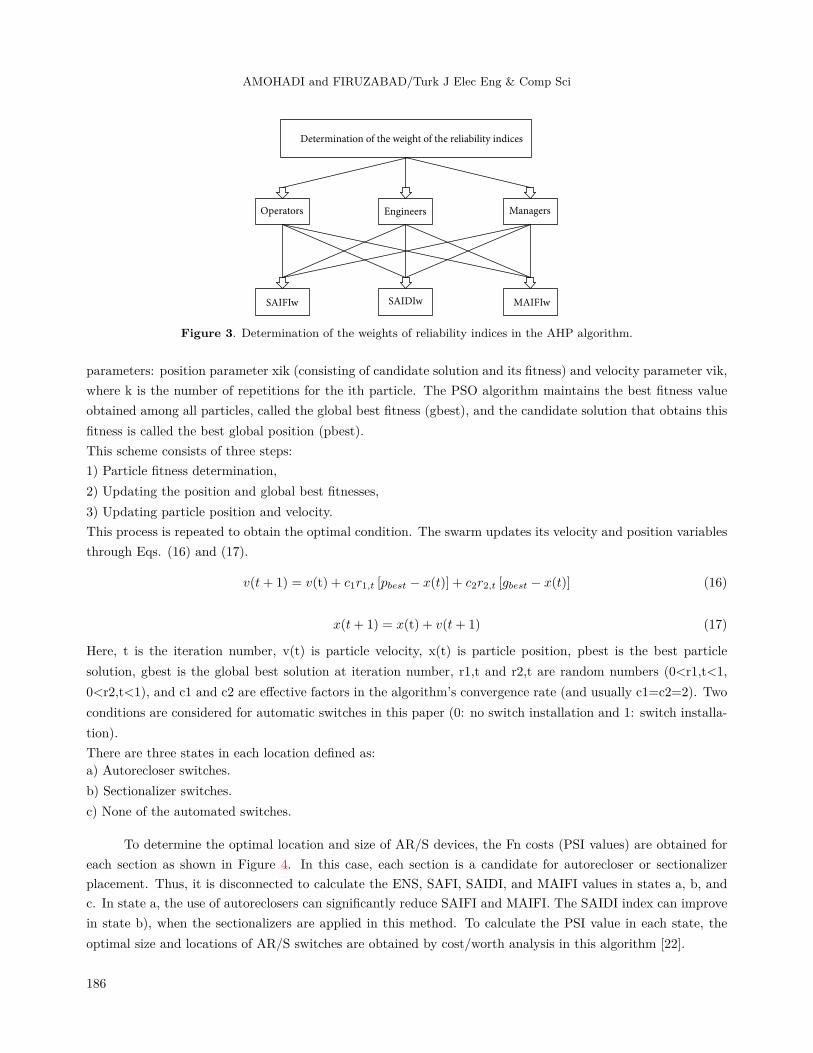
To determine the optimal location and size of AR/S devices, the Fn costs (PSI values) are obtained foreach section as shown in Figure 4. In this case, each section is a candidate for autorecloser or sectionalizerplacement. Thus, it is disconnected to calculate the ENS, SAFI, SAIDI, and MAIFI values in states a, b, andc. In state a, the use of autoreclosers can significantly reduce SAIFI and MAIFI. The SAIDI index can improvein state b), when the sectionalizers are applied in this method. To calculate the PSI value in each state, theoptimal size and locations of AR/S switches are obtained by cost/worth analysis in this algorithm [22].
186
AMOHADI and FIRUZABAD/Turk J Elec Eng & Comp Sci
Start
Network Data
Load Flow
Calculate PSI Value for EachSection of the Network
Check the OtherSection Value
Optimal Locationof AR/S
Run IPSO to Determine the Optimal Size of AR/S
Is the PSI ValueMaximum?
OptimumNumber ofAR/S?
End
Yes
Yes
No
No
Figure 4. AR/S placement using the PSO algorithm.
4. Simulation resultsThe proposed method is simulated by a program supported with Visual Basic 6 and Access database. Thisprogram has the following features:• Drawing the system in the geographical scheme.• Tracing the sections and nodes.• Calculation of load flow.• Determination of weights of reliability parameters.• Automatic switch placement using the PSO algorithm.• Indicating the results in the geographic state of the system.Two test feeders of Isfahan’s electrical distribution network are studied in the present work.
4.1. Simulation of Isfahan’s 32-bus electric system
In this part, a radial 20-kV feeder of Isfahan’s electric distribution network with 32 buses (feeder F1) connectedto the 20/0.4-kV transformers is simulated using the section by section method.
4.1.1. Calculation of load flow and reliability parameters
It is essential to collect the existing data of the feeder under study (F1) for calculating the electrical andreliability parameters. These data include section number (Sec), section nodes (Nod I, NodJ), line impedance(Rl, Xl) in Ω/KM, section length (L) in km, load active power (PL) in kW, load reactive power (QL) in kVAR,failure rate (λ) in f/year, mean restoration time (U) in h/year, average rate of momentary interruptions γ in
187
AMOHADI and FIRUZABAD/Turk J Elec Eng & Comp Sci
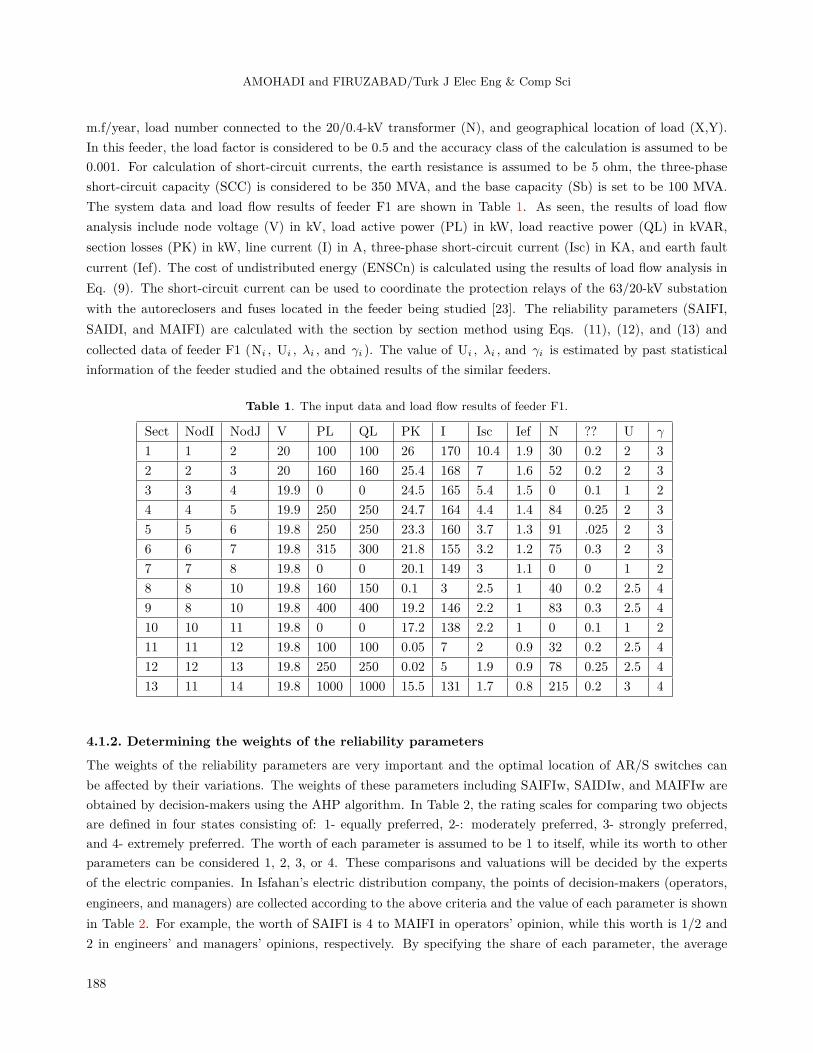
m.f/year, load number connected to the 20/0.4-kV transformer (N), and geographical location of load (X,Y).In this feeder, the load factor is considered to be 0.5 and the accuracy class of the calculation is assumed to be0.001. For calculation of short-circuit currents, the earth resistance is assumed to be 5 ohm, the three-phaseshort-circuit capacity (SCC) is considered to be 350 MVA, and the base capacity (Sb) is set to be 100 MVA.The system data and load flow results of feeder F1 are shown in Table 1. As seen, the results of load flowanalysis include node voltage (V) in kV, load active power (PL) in kW, load reactive power (QL) in kVAR,section losses (PK) in kW, line current (I) in A, three-phase short-circuit current (Isc) in KA, and earth faultcurrent (Ief). The cost of undistributed energy (ENSCn) is calculated using the results of load flow analysis inEq. (9). The short-circuit current can be used to coordinate the protection relays of the 63/20-kV substationwith the autoreclosers and fuses located in the feeder being studied [23]. The reliability parameters (SAIFI,SAIDI, and MAIFI) are calculated with the section by section method using Eqs. (11), (12), and (13) andcollected data of feeder F1 (Ni , Ui , λi , and γi ). The value of Ui , λi , and γi is estimated by past statisticalinformation of the feeder studied and the obtained results of the similar feeders.
Table 1. The input data and load flow results of feeder F1.
Sect NodI NodJ V PL QL PK I Isc Ief N ?? U γ
1 1 2 20 100 100 26 170 10.4 1.9 30 0.2 2 32 2 3 20 160 160 25.4 168 7 1.6 52 0.2 2 33 3 4 19.9 0 0 24.5 165 5.4 1.5 0 0.1 1 24 4 5 19.9 250 250 24.7 164 4.4 1.4 84 0.25 2 35 5 6 19.8 250 250 23.3 160 3.7 1.3 91 .025 2 36 6 7 19.8 315 300 21.8 155 3.2 1.2 75 0.3 2 37 7 8 19.8 0 0 20.1 149 3 1.1 0 0 1 28 8 10 19.8 160 150 0.1 3 2.5 1 40 0.2 2.5 49 8 10 19.8 400 400 19.2 146 2.2 1 83 0.3 2.5 410 10 11 19.8 0 0 17.2 138 2.2 1 0 0.1 1 211 11 12 19.8 100 100 0.05 7 2 0.9 32 0.2 2.5 412 12 13 19.8 250 250 0.02 5 1.9 0.9 78 0.25 2.5 413 11 14 19.8 1000 1000 15.5 131 1.7 0.8 215 0.2 3 4
4.1.2. Determining the weights of the reliability parameters
The weights of the reliability parameters are very important and the optimal location of AR/S switches canbe affected by their variations. The weights of these parameters including SAIFIw, SAIDIw, and MAIFIw areobtained by decision-makers using the AHP algorithm. In Table 2, the rating scales for comparing two objectsare defined in four states consisting of: 1- equally preferred, 2-: moderately preferred, 3- strongly preferred,and 4- extremely preferred. The worth of each parameter is assumed to be 1 to itself, while its worth to otherparameters can be considered 1, 2, 3, or 4. These comparisons and valuations will be decided by the expertsof the electric companies. In Isfahan’s electric distribution company, the points of decision-makers (operators,engineers, and managers) are collected according to the above criteria and the value of each parameter is shownin Table 2. For example, the worth of SAIFI is 4 to MAIFI in operators’ opinion, while this worth is 1/2 and2 in engineers’ and managers’ opinions, respectively. By specifying the share of each parameter, the average
188

AMOHADI and FIRUZABAD/Turk J Elec Eng & Comp Sci
weights of the reliability parameters are calculated as shown in Table 3. The mean values of the parameterscomputed in Table 3 are shown in Table 4. In this table, the weight of SAIFIw is more important than those ofothers in the operator’s opinion, while SAIDIw and MAIFIw are important weights for engineers, and SAIFIwand SAIDIw are the main indices from the viewpoint of managers. In the second layer of the AHP model, theworth of each decision-maker is obtained based on their organizational responsibilities and obtained surveys.The average of their normalized weights is calculated and shown in Table 5. By multiplying the mean columnof Table 5 by the corresponding column of Table 4, the final weights of the indices are obtained as shown inTable 6. According to this table, SAIDIw has a higher weight than the other parameters.
Table 2. Indices’ weights based on decision-makers’ opinions.
Operators SAIFIw SAIDIw MAIFIwSAIFIw 1 2 4SAIDIw 0.5 1 0.5MAIFIw 0.25 2 1SUM 1.75 5 5.5
Table 3. Average weights of reliability indices.
Operators SAIFIw SAIDIw MAIFIw MeanSAIFIw 0.57 0.4 0.73 0.57SAIDIw 0.28 0.2 0.09 0.19MAIFIw 0.14 0.4 0.18 0.24
Table 4. Average weights in decision-makers’ opinions.
Target SAIFIw SAIDIw MAIFIwoperators 0.57 0.19 0.24Engineers 0.16 0.52 0.32Managers 0.30 0.53 0.17
Table 5.
Target SAIFIw SAIDIw MAIFIwoperators 0.57 0.19 0.24Engineers 0.16 0.52 0.32Managers 0.30 0.53 0.17
4.1.3. Optimal placement of AR/S switches in the PSO algorithm
Using system data and load flow results, the per-unit values of SAIDI, SAIFI, and MAIFI are calculated for allsections of the feeder under study. In this case, the objective function is obtained by using the total cost and
189

AMOHADI and FIRUZABAD/Turk J Elec Eng & Comp Sci
Table 6. Final weights of reliability parameters.
Target SAIFIw SAIDIw MAIFIwWeight 0.31 0.47 0.22
reliability factor as shown in Eq. (15). The optimal number and locations of AR/S switches are determined bythe PSO algorithm. In this method, RFa, RFw, and TC values are calculated for each section. In feeder F1,the growth factor and the annual inflation rate are considered to be 8% and 5%, respectively. The life period ofAR/S devices is assumed to be 20 years, the cost of energy interruption is set to be 1 $/KWH, the prices of anautorecloser and an autosectionalizer are considered to respectively be 3000$and 1000$, and the maintenancecost is assumed to be 35 $/year. If we run the PSO algorithm for this system, different scenarios are obtainedas shown in Table 7. In scenario 1 without any switches, reliability factors RFa and RFw are calculated to be1.0 and the cost function TC is obtained to be 17,622$. Although at least TC values are related to scenarios3, 4, 5, 7, 8, and 9, scenario 10 with three reclosers and five sectionalizers (3R+5S) in sections 1, 11, 14, 15,25, 26, 27, and 32 is preferred as the best option since the TC value of this scenario is less than the TC valueof scenario 1. Moreover, the average reliability factor of this scenario is less than that of other scenarios. Inthis case, the optimal locations of AR/S switches are determined in four points at nodes 1, 11, 15, and 27 asshown in Figure 5. This figure shows that the selected points are located near the load center. The results showthat the other scenarios with more locations are not economical in this system. If the weights of the reliabilityparameters are obtained by decision-makers as shown in Table 6, the RFw of each option is computed as shownin Table 7. In scenarios 1 through 10, the values of RFa and RFw are obtained to be close together. In scenario11 with various values of reliability indices, RFw is obtained to be less than RFa (0.67). In scenario 12 withmore number of sectionalizers and the least SAIDI, RFw is computed to be the minimum value (0.62). In thisoption, two reclosers and seven sectionalizers (2R+7S) are selected at optimal locations of the feeder studied,where two autoreclosers are located in sections 1 and 14, and seven sectionalizers are installed in sections 11,15, 20, 23, 25, 27, and 32 as shown in Figure 6. The results show that significant changes of the indices weightscan move the AR/S locations to other points.
4.2. Simulation of Isfahan’s 52-bus electric system
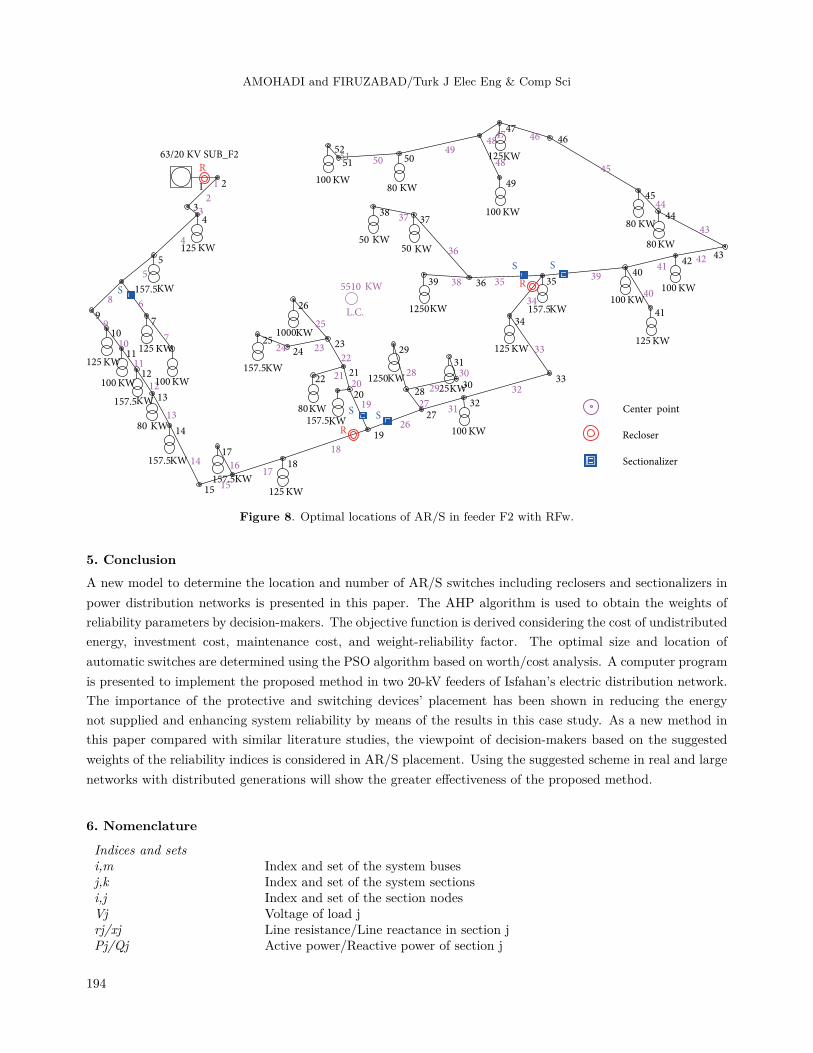
Isfahan’s 52-bus electric system is selected as the other radial medium voltage feeder of Isfahan’s distributionnetwork (feeder F2). The basic data that consist of load factor, accuracy class, earth resistance, Sb, and SCCin this feeder are considered to be the same as that of feeder F1. The weights of reliability parameters areobtained as shown in Table 8. In this table, the value of SAIFIw is greater than other parameters. To run theprogram for this system, the TC values of the candidate points are calculated for different scenarios. If theaverage reliability factor is considered in this system, the best option is obtained in scenario 9 with the leastvalues of RFa and TC related to the other scenarios. In this case, two autoreclosers are selected in sections 18and 34 and six sectionalizers are determined in sections 19, 27, 31, 35, 39, and 41 as shown in Figure 7. Inthis figure, nodes 19, 27, and 35 are only located near the load center. If the weight-reliability factors (RFw)are obtained as shown in Table 9, the best option is selected in scenario 8 with the least value of RFw and aTC value less than the value related to the first scenario. In this case, three reclosers are located in sections1, 18, and 34 and five sectionalizers are installed in sections 6, 19, 26, 35, and 39 as shown in Figure 8. In
190

AMOHADI and FIRUZABAD/Turk J Elec Eng & Comp Sci
Table 7. The result of AR/S placement in feeder F1.
Scenario Section Device SAIFI SAIDI MAIFI RFa RFw TC1 - None 1 1 1 1 1 176222 4,5 R+S 0.8 0.75 0.9 0.82 0.80 119823 8,9 R+S 0.75 0.71 0.86 0.77 0.76 115034 1,14,15,25 2R+2S 0.71 0.69 0.88 0.76 0.74 102665 15,16 R+S 0.81 076 0.86 0.81 0.80 117036 1,19,20,23 2R+2S 0.74 0.68 0.85 0.76 0.74 153017 1,26,27,32 2R+2S 0.69 0.67 0.83 0.73 0.71 116708 27,28 R+S 0.85 0.79 0.92 0.85 0.84 116019 32,33 R+S 0.79 0.74 0.89 0.81 0.79 1154610 1,11,14,15,25,26,27,32 3R+5S 069 0.64 0.71 0.68 0.67 1583611 8,9,14,15,25,26,27,32 3R+5S 065 0.59 0.86 0.70 0.67 1943912 1,11,14,15,20,23,25,27,32 2R+7S 0.75 0.41 0.89 0.68 0.62 15985
R
1 21
2
3
3
2
5
6
6
7
4 45
5 KW
KW
KW
KW KW
KW
KW
KW
KW
KW
KW
KW
KW
KW
KW
KW
KWKWKWKW
KW KWKW KW
125
7
157.59 8 8
80
9
200
10 11
1150
13
500
14 14
24
357.5
10
12
12
13
125
KW80
1515
R
SS
R
SS
KW50
80 50
32
80
3030
3131 29
29
28 157.5
500 500
4162.5 KW
100 25
26
26
16 16 1718
1919
23
100
20 20 2122 2321
22
125
157.5
157.5
50
25024
25
18
17
30 125
27 32273328
37 36 36
3533
343435
L.C.
Center point
Recloser
Sectionalizer
63/20 KV SUB_F1
S
Figure 5. Optimal locations of AR/S in feeder F1 with RFa.
this case, an autorecloser is added in section 1 to reduce SAIFI to the lowest value (0.42), and the numbersand locations of some sectionalizers have been changed. In scenario 10, reliability factors RFa and RFw have
191

AMOHADI and FIRUZABAD/Turk J Elec Eng & Comp Sci
R
1 21
2
3
3
25
5
6
6
7
445
KW
KW
KW
KW KW
KW
KW
KW
KW
KW
KW
KW
KWKW
KW
KW
KWKWKWKW
KW KWKW KW
125
7
157.5 9 8 8
80
9
200
10 11
1150
13
500
14 14
24
357.5
10
12
12
13
125
KW80
1515
R
SS
SS
KW50
80 50
32
80
303031
31 2929
28 157.5
500500
4162.5 KW
10025
26
26
16 16 1718
1919
23
100
2020 2122 2321
22
125
157.5
157.550
25024
25
18
17
30125
27 3227
332837 36 36
3533
343435
L.C.
S
Center point
Recloser
Sectionalizer
63/20 KV SUB_F1
S S
Figure 6. Optimal locations of AR/S in Feeder F1 with RFw.
the lowest values, but the TC value of this scenario is greater than the TC value of the first scenario and thisoption is not selected. The obtained results show that the weights of the indices can reduce the RFw relatedto the RFa, as a result of which the selected option may change. After placement of AR/S switches in a radialpower distribution network, it is essential to coordinate the autoreclosers with the protective relays located inthe high voltage substation. The optimal type, size, and location of protection and switching equipment cansignificantly improve system reliability.
Table 8. Computed weights of reliability parameters.
Target SAIFIw SAIDIw MAIFIwWeight 0.55 0.24 0.21
4.3. The accuracy of the proposed method
In most of the present articles, the objective function is defined as the minimum cost function and reliabilityindices. In this paper, the objective function is formulated as the minimum cost considering the least weight-reliability factor. If the weights of the reliability indices are considered as a new method, TC and RFw will beminimized to obtain the best option. Using the AHP model, the sum of weights of the indices is obtained to
192

AMOHADI and FIRUZABAD/Turk J Elec Eng & Comp Sci
Table 9. The result of AR/S placement in feeder F2.
Scenario Section Device SAIFI SAIDI MAIFI RFa RFw TC1 - None 1 1 1 1 1 154912 1,6,18,19,26 2R+2S 0.68 0.71 0.76 0.72 0.71 69053 1,6,34,35,39 2R+2S 0.73 0.77 0.79 0.76 0.75 99884 1,6,26,27,31 2R+2S 0.69 0.73 0.74 0.72 0.71 119365 5,6,8 R+2S 0.91 0.94 0.96 0.91 0.92 51496 26,27,32,34, 35,39 2R+4S 0.65 0.66 0.78 0.69 0.68 119367 5,6,8,26,27 , 31 2R+4S 0.68 0.76 0.88 0.77 0.74 130858 1,6,18,19,26,34,35,39 3R+5S 0.42 0.58 0.73 0.55 0.45 141879 18,19,27,31 ,34,35,39,46 2R+6S 0.61 0.51 0.62 0.57 0.52 1325610 1,6,18,19,27,31,34,35,39,46 3R+7S 0.38 0.48 0.61 0.51 0.42 16256
1 2
2
1
334
4KW125
5
5
6
7
8
99
1010
11
12
13
13
14
14
1515
1617
12
18
18
1926
2731
32
3233
192020
212122
22
2323242425
25
26
28 3030
33
34
34
3536383939
35
40
4041
42 42 43
41
43
4444
45
45
46464747
48
48
49
36
373738
5151
52
50 5049
27
29
2929
31
7
11
17
KW125
KW100 KW100
KW80
KW157.5KW125
KW157.5KW80
KW157.5
KW1000
KW100
KW1250KW25
KW125
KW157.5KW100
KW125
KW100
KW1250
KW80
KW80KW100
KW125
KW80
KW50KW50
KW100
KW157.5
KW157.5
KW157.5
KW157.5
R
S
S S
S S
S
Center point
Recloser
Sectionalizer
KW5510
L.C.
63/20 KV SUB_F2
R
Figure 7. Optimal locations of AR/S in feeder F2 with RFa.
be equal to 1.0 in each state and RFw is found to be close to the RFa. The optimal type, size, and locationof AR/S switches may be changed based on the computed weights. After running the presented program forvarious states of the power distribution feeders, correct and acceptable results are obtained.
193
AMOHADI and FIRUZABAD/Turk J Elec Eng & Comp Sci
1 2
2
1
334
4KW125
5
5
6
7
8
99
1010
11
12
13
13
14
14
1515
1617
12
18
18
1926
2731
32
3233
192020
212122
22
2323242425
25
26
28 3030
33
34
34
353638393935
40
4041
42 42 43
41
43
4444
45
45
464647
4748
48
49
36
373738
5151
5250 50
49
27
29
28 29
31
7
11
17
KW125
KW100 KW100
KW80
KW157.5
KW125
KW157.5KW80
KW157.5
KW1000
KW100
KW1250KW25
KW125
KW157.5KW100
KW125
KW100
KW1250
KW80
KW80KW100
KW125
KW80
KW50KW50
KW100
KW157.5
KW125
KW157.5
KW157.5
R
S
S S
Center point
Recloser
Sectionalizer
R
S
S
KW5510
L.C.
63/20 KV SUB_F2
R
Figure 8. Optimal locations of AR/S in feeder F2 with RFw.
5. ConclusionA new model to determine the location and number of AR/S switches including reclosers and sectionalizers inpower distribution networks is presented in this paper. The AHP algorithm is used to obtain the weights ofreliability parameters by decision-makers. The objective function is derived considering the cost of undistributedenergy, investment cost, maintenance cost, and weight-reliability factor. The optimal size and location ofautomatic switches are determined using the PSO algorithm based on worth/cost analysis. A computer programis presented to implement the proposed method in two 20-kV feeders of Isfahan’s electric distribution network.The importance of the protective and switching devices’ placement has been shown in reducing the energynot supplied and enhancing system reliability by means of the results in this case study. As a new method inthis paper compared with similar literature studies, the viewpoint of decision-makers based on the suggestedweights of the reliability indices is considered in AR/S placement. Using the suggested scheme in real and largenetworks with distributed generations will show the greater effectiveness of the proposed method.
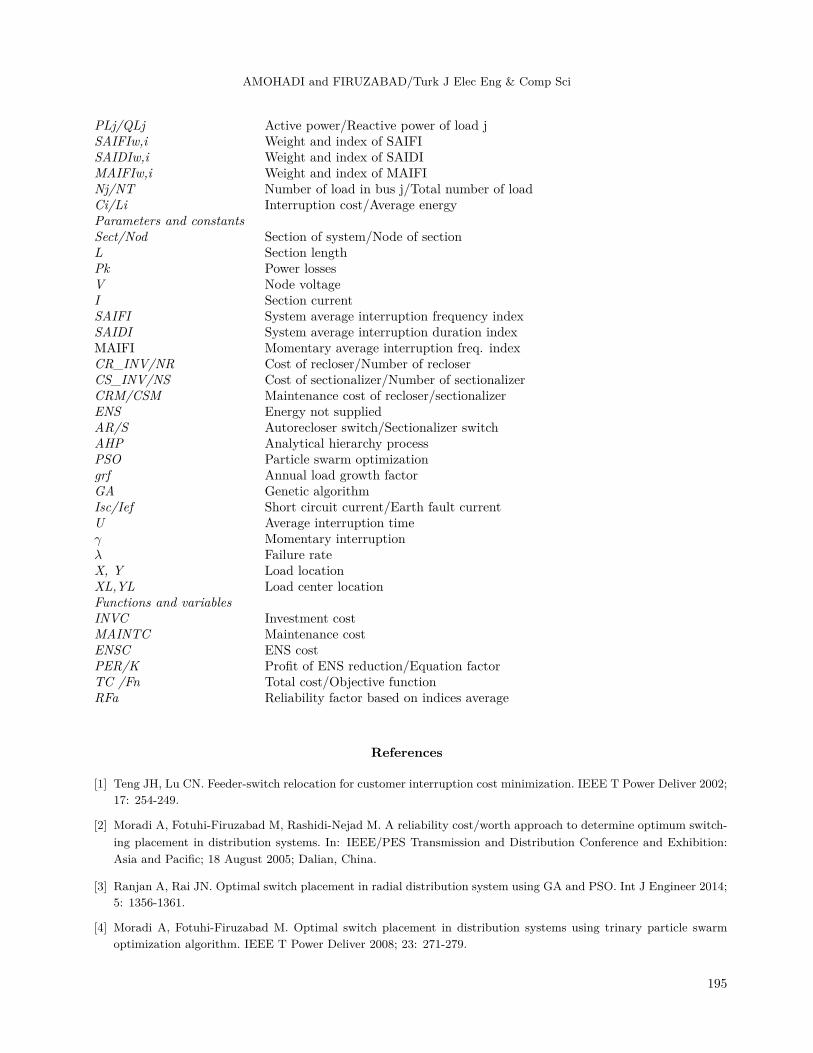
6. Nomenclature
Indices and setsi,m Index and set of the system busesj,k Index and set of the system sectionsi,j Index and set of the section nodesVj Voltage of load jrj/xj Line resistance/Line reactance in section jPj/Qj Active power/Reactive power of section j
194
AMOHADI and FIRUZABAD/Turk J Elec Eng & Comp Sci
PLj/QLj Active power/Reactive power of load jSAIFIw,i Weight and index of SAIFISAIDIw,i Weight and index of SAIDIMAIFIw,i Weight and index of MAIFINj/NT Number of load in bus j/Total number of loadCi/Li Interruption cost/Average energyParameters and constantsSect/Nod Section of system/Node of sectionL Section lengthPk Power lossesV Node voltageI Section currentSAIFI System average interruption frequency indexSAIDI System average interruption duration indexMAIFI Momentary average interruption freq. indexCR_INV/NR Cost of recloser/Number of recloserCS_INV/NS Cost of sectionalizer/Number of sectionalizerCRM/CSM Maintenance cost of recloser/sectionalizerENS Energy not suppliedAR/S Autorecloser switch/Sectionalizer switchAHP Analytical hierarchy processPSO Particle swarm optimizationgrf Annual load growth factorGA Genetic algorithmIsc/Ief Short circuit current/Earth fault currentU Average interruption timeγ Momentary interruptionλ Failure rateX, Y Load locationXL,YL Load center locationFunctions and variablesINVC Investment costMAINTC Maintenance costENSC ENS costPER/K Profit of ENS reduction/Equation factorTC /Fn Total cost/Objective functionRFa Reliability factor based on indices average
References
[1] Teng JH, Lu CN. Feeder-switch relocation for customer interruption cost minimization. IEEE T Power Deliver 2002;17: 254-249.
[2] Moradi A, Fotuhi-Firuzabad M, Rashidi-Nejad M. A reliability cost/worth approach to determine optimum switch-ing placement in distribution systems. In: IEEE/PES Transmission and Distribution Conference and Exhibition:Asia and Pacific; 18 August 2005; Dalian, China.
[3] Ranjan A, Rai JN. Optimal switch placement in radial distribution system using GA and PSO. Int J Engineer 2014;5: 1356-1361.
[4] Moradi A, Fotuhi-Firuzabad M. Optimal switch placement in distribution systems using trinary particle swarmoptimization algorithm. IEEE T Power Deliver 2008; 23: 271-279.
195

AMOHADI and FIRUZABAD/Turk J Elec Eng & Comp Sci
[5] Chen CS, Lin CH, Chuang HJ, Li CS, Huang MY, Huang CW. Optimal placement of line switches for distributionautomation systems using immune algorithm. IEEE T Power Syst 2006; 21: 1209-1217.
[6] Dezaki HH, Abyaneh HA, Mazlumi K, Yaghubinia MR, Zanganeh M. Protective and switching devices allocationaccording to total cost minimization by genetic algorithm in distribution systems. In: 7th International Conferenceon Electrical and Electronics Engineering; 1–4 December 2011; Bursa, Turkey.
[7] Goel L, Billinton R. Evaluation of interrupted energy assessment rates in distribution systems. IEEE T PowerDeliver 1991; 6: 1876-1882.
[8] Abiri-Jahromi A, Fotuhi-Firuzabad M, Parvania M, Mosleh M. Optimized sectionalizing switch placement strategyin distribution systems. IEEE T Power Deliver 2012; 27: 362-370.
[9] Dehghanian P, Fotuhi-Firuzabad M, Bagheri-Shouraki S, Kazemi AA. Critical component identification in reliabilitycentered asset management of power distribution systems via fuzzy AHP. IEEE Syst J 2012; 6: 593-602.
[10] Bernardon DP, Sperandio M, Garcia VJ, Canha LN, da Rosa Abaide A, Daza EF. AHP decision-making algorithmto allocate remotely controlled switches in distribution networks. IEEE T Power Deliver 2011; 26: 1884-1892.
[11] Vahidnia A, Ledwich G, Ghosh A, Palmer E. An improved genetic algorithm and graph theory based method foroptimal sectionalizer switch placement in distribution networks with DG. In: 21st Australasian Universities PowerEngineering Conference; 28–29 September 2011; Brisbane, Australia.
[12] Siirto OK, Safdarian A, Lehtonen M, Fotuhi-Firuzabad M. Optimal distribution network automation consideringearth fault events. IEEE T Smart Grid 2015; 6: 1010-1018.
[13] Teng JH, Lu CN. Feeder-switch relocation for customer interruption cost minimization. IEEE T Power Deliver 2002;17: 254-259.
[14] Hashemi SM, Barati S, Talati S, Noori H. A genetic algorithm approach to optimal placement of switching andprotective equipment on a distribution network. J Eng Appl Sci 2016; 11: 1395-1400.
[15] Billinton R, Jonnavithula S. Optimal switching device placement in radial distribution systems. IEEE T PowerDeliver 1996; 11: 1646-1651.
[16] Lee KY, El-Sharkawi MA, editors. Modern Heuristic Optimization Techniques: Theory and Applications to PowerSystems. New York, NY, USA: Wiley, 2008.
[17] Shrivastava C, Gupta M, Koshti A. Load flow analysis for radial distribution system using forward backward sweepmethod. J Electr Eng Technol 2015; 8: 51-58.
[18] Sunisith S, Meena K. Backward/forward sweep based distribution load flow method. International Electrical Engi-neering Journal 2014; 5: 22-30.
[19] Markushevich NS, Herejk IC, Nielsen RE. Functional requirements and cost-benefit study for distribution automa-tion at BC Hydro. In: Power Industry Computer Application Conference; 4–7 May 1993; Scottsdale, AZ, USA.
[20] Saaty TL. The Analytic Hierarchy Process: Planning, Priority Setting, Resources Allocation. New York, NY, USA:McGraw. 1980.
[21] Fotuhi-Firuzabad M, Rajabi-Ghahnavie A. An analytical method to consider DG impacts on distribution systemreliability. In: IEEE/PES Transmission and Distribution Conference and Exhibition: Asia and Pacific; 18 August2005; Dalian, China.
[22] Abdi S, Afshar K, Ahmadi S, Bigdeli N, Abdi M. Optimal recloser and autosectionalizer allocation in distributionnetworks using IPSO–Monte Carlo approach. Int J Elec Power 2014; 1: 602-611.
[23] Javadian SA, Massaeli M. Impact of distributed generation on distribution systems reliability considering recloser-fuse miscoordination-a practical case study. Indian J Technol 2011; 4: 1279-1284.
196