optimal placement of svc for losses reduction and voltage ...€¦international review of electrical...
TRANSCRIPT
International Review of Electrical Engineering (I.R.E.E.), Vol. 8, N.1 ISSN 1827-6660 January – February 2013
Manuscript received and revised January 2013, accepted February 2013 Copyright © 2013 Praise Worthy Prize S.r.l. - All rights reserved 329
Optimal Placement of SVC for Losses Reduction and Voltage Profile Improvement in Electrical Power System Using
Improved Gravitational Search Algorithm
Purwoharjono1, Muhammad Abdillah2, Ontoseno Penangsang3, Adi Soeprijanto4 Abstract –The development of the more increasing power electronics allows the use of FACTS devices to manage and improve either the flow of power or the stability of the power system. One type of FACTS device studied is the SVC. In this study, optimization of SVC is used to determine the most appropriate location and rating in order to obtain the optimum power transfer. Optimization methods used in this study is Improved Gravitational Search Algorithm (IGSA). Improved GSA uses Interval Type-2 Fuzzy Logic System (IT2FLS). IGSA implementation uses Java-Bali power system 500 kV. Simulation results show that the simulation results better with the use of SVC placement than with the GSA and without SVC placement. Placement of SVC with the right location and rating using the IGSA and GSA can reduce power loss in the transmission line and also can improve the voltage profile according to the standards set, in the range of 0.95 ± 1.05pu when compared without SVC. Copyright © 2009 Praise Worthy Prize S.r.l. - All rights reserved. Keywords: FACTS device, Static Var Compensator, Gravitational Search Algorithm, Improved Gravitational Search Algorithm
Nomenclature
SVCQ Reactive power injection on SVC
kV Bus voltage magnitude
SVCB Susceptance on SVC
n Number of transmission line
kg Conductance of k branch
iV and jV Voltage magnitude on bus i and bus j
ijθ Voltage angle difference between bus i and bus j
GP and GQ Active and reactive power from generators
DP and DQ Active and reactive load from the generator
ijG and ijB Conductance and susceptance between bus i and bus j
)(tfit j Fitness in the jth agent at t time
( )tbest and
( )tworst
The best fitness of all agents (the minimum) and worst (the maximum) fitness of all agents
0G Gravitational constant
α Constant t The number of iterations
T Total number of iterations ( )tfit i Fitness to the agent i at t time
)(tMgi Mass of the agent i at t time
jrand Random number between the intervals [0.1]
kbest Iinitial set of agent K with the best fitness value and the largest mass.
( )tRij Euclidean distance between the agent i and agent j.
ε A smack constant.
0ω maximum value
rω Minimum value
maxt Maximum iteration tω Inertia weight
I. Introduction In recent years, the operation of modern electric
power system is facing many challenges in terms of deregulating and restructuring the electric power industry. Electricity demand continues to rise and the rapid development of electronic power causes the need for active power and reactive power increases. Increased reactive power on the transmission line causes a rise in components of power loss and worsens voltage
Purwoharjono, Muhammad Abdilah, Ontoseno Penangsang, Adi Soeprijanto
Copyright © 2013 Praise Worthy Prize S.r.l. - All rights reserved International Review of Electrical Engineering, ,Vol. 8, N.1
330
conditions; therefore, components that can control as well as compensate the power loss in the transmission line are necessary. Currently developed compensation is FACTS (Flexible AC Transmission System) devices which play an important role in maximizing the utilization of existing electric power transmission systems. FACTS devices have the ability to make a power system be operated in a more flexible, secure, and economical way. The pattern of power generation, leading to the excessive imposition of the lines, would result in more line losses, and undermine the security and stability of the power system. In such circumstances, FACTS devices can be used to enhance the capabilities of the system, by means of controlling power flow on transmission lines [1-2].
There are several types of FACTS devices including: SVC (Static Var Compensator), TCSC (Thyristor Controlled Series Capacitor), TCPST (Thyristor Controlled Phase Shifting Transformer), STATCOM (Static Compensator), UPFC (Unified Power Flow Controller), TCPS (Thyristor Controlled Phase Shifter), SSSC (Static Synchronous Series Compensator) and IPFC (Interline Power Flow Controller) and others. Among the several types of FACTS devices, SVC is selected to be developed in this research. It is used to regulate the bus voltage, by injecting reactive power that can be controlled into the system. SVC Placement on one or more transmission lines can increase distribution capacity and reduce power loss [3-12]. Artificial intelligence methods developed in this research is a method of Gravitational Search Algorithm (GSA) which would be improved using Interval Type-2 Fuzzy Logic System (IT2FLS). GSA method was first introduced by Rashedi in 2009. GSA method is a method of metaheuristics inspired by Newton's laws of gravity and motion of the mass [13]. Metaheuristics is a method to find a solution combining the interaction between local search procedures and higher strategies to create a process passing local optima points and searching on the solution space to find a global solution [14].
This IGSA uses Interval Type-2 Fuzzy Logic System (IT2FLS) [15]. IT2FLS is done by setting an optimal value of inertia weight which can be used to control the speed of the particle in GSA methods, so as to improve the performance of GSA methods.
Several studies have been held by experts using this GSA method, such as on the location of the SVC placement [16], economic dispatch (ED) on the power system [17-18], optimization of reactive power dispatch [19], the voltage settings on the Java-Bali 500 kV power system [20], optimal placement and sizing using TCSC [21-23], and optimal design of TCPST [24].
In this study, IGSA may be used to determine the location of optimal SVC placement and rating of the power system of Java-Bali 500 kV. Furthermore, it can also be used to validate the efficiency of the new approach for reducing the power loss in power transmission lines to a minimum and to increase the voltage profile in the set standard conditions, in the range of 0.95 ± 1.05 pu.
II. Static Var Compensator (SVC) The development of FACTS devices has brought great
changes to the power system which leads to the development of contolled var static resources. Static Var Compensator or SVC began to develop in the 60's, which was originally only used to control voltage rapidly to cope with changing and unpredictable large-scale industrial load.
At the beginning of the SVC development, it functions to control the voltage to remain constant. Along with its function, the SVC is currently used to control the reactive power flow, by injecting or absorbing it from the line. In accordance with the function, the SVC paralled placement is performed on the buses that had low or high voltage over the normal limits.
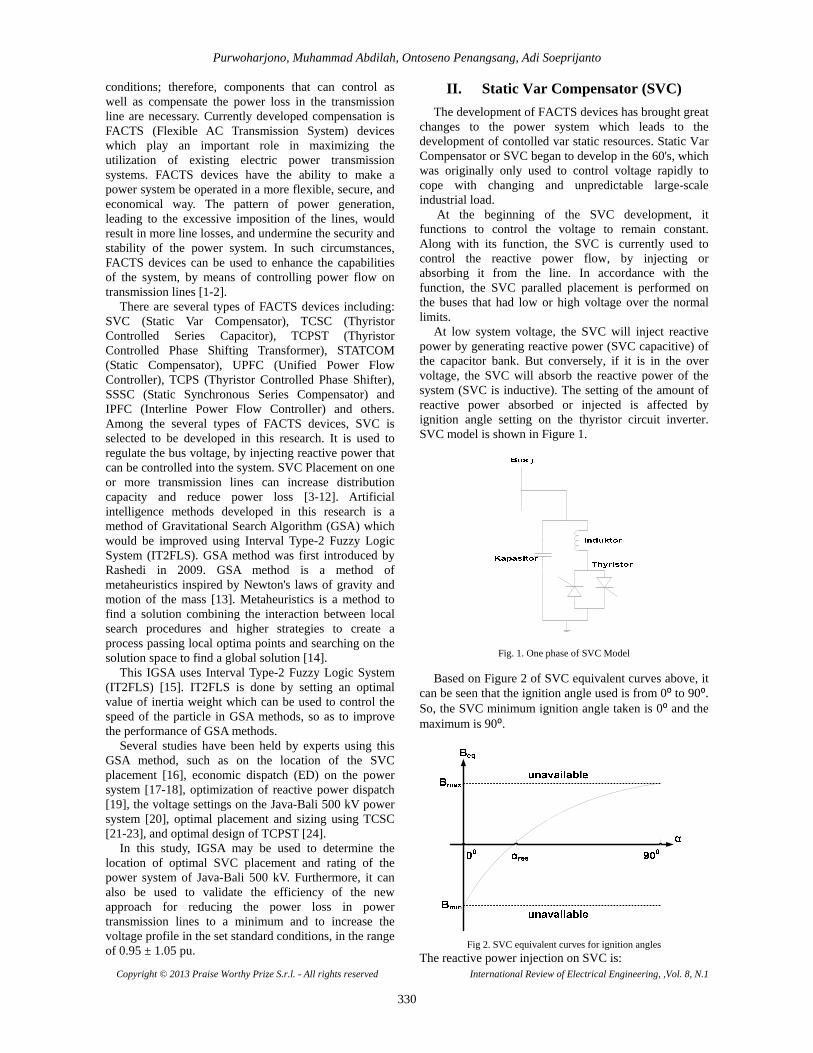
At low system voltage, the SVC will inject reactive power by generating reactive power (SVC capacitive) of the capacitor bank. But conversely, if it is in the over voltage, the SVC will absorb the reactive power of the system (SVC is inductive). The setting of the amount of reactive power absorbed or injected is affected by ignition angle setting on the thyristor circuit inverter. SVC model is shown in Figure 1.
Fig. 1. One phase of SVC Model
Based on Figure 2 of SVC equivalent curves above, it can be seen that the ignition angle used is from 0⁰ to 90⁰. So, the SVC minimum ignition angle taken is 0⁰ and the maximum is 90⁰.
Fig 2. SVC equivalent curves for ignition angles
The reactive power injection on SVC is:
Purwoharjono, Muhammad Abdilah, Ontoseno Penangsang, Adi Soeprijanto
Copyright © 2013 Praise Worthy Prize S.r.l. - All rights reserved International Review of Electrical Engineering, ,Vol. 8, N.1
331
SVCkSVC BVQ ×−= 2 (1) The balance of reactive power in buk k is:
SVCSVCsvc BBB ≤≤ (2) SVC Rating is set in the range of -200 Mvar to 200 Mvar.
Fig 3. SVC Injection Modeling
III. Implementation of the Proposed Method to the system
The method used to determine the optimal location of SVC is Gravitation Improved Search Algorithm (IGSA). This IGSA uses Interval Type 2 Fuzzy Logic System (IT2FLS). This IGSA can find some possible solutions simultaneously and it also does not require any prior knowledge or specific nature of the objective function. In addition, the IGSA is able to produce the best solution to find the optimal one in a complex problem. The commencement of it with the generation is random from the initial population and then selected and mutated to obtain the best populations found.
III.1. Encoding
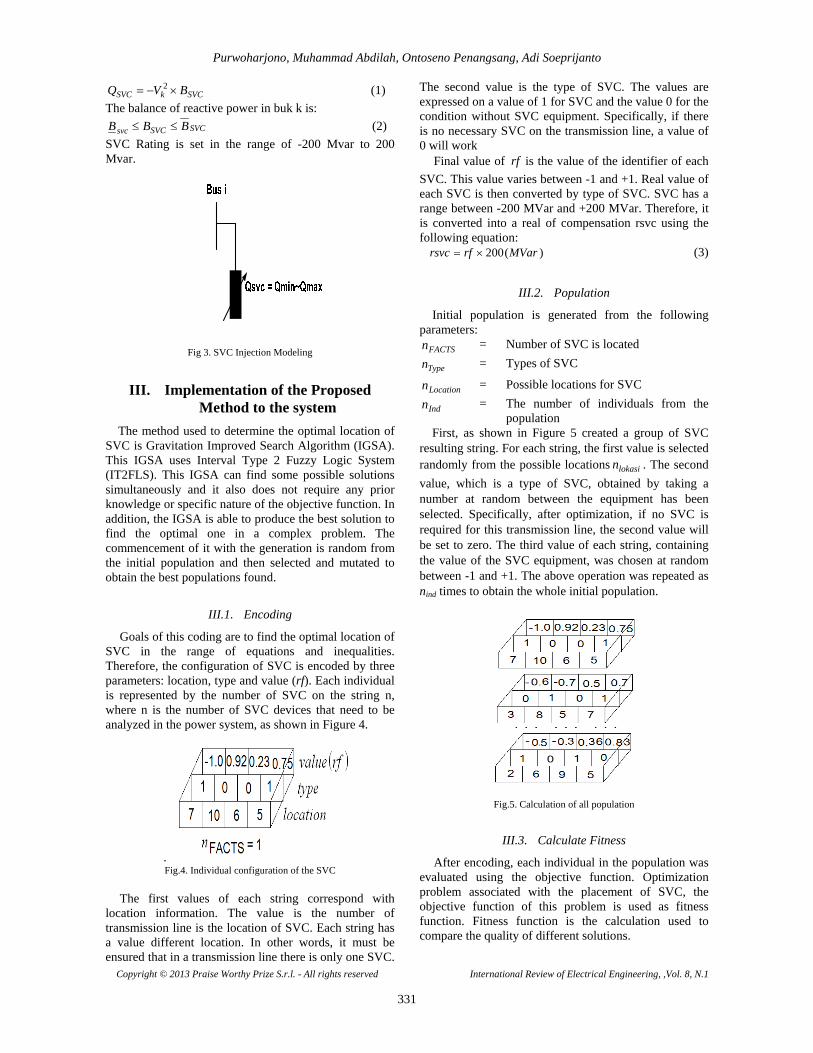
Goals of this coding are to find the optimal location of SVC in the range of equations and inequalities. Therefore, the configuration of SVC is encoded by three parameters: location, type and value (rf). Each individual is represented by the number of SVC on the string n, where n is the number of SVC devices that need to be analyzed in the power system, as shown in Figure 4.
. Fig.4. Individual configuration of the SVC
The first values of each string correspond with
location information. The value is the number of transmission line is the location of SVC. Each string has a value different location. In other words, it must be ensured that in a transmission line there is only one SVC.
The second value is the type of SVC. The values are expressed on a value of 1 for SVC and the value 0 for the condition without SVC equipment. Specifically, if there is no necessary SVC on the transmission line, a value of 0 will work
Final value of rf is the value of the identifier of each SVC. This value varies between -1 and +1. Real value of each SVC is then converted by type of SVC. SVC has a range between -200 MVar and +200 MVar. Therefore, it is converted into a real of compensation rsvc using the following equation:
)(200 MVarrfrsvc ×= (3)
III.2. Population
Initial population is generated from the following parameters:
FACTSn = Number of SVC is located
Typen = Types of SVC
Locationn = Possible locations for SVC
Indn = The number of individuals from the population
First, as shown in Figure 5 created a group of SVC resulting string. For each string, the first value is selected randomly from the possible locations lokasin . The second value, which is a type of SVC, obtained by taking a number at random between the equipment has been selected. Specifically, after optimization, if no SVC is required for this transmission line, the second value will be set to zero. The third value of each string, containing the value of the SVC equipment, was chosen at random between -1 and +1. The above operation was repeated as nind times to obtain the whole initial population.
Fig.5. Calculation of all population
III.3. Calculate Fitness
After encoding, each individual in the population was evaluated using the objective function. Optimization problem associated with the placement of SVC, the objective function of this problem is used as fitness function. Fitness function is the calculation used to compare the quality of different solutions.

Purwoharjono, Muhammad Abdilah, Ontoseno Penangsang, Adi Soeprijanto
Copyright © 2013 Praise Worthy Prize S.r.l. - All rights reserved International Review of Electrical Engineering, ,Vol. 8, N.1
332
After encoding, each individual in the population was evaluated using the objective function. Optimization problem associated with the placement of SVC, the objective function of this problem is used as fitness function. For this purpose, the SVC is placed on the transmission line to pay attention to the power flow and voltage constraints. Objective function is used as the limit of SVC placement to prevent under voltage or overvoltage on each bus and is able to reduce losses in power transmission line in the system.
Objective function for optimizing the placement of SVC is to minimize losses on the transmission line. Objective functions for optimal configuration of SVC are:
- Active power loss minimization
Minimization of active power loss (Ploss) in the transmission line:
( )( )
∑==
−+=n
jikk
ijjijikloss VVVVgP
,1
22 cos2 θ (4)
- Equality Constrain Power flow equation constrains is as follows:
nbiB
GVVPP
n
j ijij
ijijjiDiGi K,2,1,0
sincos
1==⎥
⎦
⎤⎢⎣
⎡+
−− ∑=
θθ
(5)
nbiB
GVVQQ
n
j ijij
ijijjiDiGi K,2,1,0
cossin
1==⎥
⎦
⎤⎢⎣
⎡+
−− ∑=
θθ
(6)
- Inequality Constrain
Load bus voltage constraints inequality (Vi ):
( )⎩⎨⎧
−−
=iV
VL1exp
05.195.0μ etcVfor
Vif
i
i 05.195.0 ≤≤ (7)
Inequality constraints of switchable reactive power compensation ( ciQ ):
nciQQQ cicici ∈≤≤ ,maxmin (8)
Inequality constraint of reactive power generator ( GiQ ):
ngiQQQ GiGiGi ∈≤≤ ,maxmin (9) Inequality constraints of transformers tap setting ( iT ):
ntiTTT iii ∈≤≤ ,minmin (10) Inequality constraint of transmission line flow ( liS ):
nliSS lili ∈≤ ,max (11) Where: nc , ng and nt = number of switchable reactive power sources, generators and transformers.
To evaluate the optimization objective function on the placement of SVC, the best and worst fitness is calculated each iterating as follows:
)(min)(),1(
tfittbest jNj K∈= (12)
)(max)(),1(
tfittworst jNj K∈
= (13)
III.4. Calculate of the Gravitational Constant
To update the G gravitational constant in accordance with population fitness of the best agents (minimum) and worst (maximum) using equation (13) and (14). The gravitational constant G(t) on t time is calculated as follows.
⎟⎠⎞
⎜⎝⎛−=
TtGtG αexp)( 0 (14)
III.5. Calculate of Inertia Masses and Gravity
To calculate the value of inertial mass (M) for each agent, equation (18) and equation (19) are used
)()()()(
)(tworsttbesttworsttfit
tmg ii −
−= (15)
∑=
= N
jj
ii
tmg
tmgtMg
1)(
)()( (16)
III.6. Calculate of the Total Force
In this step, the total force acting on the agent i ( )( )tF d
i is calculated as follows:
( ) ( )∑≠∈
=ikbestjj
dijj
di tFrandtF (17)
Forces acting on the mass i ( )( )tMi from the masses j ( )( )tM j at specific t time according to the gravity theory
described as follows
( ))()()(
)()()()( tt
tRtMtM
tGt xxF di
dj
ij
jidij −
+
×=
ε (18)
III.7. Calculate of the Acceleration
In this step, acceleration of ( )( )tadi from the agent i
at t time in dth dimensions is calculated with the laws of gravity and the laws of motion as follows.
)(
)()(
tMg
tFta
di
did
i = (19)
III.8. Calculate of the Interval Type-2 Fuzzy Logic System (IT2FLS)
IT2FLS is similar to type-1 fuzzy logic namely, the fuzzifier, rule base, inference engine, and the output processor. Output processor, including the type reducer and defuzzifier, produces an output fuzzy set of type-1 or a number. But the difference lies in the process of finding the centroid of the interval type-2 fuzzy sets undergone by Upper Membership Function (UMF) and Lower Membership Function (LMF).
In general, IT2FLS system can be shown in Figure 6.

Purwoharjono, Muhammad Abdilah, Ontoseno Penangsang, Adi Soeprijanto
Copyright © 2013 Praise Worthy Prize S.r.l. - All rights reserved International Review of Electrical Engineering, ,Vol. 8, N.1
333
( )y f x=
y%
Fig 6. The structure of IT2FLS
In this IT2FLS, the inertia weight value ( )tω is used to set the optimum speed of the GSA; so that it can improve the performance of the GSA calculated using the equation:
( ) ( )max
00
ttt r ×−−
=ωωωω (20)
This study uses the membership function of best fitness (BF) and membership function of inertia weight shown in Figure 7 and Figure 8 used for fuzzification of IT2FLS.
200 210 220 230 240 250 260 270 280 290 300
0
0.2
0.4
0.6
0.8
1PS PM PB PR
Membership Function of Best Fitness(BF)
Deg
ree
of M
embe
rshi
p Fu
nctio
n
PS PM PB PRPS PM PB PR
Fig.7. Membership function of best fitness (BF)
Triangular membership function is used in this
research because it is easy to design and implement on the system and also the result is not so different compared with sigmoid.
For the linguistic values of IT2FLS input and output, they are the same using PS (positive small), PM (positive medium), PB (positive big) and PR (positive bigger). For IT2FLS rules, Mamdani type is used to formulate the conditional statements of the rules of the IT2FLS.
0.5 0.55 0.6 0.65 0.7 0.75 0.8 0.85 0.9
0
0.2
0.4
0.6
0.8
1PS PM PB PR
Deg
ree
of M
embe
rshi
p Fu
nctio
n
Membership Function of Inertia Weigth (w(t))
PS PM PB PR
Fig.8. Membership fuction of Inertia weight (w(t))
For example, If BF is PS), then w is PR. Type-2 fuzzy
rules are used to tune the inertia weight shown in Tables I. The defuzzification I2FLS used is the centroid method. Briefly, the system of IT2FLS is an effective tool to represent and utilize human knowledge which is too complex for a mathematical approach with a lot of uncertainty.
TABLE 1
IT2FLS RULE FOR THE INERTIA WEIGHT BF PS PM PB PR w PR PB PM PS
III.9. Calculate Velocity
In this step, n the velocity ( )( )tvdi of ith agent at t time
in dth dimension is calculated through the law of gravity and the laws of motion and the IT2FLS ( tω ) as follows.
)()()1( tatvtv di
di
tdi +×=+ ω (21)
III.10. Update Position Agent Updating
In this step the next position of ith agent in dth
dimension d ( )( )1+txdi is updated as follows.
)1()()1( ++=+ tdivtd
ixtdix (22)
III.11. Repetition
In this step, the steps from III.2 to III.10 are repeated until the iterations reach the criterion. At the end of the iteration, the algorithm returns the value associated with the position of the agent on a particular dimension. This value is the global solution of optimization problems as well.
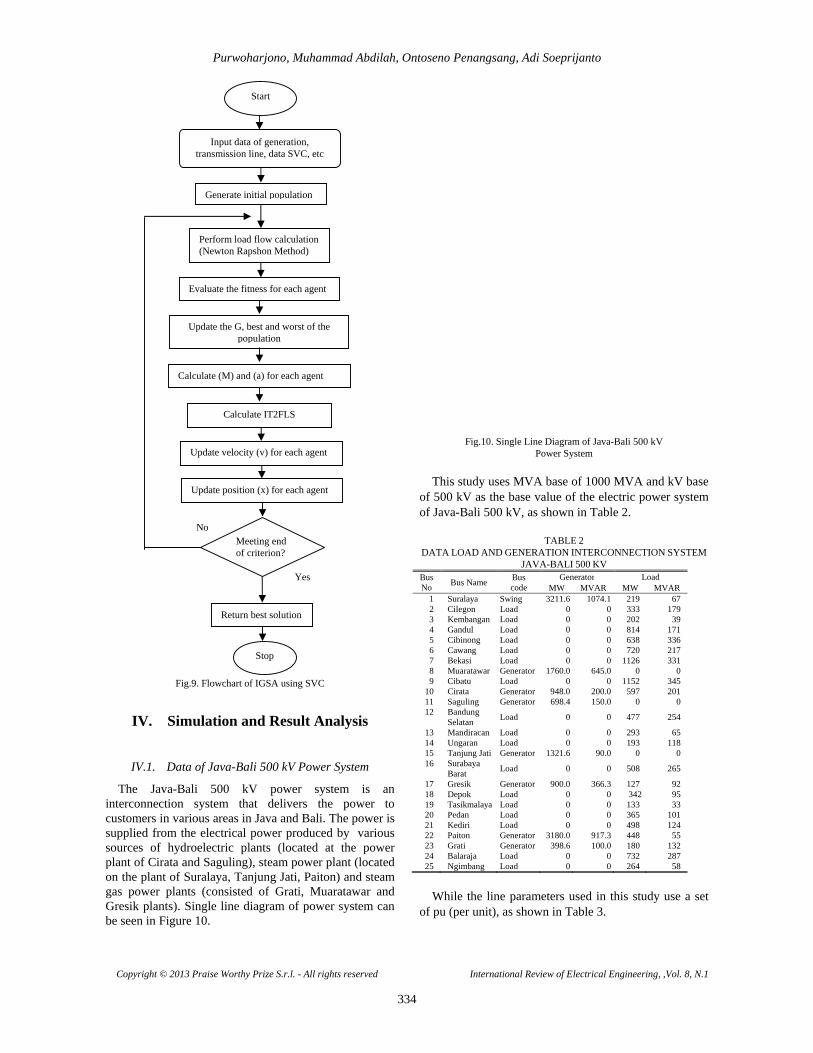
IGSA algorithm, used to determine the optimal placement of SVC locations and ratings, are shown in Figure 9.
Purwoharjono, Muhammad Abdilah, Ontoseno Penangsang, Adi Soeprijanto
Copyright © 2013 Praise Worthy Prize S.r.l. - All rights reserved International Review of Electrical Engineering, ,Vol. 8, N.1
334
Fig.9. Flowchart of IGSA using SVC
IV. Simulation and Result Analysis
IV.1. Data of Java-Bali 500 kV Power System
The Java-Bali 500 kV power system is an interconnection system that delivers the power to customers in various areas in Java and Bali. The power is supplied from the electrical power produced by various sources of hydroelectric plants (located at the power plant of Cirata and Saguling), steam power plant (located on the plant of Suralaya, Tanjung Jati, Paiton) and steam gas power plants (consisted of Grati, Muaratawar and Gresik plants). Single line diagram of power system can be seen in Figure 10.
Fig.10. Single Line Diagram of Java-Bali 500 kV Power System
This study uses MVA base of 1000 MVA and kV base
of 500 kV as the base value of the electric power system of Java-Bali 500 kV, as shown in Table 2.
TABLE 2 DATA LOAD AND GENERATION INTERCONNECTION SYSTEM
JAVA-BALI 500 KV Bus No Bus Name Bus
code Generator Load
MW MVAR MW MVAR 1 Suralaya Swing 3211.6 1074.1 219 672 Cilegon Load 0 0 333 1793 Kembangan Load 0 0 202 39 4 Gandul Load 0 0 814 171 5 Cibinong Load 0 0 638 336 6 Cawang Load 0 0 720 2177 Bekasi Load 0 0 1126 3318 Muaratawar Generator 1760.0 645.0 0 09 Cibatu Load 0 0 1152 345
10 Cirata Generator 948.0 200.0 597 20111 Saguling Generator 698.4 150.0 0 012 Bandung
Selatan Load 0 0 477 254
13 Mandiracan Load 0 0 293 65 14 Ungaran Load 0 0 193 11815 Tanjung Jati Generator 1321.6 90.0 0 016 Surabaya
Barat Load 0 0 508 265
17 Gresik Generator 900.0 366.3 127 9218 Depok Load 0 0 342 9519 Tasikmalaya Load 0 0 133 3320 Pedan Load 0 0 365 101 21 Kediri Load 0 0 498 124 22 Paiton Generator 3180.0 917.3 448 55 23 Grati Generator 398.6 100.0 180 13224 Balaraja Load 0 0 732 28725 Ngimbang Load 0 0 264 58
While the line parameters used in this study use a set
of pu (per unit), as shown in Table 3.
No
Yes
Start
Stop
Update velocity (v) for each agent
Input data of generation, transmission line, data SVC, etc
Perform load flow calculation (Newton Rapshon Method)
Evaluate the fitness for each agent
Update the G, best and worst of the population
Calculate (M) and (a) for each agent
Meeting end of criterion?
Return best solution
Generate initial population
Calculate IT2FLS
Update position (x) for each agent

Purwoharjono, Muhammad Abdilah, Ontoseno Penangsang, Adi Soeprijanto
Copyright © 2013 Praise Worthy Prize S.r.l. - All rights reserved International Review of Electrical Engineering, ,Vol. 8, N.1
335
TABLE 3 LINE DATA OF JAVA-BALI 500 KV POWER SYSTEMS
No From Bus
To Bus
R p.u
X p.u
½ B p.u
1 1 2 0.000626496 0.007008768 0 2 1 24 0.003677677 0.035333317 03 2 5 0.013133324 0.146925792 0.0035305714 3 4 0.001513179 0.016928308 05 4 18 0.000694176 0.006669298 06 5 7 0.004441880 0.042675400 07 5 8 0.006211600 0.059678000 08 5 11 0.004111380 0.045995040 0.0044209739 6 7 0.001973648 0.018961840 0
10 6 8 0.005625600 0.054048000 0 11 8 9 0.002822059 0.027112954 012 9 10 0.002739960 0.026324191 013 10 11 0.001474728 0.014168458 014 11 12 0.001957800 0.021902400 015 12 13 0.006990980 0.067165900 0.00642913516 13 14 0.013478000 0.129490000 0.01239481217 14 15 0.013533920 0.151407360 0.00363826118 14 16 0.015798560 0.151784800 0.003632219 19 14 20 0.009036120 0.086814600 0 20 16 17 0.001394680 0.013399400 0 21 16 23 0.003986382 0.044596656 022 18 5 0.000818994 0.007868488 023 18 19 0.014056000 0.157248000 0.01511443724 19 20 0.015311000 0.171288000 0.01646394125 20 21 0.010291000 0.115128000 0.011065927
IV.2. Experimental Result
- Optimization Without SVC Placement
To determine the initial conditions of optimization without SVC placement on the electrical system of the Java-Bali 500 kV, the power flow analysis is carried out using the Newton Rapson.
The result of the voltage profile analysis without installing SVC is shown in Figure 11.
Fig.11. Voltage profile without SVC placement
In figure 11, it shows that the values of the voltage on the electrical system of the Java-Bali 500 kV are in the range of 0.874 pu to 1.020 pu. The highest voltage is at bus 1 (Suralaya) and the low voltage is at bus 20 (Pedan). Figure 11 also shows that there are 8 buses having a voltage outside the range 1.05 ± 0.95 pu, the bus 12 (South Bandung) = 0.948 pu, bus 13 (Mandiracan) = 0.911 pu, bus 14 (Ungaran) = 0.907 pu, bus 19 (Tasikmalaya) = 0.875 pu, bus 20 (Pedan) = 0.874 pu, bus 21 (Kediri) = 0.902 pu, bus 24 (Balaraja) = 0.982 pu and bus 25 (Ngimbang) = 0.946 pu.
The result of the analysis of the reduction of power loss in the transmission line without placement is shown
in Figure 12.
Fig.12. Power loss in transmission lines without SVC installation
Figure 12 shows that the total active power losses occuring in the Java-Bali transmission line are 500 kV at 297.607 MW and the reactive are of 2926.825 MVAR with power supply from active power generator of 10658.607 MW of and the reactive one is amounted to 7338.924 MVAR. Active power loss is the greatest in line 13-14 of 60.593 MW and the smallest occurs in line 3-4 of 0.069 MW. While the greatest reactive power loss is in line 13-14 at 561.663 MVAR and the smallest occurs in line 3-4 of 0.775 MVAR.
- Optimization of SVC placement using GSA
The results of the convergence curve after optimization with SVC placement using GSA is shown in Figure 13.
0 10 20 30 40 50 60 70 80 90 100287.15
287.2
287.25
287.3
287.35
287.4
287.45
287.5
287.55
Iteration
Pow
er L
osse
s (M
W)
Convergence of GSA Graphic
Fig.13. Characteristics of convergence with the placement of SVC using GSA
In figure 13, it shows that the convergence
characteristic with the placement of the SVC using the GSA can be convergent. The result of the electrical system convergence of Java-Bali 500 kV generates active power value loss of 287.232 MW. The result of active power loss by using the GSA SVC placement is less the minimum than the one without SVC placement.The reduction of active power losses generated by using GSA's SVC placement is of 10.375 MW.
Purwoharjono, Muhammad Abdilah, Ontoseno Penangsang, Adi Soeprijanto
Copyright © 2013 Praise Worthy Prize S.r.l. - All rights reserved International Review of Electrical Engineering, ,Vol. 8, N.1
336
The results of the voltage profile improvement after optimization by using the GSA SVC placement is shown in Figure 14.
Fig.14. Optimization Voltage Profile with SVC placement using GSA
In Figure 14, it shows that the values of the voltage on
the electrical system of the Java-Bali 500 kV are in the range of 0.959 pu to 1.020 pu. The highest voltage is at bus 1 (Suralaya) and the lowest is on the bus 7 (Bekasi). Figure 14 also shows that all values of bus voltage occuring after the placement of the SVC using the GSA is within the given standard voltage values, in the range of 0.95 ± 1.05 pu.
The results of the reduction of power loss in the Java-Bali transmission line 500 kV after optimization with SVC placement by using the GSA is shown in Figure 15.
Fig.15. Power loss in transmission lines with SVC placement using GSA
In figure 15, it shows that the total active power losses
occuring in the Java-Bali transmission line 500 kV is at 287.232 M and the total reactive power loss is of 2817.054 MVAR with power supply from an active power generator of 10648.23 MW and reactive power generation of 6793.381 MVAR. Active power loss is the greatest in line 13-14 of 58.413 MW and the smallest occurs in line 3-4 of 0.069 MW. While the reactive power loss is the greatest in line 13-14 of 540.398 MVAR and the smallest in line 3-4 lines of 0.769 MVAR.
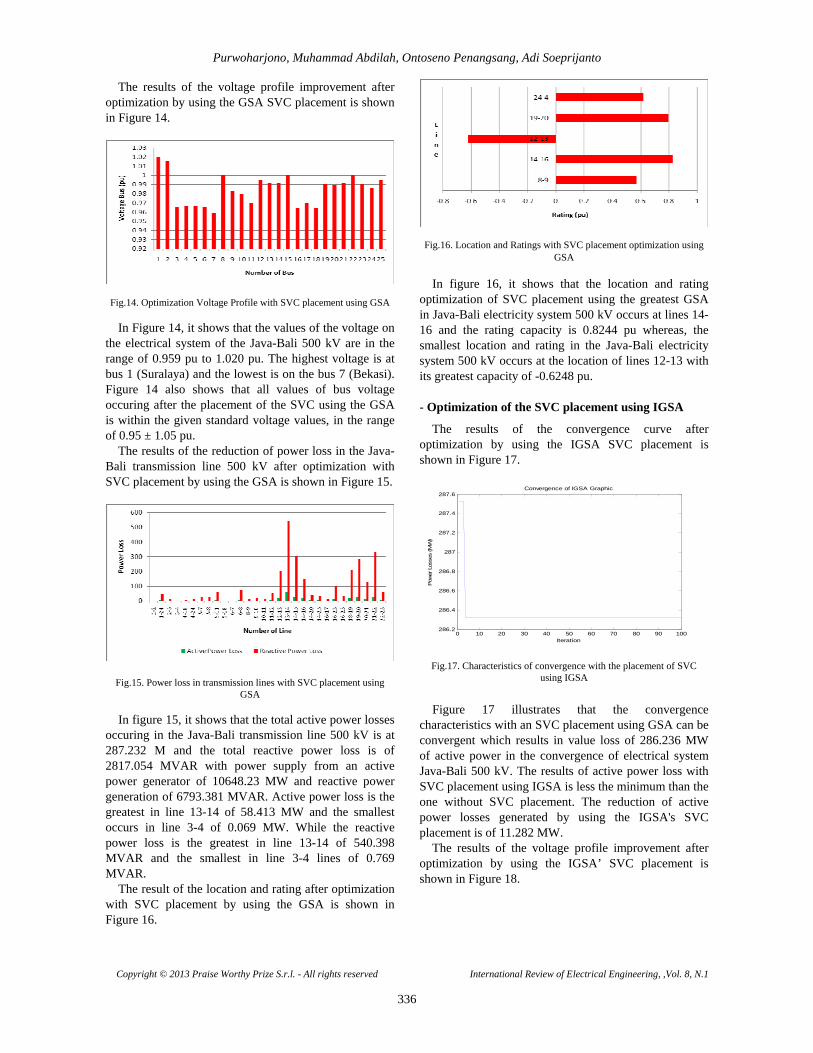
The result of the location and rating after optimization with SVC placement by using the GSA is shown in Figure 16.
Fig.16. Location and Ratings with SVC placement optimization using GSA
In figure 16, it shows that the location and rating
optimization of SVC placement using the greatest GSA in Java-Bali electricity system 500 kV occurs at lines 14-16 and the rating capacity is 0.8244 pu whereas, the smallest location and rating in the Java-Bali electricity system 500 kV occurs at the location of lines 12-13 with its greatest capacity of -0.6248 pu. - Optimization of the SVC placement using IGSA
The results of the convergence curve after optimization by using the IGSA SVC placement is shown in Figure 17.
0 10 20 30 40 50 60 70 80 90 100286.2
286.4
286.6
286.8
287
287.2
287.4
287.6
Iteration
Pow
er L
osse
s (M
W)
Convergence of IGSA Graphic
Fig.17. Characteristics of convergence with the placement of SVC using IGSA
Figure 17 illustrates that the convergence
characteristics with an SVC placement using GSA can be convergent which results in value loss of 286.236 MW of active power in the convergence of electrical system Java-Bali 500 kV. The results of active power loss with SVC placement using IGSA is less the minimum than the one without SVC placement. The reduction of active power losses generated by using the IGSA's SVC placement is of 11.282 MW.
The results of the voltage profile improvement after optimization by using the IGSA’ SVC placement is shown in Figure 18.

Purwoharjono, Muhammad Abdilah, Ontoseno Penangsang, Adi Soeprijanto
Copyright © 2013 Praise Worthy Prize S.r.l. - All rights reserved International Review of Electrical Engineering, ,Vol. 8, N.1
337
Fig.18. Profile voltage with SVC placement optimization using IGSA Figure 18 shows that the values of the voltage on the
electrical system of the Java-Bali 500 kV are in the range of 0.951 pu to 1.020 pu. The highest voltage is at bus 1 (Suralaya) and the lowest is on bus 7 (Bekasi). From Figure 18 it also shows that all the values of bus voltage occuring after the placement of the SVC using the IGSA is in given standard voltage values, in the range of 0.95 ± 1.05 pu.
The results of the reduction of power loss in the Java-Bali transmission line 500 kV after optimization by using the GSA’ SVC placement is shown in Figure 19.
Fig.19. Power loss in the transmission line with SVC placement using
IGSA
Figure 19 shows that the total active power losses that occur in Java-Bali transmission line 500 kV is at 286.236 MW and reactive power loss of 2806.64 MVAR with power supply from an active power generator of 10658.61 MW with reactive power generation amounted to 7338.924 MVAR. Active power loss was the greatest in line 13-14 of 57.988 MW and the smallest at 0.07 MW on line 3-4 , while the reactive power loss was greatest in line 13-14 at 536.264 MVAR and the smallest occurs in line 3-4 of 0.78 MVAR.
The result of the location and rating after optimization by using the IGSA’s SVC placement is shown in Figure 20.
Fig.20. Location and Ratings with SVC placement optimization using IGSA
In figure 20, it illustrates that the location and rating
with optimization of placement of the SVC using the greatest IGSA at Java-Bali electricity system 500 kV occurs in location of lines 19-20 at the with its rating capacity of 0.8793 pu, while the smallest the location and rating in the Java-Bali electricity system 500 kV occur at the location of lines 2-5 with its rating capacity of -0.6973 pu. - Comparison of optimization with SVC Placement
by using the GSA and IGSA The result of a comparison of convergence curve after
optimization with SVC placement by using the GSA and IGSA is shown in Figure 21.
0 10 20 30 40 50 60 70 80 90 100286.2
286.4
286.6
286.8
287
287.2
287.4
287.6
Iteration
Pow
er L
osse
s (M
W)
Behaviour of Gravitational Search Algorithm
GSAIGSA
Fig.21. Comparison of convergence characteristics with SVC placement
using GSA and IGSA In figure 21, it shows that the convergence
characteristic with the SVC placement using this IGSA is less the minimum than using GSA. Such comparison of the results in electrical system of convergence of Java-Bali 500 kV using GSA and IGSA produces the value of active power loss reduction of 0.97 MW.
Comparison of the results of the voltage profile improvement after optimization by using the GSA’s SVC placement, IGSA and without SVC placement is shown in Figure 22.
Purwoharjono, Muhammad Abdilah, Ontoseno Penangsang, Adi Soeprijanto
Copyright © 2013 Praise Worthy Prize S.r.l. - All rights reserved International Review of Electrical Engineering, ,Vol. 8, N.1
338
Fig.22. Comparison of Profile voltage with SVC placement optimization using GSA, IGSA and without SVC placement
Figure 22 shows that the values of the voltage profile
without SVC placement are beyond the standard set, ie outside the range of 0.95 ± 1.05 pu which can be improved with the SVC placement using GSA and IGSA.
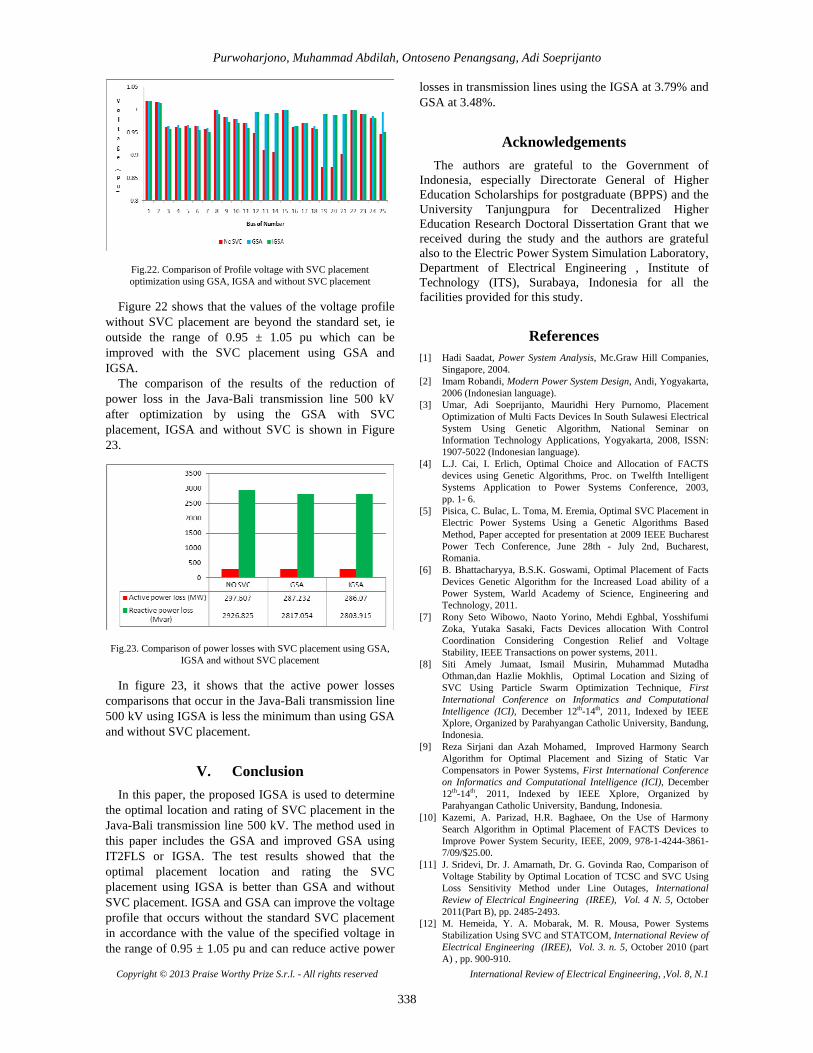
The comparison of the results of the reduction of power loss in the Java-Bali transmission line 500 kV after optimization by using the GSA with SVC placement, IGSA and without SVC is shown in Figure 23.
Fig.23. Comparison of power losses with SVC placement using GSA, IGSA and without SVC placement
In figure 23, it shows that the active power losses
comparisons that occur in the Java-Bali transmission line 500 kV using IGSA is less the minimum than using GSA and without SVC placement.
V. Conclusion In this paper, the proposed IGSA is used to determine
the optimal location and rating of SVC placement in the Java-Bali transmission line 500 kV. The method used in this paper includes the GSA and improved GSA using IT2FLS or IGSA. The test results showed that the optimal placement location and rating the SVC placement using IGSA is better than GSA and without SVC placement. IGSA and GSA can improve the voltage profile that occurs without the standard SVC placement in accordance with the value of the specified voltage in the range of 0.95 ± 1.05 pu and can reduce active power
losses in transmission lines using the IGSA at 3.79% and GSA at 3.48%.
Acknowledgements The authors are grateful to the Government of
Indonesia, especially Directorate General of Higher Education Scholarships for postgraduate (BPPS) and the University Tanjungpura for Decentralized Higher Education Research Doctoral Dissertation Grant that we received during the study and the authors are grateful also to the Electric Power System Simulation Laboratory, Department of Electrical Engineering , Institute of Technology (ITS), Surabaya, Indonesia for all the facilities provided for this study.
References [1] Hadi Saadat, Power System Analysis, Mc.Graw Hill Companies,
Singapore, 2004. [2] Imam Robandi, Modern Power System Design, Andi, Yogyakarta,
2006 (Indonesian language). [3] Umar, Adi Soeprijanto, Mauridhi Hery Purnomo, Placement
Optimization of Multi Facts Devices In South Sulawesi Electrical System Using Genetic Algorithm, National Seminar on Information Technology Applications, Yogyakarta, 2008, ISSN: 1907-5022 (Indonesian language).
[4] L.J. Cai, I. Erlich, Optimal Choice and Allocation of FACTS devices using Genetic Algorithms, Proc. on Twelfth Intelligent Systems Application to Power Systems Conference, 2003, pp. 1- 6.
[5] Pisica, C. Bulac, L. Toma, M. Eremia, Optimal SVC Placement in Electric Power Systems Using a Genetic Algorithms Based Method, Paper accepted for presentation at 2009 IEEE Bucharest Power Tech Conference, June 28th - July 2nd, Bucharest, Romania.
[6] B. Bhattacharyya, B.S.K. Goswami, Optimal Placement of Facts Devices Genetic Algorithm for the Increased Load ability of a Power System, Warld Academy of Science, Engineering and Technology, 2011.
[7] Rony Seto Wibowo, Naoto Yorino, Mehdi Eghbal, Yosshifumi Zoka, Yutaka Sasaki, Facts Devices allocation With Control Coordination Considering Congestion Relief and Voltage Stability, IEEE Transactions on power systems, 2011.
[8] Siti Amely Jumaat, Ismail Musirin, Muhammad Mutadha Othman,dan Hazlie Mokhlis, Optimal Location and Sizing of SVC Using Particle Swarm Optimization Technique, First International Conference on Informatics and Computational Intelligence (ICI), December 12th-14th, 2011, Indexed by IEEE Xplore, Organized by Parahyangan Catholic University, Bandung, Indonesia.
[9] Reza Sirjani dan Azah Mohamed, Improved Harmony Search Algorithm for Optimal Placement and Sizing of Static Var Compensators in Power Systems, First International Conference on Informatics and Computational Intelligence (ICI), December 12th-14th, 2011, Indexed by IEEE Xplore, Organized by Parahyangan Catholic University, Bandung, Indonesia.
[10] Kazemi, A. Parizad, H.R. Baghaee, On the Use of Harmony Search Algorithm in Optimal Placement of FACTS Devices to Improve Power System Security, IEEE, 2009, 978-1-4244-3861-7/09/$25.00.
[11] J. Sridevi, Dr. J. Amarnath, Dr. G. Govinda Rao, Comparison of Voltage Stability by Optimal Location of TCSC and SVC Using Loss Sensitivity Method under Line Outages, International Review of Electrical Engineering (IREE), Vol. 4 N. 5, October 2011(Part B), pp. 2485-2493.
[12] M. Hemeida, Y. A. Mobarak, M. R. Mousa, Power Systems Stabilization Using SVC and STATCOM, International Review of Electrical Engineering (IREE), Vol. 3. n. 5, October 2010 (part A) , pp. 900-910.

Purwoharjono, Muhammad Abdilah, Ontoseno Penangsang, Adi Soeprijanto
Copyright © 2013 Praise Worthy Prize S.r.l. - All rights reserved International Review of Electrical Engineering, ,Vol. 8, N.1
339
[13] E. Rashedi, H. Nezamabadi-pour, S. Saryazdi, GSA: A gravitational search algorithm, Information Sciences, vol. 179, 2009, pp. 2232-2248.
[14] Budi Santosa dan Paul Willy, Metaheuristics Method Concepts and Implementation, Guna Widya Publishers, 2011, ISBN: 979545049-2 (Indonesian language).
[15] Adi Soeprijanto and Muhammad Abdillah, Type 2 Fuzzy Adaptive Binary Particle Swarm Optimization for Optimal Placement and Sizing of Distributed Generation, Instrumentation, Communications, Information Technology, and Biomedical Engineering (ICICI-BME), 2nd International Conference on, 2011, Indexed by IEEE Xplore , Bandung, Indonesia.
[16] Esmat Rashedi , Hossien Nezamabadi-pour, Saeid Saryazdi, Malihe M. Farsangi, Allocation of Static Var Compensator Usin Gravitational Search Algorithm, First Joint Congress on Fuzzy and Intelligent Systems, 2007, pp. 29-31, Ferdowsi University of Mashhad, Iran.
[17] S S. Duman, U. Güvenç, N. Yörükeren, Gravitational Search Algorithm for Economic Dispatch with Valve-point Effects, International Review of Electrical Engineering (IREE), vol. 5, no. 6, 2010, pp. 2890-2895.
[18] H. Maskani, M. Ashouri, B. Bakhshideh Zad, H. Falaghi, M. Ramezani, Gravitational Search Algorithm Optimization for Dynamic Economic Load Dispatch with Valve-Point Effects, International Review of Electrical Engineering (IREE), Vol. 5 N. 1, February 2012 (Part A), pp. 40-51.
[19] Serhat Duman, Yusuf Sonmez, Ugur Guvenc, dan Nuran Yorukeren, Application of Gravitational Search Algorithm for Optimal Reactive Power Dispatch Problem, IEEE, 2011.
[20] Purwoharjono, Ontoseno Penangsang, Muhammad Abdillah, Adi Soeprijanto, Voltage Control on Java-Bali 500kV Electrical Power System for Reducing Power Losses Using Gravitational Search Algorithm, Proceeding of the 1st International Conference on Informatics and Computational Intelligence (ICI), December 12th-14th, 2011, pp.11-17, Indexed by IEEE Xplore, Organized by Parahyangan Catholic University, Bandung, Indonesia.
[21] Purwoharjono, Muhammad Abdillah, Ontoseno Penangsang, Adi Soeprijanto, Optimal Placement and Sizing of TCSC Using Gravitational Search Algorithm, Indonesian Journal of Electrical Engineering, TELKOMNIKA (Telecommunication, Computing, Electronics and Control), Vol. 10 No. 4, December 2012, pp. 683-694, ISSN: 1693-6930, Published by Ahmad Dahlan University, Indonesia.
[22] Purwoharjono, Muhammad Abdillah, Ontoseno Penangsang, Adi Soeprijanto, Optimal Placement of TCSC Using Linear Decreasing Inertia Weight Gravitational Search Algorithm, Journal of Theoretical and Applied Information Technology, Vol. 47 No. 2, 20th January 2013, Pakistan.
[23] Ch. Rambabu, Y. P. Obulesh, Ch. SaiBabu, Enhancement of Transient Stability Limit Using Fuzzy Controlled TCSC, International Review of Electrical Engineering (IREE), Vol. 5 N. 4, August 2012 (Part B), pp. 1701-1709.
[24] Purwoharjono, Muhammad Abdillah, Ontoseno Penangsang, Adi Soeprijanto, Optimal Design of TCPST Using Gravitational Search Algorithm, International Conference on Intelligence System and Informatics (ISI), November 19th - 21nd, 2012, Indexed by IEEE Xplore, Organized by Parahyangan Catholic University, Bandung, Indonesia.
Authors’ information Purwoharjono was born in Indonesia. He received the B.E.degree in electrical engineering from University of Tanjungpura, Pontianak, Indonesia, in 1997 and M.S degree in electrical engineering from Institut Teknologi Sepuluh Nopember, Surabaya, Indonesia, in 2001. Since 1998, He has been a Lecturer in the Department of the Electrical Engineering, University of
Tanjungpura, and Indonesia. He is now finishing doctoral degree at Department of the Electrical Engineering, Institut Teknologi Sepuluh November, and Surabaya, Indonesia under the topic about
computational intelligence application on power system, power system operation and control, power system analysis, forecasting and power system stability.
Muhammad Abdillah was born in Indonesia. He received the B.E. degree in electrical engineering from Institut Teknologi Sepuluh November, Surabaya, Indonesia, in 2009. Since 2010, he has member of Power System Simulation Laboratory at the same institute, as Junior Researcher. He is now pursuing magister degree at the same institute and interest
the topic about computational intelligence application on power system, power system operation and control, power system stability, forecasting, and intelligent control, system and their application.
Ontoseno Penangsang was born in Indonesia. He received the B.E.degree in electrical engineering from Institut Teknologi Sepuluh November, Surabaya, Indonesia, in 1974 and M.S degree in electrical engineering from University Of Wisconsin-Madison College of Engineering, USA, in 1978. He received the Ph.D degree in electrical engineering from
University of Wisconsin-Madison College of Engineering, USA, in 1983. Since 1974, he has been a Lecturer in the Department of the Electrical Engineering, Institut Teknologi Sepuluh Nopember, and Surabaya, Indonesia. His current research interests include the application computational intelligence application on power system, power system operation and control, power system analysis, power system stability and power quality. He is currently a Professor of Department of Electrical Engineering, Sepuluh November Institute of Technology (ITS).
Adi Soeprijanto was born in Indonesia. He received the B.E., and M.S., degrees in electrical engineering from Institut Teknologi Bandung, Bandung, Indonesia, in 1988 and 1995, respectively. He received the Ph.D. degree in electrical engineering from Hiroshima University in 2001. Since 1990, he has been a Lecturer in the Department of the Electrical
Engineering, Institut Teknologi Sepuluh November, and Surabaya, Indonesia. His current research interests include the application of intelligent systems to power system operation, management, and control. Prof. Dr. Ir. Adi Soeprijanto, MT is a member of the Indonesian Power System Expert Association (IATKI) of Indonesia.