optimal control of shock wave turbulent boundary ......optimal control of shock wave turbulent...
TRANSCRIPT

1
1
Optimal Control of Shock Wave Turbulent Boundary Layer
Interactions Using Micro-Array Actuation
Bernhard H. Anderson*
NASA John Glenn Research Center
Cleveland, Ohio, 44135
Jon Tinapple†
AFRL Wright Patterson Air Force Base
Dayton, Ohio, 45433
Lewis Surber‡
Universal Technology Corporation
Dayton, Ohio, 45433
ABSTRACT
The intent of this study on micro-array flow control is to demonstrate the viability and
economy of Response Surface Methodology (RSM) to determine optimal designs of micro-array
actuation for controlling the shock wave turbulent boundary layer interactions within supersonic
inlets and compare these concepts to conventional bleed performance. The term micro-array
refers to micro-actuator arrays which have heights of 25% to 40% of the undisturbed supersonic
boundary layer thickness. This study covers optimal control of shock wave turbulent boundary
layer interactions using standard micro-vane, tapered micro-vane, and standard micro-ramp arrays
at a free stream Mach number of 2.0. The effectiveness of the three micro-array devices was
tested using a shock pressure rise induced by the 10o shock generator, which was sufficiently
strong as to separate the turbulent supersonic boundary layer. The overall design purpose of the
micro-arrays was to alter the properties of the supersonic boundary layer by introducing a cascade
of counter-rotating micro-vortices in the near wall region. In this manner, the impact of the shock
wave boundary layer (SWBL) interaction on the main flow field was minimized without
boundary bleed.
NOMENCLATURE
AIP Aerodynamic Interface Plane
Ap Micro-Actuator Angle-of-Incidence
AS Across the Shock Bleed Configuration, (See Ref. 2)
c Micro-Actuator Chord Length
CCF Central Composite Face-Centered
CFD Computational Fluid Dynamics
DOE Design of Experiments
DS Downstream of Shock Bleed Configuration, (See Ref. 2)
DP/P0 Total Pressure Change
h Micro-Actuator Height
hy Tunnel Width, 15 cm.
hz Tunnel Height, 15 cm.
Htr Transformed Form Factor, (See Ref. 2)
* Senior
Research Engineer, NASA Glenn Research Center, MS 86-7
† Senior Research Engineer, Wright Patterson Air Force Base, AFRL/VAAI
‡ Senior Consultant, Universal Technology Corporation
3rd AIAA Flow Control Conference5 - 8 June 2006, San Francisco, California
AIAA 2006-3197
Copyright © 2006 by the American Institute of Aeronautics and Astronautics, Inc. All rights reserved.

2
2
M0 Tunnel Mach Number
MBLEED/MBL1 Bleed Mass Flow Ratio, (See Ref. 2)
n Number of Micro-Actuator Pairs
P0 Tunnel Total Pressure
RSM Response Surface Methodology
SWBL Shock Wave Boundary Layer
s Spanwise Micro-Actuator Spacing
T0 Tunnel Total Temperature
US Upstream of Shock Bleed Configuration, (See Ref. 2)
Xaip Streamwise Location Reference (AIP) Plane
Xp Location of Micro-Actuator Array
Wbleed Bleed Mass Flow
W0 Capture Mass Flow
w1 Weighting Function for Total Pressure Change, DP/P0
w2 Weighting Function for Transformed Boundary Layer Form Factor, Htr
δ Shock Generator Angle
δ* Compressible Boundary Layer Displacement Thickness
δshk Boundary Layer Thickness At Shock Impingement Location
θ Compressible Boundary Layer Momentum Thickness
INTRODUCTION
Supersonic inlet performance is directly related to the way the boundary layer develops
through the inlet. Uncontrolled viscous effects related to boundary layer growth and interactions
can cause performance degradations that may seriously limit the effectiveness of the inlet. A
boundary layer developing through strong adverse pressure gradients tend to thicken rapidly and
have velocity profiles "less full" than boundary layer profiles with zero pressure gradient.
Interactions between boundary layer and shock waves also cause the boundary layer thickness to
change and distort the velocity profile. These changes affect the inviscid flow field by increasing
the likelihood of separation and reducing inlet total pressure recovery. The adverse effects
associated with the boundary layer can be partially eliminated by using a "bleed" system to
control boundary layer development through the inlet. The bleed system usually removes the low
momentum portion of the boundary layer through porous sections, slots, or scoops. In this way,
the size and characteristics of the boundary layer are in some way controlled. A large
performance penalty is incurred, however, in maintaining a "healthy" boundary layer in
supersonic inlets by "bleeding" off the low momentum portion of the boundary layer. The bleed
mass flow is not usually reinjected into the inlet, so part of the capture mass flow is lost. To
compensate for this loss in mass flow, a larger nacelle may be needed which would increase the
friction drag and inlet weight. In addition, the bleed flow is usually vented overboard through
bleed exits, a phenomenon which also incurs a drag penalty. Therefore it is desirable to minimize
the amount of boundary layer bleed and/or develop alternate methods for maintaining good
internal aerodynamic performance.
There have been excellent studies published on the control of shock wave turbulent
boundary layer interactions in supersonic mixed compression inlets by Tjonneland(1)
, Fukuda,
Hingst, and Reshotko(2)
, and Syberg and Konsek(3)
. In each study, the design objective was to
maintain a "healthy" boundary layer development throughout the supersonic inlet system.
Therefore, an intermediate parameter had to be defined which characterizes the "health" of the
boundary layer within the supersonic inlet. In the experimental study by Fukuda, Hingst, and
Reshotko, the "health" of the supersonic inlet boundary was characterized by a transformed form
factor Htr. The transformed form factor Htr is defined in the exactly same way as the

3
3
incompressible form factor. However, it is applied in the compressible flow regime. It is used in
compressible boundary layer bleed studies to compress the Mach number effect on the measured
boundary layer properties
This research study on micro-actuator array flow control is a collaborative effort between
the AFRL Flight Vehicles Directorate (AFRL/VAAI) and NASA Glenn Research Center
(NASA/GRC) to develop and demonstrate advanced flow control techniques for supersonic
mixed compression inlets. The AFRL Flight Vehicles Directorate has focused recent effort on the
advancement of propulsion integration technologies associated with LRSA (Long Range Strike
Aircraft). The goal of this effort has been to define and develop high payoff advanced technology
approaches for mixed compression inlets operating in the Mach 2.0 to 4.0 speed regime. In
addition, NASA/GRC is also focusing a portion of its micro-flow control research effort on
commercial and business type aircraft in the speed range Mach 1.6 to 2.0. Therefore, the
collaborative effort also provides technology interchange between the military and commercial
side of aerodynamic research. The collaboration between AFRL/VAAI and NASA/GRC
combines CFD analysis, Design-of-Experiments (DOE) methodologies(4)
and experimental test,
from small scale subcomponent applications to low-cost DOE based large scale isolated inlet
models, to demonstrate reliable high inlet performance as well as unprecedented efficiency of the
design/development process. The matured plan for collaboration will involve CFD capabilities in
NASA, AFRL, industry and academia. NASA/GRC has developed the baseline CFD analysis
and DOE investigation of advanced flow control “fail safe” actuators along with “Proof-of-
Concept” CFD analysis of the integration of micro-actuator devices into “real” supersonic
external and mixed compression inlet systems. The AFRL/VA Computational Branch (VAAC)
has become involved as well, helping to guide test planning at AFRL by providing CFD analysis
of wind tunnel hardware. In a collaborative program with NASA/GRC, they are also assisting in
providing comparisons of actuator CFD analysis between the NASA WIND code and the AFRL
AVUS code using formal statistical analysis. Supplemental basic research into the physics of
SWBL interactions will be accomplished by the Univ. of Illinois (CFD Analysis) and Cambridge
Univ. (Experimental Studies). Their combined work will provide insight into the fundamental
aerodynamic characteristics of “non-bleed” shock wave boundary layer control, both with regards
to performance and inlet stability
This paper is the first in a series of studies within the AFRL/VAAI and NASA/GRC
collaboration which examines fundamental type shock wave turbulent boundary layer (SWBL)
interactions to determine whether they can be managed adequately without boundary layer bleed.
There were three objectives in this study that were considered important, namely: (1) to establish
the ability of micro-array flow control to manage the shock wave turbulent boundary layer
interactions in supersonic inlets, (2) to determine the "design" characteristics of micro-array
actuation, and (3) to evaluate the effectiveness of micro-array flow control, relative to
conventional inlet boundary layer bleed. The payoff associated with the collaborative
AFRL/VAAI NASA/GRC project is the future demonstration of reliable high performance in
practical, flight vehicle-integrated supersonic inlets as well as unprecedented efficiency of the
overall process of air intake design and development for future aircraft systems.
RESULTS AND DISCUSSION
The following section will cover the overall design approach to micro-actuator flow
control, the CFD analysis of micro-actuator flow control, the optimization of micro-actuator flow
control, a performance comparison with conventional inlet boundary layer bleed, the generalized
design guidelines to micro-actuator flow control, and finally, the aerodynamic properties of
micro-actuator flow fields.

4
4
Design Approach to Optimal Micro-Actuator Array Flow Control
The study on micro-array flow control centers on the NASA/GRC 15 x 15 cm. Supersonic
Wind Tunnel in which a 100 shock generator was installed to induce a strong shock wave
turbulent boundary later interaction, Figures 1 and 2. Micro-array devices were positioned
upstream of the SWBL interaction, Figure 1, to generate a cascade of micro-vortices in the near
wall region of the supersonic boundary layer. The study covered optimal control of shock wave
turbulent boundary layer interactions using standard micro-vanes, tapered micro-vane, and
standard micro-ramp arrays, Figures 3 through 11, operating at a free stream Mach number of 2.0.
The overall design purpose of the micro-actuation is to alter the properties of the supersonic
boundary layer by introducing a cascade of counter-rotating micro-vortices in the near wall
region. The properties of the micro-arrays are described in the last section of this paper entitled
“Aerodynamic Properties of Micro-Actuator Flow Fields”. The effectiveness of the three types of
micro-actuator array devices was tested using the shock pressure rise induced by the 10o shock
generator, which was sufficiently strong as to separate the turbulent supersonic boundary layer.
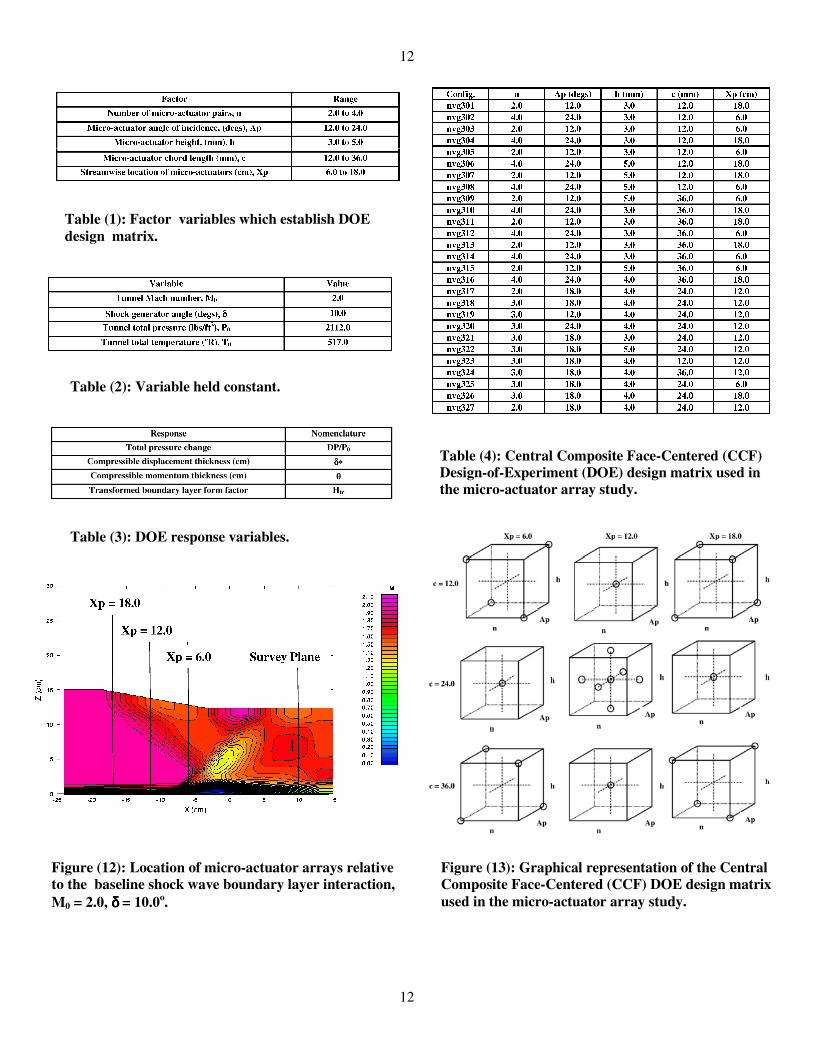
The factor (design) variables are listed in Table 1 and are the number of co-rotating micro-
actuator pairs (n), the micro-actuator geometric angle-of-incidence (Ap), the height of the micro-
actuator in mm. (h), the chord length of the micro-actuator in mm. (c), and the location of the
micro-actuator arrays upstream of the inviscid shock impingement point on the tunnel floor in
cm. (Xp). The variables that were held constant in this study are presented in Table 2, and include
the tunnel Mach number M0, the shock generator angle δ, the tunnel total pressure P0, and the
tunnel total temperature T0. Table 3 presents the response variables which included the micro-
actuator array area averaged total pressure change (DP/P0) from the baseline or uncontrolled
SWBL interaction flow field, the area averaged compressible boundary layer displacement
thickness (δ*) at the AIP (or reference plane) located 10.0 cm. downstream of the inviscid shock
wave impingement on the tunnel floor, the area averaged compressible momentum thickness at
the AIP (θ), and the area averaged boundary layer transformed form factor (Htr). The location of
the micro-actuator arrays relative to the baseline shockwave boundary layer interaction is shown
in Figure 13 along with the reference (AIP) survey plane. At a streamwise location Xp of 6.0 cm,
the micro-actuators are partially within the separated region.
The DOE strategy selected was a Central Composite Face-Centered (CCF) design, Table
(4). This strategy resulted in three sets of 27 unique CFD experimental cases, one set for each of
the three micro-actuator array devices under consideration. This particular DOE design, like most
DOE strategies, varied more than one factor at a time. Further, this layout of 27 cases permitted
the estimation of both linear and curvilinear effects as well as two-factor interactive or synergistic
effects among the factor variables. A graphical representation of the Central Composite Face–
Centered (CCF) DOE used in this study is presented in Figure 13. The DOE cases are represented
in this figure by the circular symbols, where the locations of the symbols on the cube designate
the factor values. This DOE is called is called a composite design because the layout of cases are
composed of a fractional factorial part and a quadratic part. The full factorial part is composed of
the 25 or 32 cases which are represented by the eight corner location in each of the four corner
cubes in Figure 13. However, since this DOE is composed of a ½ fractional factorial design, there
is only 25-1
or 16 factorial cases, and these have been designated as the symbols in each of the
four corner cubes in Figure 13. The remainder of the cases is the quadric part of the DOE. All
together, there are 27 cases in a CCF design with five factor variables. Notice the balanced layout
of cases in Figure 13. These layouts represent the smallest number of DOE cases that allow for
the evaluation of the linear and curvilinear effects as well as all the two-factor or first order
interactions.
One critical aspect of Response Surface Methodology(4)
(RSM) is its ability to identify,
prioritize, and examine statistical interactions among the factors (design) variables. Knowledge of
these statistical interactions is critical for achieving optimal micro-array designs. A statistical

5
5
interaction exists between two independent factor variables X1 and X2 when the effect of X1 on
response variable Yi is affected by the value of X2. In other words, the effect of factor X1 on
response Yi is not unique, but changes as a function of X2. This type of behavior is often called a
synergistic effect and its understanding is very critical in the optimization process of micro-array
flow control devices.
Analysis of Micro-Actuator Flow Control
Each of the 3x27 cases, representing the DOE design for the tapered vanes, Figure 3,
standard ramps, Figure 6, and standard vanes, Figure 9, were run with a Reynolds–averaged
Navier Stokes WIND code(5-6)
. The DOE matrixes of cases, for each of the micro-actuators
studied, were identical to Table 4, where the nomenclature definition of the micro-actuator factor
variables are defined in Figures 5, 8 and 11. In the present study, the individual micro-actuators
were incorporated into the grid topology, which are shown in Figures 4, 7 and 10, for the tapered
vanes, standard ramps, and standard vanes respectively. The complete grid was composed of
three blocks, an upstream block, a working block represented by Figures 4, 7 and 11, and a
downstream block. Since the need existed to economize, because of the large number of cases to
be run, and to guarantee proper grid resolution in the neighborhood of the micro-actuators, only a
single vane or half-ramp geometry was considered. Symmetry boundary conditions were then
applied to the grid side walls, and inviscid wall boundary conditions were applied to the shock
generator and top wall surfaces. Each of the 3 x 27 or 81 cases were run with a grid containing
263,552 mesh points, where the working block consisted of 50x45x64 mesh points. Hence, in this
study, there were 45 grid points to resolve the flow across the radius of the vortex induced by the
micro-actuators.
Although the grid topology allowed for a boundary layer development along the micro-
actuators themselves, a statistical error study was initiated by Anderson, Tinapple, and, Surber(7)
to determine whether it was necessary to resolve the boundary layer on the micro-actuator
surfaces. The results indicated that there was no statistical difference between the DOE response
variables defined in Table 3, as a result of the different wall boundary conditions applied to the
micro-actuator surfaces. Hence, it was not necessary to resolve the micro-actuator surface
boundary layer in the grid topology. A statistical error study was also initiated by Anderson,
Tinapple, and, Surber(7)
to determine the impact of the assumed turbulence model. Two sets of
paired observation, each containing nine different micro-actuator geometries, were evaluated
using both the 2-equation Shear Stress turbulence model and the Spalart-Allmaras turbulence
model contained in the WIND Navier Stokes code. Again, the results indicated that there was no
statistical difference between the DOE response variables as a result of turbulence model. Hence,
the shock wave boundary layer interaction was not sensitive to turbulence model when optimal
micro-actuator array devices were present in the flow field.
Optimal Micro-Actuator Array Flow Control
To illustrate the potential of Response Surface Methods (RSM) to determine optimal
designs of micro-array actuation for controlling the shock wave turbulent boundary layer
interactions within supersonic inlets, the design objectives must be clearly stated in terms of the
DOE response variables presented in Table 3. Of the four response variables listed, the main
objectives are to maximize the total pressure difference (DP/P0) and to minimize the boundary
layer transformed form factor (Htr) downstream of the shock wave boundary layer interaction.
The two other response variables (δ*) and (θ) are left unconstrained in optimization process.
Unfortunately, (DP/P0) does not maximize in the same location in design space as (Htr) is
minimized. Hence, a multi-object methodology must be used to optimize micro-actuator array
∑=
=N
i
iiwD1
η

6
6
flow control. To accomplish the multi-objective optimization, a desirable function is defined such
that
where
and
The normalized response variables η1 and η2 are related to the actual response variables through
the equations
while the weighting functions w1 and w2 must satisfy the condition that
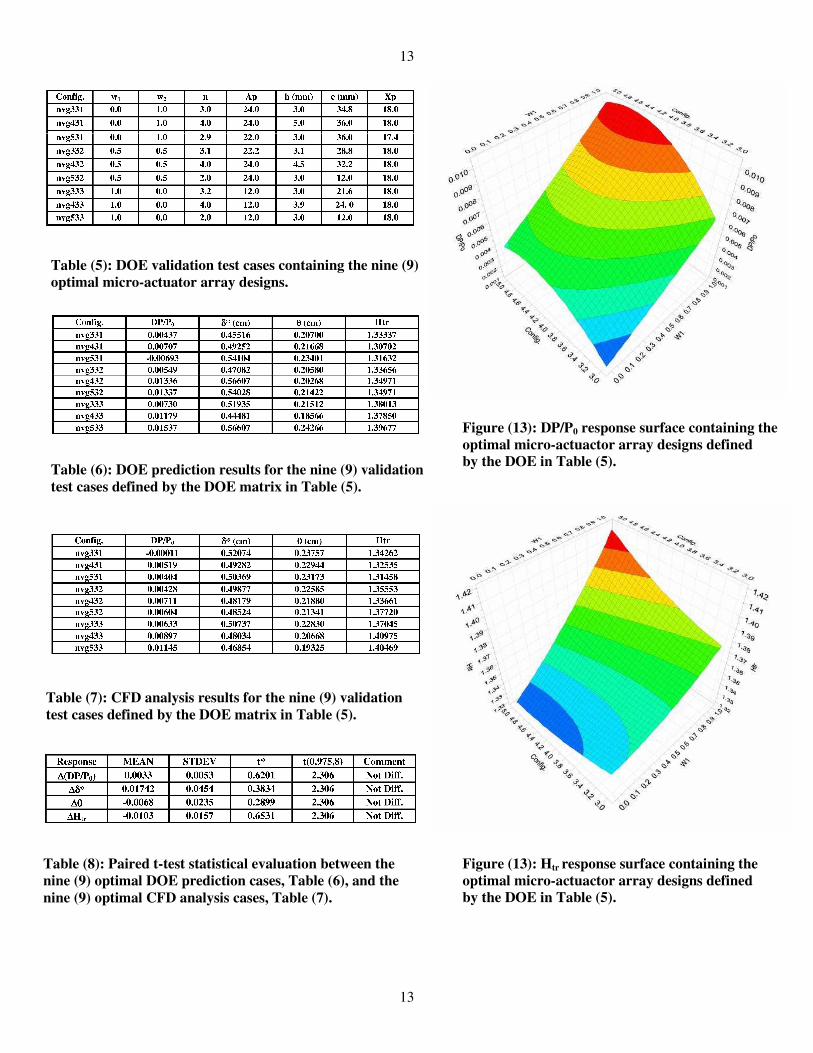
The results of the multi-objective optimization are presented in Table 5 in terms of the weighting
functions wi and the micro-actuator configurations, i.e. the 300 series configuration for tapered
micro-vanes, the 400 series for standard micro-ramps, and the 500 series configuration for
standard micro-vanes. The weighting function w1 was chosen to be 0.0, 0.5, and 1.0 for this
study. Thus for a weighting value w1 equal to 0.0, the transformed form factor (Htr) is minimized,
while for a weighting function value w1 equal to 1.0, the total pressure difference (DP/P0)
downstream of the shock wave boundary layer interaction is maximized.
In order to judge the adequacy of the response surface representation, a statistical study
was made between the DOE prediction from the computed response surface, Table (6), and a
paired set of CFD analysis results, Table 7, each for the optimal micro-actuator arrays defined in
Table 5. The observations presented in Tables 6 and 7 have been ordered such that the two sets of
4x9 observations can be tested as a paired t-test. In a paired t-test, the mean of the sample
difference and the standard deviation of the sample difference are computed and the following t-
statistic determined:
where is the difference between each of the N-pairs of response variables in the
two data sets tabulated in Tables 6 and 7 and is the mean of the sample difference. In a paired t-
test, if the expression
is valid, the response variables from the first data are not statistically different from the response
variables from the second the data set at the 95% confidence level. Conversely, the response
variables from the first data set are statistically different from the response variables in the second
data set if the following expression is valid:
where is the 95% confidence t-value from the t-tables for vp degrees of freedom,
which in this example would be eight, i.e., number of observation minus one. The statistical
comparison between the DOE response surface predictions, Table 6, and the CFD analysis
min,1max,1
min,111
YY
YY
−−=η
min,2max,2
min,222 0.1
YY
YY
−−−=η
01 / PDPY =
trHY =2
∑=
=N
i
iw1
0.1
∑
∑=
=
=
−∆−∆
∆
N
j
j
N
j
j
N
N
t
1
2
1
)1(
)(
1
*
jj YY )( 21 −=∆
),975.0(* ptt ν<
),975.0(* ptt ν>),975.0( pt ν
∆

7
7
results, Table 7, are presented in Table 8 and indicate that there is no significant statistical
difference between the two sets of observations at the 95% confidence level. Even though there
are numerical differences between the two prediction methods, these differences are not
statistically meaningful. Therefore, the optimal response surface representation for (DP/P0) and
(Htr) presented in Figures 13 and 14 are in very good agreement with the CFD analysis. It is also
obvious from Figures 13 and 14 that maximizing the total pressure recovery is not compatible
with minimizing the impact of the shock wave turbulent boundary layer interaction by using
micro-actuator devices. However, optimal boundary layer control can be achieved with gains in
total pressure recovery.
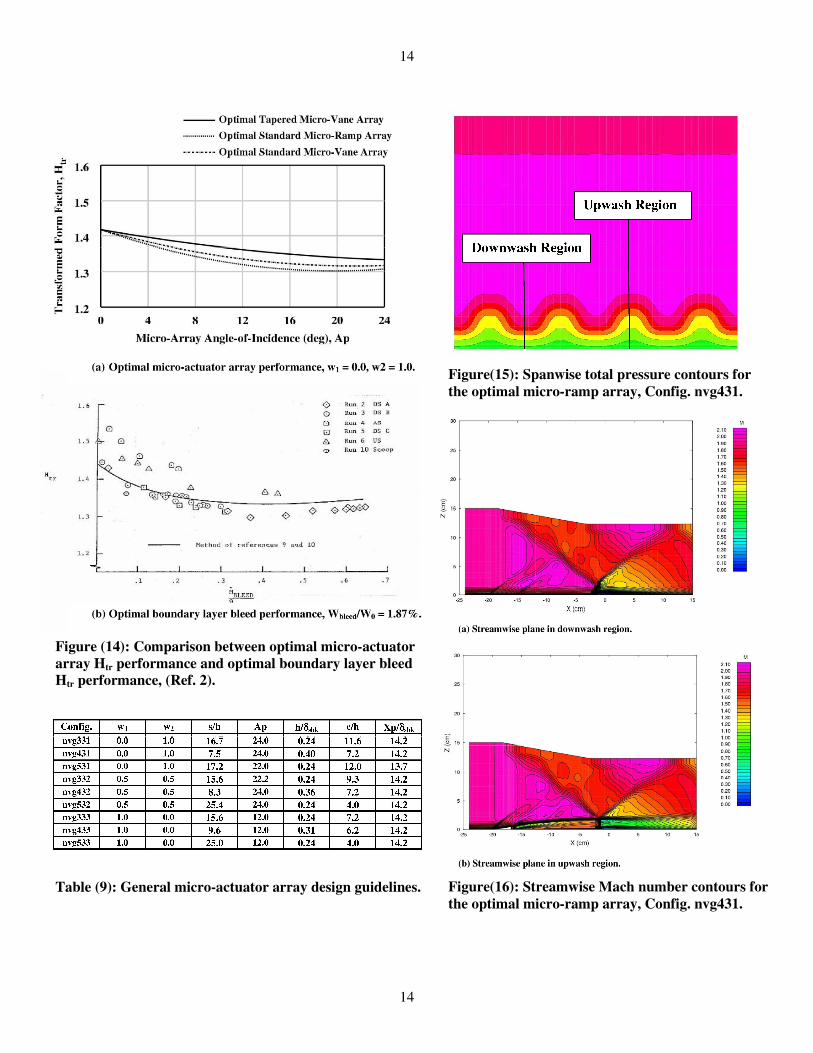
Comparison With Inlet Boundary Layer Bleed
As indicated in the previous section, it is possible to manage the shock wave boundary
layer interaction within a supersonic mixed compression inlet with micro-actuator devices,
whether these devices are tapered micro-vanes, standard micro-ramps, or standard micro-vanes.
This property of micro-actuator devises is shown in Figure 14a, which presents the transformed
form factor Htr as a function of actuator angle-of-incidence. It shows a decreasing the transformed
boundary layer form factor Htr with increasing geometric angle-of-incidence, even suggesting a
minimum plateau. In contrast, the results of the experimental study by Fukuda, Hingst, and
Reshotko(2)
showed that the transformed boundary layer form factor Htr directly after the shock
interaction also decreased with increasing bleed until a plateau was reached. This characteristic is
presented in Figure 14b. The level of the plateau was found to be dependant on the placement of
the bleed region relative to the shock induced pressure rise for given type of bleed. The amount of
bleed necessary to reach the Htr plateau was between 30% and 40% of the boundary layer mass
flow before the shock wave boundary layer interaction. This optimal amount of boundary layer
bleed translated into 1.87% of the inlet capture mass flow (Wbleed/W0). In comparing micro-
actuator boundary layer control, Figure 14a, with inlet boundary layer bleed control, Figure (14b),
it is apparent each can achieve the same level of Htr reduction in the boundary layer downstream
of the shock wave boundary layer interaction. It is also apparent the micro-actuator angle-of-
incidence plays the same role as bleed mass flow ratio in the boundary layer management
process, and that they have very similar behavioral characteristics.
There are, however, very important behavioral differences between controlling shock
boundary layer interactions with micro-actuator flow control instead of conventional boundary
layer bleed. These differences will lead to major inlet design changes. The boundary layer
displacement thickness downstream of the interaction was substantially larger with micro-
actuator flow control than with boundary layer bleed(7)
. This will require re-contouring the inlet
geometry, i.e. enlarging the internal flow passage, while decreasing the overall size of the
supersonic inlet. For example, a supersonic inlet designed to have 10% performance bleed will
have a capture area sized for both the required engine weight flow and the 10% performance
bleed amount. Therefore, with no performance bleed, the capture area will be 10% smaller and
the overall nacelle drag will be reduced. In addition, micro-actuator flow control will also require
the internal passage to be enlarged approximately 10% to accommodate an average thicker inlet
boundary layer.
Generalized Micro-Actuator Array Design Guidelines
The optimal micro-actuator designs presented in Table 5 have been generalized by
normalizing the optimal micro-actuator height (h) and micro-actuator array streamwise location
(Xp) with respect to the boundary layer thickness at the shock wave impingement point (δshk). In
addition, the micro-actuator chord length (c) and lateral spacing distance (s) have been scaled to
the micro-actuator blade height (h). The results are presented in Table 9, and they represent
8
8
generalized design guidelines to be applied to supersonic inlet problems. However, the guidelines
presented in Table 9 showed not be used as “hard and fast” design rules, but rather as a centering
point in the design space of a DOE matrix for supersonic inlet flow control.
For example, consider the 4060 Mixed Compression Supersonic Inlet that was used as the
study vehicle by Fukuda, Hingst, and Reshotko(2)
to examine boundary layer bleed. In this inlet
example, micro-ramp devices could be used to manage the second shock wave boundary layer
interaction along the centerbody and the first shock wave boundary layer interaction along the
cowl, thereby eliminating the performance bleed system. At a free stream Mach number of 2.5,
the boundary layer thicknesses at these locations were nominally 0.187 and 0.125 inches
respectively; hence the recommended micro-ramp heights would be 0.075 and 0.050 inches at
these locations. These values were based on an optimal (h/δshk) ratio of 0.40. See Config. nvg431
in Table 9. Therefore, the 4060 Mixed Compression Mach 2.5 Supersonic Inlet, with a 18.63 inch
cowl (capture) diameter, would require 145 centerbody micro-ramps and 303 cowl micro-ramps
based on the optimal design values presented in Table 9. The number of require micro-ramps is
determined by the centerbody and cowl circumference at installation location and the optimal
transverse spacing ratio from Table 9. This would be the DOE design center point, and the factor
range could be 0.050 to 0.100 inches for the centerbody micro-ramp heights and 0.025 to 0.075
inches for the cowl micro-ramp heights. The entire DOE matrix is therefore established for a two
factor DOE design, since the optimal (c/h) ratio would be held constant at 7.2, and the optimal
lateral spacing ratio (s/h) would be held fixed at a value of 7.5. Hence, the optimal micro-ramp
actuator design could be experimental validated in as few as three tunnel runs for a “Main
Effects” design or as many as nine tunnel runs for a Central Composite Face-Centered (CCF)
design.
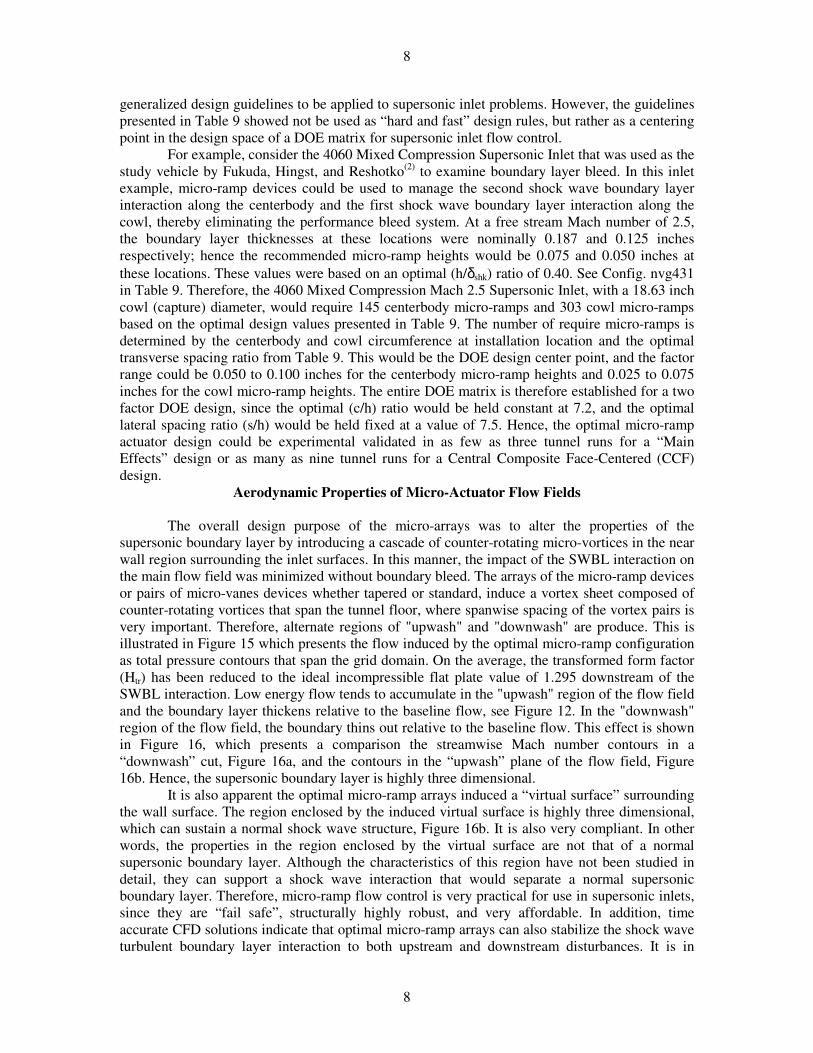
Aerodynamic Properties of Micro-Actuator Flow Fields
The overall design purpose of the micro-arrays was to alter the properties of the
supersonic boundary layer by introducing a cascade of counter-rotating micro-vortices in the near
wall region surrounding the inlet surfaces. In this manner, the impact of the SWBL interaction on
the main flow field was minimized without boundary bleed. The arrays of the micro-ramp devices
or pairs of micro-vanes devices whether tapered or standard, induce a vortex sheet composed of
counter-rotating vortices that span the tunnel floor, where spanwise spacing of the vortex pairs is
very important. Therefore, alternate regions of "upwash" and "downwash" are produce. This is
illustrated in Figure 15 which presents the flow induced by the optimal micro-ramp configuration
as total pressure contours that span the grid domain. On the average, the transformed form factor
(Htr) has been reduced to the ideal incompressible flat plate value of 1.295 downstream of the
SWBL interaction. Low energy flow tends to accumulate in the "upwash" region of the flow field
and the boundary layer thickens relative to the baseline flow, see Figure 12. In the "downwash"
region of the flow field, the boundary thins out relative to the baseline flow. This effect is shown
in Figure 16, which presents a comparison the streamwise Mach number contours in a
“downwash” cut, Figure 16a, and the contours in the “upwash” plane of the flow field, Figure
16b. Hence, the supersonic boundary layer is highly three dimensional.
It is also apparent the optimal micro-ramp arrays induced a “virtual surface” surrounding
the wall surface. The region enclosed by the induced virtual surface is highly three dimensional,
which can sustain a normal shock wave structure, Figure 16b. It is also very compliant. In other
words, the properties in the region enclosed by the virtual surface are not that of a normal
supersonic boundary layer. Although the characteristics of this region have not been studied in
detail, they can support a shock wave interaction that would separate a normal supersonic
boundary layer. Therefore, micro-ramp flow control is very practical for use in supersonic inlets,
since they are “fail safe”, structurally highly robust, and very affordable. In addition, time
accurate CFD solutions indicate that optimal micro-ramp arrays can also stabilize the shock wave
turbulent boundary layer interaction to both upstream and downstream disturbances. It is in

9
9
stabilizing the mixed compression supersonic inlet that micro-actuator devices will play it most
important role.
SUMARY OF RESULTS
To demonstrate the viability and economy of Response Surface Methodology (RSM) to
determine optimal designs of micro-array actuation for controlling the shock wave turbulent
boundary layer interactions, a study was initiated that considered three different micro-devices.
These devices included standard micro-vanes, tapered micro-vanes, and standard micro-ramps
arrays tested at a free stream Mach number of 2.0. The effectiveness of the three micro-array
devices was examined using a shock pressure rise induced by the 10o shock generator, which was
sufficiently strong as to separate the turbulent supersonic boundary layer. All the devices had
approximately the same reductions in Htr in the supersonic boundary layer downsteam of the
SWBL interaction as conventional inlet boundary layer bleed. They also exhibited important
behavioral differences from conventional inlet bleed that have major inlet design consequences.
The boundary layer displacement thickness downstream of the interaction was substantially larger
with micro-actuator flow control than with boundary layer bleed. The displacement thickness was
sufficiently larger as to require re-contouring the inlet geometry, i.e. enlarging the internal flow
passage, while decreasing the overall size of the supersonic inlet.
Optimal micro-ramp arrays alter the properties of the supersonic boundary layer by
introducing a cascade of counter-rotating micro-vortices in the near wall region surrounding the
tunnel surfaces.. They also induced a “virtual surface” surrounding the wall surface that was
highly three dimensional and which could sustain a normal shock wave structure. The properties
of the supersonic boundary layer were dramatically changed. These new characteristics can
support a shock wave interaction that would separate a normal supersonic boundary layer.
Therefore, micro-ramp flow control is very practical for use in supersonic inlets, since they are
“fail safe”, structurally highly robust, and very affordable.
REFERENCES
(1)
Tjonneland, E., “The Design, Development, and Testing of a Supersonic Transport Intake
System,” AGARD-CP-91-71, paper presented at the 38th meeting of the AGARD Propulsion and
Energetics Panel, Sandefjord, Norway, September 1971.
(2)
Fukuda, M. K, Hingst, W. G., and Reshotko, E., “Control of Shock Wave-Boundary Layer
Interactions by Bleed in Supersonic Mixed Compression Inlets,” NASA CR-2595, August, 1975
(3)
Syberg, J. and Konsek, J. L., “Bleed system design technology for supersonic inlets”, Jour. of
Aircraft, Vol. 10, No. 7.
(4)Box, G. E. P., Hunter, W. G., and Hunter, J. S., “Statistics for Experimenters,” John Wiley, New
York
(5)
NPARC Alliance, “The Wind-US Code”, http://www/grc.nasa/www/Wind-US_docs [cited 13
June 2004.
(6)
Bush, R. H., Power, G. D., and Towne, C. E., “Wind-US: The Production Flow Solver of the
NPRAC Alliance”, AIAA-1998-0935, Januar7y 1998.
(7)
Anderson, B. H., Tinapple, J., and Surber, L., “Optimal Micro-Array Actuation Control for
Shock Wave Boundary Layer Interactions in Supersonic Inlets”, Proposed NASA TM, 2006.

10
10
Figure (1): Schematic diagram showing the shock
generator and standard micro-ramp actuators
installed in the NASA/GRC 15 x 15 cm. Supersonic
Wind Tunnel.
Figure (2): Photograph showing the NASA/GRC
15 x 15 cm. Supersonic Wind Tunnel.
Figure (3): Schematic diagram showing tapered
micro-vane actuators.
Figure (4): Grid topology of tapered micro-vane
actuators.
Figure (5): Geometry and nomenclature for tapered
micro-vane actuactors.

11
11
Figure (6): Schematic diagram showing standard
micro-ramp actuators.
Figure (9): Schematic diagram showing standard
micro-vane actuators.
Figure (7): Grid topology of standard micro-ramp
actuators.
Figure (10): Grid topology of standard micro-vane
actuators.
Figure (8): Geometry and nomenclature for standard
micro-ramp actuactors.
Figure (11): Geometry and nomenclature for standard
micro-vane actuactors.
12
12
Table (1): Factor variables which establish DOE
design matrix.
Table (2): Variable held constant.
Table (4): Central Composite Face-Centered (CCF)
Design-of-Experiment (DOE) design matrix used in
the micro-actuator array study.
Table (3): DOE response variables.
Figure (12): Location of micro-actuator arrays relative
to the baseline shock wave boundary layer interaction,
M0 = 2.0, δδδδ = 10.0o.
Figure (13): Graphical representation of the Central
Composite Face-Centered (CCF) DOE design matrix
used in the micro-actuator array study.
13
13
Table (5): DOE validation test cases containing the nine (9)
optimal micro-actuator array designs.
Table (6): DOE prediction results for the nine (9) validation
test cases defined by the DOE matrix in Table (5).
Table (7): CFD analysis results for the nine (9) validation
test cases defined by the DOE matrix in Table (5).
Table (8): Paired t-test statistical evaluation between the
nine (9) optimal DOE prediction cases, Table (6), and the
nine (9) optimal CFD analysis cases, Table (7).
Figure (13): DP/P0 response surface containing the
optimal micro-actuactor array designs defined
by the DOE in Table (5).
Figure (13): Htr response surface containing the
optimal micro-actuactor array designs defined
by the DOE in Table (5).
14
14
Figure (14): Comparison between optimal micro-actuator
array Htr performance and optimal boundary layer bleed
Htr performance, (Ref. 2).
Table (9): General micro-actuator array design guidelines. Figure(16): Streamwise Mach number contours for
the optimal micro-ramp array, Config. nvg431.
Figure(15): Spanwise total pressure contours for
the optimal micro-ramp array, Config. nvg431.