optimal allele-sharing statistics for genetic … allele-sharing statistics for genetic mapping...
TRANSCRIPT

Genetic Epidemiology 16:225–249 (1999)
© 1999 Wiley-Liss, Inc.
Optimal Allele-Sharing Statistics forGenetic Mapping Using Affected Relatives
Mary Sara McPeek*
Department of Statistics, University of Chicago, Chicago, Illinois
The choice of allele-sharing statistics can have a great impact on the power ofrobust affected relative methods. Similarly, when allele-sharing statistics fromseveral pedigrees are combined, the weight applied to each pedigree’s statisticcan affect power. Here we describe the direct connection between the affectedrelative methods and traditional parametric linkage analysis, and we use thisconnection to give explicit formulae for the optimal sharing statistics and weights,applicable to all pedigree types. One surprising consequence is that under anysingle gene model, the value of the optimal allele-sharing statistic does not de-pend on whether observed sharing is between more closely or more distantlyrelated affected relatives. This result also holds for any multigene model withloci unlinked, additivity between loci, and all loci having small effect. For spe-cific classes of two-allele models, we give the most powerful statistics and opti-mal weights for arbitrary pedigrees. When the effect size is small, these alsoextend to multigene models with additivity between loci. We propose a usefulnew statistic, Srob dom, which performs well for dominant and additive modelswith varying phenocopy rates and varying predisposing allele frequency. We findthat the statistic S–#alleles, performs well for recessive models with varying pheno-copy rates and varying redisposing allele frequency. We also find that for modelswith large deviation from null sharing, the correspondence between allele-shar-ing statistics and the models for which they are optimal may also depend onwhich method is used to test for linkage. Genet. Epidemiol. 16:225–249, 1999.© 1999 Wiley-Liss, Inc.
Key words: complex traits; robust linkage analysis; relative pairs; affected pedigree member;discordant sib pairs
Contract grant sponsor: National Institutes of Health; Contract grant number: R29 HG01645-01; Con-tract grant sponsor: National Science Foundation; Contract grant number: DMS 89-05292.
*Correspondence to: Mary Sara McPeek, Department of Statistics, University of Chicago, 5734 S.University Ave., Chicago, IL 60637. E-mail: [email protected]
Received 16 September 1997; Revised 10 March 1998; Accepted 31 March 1998

226 McPeek
INTRODUCTION
Genetic mapping of a trait by linkage analysis involves finding regions of thegenome with a tendency to be shared identical by descent (IBD) by close relativesaffected with the trait and not shared between affected and unaffected relatives. Fullparametric linkage analysis entails specification of a model for inheritance of thetrait, with the location of the gene then estimated by the method of maximum likeli-hood. For a single-gene two-allele model, the full parametric model would includethe frequency, a, of the trait-causing allele, as well as penetrances f0, f1, f2, fornoncarriers, heterozygote carriers, and homozygote carriers, respectively. More com-plicated models might include (1) a single gene model with h alleles with frequen-cies a1, . . . , ah, respectively, and penetrance fij for an individual whose genotypeconsists of the ith and jth alleles or (2) multigene versions of the above models, inwhich loci are unlinked and effects are additive across loci. In cases when the pa-rameters of the model are not known, they are sometimes impossible to estimate,and the maximum likelihood analysis has been found to be very sensitive to modelmisspecification [Clerget-Darpoux et al., 1986]. Allele-sharing methods have beenproposed as a way to avoid these difficulties. This class of methods includes the sibpair method, originated by Penrose [1935] and developed by many others [e.g., Dayand Simons, 1976; Green and Woodrow, 1977; Fishman et al., 1978; Suarez, 1978;Hodge, 1984; Lange, 1986; Fimmers et al., 1989], the affected pedigree membermethod (APM) of Weeks and Lange [1988], which uses identity by state (IBS) infor-mation, work on affected relative pairs by Risch [1990], and general affected relativemethods that use IBD information [Whittemore and Halpern, 1994; Kruglyak et al.,1996; Whittemore, 1996; Kong and Cox, 1997]. These methods are clearly not model-free, but they are believed to be more robust than full parametric likelihood analysisin those cases when the model is not known.
We now describe the framework for these allele-sharing methods. For any ge-nome location x and any pedigree with n members and l founders, l < n, followingThompson [1974], we number the founders’ alleles 1 through 2 × l, and we define thegene-identity state g at each location x in the genome by g(x) = (p1, m1, p2, m2, . . . , pn,mn) where pi represents the founder allele inherited by individual i from his or herfather and mi that from his or her mother. We consider two gene-identity states to beequivalent if one can be obtained from the other by simply permuting the allelelabels. The resulting equivalence classes of gene-identity states are called IBD con-figurations and denoted by c. We consider an allele-sharing statistic (S(c,Φ) to be afunction of the allele configuration c and the phenotype information Φ in the pedi-gree (more generally, S might depend on g rather than c).
Allele-sharing methods generally consider sharing among affecteds only, andwith the exception of a brief discussion of discordant sib pairs, we limit this study tostatistics S depending on affecteds only. Note that in principle, S may use informa-tion on sharing with unaffecteds as well. For instance, full parametric linkage analy-sis may be seen as the case where S is chosen to be the likelihood ratio [Kruglyak etal., 1996], which of course depends on the genotype information on both affectedsand unaffecteds. The three rationales for considering affecteds only are, first, thatthis effectively eliminates one penetrance parameter from the model, leading to greaterrobustness when the model is unknown. (When only affecteds are considered, the

Optimal Allele-Sharing Statistics 227
two-allele model can be parametrized by the frequency a of the predisposing alleleand the relative risks f2/f0 and f1/f0). Second, affecteds contribute most of the infor-mation to the study, and elimination of unaffecteds from consideration does not usu-ally cause a severe loss of power. Third, for many complex diseases or traits, someindividuals classified as unaffected may simply not yet have developed the diseaseor trait. For instance, Alzheimer’s disease, many cancers, and many phenotypes re-lated to heart disease tend to have a late age of onset. Thus, in some cases, thedesignation of an individual as “unaffected” may be much more uncertain than thedesignation of an individual as “affected.” Note that although S depends only onaffecteds, genotype information on unaffecteds may be used for inferring IBD infor-mation on affecteds.
We concentrate on allele-sharing methods based on IBD rather than IBS shar-ing, as the former are more powerful [Kruglyak et al., 1996; Sobel and Lange, 1996].In practice, of course, full IBD information is not available, but instead, the condi-tional distribution of the allele configuration c(x) at any given location x, conditionalon the marker data, may be computed. For instance, the software packageGENEHUNTER of Kruglyak et al. [1996] can compute, for small to moderate-sizepedigrees, the conditional distribution of what they call the inheritance vector, whichis equivalent to the allele configuration, at a location x, given the multipoint markerinformation for all pedigree members. In that case, instead of considering S(c(x),Φ),one could consider, e.g., its null expectation conditional on the multipoint markerinformation, S
–(x,Φ) = Sw0C S(w,Φ)PO[c(x) = w|data], where PO[c(x) = w|data] is cal-
culated under the null hypothesis of no gene for the trait linked to that location.Under the null hypothesis of no gene for the trait linked to location x, the distri-
bution of an allele-sharing statistic S is in principle known. The hope is that S willshow significant deviation from its null distribution when there is a gene at thatlocation affecting the trait. Proposed tests for detecting this deviation are describedbelow. Not surprisingly, the power to detect linkage using any particular statistic Scan vary greatly depending on the underlying genetic model for the trait. For in-stance, Figure 1a and b depicts the power to detect dominant alternatives with vari-ous phenocopy rates and penetrances using 30 affected trios consisting of sib pairseach with affected parent, while Figure 1e and f shows the power to detect recessivealternatives under the same conditions. Four different allele-sharing statistics are com-pared (definitions given in Definitions of Allele-Sharing Statistics). Note that thosethat perform best in the dominant case perform worst in the recessive case and viceversa, although the statistics perform similarly in the dominant and additive cases, asshown by a comparison of Figure 1a–d. In this paper, we investigate the relationshipbetween allele-sharing statistics and two-allele models, with extension to special casesof multiple unlinked genes.
PRIOR WORK ON CHOICE OF SHARING STATISTIC
For the special case of sib pairs, there are several relevant studies. Schaid andNick [1990, 1991] Knapp [1991] derived an expression for the optimal sib pairsallele-sharing statistic in terms of the probabilities of sharing 0, 1, or 2 alleles underan alternative model. Knapp et al. [1994] pointed out that for affected sib pairs,using the first method for testing linkage described below in Methods for Testing

228 McPeek
Linkage, S equal to the number of shared alleles (equivalent to Spairs defined below)is optimal for the recessive model with full penetrance and no phenocopies, f2 = 1, f1
= f0 = 0. However, they did not discuss the fact that it is optimal for many othermodels as well, nor that it is no longer optimal for the recessive case if there arephenocopies, as shown in Feingold and Siegmund [1997]. These results are verifiedas special cases of our results below, and we give a more exhaustive list of situationsin which Spairs is optimal. Feingold and Siegmund [1997] include an investigation ofthe power of sharing statistics for sib pairs with an emphasis on recessive and par-tially recessive models. For this, they use a Gaussian approximation, which is equiva-lent to assuming small effect size, and assume multiple unlinked genes actingadditively between, but not necessarily within, loci.
Kruglyak et al. [1996] performed simulations comparing the power of two sta-tistics, Spairs and Sall, defined below, for a scheme where the particular pedigree wasrandomly determined and allowed to vary across realizations, and the method usedto test linkage was the first method described below. Their results indicated that Sall
performed much better than Spairs in the dominant case and for the two complexmodels they consider, and that the two statistics performed equally well in the reces-sive case.
As to the choice of the weighting factors γi, Kruglyak et al. [1996] suggestequal weights (but note that they are first dividing each pedigree’s statistic by its nullstandard deviation). Sobel and Lange [1996] suggest summing the statistics theyconsider, without normalizing by the standard deviation. In the case of Spairs, theysuggest using weight √2/[n(n – 1)], where n is the number of affecteds in the pedi-gree, to downweight large pedigrees. In both studies, the authors imply that thesechoices are ad hoc.
Teng and Seigmund [1997] consider both choices of sharing statistic and ofweights. For relative pairs, they restrict consideration to the case of additivity withinand between loci, with large-sample asymptotics, i.e., small effect size, assumed tohold. They consider a few special cases of multiple affected relatives and make theadditional assumption of a two-allele model at each locus in those cases. A statisticthat they find to work well can be generalized to the statistic Severyone considered here.We note that while this statistic may work well for the large-sample asymptoticswith the particular small pedigrees considered in Teng and Siegmund [1997], if oneinstead uses smaller samples with larger pedigrees, Severyone is very sensitive togenotyping errors and loses most of its power in the presence of phenocopies or withsegregation of multiple copies of the predisposing allele within a pedigree. WhileTeng and Siegmund [1997] consider each special case of pedigree type separately,we are instead able to describe general optimal statistics with explicit algorithms forcomputing them in any pedigree.
METHODS FOR TESTING LINKAGE
1. Ztot [Kruglyak et al., 1996]. Given a sharing statistic S, a pedigree, and agenome location x, consider the normalized version of S, Z(c(x),Φ) = (S(c(x,Φ)– mo)/so, where µo is the expected value of S and σo the standard deviation ofS under the null hypothesis of no gene for the trait linked to that location. Inthe case of incomplete IBD data on location x, let Z
–(x,Φ) = S
–(x,Φ) – mo)/so.

Optimal Allele-Sharing Statistics 229
(With complete IBD data on x, Z–(x,Φ) = Z(c(x),Φ).) Note that σo is the null
standard deviation of Z, which will tend to be larger than the null standarddeviation of Z
–. Thus, inference based on Z
– can be overly conservative [Kong
and Cox, 1997]. Consider p pedigrees, with Z– for the ith pedigree denoted
by Z–
i. To combine the Z–
i’s for different pedigrees into an overall Z–tot, choose
appropriate weight γi for the ith pedigree, with Σpi=1 γ 2
i = 1, and let Z–tot = Σp
i=1
γ i Z–
i. Kruglyak et al. [1996] propose using equal weights for all pedigrees, γi
= 1/√p for all i, and they suggest comparing Z–tot to a standard normal distri-
bution or computing an exact P value for Z–tot in order to test linkage. Both
methods are implemented in their GENEHUNTER package.2. LR lin Whittemore [1996] showed that in the complete data case, the test
statistic Ztot = Σ pi=1giZi is the efficient score statistic corresponding to the
likelihood
(*) ( ( ), [ ( ( ), )( )]
( ( ), ) ( ).
L c x L c x Z
L c x Z
A ip
o i i i i
o ip
i i
lin Φ Π Φ
Φ Π
= +
= × +
=
=
1
1
1
1
δγ
δγ
Here LA denotes the likelihood under an alternative model involving a gene atthe given location contributing to the trait. The superscript lin, for “linear,” de-notes the particular class of alternative models given by (*), LO denotes the like-lihood under the null hypothesis that no predisposing gene is linked to the givenlocation, ci(x) is the allele-sharing configuration for the affecteds in the ith pedi-gree, c(x) is the configuration for all the pedigrees together, and Φi and Φ are theaffection status information for the ith pedigree and all pedigrees combined, re-spectively. This model is not biologically based, but is a convenient mathemati-cal representation of the deviation from null sharing. The parameter δ measuresthe magnitude of deviation of the alternative likelihood from the null likelihoodin the direction specified by the γiZi’s, and δ must be estimated. Among otherthings, Ztot being the efficient score statistic corresponding to the given likeli-hood implies that the test based on Ztot is asymptotically equivalent to the testbased on the maximized log-likelihood ratio for the given likelihood (let log(L^Rlin)denote this maximized log-likelihood ratio). Furthermore, the framework of maxi-mum likelihood estimation provides for computation of lod scores and creationof confidence intervals for the true gene location.
3. LR exp Kong and Cox [1997] have suggested a different likelihood,
(**) ( ( ), [ ( ( ), ) / ( )]
( ( ), ) /
L c x L c x e E e
L c x Z E Z
A ip
o i iZ
oZ
o i ii
p
o i ii
p
i i i iexp
exp exp
Φ Π Φ
Φ
=
= ���
���
���
���
�!
"$##
=
= =∑ ∑
1
1 1
δγ δγ
δγ δγ
(where EO denotes expected value under the null hypothesis), which also hasZtot as efficient score statistic, and is another mathematically convenient rep-resentation of the deviation from null sharing. The likelihood Lexp
A where exp

230 McPeek
is for “exponential,” has an advantage over the likelihood LlinA in that for the
latter, δ is restricted to the range (–1/(γZ)max, –1/(γZ)min), where (γ Z)max and(γ Z)min are the largest and smallest possible values, respectively, of γiZi, i =1, . . . , p. Thus, for models with large deviation from null sharing, powermay be lost using log (LR^ lin) when the sharing statistic S used is not close tothe optimal and hence the parameter δ maximizes on the boundary. There areno such restrictions on δ in Lexp
A . We note that in the case of complete data,the statistic log (LR^ exp) (the maximized log-likelihood ratio under likelihoodLexp
A ) is just a monotone transformation of Ztot, so the two methods give iden-tical tests for linkage if exact P values are used. This is not the case, how-ever, for the linear model, nor for either model with incomplete data, nor ifapproximate P values are used.
GUIDING PRINCIPLES FOR THE OPTIMAL CHOICE OF S AND THE gi’S
By drawing a connection between the test statistics described above and thelikelihood ratio for the affecteds under a parametric model, we can derive completelygeneral, exact formulae for the optimal S and γi’s. For the test based on log(LR
^ lin),the S and γi’s given below are asymptotically most powerful against the alternative,while for the tests based on log(LR^ exp) and Ztot, the S and γi’s given below are mostpowerful for any sample size.
A consequence of the work of Whittemore [1996] is that for a test based onlog(LR^ lin), the asymptotically optimal S is S = LA(c(x),Φ)/LO(c(x),Φ) – 1, whereLA(c(x),Φ) is the likelihood under the true alternative sharing distribution, as op-posed to the mathematically convenient alternative likelihoods Llin
A and LexpA . S is
optimal in the sense that for a given pedigree, the choice of parameter δ =√Σp
j=1σ20j in likelihood Llin
A corresponds to the true alternative likelihood LA. Inthat case, the likelihood ratio in the allele-sharing framework would equal thetrue likelihood ratio for the affecteds in the full parametric framework, givinggreatest power to detect the alternative. Since the parameter δ is estimated, the equiva-lence of the allele-sharing and parametric likelihoods, with S chosen as above, isasymptotic. (Note that S = b(LA/LO – 1) + d would serve just as well, where b and dare any constants.) To combine pedigrees in this situation, we find that the asymp-totically optimal weights are γi = σoi / √Σp
j=1σ20j , where σoi is the standard deviation of
S = LA/LO – 1 in pedigree i under the null hypothesis. These are asymptotically opti-mal weights in the sense that when S and the γi’s are so chosen, then the case δ =√Σp
j=1σ20j in likelihood Llin
A corresponds to the true alternative likelihood LA. Thus,
the likelihood ratio in the allele-sharing framework, with multiple pedigrees com-bined in this way, would equal the true likelihood ratio for the affecteds in the fullparametric framework.
For log(LR^ exp) and for the efficient score statistic Ztot, the optimal choice of S is
instead S = log(LA/LO) (here again, b log(LA/LO) + d would serve just as well), whilethe corresponding choices of γi’s are the same as above, except that the null standarddeviations are now for the new choice of S = log(LA/LO). In the case of completedata, these are non-asymptotic results. Although the non-asymptotic optimality ofthese S and γi’s is not surprising for Ztot, it is somewhat surprising that such a non-

Optimal Allele-Sharing Statistics 231
asymptotic result would hold in the case of log(LR^ exp), since the parameter δ is esti-
mated. In fact, when S and the γi’s are so chosen, log(LR^ exp) is a monotone transfor-mation of the true likelihood ratio for any sample size, even though the parameter δis estimated by maximizing the likelihood. In the case of incomplete data, the resultfor log(LR^ exp) would be asymptotic, as above for the case of log(LR^ lin). Note thatwhen the optimal S is used and pedigrees are combined, the optimal weight γi = σoi /√Σp
j=1σ20j is equivalent to combining pedigrees on the unnormalized S scale, rather
than on the normalized Z scale as was done in Kruglyak et al. [1996], i.e., Ztot shouldbe a normalized version of Σi Si rather than a normalized version of Σi Zi as in Kruglyaket al. [1996].
Although the log(LR^ lin) has a different optimal choice of S from the other twotest statistics, these two optimal choices of S, LA/LO – 1 and log(LA/LO), are approxi-mately equal for alternative models with small deviation from null sharing. How-ever, for alternative models with large deviation from null sharing, these statisticsmay be quite different.
To choose the γi’s when the S used is not the optimal S, we note that EA(Ztot) is
maximized when γi is taken equal to EA(Zi )/√Σpj=1EA(Zj). This coincides with the choice
of γi given above when the optimal S is used. For alternative models with smalldeviation from null sharing, when the S used is not the optimal S, the same choice ofγi ∝ EA(Zi) also approximately maximizes EA(log(LR^ lin)) and EA(log(LR^ exp)).
The principles given above, which connect allele-sharing statistics with para-metric likelihoods, can be applied to any specific disease model to determine theoptimal S. The resulting S will be applicable to every pedigree type, not just specialcases. Similarly, the principles can be applied in reverse to determine for which dis-ease models a particular S is optimal. As described in Methods for Testing Linkage,Whittemore [1996] and Kong and Cox [1997] have shown the equivalence of theallele-sharing methods to likelihood-based methods using a sharing statistic and amodel misfit parameter. Combining this with our results on optimal statistics, we canview allele sharing methods as equivalent to picking a particular parametric diseasegene model and then introducing a parameter δ to absorb model misfit. A methodwill perform well when the model chosen is close to the true model, but may per-form very poorly if it is far from the true model, as illustrated in Figure 1.
EXCHANGEABILITY OF RELATIVES IN OPTIMAL S
All of the sharing statistics discussed below treat relatives exchangeably. Bythis we mean that if the genotypes of some affected individuals were permuted amongthem, with the two alleles of each individual’s genotype treated as a unit, neverseparated, then, assuming that a biologically possible IBD configuration resulted,the values of the allele-sharing statistics would not be changed. For instance, con-sider the case of an affected sib pair with an affected first cousin, with the possibleIBD configurations shown in Table I, where the allele labels are arbitrary. In con-figuration c2, one sib shares an allele with the cousin, and in c3, the sibs share oneallele. Intuitively, one might think that since sharing of one allele between a sib andcousin is more unusual than sharing of one allele between the sibs, the former shouldreceive more weight in an evaluation of linkage under many genetic models of inter-

Fig. 1. a: Sib pair plus parent: power of various sharing statistics S against a dominant alternativewith varying predisposing allele frequency and no phenocopies. b: Sib pair plus parent: power ofvarious sharing statistics S against a dominant alternative with varying phenocopy rate and predispos-ing allele frequency .02. c: Sib pair plus parent: power of various sharing statistics S against an addi-tive alternative with varying predisposing allele frequency and no phenocopies. d: Sib pair plus parent:power of various sharing statistics S against an additive alternative with varying phenocopy rate and

predisposing allele frequency .02. e: Sib pair plus parent: power of various sharing statistics S againsta recessive alternative with varying predisposing allele frequency and no phenocopies. f: Sib pair plusparent: power of various sharing statistics S against a recessive alternative with varying phenocopyrate and predisposing allele frequency .02. In a–f, sample size = 30, power is computed at a single pointassumed to have no recombination with the gene, significance level = 2 × 10⁻⁵, and exact P values arecomputed using Ztot or equivalently log(LR
^ exp).

234 McPeek
Figure 1e and f. (continued).

Optimal Allele-Sharing Statistics 235
est, e.g., when the risk to relatives of a proband is high, and perhaps less weightwhen this risk is low. However, all of the allele-sharing statistics S considered heredepend only on the collection of genotypes and not on which relative has whichgenotype, i.e., not on whether the observed sharing is between close or distant rela-tives (although calculation of the null mean and variance, µo and σ2
o, does use therelationship information). One might think that it would be very important to takeinto account the closeness of the relatives who share among the affecteds, and onemight see the failure to do this as a flaw in the proposed allele-sharing statistics S.Surprisingly, we can show that under rather general conditions, relatives actuallyshould be treated in this exchangeable way. This result follows from the fact that theoptimal S is some function of the likelihood ratio, here either LA/LO – 1 or log(LALO)(see Appendix A for proof).
Note that the exchangeability result does not contradict the results of Risch[1990] and Feingold et al. [1993] that affected first-cousin pairs are more powerfulfor detecting linkage than affected sib pairs (assuming a single-gene model with fullIBD information and at least a moderately large relative risk to offspring of affecteds).Here, the configuration c2 contains more information than just sharing between firstcousins. It also contains an affected sib pair that shares no alleles at the given loca-tion. Thus, it is weaker evidence for linkage than the observation of sharing betweenaffected first cousins.
Conditions under which the optimal S should treat relatives exchangeably in-clude models in which a single gene affecting the trait has h alleles with frequenciesa1, ..., ah and penetrance fij for an individual with genotype (i,j), and also multigenemodels where the genes are unlinked and multiallelic, with additivity between butnot necessarily within loci, and with small effect size. The result does not depend onthe values of h, the ai’s, the fijs, nor on the type of pedigree. For all of the models inthis class, PA(Φ|c(x)) = PA(Φ|c´(x)) where c (́x) is obtained from c(x) by any permu-tation of the genotypes of the individuals, with the two alleles of each genotypetreated as a unit, never separated. The models under which the result would not holdwould be those under which PA(Φ|c(x)) ≠ PA (Φ|c´(x)). Multigene models outside theclass described above, and environmental effects on penetrance that could be ex-pected to be more similar for close relatives than for more distant relatives, couldcause such dependence. In the case of an affected sib pair with affected firstcousin, these complications could cause the optimal sharing statistic to give moreweight either to c3 (sib-sib sharing) or to c2 (sib-cousin sharing), depending onthe specific model.
TABLE I. Example 1: Outbred Sib Pair and First Cousin
Configuration Null(sib, sib, cousin) prob. Spairs – m0 Sall – m0 S–#alleles – m0 Severyone–m0 S–#geno – m0 Sfewest – m0
c1 1 2 3 4 5 6 .125 –1.5 –.41 –1.375 –.125 –.25 –.0625c2 1 2 3 4 1 5 .125 –.5 –.16 –.375 –.125 –.25 –.0625c3 1 2 1 3 4 5 .3125 –.5 –.16 –.375 –.125 –.25 –.0625c4 1 2 1 3 2 4 .125 .5 .09 .625 –.125 –.25 –.0625c5 1 2 1 2 3 4 .1875 .5 .09 .625 –.125 .75 –.0625c6 1 2 1 3 1 4 .0625 1.5 .59 .625 .875 –.25 –.0625c7 1 2 1 2 2 3 .0625 2.5 .84 1.625 .875 .75 .9375
236 McPeek
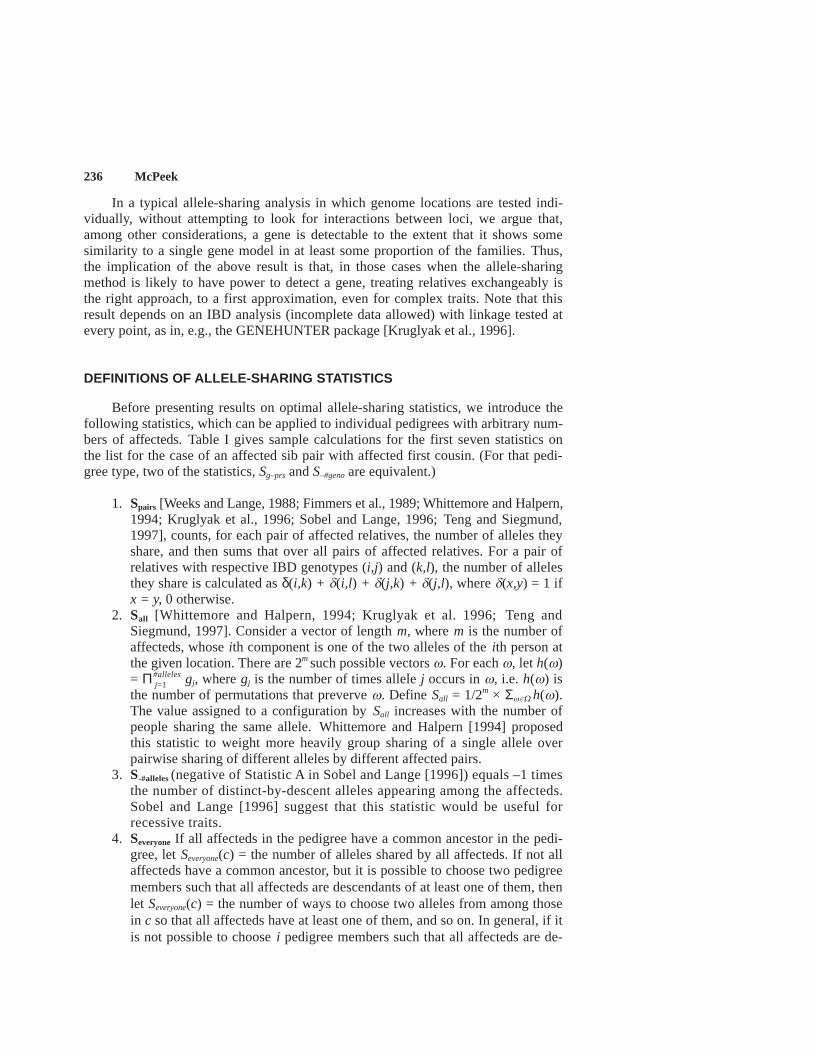
In a typical allele-sharing analysis in which genome locations are tested indi-vidually, without attempting to look for interactions between loci, we argue that,among other considerations, a gene is detectable to the extent that it shows somesimilarity to a single gene model in at least some proportion of the families. Thus,the implication of the above result is that, in those cases when the allele-sharingmethod is likely to have power to detect a gene, treating relatives exchangeably isthe right approach, to a first approximation, even for complex traits. Note that thisresult depends on an IBD analysis (incomplete data allowed) with linkage tested atevery point, as in, e.g., the GENEHUNTER package [Kruglyak et al., 1996].
DEFINITIONS OF ALLELE-SHARING STATISTICS
Before presenting results on optimal allele-sharing statistics, we introduce thefollowing statistics, which can be applied to individual pedigrees with arbitrary num-bers of affecteds. Table I gives sample calculations for the first seven statistics onthe list for the case of an affected sib pair with affected first cousin. (For that pedi-gree type, two of the statistics, Sg–prs and S–#geno are equivalent.)
1. Spairs [Weeks and Lange, 1988; Fimmers et al., 1989; Whittemore and Halpern,1994; Kruglyak et al., 1996; Sobel and Lange, 1996; Teng and Siegmund,1997], counts, for each pair of affected relatives, the number of alleles theyshare, and then sums that over all pairs of affected relatives. For a pair ofrelatives with respective IBD genotypes (i,j) and (k,l), the number of allelesthey share is calculated as δ(i,k) + d(i,l) + d(j,k) + d(j,l), where d(x,y) = 1 ifx = y, 0 otherwise.
2. Sall [Whittemore and Halpern, 1994; Kruglyak et al. 1996; Teng andSiegmund, 1997]. Consider a vector of length m, where m is the number ofaffecteds, whose ith component is one of the two alleles of the ith person atthe given location. There are 2m such possible vectors w. For each w, let h(w)= Π#alleles gj, where gj is the number of times allele j occurs in w, i.e. h(w) isthe number of permutations that preverve w. Define Sall = 1/2m × Σw0W h(w).The value assigned to a configuration by Sall increases with the number ofpeople sharing the same allele. Whittemore and Halpern [1994] proposedthis statistic to weight more heavily group sharing of a single allele overpairwise sharing of different alleles by different affected pairs.
3. S-#alleles (negative of Statistic A in Sobel and Lange [1996]) equals –1 times
the number of distinct-by-descent alleles appearing among the affecteds.Sobel and Lange [1996] suggest that this statistic would be useful forrecessive traits.
4. Severyone If all affecteds in the pedigree have a common ancestor in the pedi-gree, let Severyone(c) = the number of alleles shared by all affecteds. If not allaffecteds have a common ancestor, but it is possible to choose two pedigreemembers such that all affecteds are descendants of at least one of them, thenlet Severyone(c) = the number of ways to choose two alleles from among thosein c so that all affecteds have at least one of them, and so on. In general, if itis not possible to choose i pedigree members such that all affecteds are de-
j=1

Optimal Allele-Sharing Statistics 237
scendants of at least one of them, but it is possible to choose i + 1 such, thenlet Severyone(c) = the number of ways to choose i + 1 alleles from among thosein c so that all affecteds have at least one of them. In certain special cases,Teng and Siegmund [1997] have proposed statistics that are equivalent toSeveryone, but they have not proposed a general definition, such as the onegiven here, that would be applicable to all types of pedigrees of affectedrelatives.
5. S-#geno counts –1 for each distinct genotype appearing in the observed IBDconfiguration of affecteds in a pedigree.
6. Sg-prs counts the number of pairs of affecteds in a pedigree who have thesame genotype.
7. Sfewest equals one if the observed IBD configuration of affecteds in a pedi-gree contains the fewest possible distinct-by-descent alleles for that pedigreetype, and it equals zero otherwise.
8. S#al triples equals the number of ways to choose three alleles i, j, k from the setof those appearing among the affecteds in a pedigree so that (i,j), (i,k), and(j,k) each appear as genotypes of at least one affected.
9. S#aff HBD (for inbred pedigrees) is the number of affected individuals who arehomozygous by descent (HBD) at the given locus. Let S-#aff HBD = –S#aff HBD.
10. S-#al HBD (for inbred pedigrees) equals –1 times the number of distinct-by-descent alleles that occur at least once in HBD form among the affecteds ina pedigree.
11.Srob dom = Σi0A(7c1(i)
– 1), where A is the set of all alleles observed for theparticular locus among the affecteds in the pedigree, and c1(i) is equal to thenumber of affecteds in the pedigree with at least one copy of allele i.
OPTIMAL S’S FOR ALL PEDIGREE TYPES
The principles given above for choice of S and γi, giving the direct connectionwith the parametric likelihood, are completely general and could be applied to anyspecific case. What is somewhat remarkable is that for many cases of interest, theresulting S can be given in a very simple form that is applicable to all pedigree types.Following are some examples. Proofs are given in Appendix B. We assume for con-venience that the penetrances satisfy f0 ≤ f1 ≤ f2.
Rare Dominant With Phenocopies
If a dominant model is assumed with predisposing allele frequency α → 0 (i.e.,each allele is introduced no more than once into a pedigree), and with phenocopyrate f0 satisfying f1 > f0 > 0, then let r = f1/f0 be the relative risk of having the traitwith and without the predisposing allele. Then the optimal allele-sharing statistic forany pedigree in this case is
S rc i
i A
= −∈∑ ( ),( )1 1
where A is the set of all alleles observed for the particular locus among the affectedsin the pedigree, and c1(i) is equal to the number of affecteds in the pedigree with at
238 McPeek
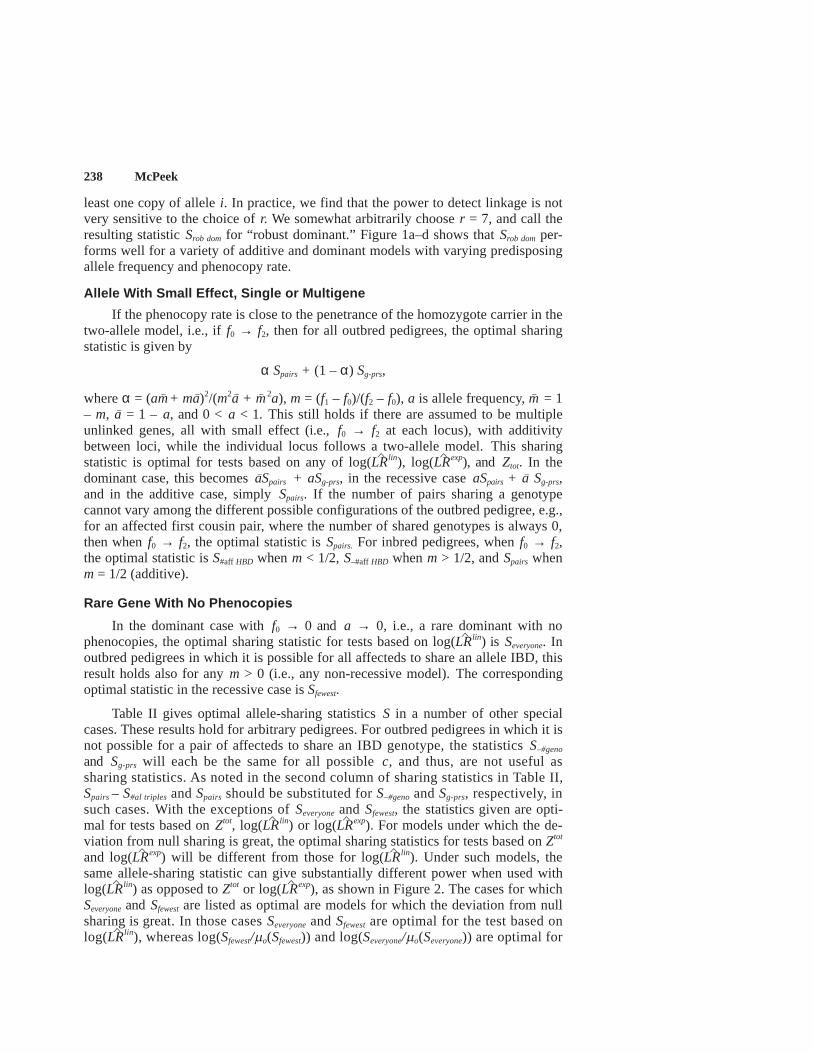
least one copy of allele i. In practice, we find that the power to detect linkage is notvery sensitive to the choice of r. We somewhat arbitrarily choose r = 7, and call theresulting statistic Srob dom for “robust dominant.” Figure 1a–d shows that Srob dom per-forms well for a variety of additive and dominant models with varying predisposingallele frequency and phenocopy rate.
Allele With Small Effect, Single or Multigene
If the phenocopy rate is close to the penetrance of the homozygote carrier in thetwo-allele model, i.e., if f0 → f2, then for all outbred pedigrees, the optimal sharingstatistic is given by
α Spairs + (1 – α) Sg-prs,
where α = (am– + ma–)2/(m2a– + m– 2a), m = (f1 – f0)/(f2 – f0), a is allele frequency, m– = 1– m, a– = 1 – a, and 0 < a < 1. This still holds if there are assumed to be multipleunlinked genes, all with small effect (i.e., f0 → f2 at each locus), with additivitybetween loci, while the individual locus follows a two-allele model. This sharingstatistic is optimal for tests based on any of log(LR^ lin), log(LR^ exp), and Ztot. In thedominant case, this becomes a–Spairs + aSg-prs, in the recessive case aSpairs + a– Sg-prs,and in the additive case, simply Spairs. If the number of pairs sharing a genotypecannot vary among the different possible configurations of the outbred pedigree, e.g.,for an affected first cousin pair, where the number of shared genotypes is always 0,then when f0 → f2, the optimal statistic is Spairs. For inbred pedigrees, when f0 → f2,the optimal statistic is S#aff HBD when m < 1/2, S–#aff HBD when m > 1/2, and Spairs whenm = 1/2 (additive).
Rare Gene With No Phenocopies
In the dominant case with f0 → 0 and a → 0, i.e., a rare dominant with nophenocopies, the optimal sharing statistic for tests based on log(LR^ lin) is Severyone. Inoutbred pedigrees in which it is possible for all affecteds to share an allele IBD, thisresult holds also for any m > 0 (i.e., any non-recessive model). The correspondingoptimal statistic in the recessive case is Sfewest.
Table II gives optimal allele-sharing statistics S in a number of other specialcases. These results hold for arbitrary pedigrees. For outbred pedigrees in which it isnot possible for a pair of affecteds to share an IBD genotype, the statistics S–#geno
and Sg-prs will each be the same for all possible c, and thus, are not useful assharing statistics. As noted in the second column of sharing statistics in Table II,Spairs – S#al triples and Spairs should be substituted for S–#geno and Sg-prs, respectively, insuch cases. With the exceptions of Severyone and Sfewest, the statistics given are opti-mal for tests based on Ztot, log(LR
^ lin) or log(LR^ exp). For models under which the de-
viation from null sharing is great, the optimal sharing statistics for tests based on Ztot
and log(LR^ exp) will be different from those for log(LR^ lin). Under such models, thesame allele-sharing statistic can give substantially different power when used withlog(LR^ lin) as opposed to Ztot or log(LR^ exp), as shown in Figure 2. The cases for whichSeveryone and Sfewest are listed as optimal are models for which the deviation from nullsharing is great. In those cases Severyone and Sfewest are optimal for the test based onlog(LR^ lin), whereas log(Sfewest/mo(Sfewest)) and log(Severyone/mo(Severyone)) are optimal for

Optimal Allele-Sharing Statistics 239
tests based on Ztot or log(LR^ exp). Note that in these two cases, log(S/mo(S)) takeson the value –∞ with positive probability under the null hypothesis, correspond-ing to the fact that some allele-sharing configurations possible under the nullhypothesis are impossible when a → 0 and f0 → 0. The statistics Sfewest and Severyone
would obviously not be very robust to genotyping errors or other slight devia-tions from the model.
When choosing the weight γi to assign to the normalized optimal sharing statis-tic Zi from the ith pedigree using a model given above or in Table II, it is importantto make the distinction between pedigrees that have the same optimal S for thatmodel and those that do not. For instance, under model 2 in Table II, an inbred andan outbred pedigree do not have the same optimal S, while under model 6 they do.When the optimal statistic S is used and the same statistic is optimal for all pedigreesto be combined, then except for Severyone and Sfewest, the optimal weight γi for the nor-malized statistic Zi from the ith pedigree is γi = σoi(S). This is so because in thesecases, for the given S, both LA(ci)/LO(ci) – 1 and log(LA/LO) are proportional to S –moi(S), with the constant of proportionality not depending on i. When Severyone or Sfewest
is optimal and is used, taking γi equal to σoi(S)/moi(S) is optimal for tests based onlog(LR^ lin), because LA(ci)/LO(ci) = S/moi(S) in these cases. (For tests based on log(LR^ exp)and on Ztot in this case, sharing statistic log(S/mo(S)), where S = Severyone or Sfewest,respectively, is optimal. Here, µoi(log(S/mo(S)) = ∞, so the statistic would not be nor-malized, nor would it be weighted when combined with other pedigrees. As notedbefore, this last statistic is entirely non-robust to deviations from the model.)
When the optimal statistic S is used for each pedigree and different pedigreeshave different optimal S’s, then care must be taken when combining the statisticsfrom these pedigrees. For instance, inbred and outbred pedigrees have different opti-mal sharing statistics under models 2, 3, 4, 7, and 8 of Table II, and outbred pedi-grees that can have variation in Sg-prs and S–#geno and those that cannot have differentoptimal sharing statistics under models 2, 4, and 7. In model 2, for example, log(LA/LO) and LA/LO – 1 are both equal to (S–#geno – mo(S–#geno)) (1 – a)2 + o(1 – a)2 foroutbred pedigrees for which S–#geno can take on different values. They are both equal
TABLE II. Optimal Sharing Statistics in Special Cases
Outbred pedigree Outbred pedigree InbredModel (S–#geno, Sg-prs can vary) (S–#geno, Sg-prs cannot vary) pedigree
1. Dominant, f0 ® 0, a ® 0 Severyone Severyone Severyone
2. Dominant, f0 ® 0, a ® 1 S–#geno Spairs – S#al triples S–#al HBD
3. Dominant, a ® 0, f0 ® f2, Spairs Spairs S–#aff HBD
single or multigene4. Dominant, f0 ® f2, a ® 1, Sg-prs Spairs S–#aff HBD
single or multigene5. Recessive, f0 ® 0, a ® 0 Sfewest Sfewest Sfewest
6. Recessive, f0 ® 0, a ® 1 S–#alleles S–#alleles S–#alleles
7. Recessive, f0 ® f2, a ® 0, Sg-prs Spairs S#aff HBD
single or multigene8. Recessive, f0 ® f2, a ® 1, Spairs Spairs S#aff HBD
single or multigene9. Additive, f0 ® f2, Spairs Spairs Spairs
single or multigene

240 McPeek
Fig. 2. a: Sib quartet: power of Sall against a recessive alternative using different testing methods. b: Sibquartet: power of .85 × Sfewest + .15 × S–#alleles against a recessive alternative using different testing methods.In both a and b, sample size = 20, phenocopy rate = 0, power is computed at a single point assumed to haveno recombination with the gene, significance level = 2 × 10⁻⁵, exact P values computed.

Optimal Allele-Sharing Statistics 241
to (Spairs – S#al triples – µo(Spairs – S#al triples)) (1 – a)3 + o(1 – a)3 for outbred pedigrees forwhich S–#geno cannot vary, and they are both equal to (S–#al HBD – mo(S–#al HBD)) (1 – a) +o(1 – a) for inbred pedigrees, where mo(S) is the expected value of S under the nullhypothesis for a particular pedigree (this information on the likelihood ratio is givenin Appendix B for all models discussed). Thus, in this case, outbred pedigrees havenegligible value relative to inbred pedigrees, and outbred pedigrees for which S–#geno
cannot vary have negligible value relative to those for which it can. This is true forall models described here for which the optimal statistics are different for these twopedigree types. This is also the result if, e.g., a collection of inbred and outbredpedigrees is regarded as a single (inbred) pedigree and the optimal statistics are ap-plied: the outbred part of the pedigree does not contribute to the sharing statisticunder models 2, 3, 4, 7, and 8.
Note that the optimal weight assigned to a pedigree type can vary greatly withthe model. Figure 3 gives the optimal weight for an affected sib quartet relative to anaffected sib pair, assuming that the optimal S is used, under dominant and recessivemodels with varying allele frequency and relative risk f2/f0 = 10. In addition, forsome models in which the predisposing allele frequency is high, an affected sib pairmay actually receive greater weight than an affected sib trio or quartet, because thelatter cases are more likely to involve multiple copies of the predisposing allele seg-regating in the family. (Of course, this depends on the assumption that the affectionstatus of any additional siblings is unknown, so that the overall size of the sibshipfrom which each affected sib pair, trio, or quartet is drawn is not a consideration.)
Fig. 3. Optimal weight of sib quartet relative to sib pair for different models, using the optimal shar-ing statistic S. For both the dominant and recessive cases, the risk to a homozygote carrier relative to ahomozygote non-carrier is assumed to be 10. The results are for Ztot or, equivalently, log(LR
^ exp).

242 McPeek
Example 1: concordant and discordant sib pairs. For sib pairs, Severyone =Spairs = S–#alleles = Sall and Sg-prs = S–#geno = Sfewest. The former assign value i to pairs whoshare i alleles and the latter assign value 1 to pairs who share two alleles and 0 tothose who do not. Consider any single-gene two-allele model parametrized by m, r,and a, where m = (f1 – f0)/(f2 – f0), m = 0 corresponding to recessiveness, m = 1corresponding to dominance, and m = 1/2 corresponding to additivity, r = f2/f0 is therelative risk of a homozygote carrier to a homozygote non-carrier, and a is allelefrequency. Then for the test statistic log(LR^ lin), the optimal sharing statistic S in thecase of affected sib pairs is given by
Soptimal = aSpairs + (1 – a)Sfewest,
where a is as given above under Allele With Small Effect. Note that it does notdepend on r. This statistic is also approximately optimal for tests based on log(LR^ exp)and Ztot when the deviation from null sharing is small. This same statistic is optimalin any outbred pedigree for models in which the relative risk r approaches 1. Fordiscordant sib pairs, the optimal statistic is just the negative of the optimal statisticfor concordant sib pairs.
There are several other common parametrizations of the allele-sharing distribu-tion for sib pairs. To see the connections between those and the two-allele modelused here, see Appendix C.
Example 2: outbred sib trio. In this case, Sg-prs = S–#geno + Sfewest, Spairs = 2Severyone,and S–#alleles = Severyone. For any two-allele model with 0 < a < 1, the optimal sharingstatistic for a test based on log(LR^ lin), approximately optimal for tests based onlog(LR
^ exp) and Ztot when deviation from null sharing is small, is given by
Sopt ∝ aa–(m– – m)(1 – 2mr– – rm2)Sfewest+(am– + a–m)[a(1 + r– (1 – 4m) – 2rm2) + m(mr + 2r– )]Severyone +
aa– (m– – m)(r– (m– – m) – rm2)S–#geno,
where r = 1 – r–1, i.e., it is a linear combination of three statistics, giving a two-parameter model.
Example 3: single inbred individual. In this case, the two possible configura-tions are 1 1 and 1 2, and the possible sharing statistics are S#aff HBD and S–#aff HBD.When 0 < a < 1 and r > 1, for any two-allele model, S#aff HBD is optimal whenever m <.5. Then it is clear that S–#aff HBD must be optimal whenever m > .5, because if the traitfollows a two-allele model with m < .5, then the dual trait, defined as the lack of theoriginal trait, also follows a two-allele model with m > .5. Single inbred individualsconvey no information for linkage when the model is additive (m = .5).
Example 4: lethal embryonic. For a rare (a → 0) recessive that is alwayslethal, the dual trait is a common (a → 1) dominant with no phenocopies. Thus,model 2 in Table II applies to the surviving family members.
TO WHAT MODELS DO SPAIRS AND SALL CORRESPOND?
For some small pedigrees such as sib pairs or sib trios, these two statistics, Spairs
and Sall, coincide. For both affected sib pairs and affected sib trios, the two-allele
Optimal Allele-Sharing Statistics 243
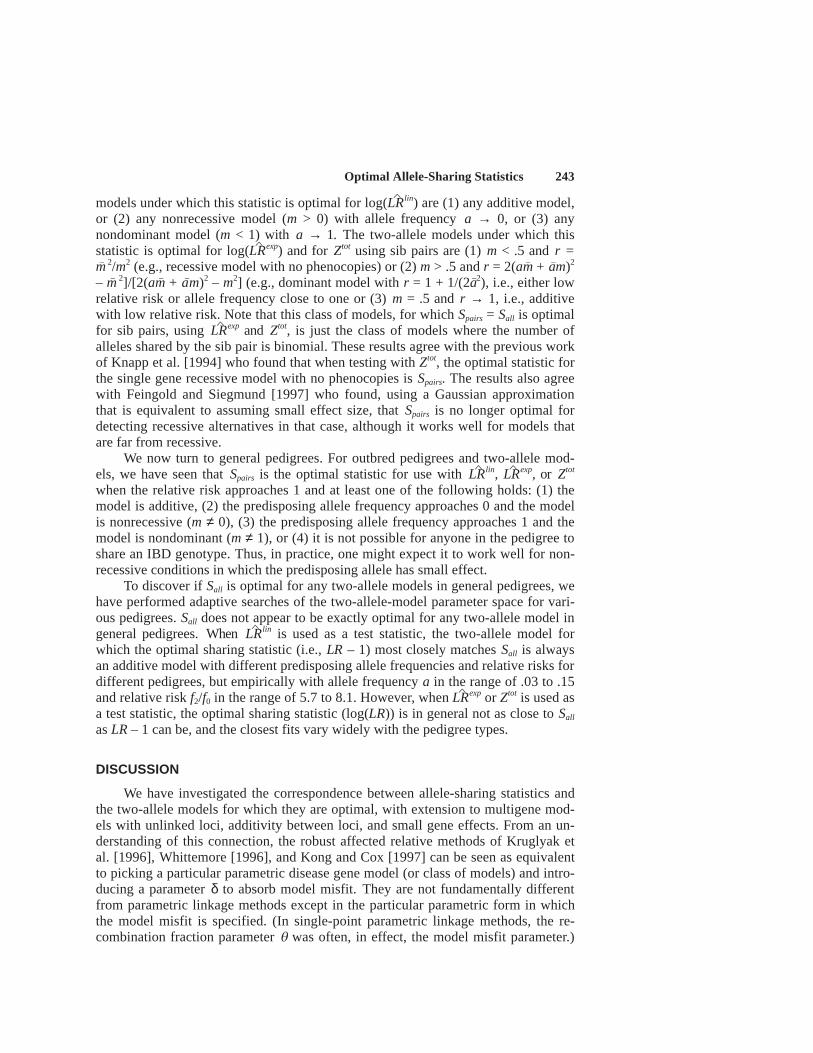
models under which this statistic is optimal for log(LR^ lin) are (1) any additive model,
or (2) any nonrecessive model (m > 0) with allele frequency a → 0, or (3) anynondominant model (m < 1) with a → 1. The two-allele models under which thisstatistic is optimal for log(LR
^ exp) and for Ztot using sib pairs are (1) m < .5 and r =m– 2/m2 (e.g., recessive model with no phenocopies) or (2) m > .5 and r = 2(am– + a–m)2
– m– 2]/[2(am– + a–m)2 – m2] (e.g., dominant model with r = 1 + 1/(2a–2), i.e., either lowrelative risk or allele frequency close to one or (3) m = .5 and r → 1, i.e., additivewith low relative risk. Note that this class of models, for which Spairs = Sall is optimalfor sib pairs, using LR^ exp and Ztot, is just the class of models where the number ofalleles shared by the sib pair is binomial. These results agree with the previous workof Knapp et al. [1994] who found that when testing with Ztot, the optimal statistic forthe single gene recessive model with no phenocopies is Spairs. The results also agreewith Feingold and Siegmund [1997] who found, using a Gaussian approximationthat is equivalent to assuming small effect size, that Spairs is no longer optimal fordetecting recessive alternatives in that case, although it works well for models thatare far from recessive.
We now turn to general pedigrees. For outbred pedigrees and two-allele mod-els, we have seen that Spairs is the optimal statistic for use with LR^ lin, LR^ exp, or Ztot
when the relative risk approaches 1 and at least one of the following holds: (1) themodel is additive, (2) the predisposing allele frequency approaches 0 and the modelis nonrecessive (m ≠ 0), (3) the predisposing allele frequency approaches 1 and themodel is nondominant (m ≠ 1), or (4) it is not possible for anyone in the pedigree toshare an IBD genotype. Thus, in practice, one might expect it to work well for non-recessive conditions in which the predisposing allele has small effect.
To discover if Sall is optimal for any two-allele models in general pedigrees, wehave performed adaptive searches of the two-allele-model parameter space for vari-ous pedigrees. Sall does not appear to be exactly optimal for any two-allele model ingeneral pedigrees. When LR
^ lin is used as a test statistic, the two-allele model forwhich the optimal sharing statistic (i.e., LR – 1) most closely matches Sall is alwaysan additive model with different predisposing allele frequencies and relative risks fordifferent pedigrees, but empirically with allele frequency a in the range of .03 to .15and relative risk f2/f0 in the range of 5.7 to 8.1. However, when LR^ exp or Ztot is used asa test statistic, the optimal sharing statistic (log(LR)) is in general not as close to Sall
as LR – 1 can be, and the closest fits vary widely with the pedigree types.
DISCUSSION
We have investigated the correspondence between allele-sharing statistics andthe two-allele models for which they are optimal, with extension to multigene mod-els with unlinked loci, additivity between loci, and small gene effects. From an un-derstanding of this connection, the robust affected relative methods of Kruglyak etal. [1996], Whittemore [1996], and Kong and Cox [1997] can be seen as equivalentto picking a particular parametric disease gene model (or class of models) and intro-ducing a parameter δ to absorb model misfit. They are not fundamentally differentfrom parametric linkage methods except in the particular parametric form in whichthe model misfit is specified. (In single-point parametric linkage methods, the re-combination fraction parameter q was often, in effect, the model misfit parameter.)

244 McPeek
In practice, much of the robustness of the affected relative method is due to choicessuch as using affecteds only or using sib pairs, which reduce the dimension of theparameter space.
We find that for any single gene model, the optimal S treats relativesexchangeably. This result also extends to multigene models with unlinked loci, addi-tivity between loci, and small gene effects. Thus, even when robust affected relativemethods are applied to extended families, there is no need for the sharing statistic Sto take into account whether it is the close or the more distant relatives in a familywho exhibit sharing. We argue that in cases in which the robust affected relativemethods discussed here are likely to have power to detect a gene, the exchangeabil-ity result should still provide a useful approximate rule of thumb, even if the truemodel does not fall into the above classes.
We are able to find simple expressions for the optimal S, applicable to anypedigree type, for a variety of two-allele and some multigene models. While previ-ous theoretical work in this area depends on asymptotic scenarios and small effectsizes [e.g., Kong and Cox, 1997; Teng and Siegmund, 1997], the theory given hereapplies to realistic sample sizes with large effects as well. We propose a new statis-tic, Srob dom, which is easy to compute and robust across a variety of models. Ourpower calculations for the case of affected sib pair with affected parent (Fig. 1a–d)give the following order of performance, in decreasing order of power, against avariety of dominant and additive models: Srob dom, Sall, Spairs, S–#alleles, while for reces-sive models (Fig. 1e and f), this order is reversed. We have done similar calculationsfor a variety of outbred pedigree types, and have found first, that the orderings interms of power given above for the four statistics hold more or less across the board,and second, that the differences in power among the statistics may be quite small orquite large, depending on the particular pedigree (results not shown). In the case of alarge inbred pedigree, Srob dom was found to be powerful against a wide variety ofdominant, additive, and recessive alternative models, although Spairs performed slightlybetter in the recessive case (Mark Abney, unpublished results). In the case of thelarge inbred pedigree used, exact computation of Sall was impossible, so this statisticwas not considered.
These results suggest use of Srob dom in practice, especially for non-recessive mod-els. In many cases, the power of Sall will be nearly equivalent to Srob dom, but Sall ismore difficult to calculate. In the recessive case, Srob dom and Sall may or may notperform well, depending on the pedigree type. There is no one statistic that performswell over all disease models in general, but Spairs is perhaps the compromise choice.As seen in Figure 1, it maintains a similar level of performance over many diseasemodels, although that level may be very low for some pedigree types. Another ad-vantage of Spairs is that its distribution is much less skewed than those of Srob dom andSall, so the normal approximation is much more accurate for calculating P values. Inoutbred pedigrees, S–#alleles is also a good choice in the recessive case only.
Kruglyak et al. [1996] performed a simulation study comparing Spairs and Sall. Fortheir particular simulation scheme, with the pedigree randomly determined and allowedto vary across realizations, they found that Sall performed much better than Spairs in thedominant case and for the two complex models they consider, and that the two statisticsperformed equally well in the recessive case. Our findings are not necessarily inconsis-tent with theirs, but we would caution that the statistic Sall, and likewise Srob dom, has a

Optimal Allele-Sharing Statistics 245
very skewed distribution and thus great care must be taken not to overrate its power ifapproximations are used. The calculations shown here result from consideration of everypossible outcome, with no simulation or approximation involved.
The power calculations shown here are single-locus calculations, rather thantaking into account testing on a whole region of the genome as in Feingold et al.[1993], Feingold and Siegmund [1997], and Teng and Siegmund [1997]. This sim-plification allows us to consider non-asymptotic as well as asymptotic models, witha unified approach that is applicable to all pedigree types, without requiring separateanalysis of many special cases of relationship. Simulation studies have indicated thatthe relative performance of the statistics changes little when one takes into accounttesting across a region of the genome (Mark Abney, unpublished results).
For models with nonnegligible deviation from null sharing, the choice of Ztot orlog(L^Rexp) on the one hand or log(L^Rlin) on the other, as the basis for a test of linkage,can also affect which statistics are optimal against which alternative models. Similarly,we find that the optimal choice of weights γi can be heavily influenced by the model. Wefind that when the optimal sharing statistic S is used, pedigrees are appropriately com-bined by adding the values of S, rather than the normalized values Z as in Kruglyak et al.[1996]. In other words, γi should be taken to be proportional to the null standard devia-tion of Si in the ith pedigree. When a non-optimal S is used, the optimal weight γi de-pends on the model and is approximately proportional to EA(Zi).
In the special case of weights for relative pairs, Teng and Siegmund’s [1997]approach is equivalent to using weights proportional to EA(Z). This coincides withour suggestion above for the case of non-optimal S. Since the alternative model isunknown, they suggest using a crude estimate of λO, the relative risk to an offspringof an affected, to calculate the weights. They find that a choice of λ^ O = 4 works wellin a variety of scenarios. For pedigrees with more than two affecteds, Teng andSiegmund [1997] consider selected examples and find ways to convert them, on acase-by-case basis, to effective numbers of different kinds of relative pairs. Theirempirical results on optimal weightings in specific examples are consistent with ourrecommendation that for the optimal S, pedigrees should be combined on the S scale,before dividing by the null standard deviations.
Finally, for the statistic Spairs, we have described the two-allele models for whichit is optimal. Sall does not appear to be optimal for any two-allele model in general,but the closest fits occurred among additive models.
ACKNOWLEDGMENTS
This work was supported in part by National Institutes of Health grant R29HG01645-01. This manuscript was prepared using computer facilities supported inpart by National Science Foundation grant DMS 89-05292 awarded to the Depart-ment of Statistics at The University of Chicago, and by The University of ChicagoBlock Fund.
APPENDIX A: DERIVATION OF EXCHANGEABILITY RESULT
Let c denote the sharing configuration among the affecteds in the pedigree at aparticular location x in the genome; Φ the affection status, where the unaffecteds are

246 McPeek
coded as “unknown,” e.g., for an affected sib pair with an additional unaffected sib,Φ would denote the event that the two sibs are affected; LO(·) the likelihood underthe null hypothesis that a gene at location x has no effect on the trait; LA(·) the likeli-hood under the true alternative model, assumed to involve a single gene at locationx. Note that LA(c,Φ)/LO(c,Φ) = PA(c)PA(Φ|c)/[PO(c)PO(Φ|c)], and using the fact thatPA(c) = PO(c) and PA(Φ) = PO(Φ) = PO(Φ|c), we get LA(c,Φ)/LO(c,Φ) = PA(Φ|c)/PA(Φ),where PA(Φ) = ΣcPO(c)PA(Φ|c) = EO(PA(Φ|c)|Φ).
Consider two pedigrees that are identical in terms of structure and affected mem-bers, but differ only in their IBD sharing. Further, assume that the configuration ofIBD sharing among affecteds in one pedigree can be obtained from the configurationof IBD sharing among affecteds in the other pedigree by permutation of individuals’IBD genotypes, where the two alleles of an individual’s genotype are treated as aunit, never separated. Let c1 be the IBD configuration in pedigree 1 and c2 be theIBD configuration in pedigree 2. Then in each case, for the optimal S, we have S(ci)= f(LA(ci,Φ)/LO(ci,Φ)) = f(PA(Φ|c)/PA(Φ)), where f(x) = x – 1 or log(x). PA(Φ) is clearlythe same for both pedigrees. The assumption of conditional independence of pheno-types given genotypes and the fact that the IBD genotypes in one pedigree can beobtained from the other by permuting individuals imply that PA(F|c) is the same forboth pedigrees as well. Thus, the sharing score assigned to the two different c’s bythe most powerful sharing function S must be the same, i.e., affected relatives withina pedigree should be treated as exchangeable.
The extension to multiple unlinked genes with additivity between loci and smalleffect at each locus, i.e., f0 → f2 at each locus, follows from a Taylor expansion of thelikelihood ratio around r = 1 – f0/f2 for each locus. Details are available from the author.
APPENDIX B: DERIVATION OF OPTIMAL SHARING STATISTICS AGAINSTPARTICULAR ALTERNATIVES
Applying the connection between optimal allele-sharing statistics and paramet-ric likelihoods laid out in Guiding Principles for the Optimal Choice of S and theγi’s, it remains to calculate a general expression for the likelihood ratio under eachmodel. Let k denote the number of affected individuals in the pedigree; a the fre-quency of the predisposing allele; fi the probability of being affected given i copiesof the predisposing allele, i = 0, 1, 2; #al(c) the number of distinct-by-descent allelesoccurring in configuration c. Using the fact that LA(c,Φ)/LO(c,Φ) = PA(Φ|c)/PA(Φ),where PA(Φ) = ScPO(c)PA(Φ|c) = EO(PA(Φ|c)|Φ), we get the following cases by simpleTaylor expansion of the likelihood:
1. Rare dominant with phenocopies (i.e., a ↓ 0, 0 < f0 < f1 = f2 ≤ 1): Then,letting S = ΣiÎA(r
c1(i) – 1), we get LA(c,Φ)/LO(c,Φ) = 1 + a[S – EO(S)] + o(a).2. Allele with small effect (i.e., f0 ↑ f2 ≤ 1, 0 < a < 1), single or multigene with
loci unlinked and additivity between loci: If the pedigree is outbred, LA(c,Φ)/LO(c,Φ)= 1 + aa–r2[(am– + a–m)2(Spairs(c) – EO(Spairs)) + aa–(m– – m)2(Sg-prs(c) – EO(Sg-prs))] +o(r2), where a– = 1 – a, m– = 1 – m, r = 1 – f0/f2, with Sg-prs(c) – EO(Sg-prs) = 0 if it isnot possible to have variation in the number of pairs of affecteds who share a geno-type. If the pedigree is inbred and the model is not additive (m ≠ .5), then LA(c,Φ)/LO(c,Φ) = 1 + raa–(m– – m)S#aff HBD + o(r2). If the pedigree is inbred and the model isadditive, then LA(c,Φ)/LO(c,Φ) = 1 + ¼r2aa–[Spairs – EO (Spairs)] + o(r2).

Optimal Allele-Sharing Statistics 247
3. Rare dominant, no phenocopies (i.e., f0 = 0 < f1 = f2 ≤ 1, a ↓ 0): For 1 ≤i ≤ #al(c), let bi(c) denote the number of ways to choose i distinct-by-descentalleles from among those in c so that all of the affecteds have at least one of thei. (Note that when i = #al(c), bi(c) = 1.) Let d(c) be the smallest i, 1 ≤ i ≤ #al(c),such that bi(c) > 0. Let d = the smallest possible value of d(c) for the particulartype of affected relatives, e.g., if all affecteds have a common ancestor in thepedigree, d = 1. If there is not a single common ancestor, but everyone is de-scended from at least one of two ancestors in the pedigree, then d = 2, and so on.Let Severyone(c) = bd(c). Then lima®0 LA(c,Φ)/LO(c,Φ) = Severyone(c)/EO(Severyone), whereEO(Severyone) = Σc´ PO(c´)Severyone(c´). The same result is obtained for rare nonrecessivewith no phenocopies in outbred pedigrees in which it is possible for everyone toshare an allele IBD.
4. Dominant, no phenocopies, predisposing allele frequency approaches one(i.e., f0 = 0 < f1 = f2 ≤ 1, a ↑ 1): If the pedigree is outbred and it is possible to havevariation in the number of genotypes present, then LA(c, Φ)/LO(c, Φ) = 1 + [S–#geno(c)–EO(S–#geno)](1 – a)2+ o(1 – a)2. If the pedigree is outbred and it is not possible tohave variation in the number of genotypes present, e.g., if it is not possible for anypair of affecteds to have the same IBD genotype, the LA(c, Φ)/LO(c, Φ) = 1 + [Spairs(c)– S#al triples – EO(Spairs) + EO(S#al triples)](1 – a)3 + o(1 – a)3. If the pedigree is inbred,then LA(c, Φ)/LO (c, Φ) = 1 + [S–#al HBD(c) – EO(S–#al HBD)](1 – a) + o(1 – a).
5. Rare dominant with small effect (f0 ↑ f1 = f2 ≤ 1, a, ↓ 0), single or multigenewith loci unlinked and additivity between loci: Let r = 1 – f0/f2. If the pedigree isoutbred, LA(c, Φ)/LO(c, Φ) = 1 + ar2[Spairs(c) – EO(Spairs)] + o(a3) + o(a2r) + o(r3). Ifthe pedigree is inbred, LA(c, Φ)/LO(c, Φ) = 1 – ar[S#aff HBD(c) – EO(S#aff HBD)] +o(a2) + o(r2).
6. Dominant with small effect; predisposing allele frequency approachesone (fo ↑ f1 = f2 ≤ 1, a ↑ 1), single or multigene with loci unlinked and additivitybetween loci: Let r = 1 – fo/f2. If the pedigree is outbred and it is possible to havevariation in the number of pairs of affecteds who share a genotype, then LA(c, Φ)/LO(c, Φ) = 1 + (1 – a)2r2[Sg-prs(c) – EO(Sg-prs)] + o(1 – a)4 + o((1 – a)2r2) + o(r4). Ifthe pedigree is outbred and it is not possible to have variation in the number ofgenotypes present, then LA(c, Φ)/LO(c, Φ) = 1 + (1 – a)3r2[Spairs(c) – EO(Spairs)] + o(1– a)5 + o((1 – a)3r2) + o((1 – a)2r3) + o(r5). If the pedigree is inbred, then LA(c, Φ)/LO(c, Φ) = 1 + [S–#aff HBD(c) – EO(S–#aff HBD)](1 – a)r + o(1 – a)2 + o(r2).
7. Rare recessive, no phenocopies (0 = f0 = f1 < f2 ≤ 1, a ↓ 0): Then lima→0
LA(c, Φ)/LO(c, Φ) = Sfewest/EO(Sfewest).8. Recessive, no phenocopies, predisposing allele frequency approaches one
(0 = f0 = f1 < f2 ≤ 1, a ↑ 1): Then LA (c, Φ)/LO(c, Φ) = 1 + (1 – a)[S–#al(c) – EO(S–#al)]+ o(1 – a)2.
9. Rare recessive with small effect (f0 = f1 ↑ f2 ≤ 1, a ↓ 0), single or multigenewith loci unlinked and additivity between loci: If the pedigree is outbred and it ispossible to have variation in the number of pairs of affecteds who share a genotype,then LA(c, Φ)/LO(c, Φ) = 1 + a2r2[Sg-prs(c) – EO(Sg-prs)] + o(a4) + o(a2r2) + o(r4). If thepedigree is outbred and it is not possible to have variation in the number of pairs ofaffecteds who share a genotype, then LA(c, Φ)/LO(c, Φ) = 1 + a3r2[Spairs(c) – EO(Spairs)]+ o(a5) + o(a3r2) + o(a2r3) + o(r5). If the pedigree is inbred, LA(c, Φ)/LO(c, Φ) = 1 +ar [S#aff HBD(c) – EO(S#aff HBD)] + o(a2) + o(r2).

248 McPeek
10. Recessive with small effect; predisposing allele frequency approachesone (f0 = f1 ↑ f2 ≤ 1, a ↑ 1), single or multigene with loci unlinked and additivitybetween loci: If the pedigree is outbred, LA(c, Φ)/LO(c, Φ) = 1 + (1 – a)r2[Spairs(c) –EO(Spairs)] + o(1 – a)3 + o((1 – a)2r) + o(r3). If the pedigree is inbred, LA(c, Φ)/LO(c,Φ) = 1 + (1 – a)r[S#aff HBD(c) – EO(S#aff HBD)] + o(1 – a)2 + o(r2).
APPENDIX C: ALTERNATIVE PARAMETRIZATIONS OF SHARINGDISTRIBUTION FOR SIB PAIRS
Note that the sharing distribution for affected sib pairs involves only two inde-pendently varying quantities, P(share 2|both sibs affected) and P(share 1|both sibsaffected), with P(share 0|both sibs affected) = 1 – P(share 2|both sibs affected) –P(share 1|both sibs affected). This may be parametrized by 0 ≤ a ≤ 1 and 0 ≤ δ ≤ α,where P(share 2|both sibs affected) = (1 – a)/4, P(share 1|both sibs affected) = (1 –δ)/2, and P(share 0|both sibs affected) = (1 + a + 2δ)/4, e.g., as in Feingold andSiegmund [1997]. Alternatively, it may be parametrized by λS, the relative risk tosiblings of affecteds, and λO, the relative risk to offspring of affecteds, where a = 1 –1/λS and δ = 1 – λO/λS [Risch, 1990]. For a single-gene two-allele model, if we let n0
= [a2 + 2aa–(1 – rm–) + a–2r– ]2, n1 = a[a + a–(1 – rm–)]2 + a–[a(1 – rm–) + a–r– ]2, and n2 =a+a–r– 2, then α = 1 – n0/(.25n0 + .5n1 + .25n2) and d = 1 – n1/(.25n0 + .5n1 + .25n2).Alternatively, the two-allele model may be parametrized by K, the population preva-lence of the trait, VA, the additive variance of the trait, and VD, the dominant varianceof the trait, with α = (VA/2 + VD/4)/(K2 + VA/2 + VD/4) and δ = (VD/4)/(K2 + VA/2 +VD/4) [Suarez, 1978]. Feingold and Siegmund [1997] point out that the two-alleleassumption is not necessary for these last formulae to hold.
REFERENCES
Clerget-Darpoux F, Bonaiti-Pellie C, Hochez J. 1986. Effects of misspecifying genetic parameters inlod score analysis. Biometrics 42:393–399.
Day NE, Simons MJ. 1976. Disease susceptibility genes: their identification by multiple case familystudies. Tissue Antigens 8:109–119.
Feingold E, Siegmund D. 1997. Strategies for mapping heterogeneous recessive traits by allele-sharingmethods. Am J Hum Genet 60:965–978.
Feingold E, Brown PO, Siegmund D. 1993. Gaussian models for genetic linkage analysis using com-plete high-resolution maps of identity by descent. Am J Hum Genet 53:234–251.
Fimmers R, Seuchter SA, Neugebauer M, Knapp M, Baur MP. 1989. Identity-by-descent analysis usingall genotype solutions. In: Elston RC, Spence MA, Hodge SE, MacCluer JW, editors. Multipointmapping and linkage based on affected pedigree members: Genetic Analysis Workshop 6. NewYork: Alan R. Liss. p 123–128.
Fishman PM, Suarez B, Hodge SE, Reich T. 1978. A robust method for the detection of linkage infamilial diseases. Am J Hum Genet 30:308–321.
Green JR, Woodrow JC. 1977. Sibling method for detecting HLA-linked genes in disease. Tissue Anti-gens 9:31–35.
Hodge SE. 1984. The information contained in multiple sibling pairs. Genet Epidemiol 1:109–122.Knapp M. 1991. A powerful test of sib-pair linkage for disease susceptibility. Genet Epidemiol
8:141–143.Knapp M, Seuchter SA, Baur MP. 1994. Linkage analysis in nuclear families. Hum Hered 44:44–51.Kong A, Cox NJ. 1997. Allele sharing models: lodscores and accurate linkage tests. Am J Hum Genet
61:1179–1188.

Optimal Allele-Sharing Statistics 249
Kruglyak L, Daly MJ, Reeve-Daly MP, Lander ES. 1996. Parametric and nonparametric linkage analy-sis: a unified multipoint approach. Am J Hum Genet 58:1347–1363.
Lange K. 1986. The affected sib-pair method using identity by state relations. Am J Hum Genet39:148–150.
Penrose LS. 1935. The detection of autosomal linkage in data which consist of pairs of brothers andsisters of unspecified parentage. Ann Eugen 6:133–138.
Risch N. 1990. Linkage strategies for genetically complex traits. II. The power of affected relativepairs. Am J Hum Genet 46:229–241.
Schaid DJ, Nick TG. 1990. Sib-pair linkage tests for disease susceptibility loci. Genet Epidemiol7:359–370.
Sobel E, Lange K. 1996. Descent graphs in pedigree analysis: applications to haplotyping, locationscores, and marker-sharing statistics. Am J Hum Genet 58:1323–1337.
Suarez BK. 1978. The affected sib pair IBD distribution for HLA-linked disease susceptibility genes.Tissue Antigens 12:87–93.
Teng J, Siegmund D. 1997. Combining information within and between pedigrees for mapping com-plex traits. Am J Hum Genet 60:979–992.
Thompson E. 1974. Gene identities and multiple relationships. Biometrics 30:667–680.Weeks D, Lange K. 1988. The affected-pedigree-member method of linkage analysis. Am J Hum Genet
42:315–326.Whittemore AS. 1996. Genome scanning for linkage: an overview. Am J Hum Genet 59:704–716.Whittemore AS, Halpern J. 1994. A class of tests for linkage using affected pedigree members. Bio-
metrics 50:118–127.