optical performance monitoring in coherent optical ofdm systems
TRANSCRIPT
Optical performance monitoring in coherent optical OFDM systems
William Shieh, Rodney S. Tucker, Wei Chen, Xingwen Yi, and Graeme Pendock
ARC Special Research Centre for Ultra-Broadband Information Networks and National ICT Australia
Department of Electrical and Electronic Engineering, The University of Melbourne, Melbourne, VIC 3010, Australia [email protected]
Abstract: Optical performance monitoring is an indispensable feature for optical systems and networks. In this paper, we propose the concept of optical performance monitoring through channel estimation by receiver signal processing. We show that in coherent-optical-orthogonal-frequency-division-multiplexed (CO-OFDM) systems, critical optical system parameters including fiber chromatic dispersion, Q value, and optical signal-to-noise ratio (OSNR) can be accurately monitored without resorting to separate monitoring devices.
©2007 Optical Society of America
OCIS codes: (060.0060) Fiber optics and optical communications; (060.1660) Coherent communications; (0606.5060) Phase modulation
References and links
1. D. C. Kilper, R. Bach, D. J. Blumenthal, D. Einstein, T. Landolsi, L.Ostar, M. Preiss, and A. E. Willner, “Optical performance monitoring,” J. Lightwave. Technol 22, 294–304 (2004).
2. S. K. Shin, K. J. Park, and Y. C. Chung, “A novel optical signal-to-noise ratio monitoring technique for WDM networks,” in OFC 2000 2, Mar. 7–10, 182–184 (2000).
3. W. Chen; R. S. Tucker, X. Yi, W. Shieh, and J. Evans, “Optical signal-to-noise ratio monitoring using uncorrelated beat noise,” IEEE Photon. Technol. Lett. 17, 2484 – 2486 (2005).
4. G. Lu, M. Cheung, L. Chen, and C. Chan, “Simultaneous PMD and OSNR monitoring by enhanced RF spectral dip analysis assisted with a local large-DGD element,” IEEE Photon. Technol. Lett. 17, 2790 – 2792 (2005).
5. B. Fu, and R. Q. Hui, “Fiber chromatic dispersion and polarization-mode dispersion monitoring using coherent detection,” IEEE Photon. Technol. Lett. 17, 1561-1563 (2005).
6. C. Xie, D. Kilper, L. Moller, and R. Ryf, “Orthogonal polarization heterodyne OSNR monitoring technique insensitive to polarization effects,” Tech. Dig., Optical Fiber Communication Conference, paper PDP10, Anaheim, California (March 2006).
7. T. Luo, Z. Pan, S. Nezam, L. Yan, A. Sahin, and A. Willner, “ PMD monitoring by tracking the chromatic-dispersion-insensitive RF power of the vestigial sideband,” IEEE Photon. Technol. Lett. 16, 2177 – 2179 (2004).
8. S. Dods, D. Hewitt, P. Farrell, and K. Hinton, “A novel broadband asynchronous histogram technique for optical performance monitoring,” Tech. Dig., Optical Fiber Communication Conference, paper OThH2, Anaheim, California (March 2005).
9. Z. Li, and G. Li, “Chromatic dispersion and polarization-mode dispersion monitoring for RZ-DPSK signals based on asynchronous amplitude-histogram evaluation,” J. Lightwave Technol. 24, 2859 – 2866 (2006).
10. F. Buchali, “Electronic dispersion compensation for enhanced optical transmission,” Tech. Dig. Optical Fiber Communication Conference, paper OWR5, Anaheim, California (March 2006).
11. W. Shieh, and C. Athaudage, “Coherent optical orthogonal frequency division multiplexing,” IEE Electron. Lett. 42, 587-589 (2006).
12. W. Shieh, W. Chen and R. S. Tucker, “Polarization mode dispersion mitigation in coherent optical orthogonal frequency division multiplexed systems,” IEE Electron. Lett. 42, 996 – 997 (2006).
13. Y. Li, L. J. Cimini, and N. R. Sollenberger, “Robust channel estimation for OFDM systems with rapid dispersive fading channels” IEEE Trans. Commun., 46, 902-915 (1998).
14. S. Hara, and R. Prasa, Multicarrier techniques for 4G Mobile Communications, (Artech House, Boston, 2003).
15. J. Proakis, Digital Communications, (WCB/McGraw-Hill, New York, 3rd ed.), Chap. 5. 16. N. S. Bergano, F. W. Kerfoot, and C. R. Davidsion, “Margin measurements in optical amplifier system”
IEEE Photon. Technol. Lett. 5, 304 – 306 (1993). 17. J. D. Berger and D. Anthon, “Tunable MEMS devices for optical networks” Opt. Photon. News 14, 43-49
(2003).
#76836 - $15.00 USD Received 6 November 2006; revised 25 December 2006; accepted 26 December 2006
(C) 2007 OSA 22 January 2007 / Vol. 15, No. 2 / OPTICS EXPRESS 350

18. E. Ip, J. Kahn, D. Anthon, and J. Hutchins, “Linewidth measurements of MEMS-based tunable lasers for phase-locking applications,” IEEE Photon. Technol. Lett. 17, 2029 – 2031 (2005).
19. A. Liu, G. J. Pendock, and R. S. Tucker, “Improved chromatic dispersion monitoring using single RF monitoring tone ,” Opt. Express, 14, 4611-4616 ( MAY 2006).
1. Introduction
Optical performance monitoring is an indispensable feature for future optical networks that are envisioned to be all-optical in the core [1]. The fundamental challenge for all-optical networks hinges upon how to monitor, maintain and control the optical signals along intermediate paths. The pertinent parameters that affect the system performance include the signal power, wavelength, optical signal-to-noise ratio (OSNR), polarization-mode-dispersion (PMD) and polarization-dependent-loss (PDL). Various devices and subsystems have been proposed to monitor one or multiple parameters [2 ,3 ,4, 56, 7,8,9 ]. In the mean time, there has been rapid advancement in receiver electrical equalization which takes advantages of powerful and cost-effective silicon signal processing capability [10]. Additionally, we have recently proposed a novel modulation format of coherent optical orthogonal frequency division multiplexing (CO-OFDM) [11]. This is essentially an optical equivalent of RF OFDM that has been widely adopted into numerous communication standards such as WiFi (IEEE 802.11a). We showed that with CO-OFDM, the signal can tolerate a chromatic dispersion equivalent to 3,000 km standard-single-mode-fibre [11]. We also showed that the CO-OFDM signal is robust against PMD and may provide a practical solution for complete PMD mitigation [12]. In the context of RF OFDM, channel estimation has been an actively pursued research topic [13]. In this paper, we propose a similar concept of optical channel estimation (OCE) as one approach to optical performance monitoring. Specifically, we show that with CO-OFDM, various important parameters such as Q margin, OSNR, and chromatic dispersion can be monitored through receiver signal processing. Most importantly, performance monitoring by OCE is basically free because it is embedded as a part of the intrinsic receiver signal processing. Such a monitoring device could be also placed anywhere in the network without concern about the large residual chromatic dispersion of the monitored signal.
2. The principle of OCE in a CO-OFDM system
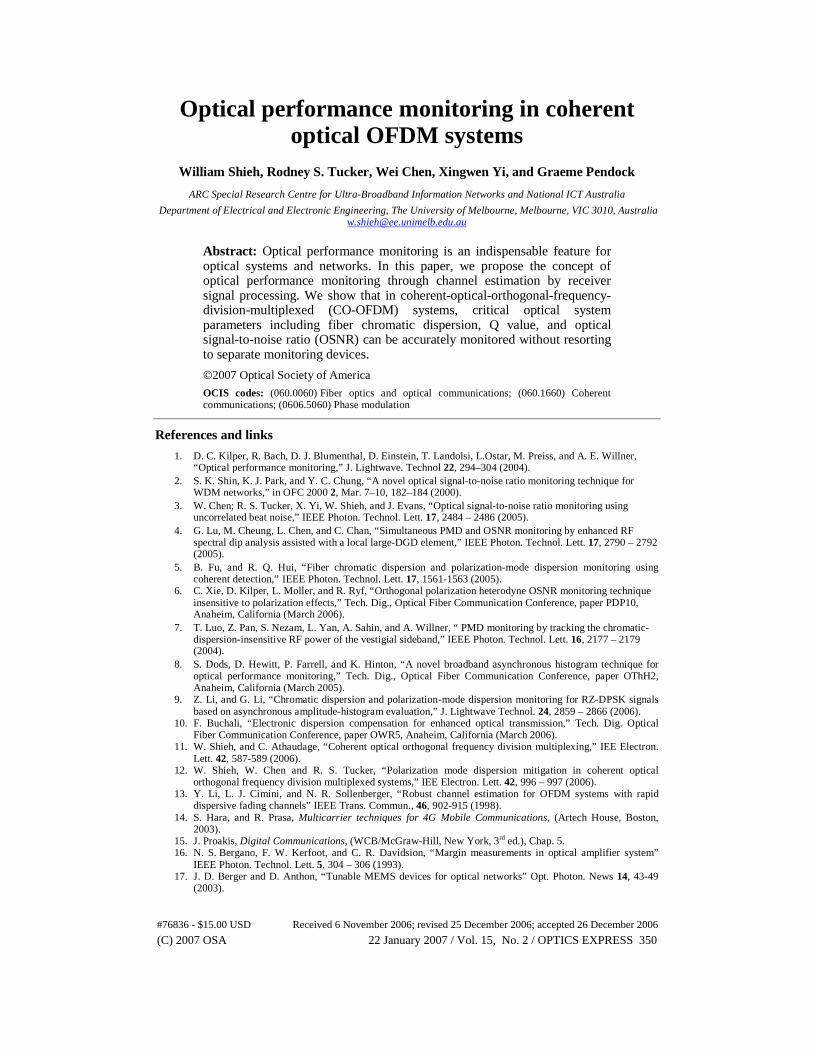
OFDM is a special form of multi-carrier modulation where a single data stream is transmitted over a number of lower rate orthogonal subcarriers [14]. It is worth mentioning that OFDM has been extensively investigated as a means of combating RF microwave multi-path fading, and has been widely implemented in various digital communication standards such as wireless local area network standards (WiFi IEEE 802.11 a) [14]. Figure 1 shows a time and frequency domain representation of an OFDM signal. The OFDM signal in the time domain consists of a continuous stream of OFDM symbols with a regular period Ts, each containing an observation period ts and a guard interval ΔG. A complete CO-OFDM system consists of an electrical OFDM transmitter, an OFDM RF-to-optical up converter, an optical link, an OFDM optical-to-RF down converter, and an electrical OFDM receiver [11]. The principle of OCE is to treat the large number of subcarriers as probes by processing the received subcarrier information symbols, and subsequently the overall channel characteristics are accurately estimated. In this paper, for the sake of simplicity, we limit the study of OCE to the monitoring of CD, OSNR and system Q. Other parameters such as PMD/PDL can be monitored in a similar fashion.
#76836 - $15.00 USD Received 6 November 2006; revised 25 December 2006; accepted 26 December 2006
(C) 2007 OSA 22 January 2007 / Vol. 15, No. 2 / OPTICS EXPRESS 351
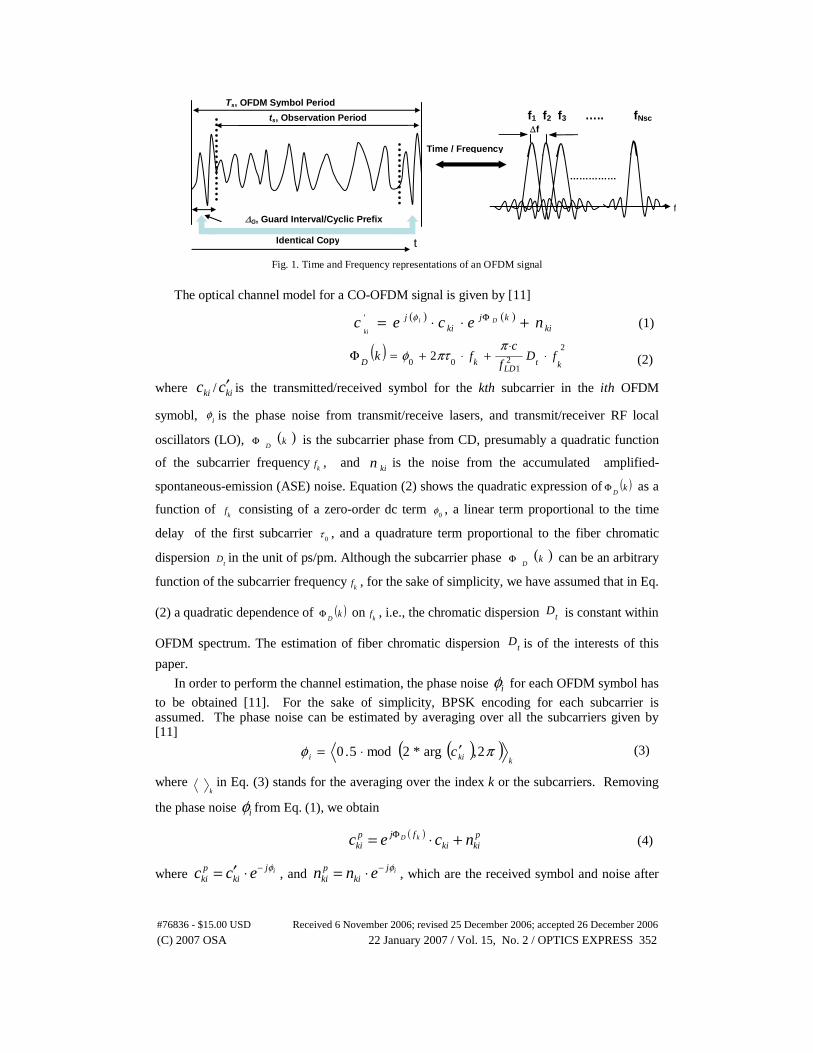
Fig. 1. Time and Frequency representations of an OFDM signal
The optical channel model for a CO-OFDM signal is given by [11]
( ) ( )ki
kjki
j necec Di
ki+⋅⋅= Φφ' (1)
( ) 2
21
002
ktLD
kDfD
f
cfk ⋅
⋅+⋅+=Φ
ππτφ (2)
where kic / kic′ is the transmitted/received symbol for the kth subcarrier in the ith OFDM
symobl, iφ is the phase noise from transmit/receive lasers, and transmit/receiver RF local
oscillators (LO), ( )kD
Φ is the subcarrier phase from CD, presumably a quadratic function
of the subcarrier frequencyk
f , and kin is the noise from the accumulated amplified-
spontaneous-emission (ASE) noise. Equation (2) shows the quadratic expression of ( )kD
Φ as a
function of k
f consisting of a zero-order dc term 0
φ , a linear term proportional to the time
delay of the first subcarrier 0
τ , and a quadrature term proportional to the fiber chromatic
dispersion t
D in the unit of ps/pm. Although the subcarrier phase ( )kD
Φ can be an arbitrary
function of the subcarrier frequencyk
f , for the sake of simplicity, we have assumed that in Eq.
(2) a quadratic dependence of ( )kD
Φ onk
f , i.e., the chromatic dispersion tD is constant within
OFDM spectrum. The estimation of fiber chromatic dispersion tD is of the interests of this
paper.
In order to perform the channel estimation, the phase noise iφ for each OFDM symbol has
to be obtained [11]. For the sake of simplicity, BPSK encoding for each subcarrier is assumed. The phase noise can be estimated by averaging over all the subcarriers given by [11] ( )( )
kkii c πφ 2,arg*2mod5.0 ′⋅= (3)
where k
in Eq. (3) stands for the averaging over the index k or the subcarriers. Removing
the phase noise iφ from Eq. (1), we obtain
( ) pkiki
fjpki ncec kD +⋅= Φ (4)
where ijki
pki ecc φ−⋅′= , and ij
kipki enn φ−⋅= , which are the received symbol and noise after
Time / Frequency
……………
f1 f2 f3 ….. fNsc
f
Δf
ts, Observation Period
Identical Copy
ΔG, Guard Interval/Cyclic Prefix
Ts, OFDM Symbol Period
t
#76836 - $15.00 USD Received 6 November 2006; revised 25 December 2006; accepted 26 December 2006
(C) 2007 OSA 22 January 2007 / Vol. 15, No. 2 / OPTICS EXPRESS 352
the symbol phase correction, respectively. Equation (4) is the fundamental equation for extracting various critical parameters. The
thrust of this work is the signal processing of the received subcarrier symbol pkic . In this paper,
we perform the signal processing in a block of OFDM symbols consisting of a large of number of OFDM symbols, for instance, 100 OFDM symbols. This implies that the channel estimation is averaged and updated every 100 OFDM symbols, which is in the order of μs for 10 Gb/s OFDM systems. This monitoring speed could be sufficient to accommodate the chromatic dispersion and OSNR change from the environment disturbance.
For chromatic dispersion monitoring, we first assume that the transmitted symbol kic is
known. This is the case when (i) the pilot-assisted channel estimation is used, where a known training sequence is used [14], and (ii) the data-assisted channel estimation is used and the decision of the transmitted signal based on the receiver one has already made. In either case, from Eq. (4) the subcarrier phase is given by ( ) ( ) ( )
ikipkikD ccf argarg −=Φ (5)
where ( )arg stands for the phase for a complex signal, istands for the mathematic mean
over multiple OFDM symbols or over index i. The chromatic dispersion t
D is estimated by a
simple second-order curve fitting of ( )kD fΦ as a function of the subcarrier frequencyk
f .
Another important parameter to monitor is the system Q margin. A live system could run error-free even without FEC for an extended period, making it hard to detect the system margin by measuring BER directly. From Eq. (4), we can see that each subcarrier channel is essentially a linear channel with an additive white Gaussian noise. Subsequently the bit-error-ratio (BER) of the system is given by [15] ( )ESNRerfcBER 25.0 ⋅= (6)
k
kikicESNR 22 /δ′= (7)
where ESNR is the (electrical) signal-to-noise ratio per bit, k
stands for the averaging over
the subcarriers or the index k, ikic′ is the expectation value of the received symbol for
subcarrier k, and 22
ikii
kik cc ′−′≡δ is the standard deviation of the received symbol
for subcarrier k. Equation (7) shows that ESNR can be obtained by first constructing the constellation of the received symbol and then performing the computation of ESNR for symbol ’0’ and ’π’ separately. We further convert the BER in Eq. (6) into the Q value [16] which is commonly used in optical community. From Eq. (6), the system Q is thus given by
( )ESNRQ ⋅= 2log10 10 (8)
From Eqs. (7)-(8), the system Q can be effectively monitored by computing the subcarrier
symbol spread in the constellation diagram. We have shown that in a CO-OFDM system, by choosing the guard interval to be larger
than the CD-induced delay spread, the inter-symbol-interference (ISI) can be completely removed [11]. Subsequently the electrical noise characterized by δ is predominately from the accumulation of the ASE noise from optical amplifiers, and it can be shown that
B
OSNRA
ESNR+= 11
(9)
#76836 - $15.00 USD Received 6 November 2006; revised 25 December 2006; accepted 26 December 2006
(C) 2007 OSA 22 January 2007 / Vol. 15, No. 2 / OPTICS EXPRESS 353

where A is a proportional constant between ESNR and OSNR, and B is attributed to the background noise not counted for by ASE noise, which is mainly from the phase noise of the
transmit/receive lasers. From Eqs. (6)-(9), we can see that by acquiring ikic′ and kδ through
receiver signal processing, the ESNR for the OFDM signal can be computed, and subsequently both the system Q and the OSNR can be monitored. The coefficients A and B in Eq. 9 can be obtained practically with a calibration procedure by measuring ESNRs against a series of known OSNRs and performing a linear fit between 1/ESNR and 1/OSNR.
It is quite instructive to explicitly write out the ideal coherent detection performance for CO-OFDM systems where the linewidths of the transmit/receive lasers are assumed to be zero. From Eq. (4), the corresponding BER, Q and ESNR in this ideal condition can be shown given by
⎟⎟⎠
⎞⎜⎜⎝
⎛⋅⋅⋅=
R
BOSNRerfcBER 0225.0 (10)
⎟⎠
⎞⎜⎝
⎛ ⋅⋅=R
BOSNRQ 0
10 4log10 (11)
R
BOSNRESNR 02 ⋅⋅= (12)
where 0B is the optical ASE noise bandwidth used for OSNR measurement (~12.5 GHz for
0.1 nm bandwidth), fNR sc Δ⋅≡ is the total system symbol transmission rate, scN and fΔ
are the number of the subcarriers and channel spacing of the subcarriers, respectively.
3. Simulation model and results
0
20000
40000
60000
0 20000 40000 60000
Link CD (ps/nm)
Mo
nito
red
CD
(ps/
nm)
-100
-50
0
50
100
Mon
itore
d C
D E
rror
(p
s/nm
)
Monitored CD (ps/nm)Monitored CD error (ps/nm)
Fig. 2. Performance of CD monitoring through channel estimation.
To demonstrate the proposal, we carry out a Monte Carlo simulation with an OFDM symbol period of 25.6 ns, a guard time of 3.2 ns, and 256 subcarriers. BPSK encoding is used for each subcarrier resulting in a total bit rate of 10 Gb/s. The linewidth of the transmitter and receiver lasers are assumed to be 100 kHz each, which is close to the value achieved with commercially available semiconductor lasers [17-18]. The link ASE noise from the optical amplifiers is assumed to be white Gaussian noise and the phase noise of the lasers is modelled as white frequency noise characterized by its linewidth. The chromatic dispersion is assumed to be constant within OFDM spectrum. A total 8 blocks of OFDM symbols each consisting of
#76836 - $15.00 USD Received 6 November 2006; revised 25 December 2006; accepted 26 December 2006
(C) 2007 OSA 22 January 2007 / Vol. 15, No. 2 / OPTICS EXPRESS 354

100 OFDM symbols are used for extracting various parameters including CD, system Q and OSNR. In the following text, we use ‘calculate’ to mean the BER results obtained by Monte Carlo simulation, and ‘monitor’ to mean the interpolation results obtained by Eqs. (5)-(9).
Figure 2 shows the monitored CD from the receiver signal processing. The input OSNR is set at 3.8 dB, which gives a BER of 10-3 for a CD below 34,000 ps/nm. We can see that the chromatic dispersion up to 50,000 ps/nm can be monitored with an accuracy of 50 ps/nm. The simultaneous large dynamic range and good accuracy of CD monitoring is the unique feature of the OFDM modulation format, namely, a large number of subcarriers spread cross wide spectrum of 10 GHz resulting in good accuracy, and narrow subcarrier channel spacing of 44.6 MHz resulting in wide dynamic range. This wide dynamic range is over one-order of magnitude improvement over a prior report using single or a few auxiliary subcarriers [19].
5
10
15
20
25
0 5 10 15 20 25 30OSNR (dB)
Sys
tem
Q (d
B)
-14
-10
-6
-2
2
Mon
itore
dd O
SN
R E
rror
(d
B)
Calculated Q
Monitored Q
OSNR Error
Q Margin
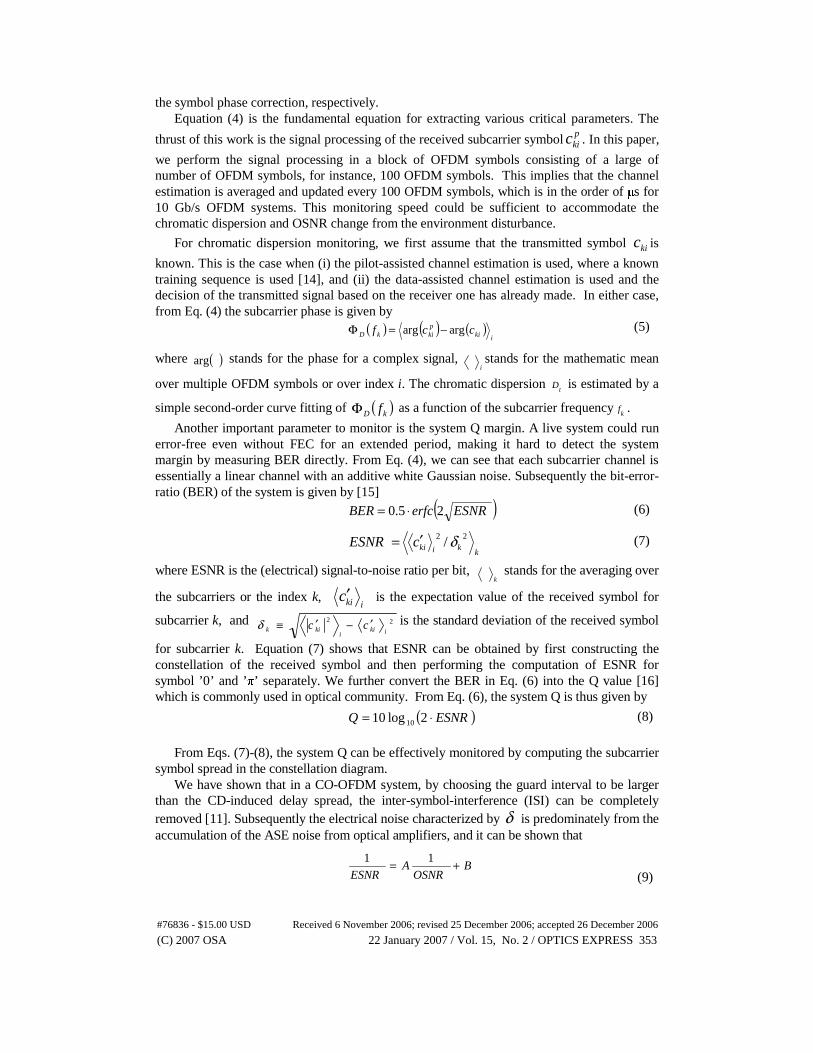
Fig. 3. The monitored system Q and OSNR as a function of input OSNR
Figure 3 shows the monitored system Q and OSNR though OCE. The Q is calculated from 7 dB to 12 dB by Monte Carlo simulation, i.e., direct BER simulation with a signal duration of 20.5 μs, shown in solid square in Fig. 3. This demonstrates a good agreement with the monitored Q by Eq. (8). Beyond that, we rely on Eq. (8) for system Q estimation. To appreciate the advantage of this approach, for instance, at an input OSNR of 20 dB, the system Q for this OSNR is monitored to be 21.3 dB, which gives a Q margin of 11.5 dB over a BER of 10-3. Such a method of Q margin prediction at high OSNRs is similar to that in the direct-detected systems [16]. Thus the margin monitoring is achieved non-intrusively. Note that this level of system margin can not be measured directly. Additionally, the OSNR is monitored by computing ESNR and estimating OSNR using Eq. (9). The curve with solid triangle in Fig. 3 shows that the OSNR can be monitored with errors within 0.5 dB for an input OSNR dynamic range of 1 dB to 20 dB. The maximum OSNR that can be monitored is limited by the laser phase noise.
Although there is a great advantage of performing the OCE in the receiver, it might be beneficial to move the monitoring function out of the receiver and distribute the monitoring devices somewhere within the transmission link. The benefit of distributed monitoring is that the fault can be accurately located once it takes place. The cost of the monitoring device, essentially a high speed coherent receiver for CO-OFDM, might be a disadvantage for this approach, although this could be partially mitigated by sharing one such monitoring device for multiple wavelength channels or even multiple fibers. Another important advantage of performance monitoring based upon OCE is that the monitoring device can be placed anywhere in the system without concern about the dispersion compensation due to its enormous dynamic range over chromatic dispersion, whereas with alternative monitoring
#76836 - $15.00 USD Received 6 November 2006; revised 25 December 2006; accepted 26 December 2006
(C) 2007 OSA 22 January 2007 / Vol. 15, No. 2 / OPTICS EXPRESS 355

techniques, for instance, asynchronous histogram approach [9], the signal needs to be dispersion pre-compensated before being monitored, which is due to the limited dynamic range for that approach. The nonlinearity impact on the channel estimation and performance monitoring is of the great importance and will be discussed in a subsequent submission.
4. Conclusion
We have proposed the concept of optical performance monitoring through channel estimation by receiver signal processing. We show that with CO-OFDM, the various critical optical system parameters can be accurately monitored without resorting to separate monitoring devices.
Acknowledgment
This work is supported by Australian Research Council.
1 D. C. Kilper, R. Bach, D. J. Blumenthal, D. Einstein, T. Landolsi, L.Ostar, M. Preiss, and A. E. Willner, “Optical performance monitoring” J. Lightwave. Technol., 22, no. 1, 294–304 (Jan. 2004).
2 S. K. Shin, K. J. Park, and Y. C. Chung, “A novel optical signal-to-noise ratio monitoring technique for WDM networks” in OFC 2000, 2, Mar. 7–10, 182–184 (2000).
3 W. Chen; R. S. Tucker, X. Yi, W. Shieh, J. Evans, “Optical signal-to-noise ratio monitoring using uncorrelated beat noise” IEEE Photon. Technol. Lett., 17, 2484 – 2486 (2005).
4 G. Lu, M. Cheung, L. Chen, and C. Chan, “Simultaneous PMD and OSNR monitoring by enhanced RF spectral dip analysis assisted with a local large-DGD element” IEEE Photon. Technol. Lett., 17, 2790 – 2792 (2005).
5 B. Fu, RQ. Hui, “Fiber chromatic dispersion and polarization-mode dispersion monitoring using coherent detection” IEEE Photon. Technol. Lett. , 17, 1561-1563 (2005). 6 C. Xie, D. Kilper, L. Moller, and R. Ryf, “Orthogonal Polarization Heterodyne OSNR Monitoring Technique Insensitive to Polarization Effects” Techn. Digest. , Optical Fiber Communication Conference, paper PDP10, Anaheim, California (March 2006).
7 T. Luo, Z. Pan, S. Nezam, L. Yan, A. Sahin, A. Willner, “ PMD monitoring by tracking the chromatic-dispersion-insensitive RF power of the vestigial sideband” IEEE Photon. Technol. Lett., 16, 2177 – 2179 (2004).
8 S. Dods, D. Hewitt, P. Farrell, K. Hinton, “A novel broadband asynchronous histogram technique for optical performance monitoring” Techn. Digest. , Optical Fiber Communication Conference, paper OThH2, Anaheim, California (March 2005). 9 Z. Li, and G. Li, “Chromatic dispersion and polarization-mode dispersion monitoring for RZ-DPSK signals based on asynchronous amplitude-histogram evaluation” J. Lightwave Technol., 24, 2859 – 2866 (2006). 10 F. Buchali, “Electronic Dispersion Compensation for Enhanced Optical Transmission” Techn. Digest., Optical Fiber Communication Conference, paper OWR5, Anaheim, California (March 2006). 11 W. Shieh, and C. Athaudage, “Coherent optical orthogonal frequency division multiplexing” IEE Electron. Lett. , 42, 587-589 (2006). 12 W. Shieh, W. Chen and R. S. Tucker, “Polarization mode dispersion mitigation in coherent optical orthogonal frequency division multiplexed systems” IEE Electron. Lett., 42, 996 – 997 (2006). 13 Y. Li, L. J. Cimini, N. R. , Sollenberger, “Robust channel estimation for OFDM systems with rapid dispersive fading channels” IEEE Trans. Commun., 46, 902-915 (1998). 14 S. Hara, and R. Prasa, ‘Multicarrier Techniques for 4G Mobile Communications’ Artech House, Boston, 2003. 15 J. Proakis, “Digital Communications” WCB/McGraw-Hill, New York, 3rd edition, Chapter 5. 16 N.S. Bergano, F.W.Kerfoot, C.R. Davidsion, “Margin measurements in optical amplifier system” IEEE Photon. Technol. Lett., 5, 304 – 306 (1993). 17 J. D. Berger and D. Anthon, “Tunable MEMS devices for optical networks” Opt. Photon. News, 14, no. 3, 43-49 (March 2003). 18 E. Ip, J. Kahn, d. Anthon, J. Hutchins, “Linewidth measurements of MEMS-based tunable lasers for phase-locking applications” IEEE Photon. Technol. Lett. , 17, 2029 – 2031 (2005). 19 A. Liu, G.J. Pendock, and R.S. Tucker, “Improved chromatic dispersion monitoring using single RF monitoring tone ” Optics Express, 14, 4611-4616 ( MAY 2006).
#76836 - $15.00 USD Received 6 November 2006; revised 25 December 2006; accepted 26 December 2006
(C) 2007 OSA 22 January 2007 / Vol. 15, No. 2 / OPTICS EXPRESS 356