optical observations of unidirectional solidification in microgravity · 2013-08-31 · tech...
TRANSCRIPT

NASA Technical Paper 2110
January 1983
"A
NASA ~
TP 2110 c. 1 I
I
t
Optical Observations of Unidirectional Solidification in Microgravity
Mary H. Johnston, Robert B. Owen, and Robert E. Shurney
I I LOAN COPY: RETURN TO
AFWL TECHNICAL LIBKAFSY KIRTLAND AFB, N. M.
f
https://ntrs.nasa.gov/search.jsp?R=19830008221 2020-06-26T15:52:02+00:00Z

TECH LIBRARY KAFB, NM
NASA Technical Paper 2110
1983
National Aeronautics and Space Administration
Scientific and Technical Information Branch
I Illill lllll lllll lllll11111llllllllll Ill1 Ill1
Optical Observations of Unidirectional Solidification in Microgravity
Mary H. Johnston, Robert B. Owen, and Robert E. Shurney George C. Marshall Space Flight Center Marshall Space Flight Center, Alabama

\

TABLE OF CONTENTS
Page
INTRODUCTION . . . . . . . . . . . . . . . . . . . . . . . . . . . . . . . . . . . . . . . . . . . . . . . . . . . . . . . . . . . . . . . . . 1
INSTRUMENTATION . . . . . . . . . . . . . . . . . . . . . . . . . . . . . . . . . . . . . . . . . . . . . . . . . . . . . . . . . . . . . 1
A. Experiment a1 Environment . . . . . . . . . . . . . . . . . . . . . . . . . . . . . . . . . . . . . . . . . . . . . . . . 1 B. Mach-Zehnder Interferometer. . . . . . . . . . . . . . . . . . . . . . . . . . . . . . . . . . . . . . . . . . . . . . 1 C. Laser Shadowgraph System. . . . . . . . . . . . . . . . . . . . . . . . . . . . . . . . . . . . . . . . . . . . . . . . 3 D. Laser Streak Photograph System. . . . . . . . . . . . . . . . . . . . . . . . . . . . . . . . . . . . . . . . . . . . 4
RESULTS . . . . . . . . . . . . . . . . . . . . . . . . . . . . . . . . . . . . . . . . . . . . . . . . . . . . . . . . . . . . . . . . . . . . . . . 4
A. Interferometric Results. . . . . . . . . . . . . . . . . . . . . . . . . . . . . . . . . . . . . . . . . . . . . . . . . . . 4
DISCUSSION . . . . . . . . . . . . . . . . . . . . . . . . . . . . . . . . . . . . . . . . . . . . . . . . . . . . . . . . . . . . . . . . . . . . 5
SUMMARY . . . . . . . . . . . . . . . . . . . . . . . . . . . . . . . . . . . . . . . . . . . . . . . . . . . . . . . . . . . . . . . . . . . . . . 6
REFERENCES . . . . . . . . . . . . . . . . . . . . . . . . . . . . . . . . . . . . . . . . . . . . . . . . . . . . . . . . . . . . . . . . . . . 23
iii

LIST OF ILLUSTRATIONS
Figure Title Page
1. Flight parabola of KC-135 low-gravity simulation aircraft. ....................... 7
2. Diagram of Mach-Zehnder interferometer. ................................... 8
3. Laser shadowgraph SPAR fluid motion simulator. ............................. 9
4. : Diagram of laser streak photography system. . . . . . . . . . . . . . . . . . . . . . . . . . . . . . . . . . 10
5. Cuvette assembly viewed along z-axis . . . . . . . . . . . . . . . . . . . . . . . . . . . . . . . . . . . . . . . 11
6. Ground-based interferograms of NH4C1 metal-model solution during initial solidification . . . . . . . . . . . . . . . . . . . . . . . . . . . . . . . . . . . . . . . . . . . . . . . . . . . . . . . . . . 12
7. Interferograms of NH4C1 metal-model solution during initial solidification . . . . . . . . . . 13
8. Ground-based interferograms of NH4C1 metal-model solution during solidification . . . . 14
9. Low-gravity inteferograms of NH4C1 metal-model solution during solidification . . . . . . 15
10. NH4C1 solution refractive indices versus concentration. . . . . . . . . . . . . . . . . . . . . . . . . . 16
11. NH4Cl solution refractive indices versus temperature . . . . . . . . . . . . . . . . . . . . . . . . . . . 17
12. Low-g and ground-based experimental NH4C1 centerline temperature distribution for various times (sec). . . . . . . . . . . . . . . . . . . . . . . . . . . . . . . . . . . . . . . . . . . . . . . . . . . 18
13. Concentration shift from bulk to center of plume. . . . . . . . . . . . . . . . . . . . . . . . . . . . . . 19
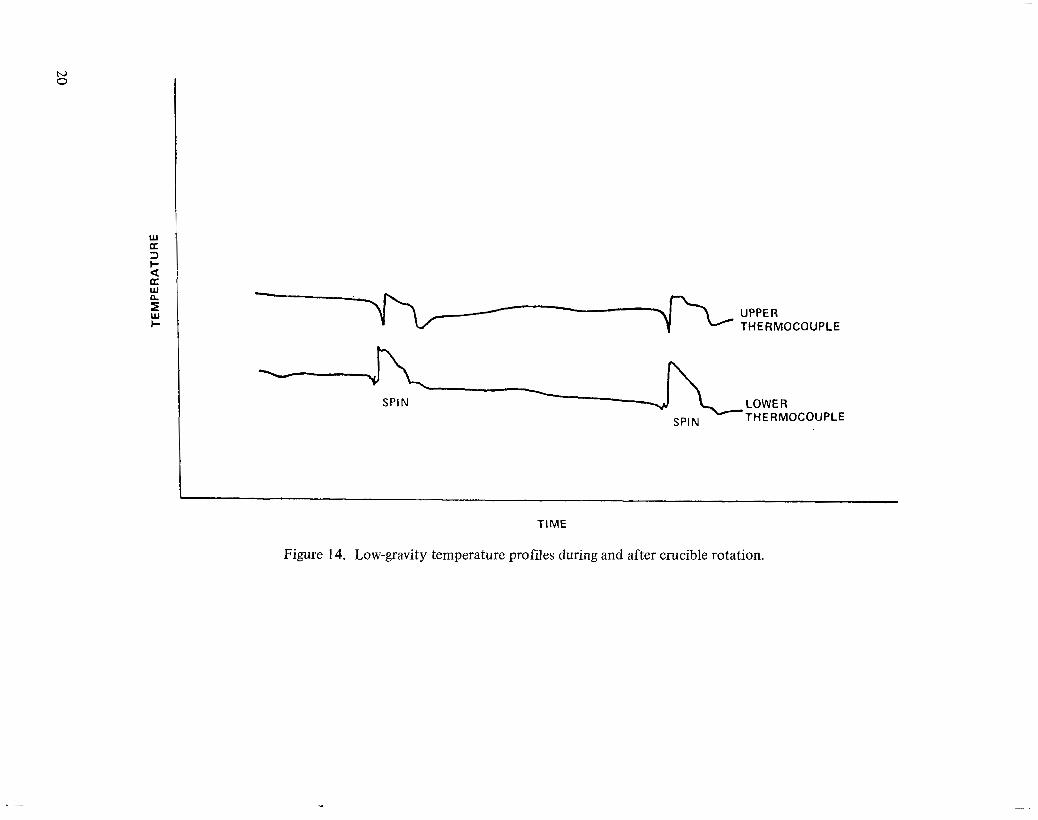
14. Low-gravity temperature profiles during and after crucible rotation . . . . . . . . . . . . . . . . 20
15. Split screen photographs of fluid motion decay on the ground and in low-gravity . . . . . 21
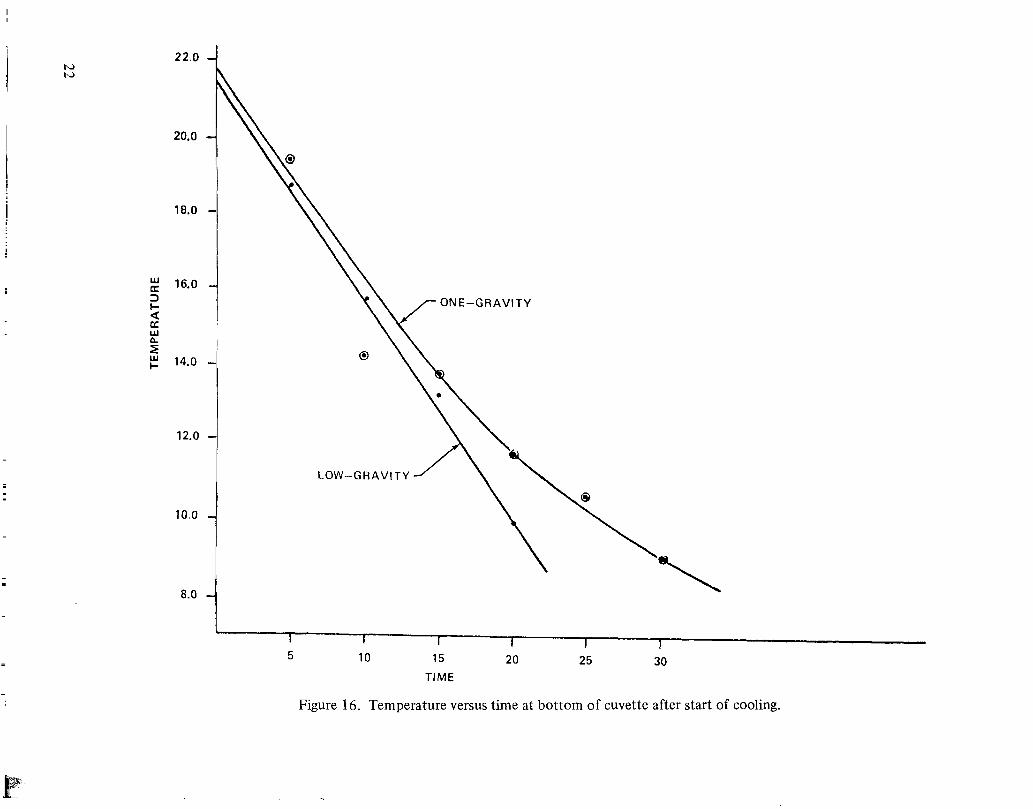
16. Temperature versus time at bottom of cuvette after start of cooling. . . . . . . . . . . . . . . . 22
iv

TECHNICAL PAPER
OPTICAL OBSERVATIONS OF UNIDIRECTIONAL SOLIDIFICATION IN MICROGRAVITY
I NTRODUCT ION
Since gravity-induced effects are thought to impede structural and compositional control during solidification of materials, the application of the low-gravity space flight environment to the advancement of materials science and technology constitutes one of the more active NASA research programs [ 11. Although several solidification experiments have already been conducted in a low-gravity environment [2-41 , none of these has utilized optical systems such as interferometers to study the fluid thermal and concentration profiles.
The present experiments used advanced optical measurement techniques to observe unidirectional solidification of a saturated solution of NH4Cl-H20. This material has been used extensively as a transpar- ent metal-model system in solidification experiments [ 51 and in low-gravity suborbital rocket studies [6]. In particular, it is a good analog for the casting of complex materials such as superalloys. Experimentation has included studies of growth morphology, dendrite remelting and coarsening, and fluid instabilities. In this material system the fluid ahead of the interface is lighter than the initial fluid, causing the eruption of jet-like plumes. This phenomena is associated with freckling in superalloys [7] . The present study was undertaken to quantify the changes occurring as a result of gravity forces on the liquid phase during solidification.
Preliminary studies included development of low-gravity optical systems by theoretical and experi- mental approaches [ 8,9] and laser shadowgraph/schlieren observations of low-gravity fluid flow [ 10,11] . This earlier work measured reduction of natural convection fluid flows resulting from thermally and com- positionally induced density gradients. Such flows are important during compositional segregation in crystal growth and solidification processes [ 121.
INSTRUMENTATION
A. Experimental Environment
All low-gravity experiments were conducted in the NASA KC-135 aircraft. This experimental environment has been described in detail elsewhere [ 101. In brief, the KC-135 low-gravity simulation aircraft flies a series of parabolic (Keplerian) trajectories, each of which yields approximately 25 sec of low (1 x 1 0-2 g) gravity environment. A typical parabola is shown in Figure 1.
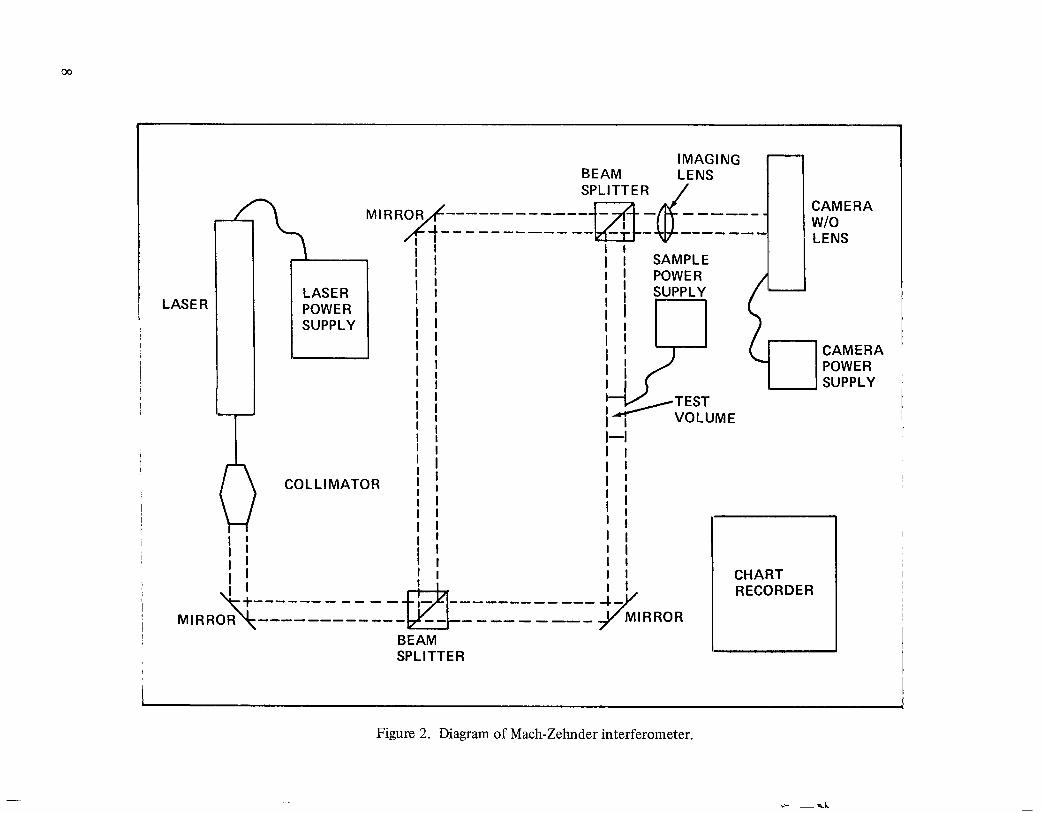
B. Mach-Zehnder Interferometer
The Mach-Zehnder interferometer is probably the most versatile interferometric configuration for the observation of refractive index fields. It allows one to arbitrarily orient, space, and localize the inter- ference fringes, and it separates the reference and test beams, allowing the reference beam to pass through
a uniform field. Also, with this arrangement the test beam passes through the disturbed region only once, resulting in a sharp image and a well-defined test path. Operational details of this instrument have been well described [ 13,141, and a system diagram is shown in Figure 2.
We will consider two-dimensional liquid test fields in which the only refractive index variations ' along the test beam are the sharp discontinuities at the entrance and exit of the test cell. In such cases
when the beams are recombined parallel to each other, each interferometric fringe represents the locus of points (in a two-dimensional field) where the fluid density is constant. These fringes can then yield qualitative temperature or concentration data, provided the fluid refractive indices are known in these terms and temperature and concentration profiles are not mixed. Normal operation requires a reference point in the test beam cross section where the properties are known, and then all properties at other loca- tions in the test cell are measured relative to the properties there.
For such a field the refractive index at any point in the test cell is given by
where
ho = vacuum wavelength
E = optical path length difference in terms of Xo
L = length of test cell
nref = refractive index at reference point .
In practice a Mach-Zehnder interferometer is commonly used with the beams slightly diverging at an angle 8. Recombination of the test and reference beams then gives rise to wedge fringes separated by a space d, where
This configuration allows measurement of fraction values of E.
Since light has an extremely short wavelength, equations (1) and (2) infer that the system is extremely sensitive to vibration and requires careful alignment. For example, if the fringes are separated by 6 mm, this means that 8 is approximately 10- rad; thus the two beams must be aligned to this divergence. 4
Further, since splitters cause successfully in
changes in path length are measured in terms of X, slight movements in mirrors or beam violent fringe shifts. An extremely rugged system was, therefore, required in order to operate the aircraft experimental environment outlined earlier.
r
2

To satisfy these design requirements, all system components were mounted onto a custom Newport Research optical breadboard. This slab was a 90- x 120- x 10-cm aluminum honeycomb with stainless steel top, bottom, and sides. The slab was vibration isolated from the aircraft using Varry W. Series ring and bushing elastomeric mounts. Mirrors and beam splitters were positioned using reinforced Newport Research mounts. The laser, a 4 mW He-Ne Spectra-Physics Model 144, had its beam expanded to 2.54 cm and collimated by a Spectra-Physics Model 332 spatial filter and a S-P Model 333 collimator. The 3-micron spatial filter pinhole was aligned using a modified NR Model 600 A-2 mount which stayed in place even while the 180-kg system was loaded onto the KC-135 by forklift. Interferograms were recorded by a Nikon 35 mm motor-driven camera with a 250-exposure film cassette. Pan-X film was used, and exposure times were set at 1/1000 sec, which solved any remaining vibration problems. The laser, camera, and test cell
I
f 1 I were controlled from a central power strip on the slab.
C. Laser Shadowgraph System
The operation of a shadowgraph system depends upon the deflection of a light beam, unlike inter- ferometry in which such refractive effects are undesirable. In a shadowgraph system the linear displacement of the perturbed light beam is measured, and the end result is an image whose contrast is given by [ 141
where
IT = initial beam intensity
AI = IO - IT where IO = beam intensity in image plane
zsc = distance from test cell to image plane
na = refractive index of air
n = refractive index of perturbing medium (assumed to vary in y only)
z = direction of initial light beam .
Unlike interferometry, shadowgraph is rarely used for quantitative measurements, since the contrast would have to be accurately measured and equation (3) integrated twice to obtain the distribution of interest. However, if large density gradients are present, shadowgraph pictures can be very useful.
In the present study a laser shadowgraph system was used to track concentration boundary layer transitions in a rotating sample. A system diagram is shown in Figure 3. Components were mounted similarly to those utilized in the Mach-Zehnder interferometer described, and several identical items were used in both systems.
3

D. Laser Streak Photograph System
In laser streak photography, the fluid of interest is seeded with tracer particles which are then illuminated by a sheet of laser light [ 151. A system diagram is shown in Figure 4. By setting the camera shutter for one long exposure, streak photographs are obtained which indicate fluid velocity vectors in the plane of illumination. In the present study streak photography was used to measure fluid motion independ- ent from temperature and concentration profiles.
RESULTS
f I
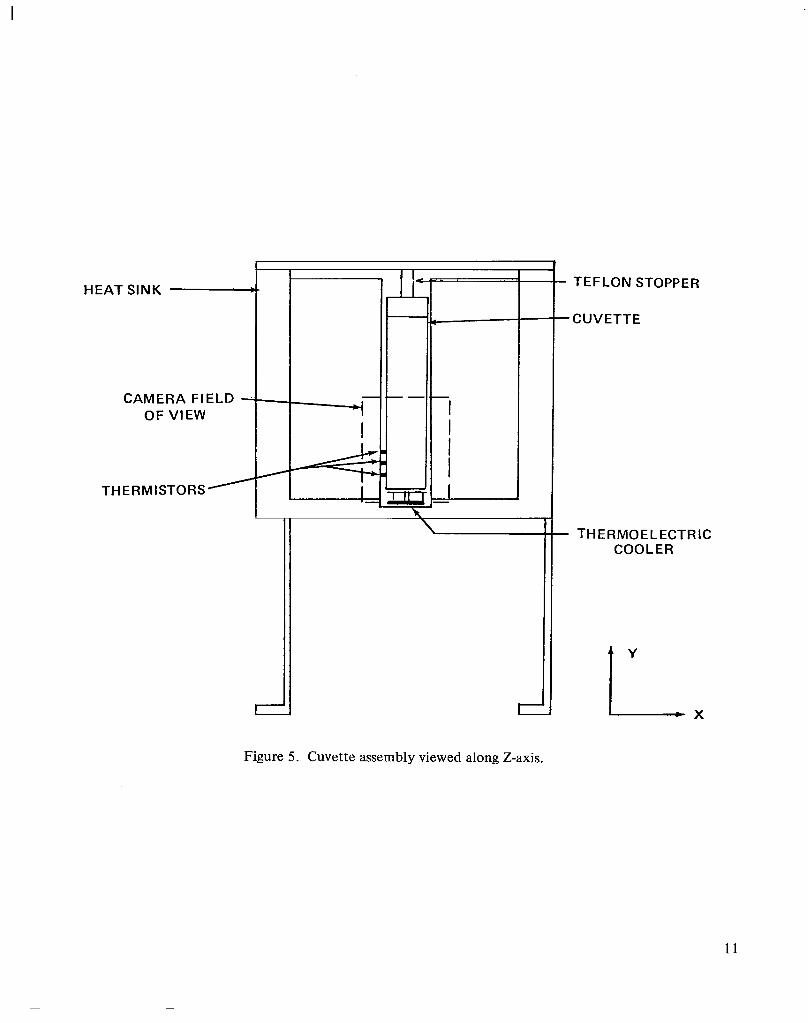
A saturated NH4CI-H20 solution was prepared at 22°C and then encapsulated in a quartz cuvette sealed with a teflon cork. The cuvette was contained in an assembly (Fig. 5) previously developed for sounding rocket flights, allowing the sample to be heated and cooled as required. The solution was then studied during solidification both on the ground and in the KC-135 low-gravity simulation aircraft.
A. Interferometric Results
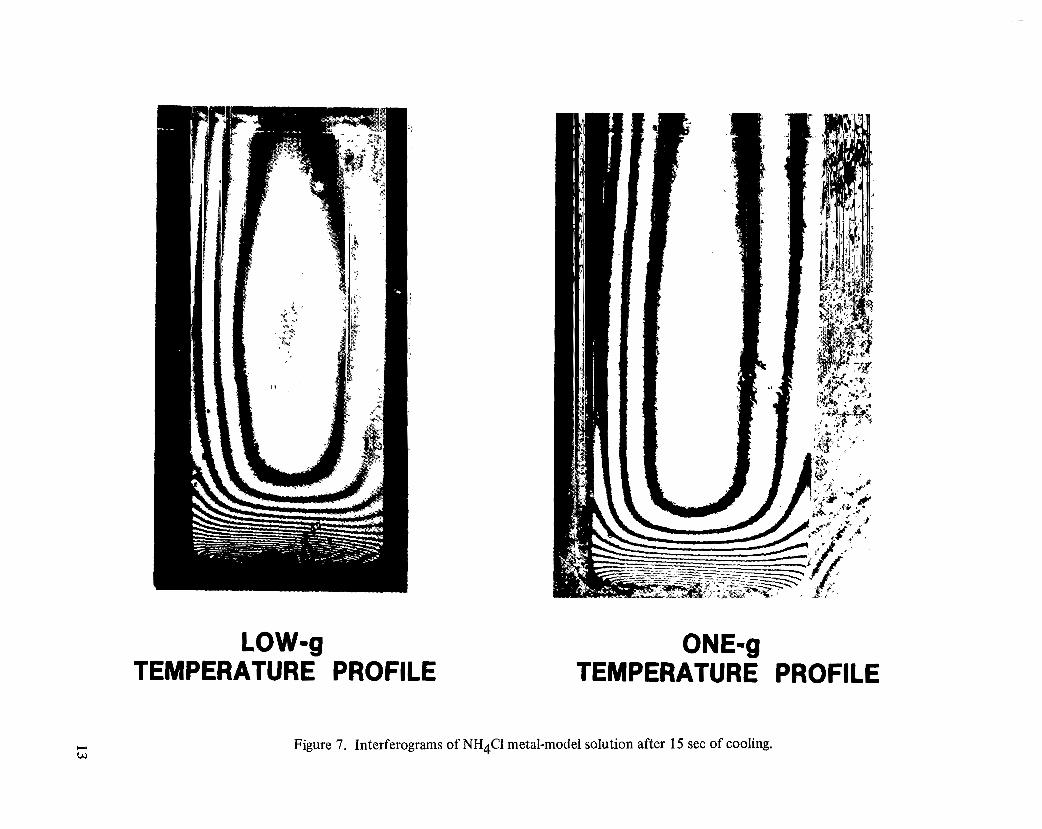
The interferograms in Figures 6 through 9 show temperature and concentration profiles. Figure 6 shows fluid temperature profiles as the solution is undercooled prior to solidification. Figure 7 compares ground-based and low-gravity temperature profiles. Figure 8 shows concentration profiles in growth plumes resulting from gravity-induced convection, and Figure 9 shows stabilized concentration profiles in the absence of gravity-induced convection.
In order to analyze these interferograms, refractive index data were taken for NH4Cl-H20. These indices were obtained using a Bellingham and Stanley Model 60/ED refractometer with test cell tempera- ture determined by a Neslab Model RTE-4 circulating bath controlled at +O.O2"C. These data are shown in Figures 10 and 1 1. From Figure 10 a 1 percent change in concentration +An = 0.00 187 is calculated, and from Figure 1 1 a 1 "C change in temperature +An = 0.000 12 is calculated. Using equation (1)
XOE An=-
L
Thus, for Xo = 6 3 2 3 nm and E = 1,
An = 6.33 x for L = 1 cm
An = 6.33 x for L = I mm .
(4)
Therefore,
E = 1.95 for T = l"C(1 cmtestcell)
4
e = 2.95 for C = 1 percent (1 mm growth plume) .
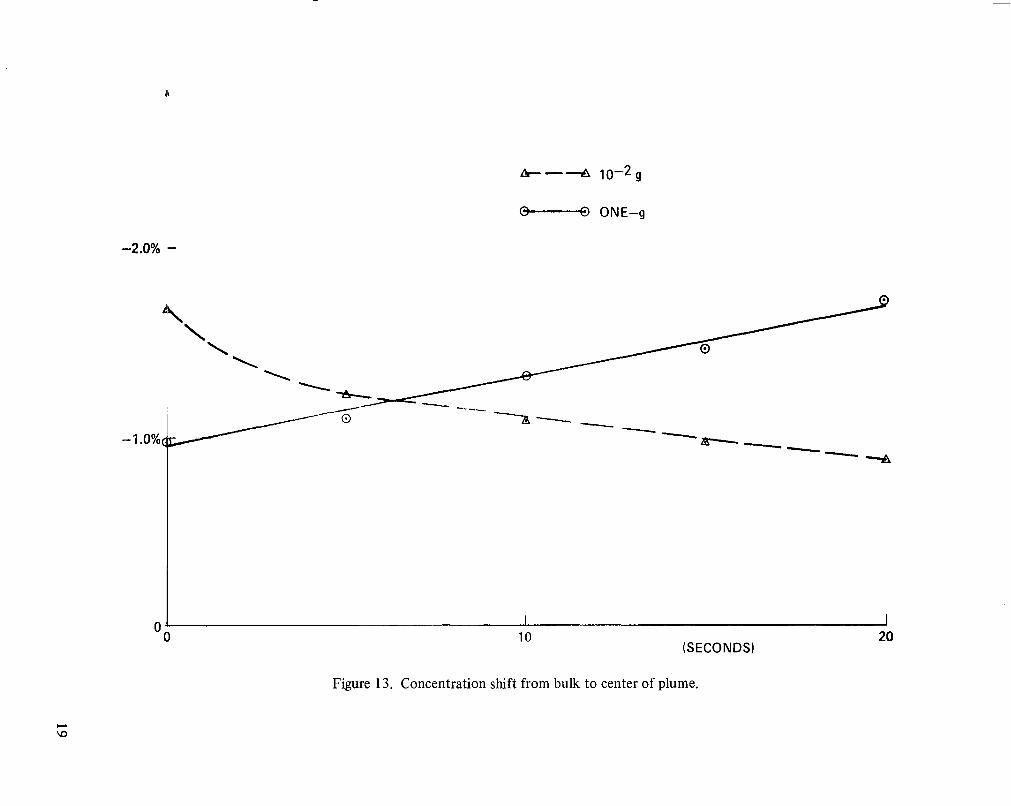
The results were used to calculate the temperature and concentration profiles shown in Figures 12 and 13.
Thermocouple measurements were made to provide data in the instances where the magnitude of flow precluded analyses of the optical test results. Chromel-alumel thermocouples were first coated with a thin layer of epoxy to protect them from the corrosive liquid, and then placed at 1 cm intervals inside the cuvette. Since there was concern that the thermocouples might affect the flow, they were used two at a time over different heights. In the rotating assembly, the millivolt signal was transmitted through a slip ring. In all instances, the data were recorded on a Honeywell recorder using a hot-pen stylus to eliminate gravitational effects on the ink flow.
7 I i
Particularly in the assembly which was rotated for 5 sec during the low-gravity period, the data had to be obtained with thermocouples. As shown in Figure 14, at the onset of spinning, each TC saw a pulse of cool fluid, then the overall temperature increased. The upper TC showed a greater cooling pulse, but less overall temperature change; whereas, the lower TC had the opposite effect. Figure 15 shows split screen photographs of the fluid motion decay on the ground and in low gravity. When the apparatus was station- ary, it was possible to use optical techniques to study the plumes occurring ahead of the interface as a result of gravity created instabilities. The concentration shift from the bulk to the center of the plumes is given in Figure 13 for the two gravity levels.
D I SCUSS I ON
The change in temperature with time in the cuvette was determined from the thermal profiles and is shown in Figure 16. The low-g and 1-g cases parallel each other for the first 15 sec of cooling. Then the 1-g fluid cooling rate begins to decrease while the low-g fluid continues to cool at the initial constant rate. Although nothing was visible in the interferometric photographs to explain this divergence, the streak photographs showed convection cells at the base of the cuvette within 20 sec after cooling began. Cool liquid flowed down the walls of the cuvette, initiating the cells. Particles in the fluid were moving on the order of 0.05 mm/sec. This convection would decrease the rate of cooling by mixing warmer fluid with the liquid. The effect can be seen in the temperature gradient. After only 20 sec, the temperature gradient in 1-g is 40"C/cm, 15 percent less than the 46"C/cm gradient in low-gravity.
Once a growth front has begun, a layer of less dense liquid forms ahead of the interface. In 1-g, this reached a width of 0.17 cm whereupon plumes broke loose and rose upwards [ 111. In low-gravity interface, layers varied between 0.18 and 0.27 and no plumes occurred. The sample was able to establish and maintain a layer of concentration change ahead of the interface, with no perturbations.
In the instances where solidification and subsequent fluid plumes were allowed to begin prior to the low-gravity time period, the plumes reacted oppositely under the two gravity forces. During the low- gravity parabola, the plume movement halted within 8 sec and the concentration gradient between the plume and the surrounding liquid decreased. It is probable that with sufficient time, diffusion would totally eliminate the plume. But in 1-g, the concentration gradient increased, causing the plume to continue growing. In this case the plume is being replenished by light, cool liquid while it is rising into the denser, warmer surrounding fluid.
5
I
These effects would tend to decrease the overall stability of directional solidification in 1-g. The rate of heat removal changes as convection cells begin, and the temperature gradient ahead of the interface is less, decreasing the effective temperature gradient to growth rate (G/R) ratio. In materials such as NH4CI- H20 and some of the superalloys in which the eutectic liquid is lighter, flow instabilities like plumes can develop creating freckles and small grains in 1-g castings.
SUMMARY f
I
Gravity has both subtle and dynamic effects on the temperature profiles in solidifying materials. Shortly after the onset of cooling, low levels of fluid flow begin in 1-g, decreasing the temperature gradient. This does have a concurrent effect on the G/R ratio and tends to decrease the stability of the interface. In low-gravity the interface appears to be more stable since the temperature gradient is steeper.
The gravity-driven pulses of liquid, causing freckling in superalloys, do not occur in low-gravity. Any existing plumes of this rich eutectic liquid dampen quickly, and diffuse into the surrounding fluid. This is opposite to what happens in I-g, where the density difference between the freckle plume and the surrounding liquid continues to increase as the plume rises, leading to greater instability.
6

10.0
9.5 v) CC w tJ E 9.0 0
Y w 8.5 0 3 I-
5' 8.0
J
\
-
- a
7.5
45' NOSE HIGH
840 Km/Hr 2G
520 Km/Hr.
ZERO G
NORMAL FLIGHT
2HOURS 0 40 PARABOLAS
2G 840 Km/Hr
I I 0 20 45 65
ZERO GRAVITY MANEUVER (SECONDS)
Figure 1. Flight parabola of KC-1 35 low-gravity simulation aircraft.
IMAGl NG BEAM SPLITTER /
LASER
M
LASER POWER SUPPLY
‘ I
Q
I I I I I SAMPLE
CAMERA w/o LENS
COLLl MATOR
I I I I I I I I I I I !
i I I I I I I I I I I I
BEAM SP L I TTE R
CAMERA POWER SUPPLY
CHART RECORDER

a
a W v)
LASER POWER SUPPLY
1
35" CAMERA / I (LENS) 1
/ / ~n
/ COLLlMATOn
I
16" MOTION PICTURE CAMERA
ISWITCHED POWER STRIP^
SAMPLE POWER SUPPLY
Ct RT RECORDER
~~~ ~
Figure 3. Laser shadowgraph SPAR fluid motion simulator.

K W
3
-
SHUTTER RROR
1 LENS
PINHOLE -
, CYLINDRICAL LENS
- SLIT
- SLIT
I
,TRACER PARTICLES
Figure 4. Diagram of laser streak photography system.
10
H EAT SINK L-
CAMERA FIELD OF VIEW
A
I - -
t
- - - ._ 4 I
I I
- TEFLON STOPPER
-CUVETTE
I - THERMOELECTRIC COOLER
Figure 5. Cuvette assembly viewed along Z-axis.

12
t = O t =30 seconds
t =90 seconds t = 120 seconds
Figure 6, Ground-based interferograms of NH4C1 metal-model solution during initial solidification.
c. w
LOW-g TEMPERATURE PROFILE
ONE-Q TEMPERATURE PROFILE
Figure 7. Interferograms of NH4Cl metal-model solution after 15 sec of cooling.

I Ill11 ll11ll1
t =o
t = 10 seconds
t = 5 seconds
t = 20 seconds
Figure 8. Ground-based interferograms of NH4CI metal-model solution during solidification.
14

TIME = 10 SECONDS TIME = 15 SECONDS
Figure 9. Low-gravity interferograms of NH4C1 metal-model solution during solidification.

X = 632.8nm T = 22.0°C
A
27.0 -
26.0 -
25.0 -
24.0 - 23.0 -
22.0 -
21.0 -
1.368 1.370 1.372 1.374 1.376 1 I 1 I w
1.378 1.380 1.382 1.384
INDEX OF REFRACTION
Figure 10. NH4C1 solution refractive indices versus concentration.
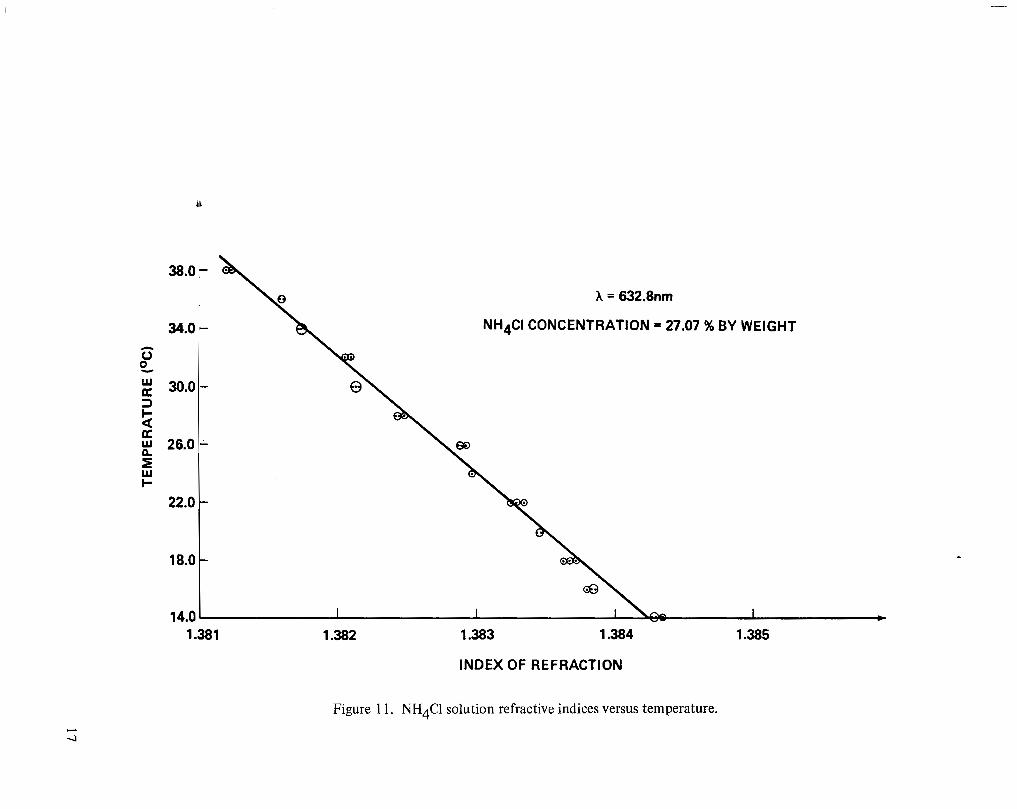
X = 632.8nm
NH4CI CONCENTRATION = 27.07 % BY WEIGHT
INDEX OF REFRACTION
Figure 1 1. NH4Cl solution refractive indices versus temperature.

22.0
20.0
18.0
0 0
16.0
14.0
12.0
INITIAL TEMPERATURE = 22OC
THERMOELECTRIC
1 I
10.0 ,#-/ COOLER
i 8.0 ' I I I I I I I I I r.
1 .o 2.0 3.0 4.0 5.0 6.0 7.0 8.0 9.0 0
DISTANCE FROM COOLING SURFACE, y (mm)
Figure 12. Low-g and ground based experimental NH&1 centerline temperature distributions for various times (sec).
-2.0% -
-1.0%
I I 0 10 20
0 (SECONDS)
Figure 13. Concentration shift from bulk to center of plume.
h) 0
w U 3 I- U a
I c
W n.
w UPPER THERMOCOUPLE
TIME
Figure 14. Low-gravity temperature profiles during and after crucible rotation.

TIME: 0 SECONDS TIME: 5 SECONDS
TIME: 10 SECONDS TIME: 15 SECONDS
Figure 15. Split screen photographs of fluid motion decay on the ground (left half of photos) and in low-gravity (right half of photos).
I
I
N t3
w a 3 I- < CT w
5 W I-
22.0
20.0
18.0
16.0
14.0
12.0
10.0
8.0
I I I I I I 10 15 20 25 30 5
TIME
Figure 16. Temperature versus time at bottom of cuvette after start of cooling.

REFERENCES
1. Naumann, R. J. and Herring, H. W.: Materials Processing in Space: Early Experiments. NASA SP- 433, 1980.
2. Wiedemeier, H., Klaessig, F. C., Irene, E. A., and Wey, S . J.: J. Crystal Growth, vol. 31, 1975, pp. 36-43.
3. Witt, A. F., Gatos, H. C., Lichtensteiger, M., Lavine, M. C., and Herman. C. J.: J. Electrochem. SOC., V O ~ . 122, 1975, pp. 276-283.
4. Lind, M. D.: AIAA J., vol. 16, 1978, pp. 458-462.
5. Kackson, K. A. and Hunt, J. D.: Acta Met., vol. 13, 1965, pp. 1212-1215.
6. ’ Johnston, M. H., Griner, C. S . , Parr, R. A., and Robertson, S . J.: J. Crystal Growth, vol. 50, 1980, pp. 831-838.
7. Giamei, A. F. and Kear, B. H.: Met. Trans, vol. 1 , 1970, p. 2185.
8. Owen, R. B.: Opt. Letters, vol. 6, 1981, pp. 331-333.
9. Owen, R. B.: Appl. Opt., vol. 21, April 15, 1982.
10. Owen, R. B.: Opt. Eng., vol. 20, 1981, pp. 634-638.
11. Owen, R. B. and Johnston, M. H.: Opt. Lasers Eng., vol. 2, 1981, pp. 129-146.
12. Carruthers, J. R.: J. Cryst. Growth, vol. 42, 1977, pp. 379-385.
13. Miller, R. H.: Advances in Electrochemistry and Electrochemical Engineering. Edited by P. Delahay and C. W. Tobias, vol. 9, John Wiley and Sons, N.Y., 1973, pp. 281-368.
14. Goldstein, R. J.: Measurements in Heat Transfer. Edited by E. R. G. Eckert and R. J. Goldstein, McGraw-Hill, New York, 1976, pp. 241-293.
Owen, R. B. and Campbell, C. W.: Rev. Sci. Instrum., vol. 51, 1980, pp. 1504-1508. 1
15.
23
L - - 1. REPORT NO. 2. GOVERNMENT ACCESSION NO.
- .. - NASA TP-2110
4. T I T L E AND SUBTITLE
Optical Observations of Unidirectional Solidification in Microgravity I
E. Shurney 9. PERFORMING ORGANIZATION NAME AND ADDRESS
George C. Marshall Space Flight Center Marshall Space Flight Center, AL 358 12
12. SPONSORING AGENCY NAME AND ADDRESS
National Aeronautics and Space Administration Washington, D.C. 20546
~___ .. _ _ 3. RECIPIENT'S CATALOG NO.
5 . REPORT DATE
__ January 1983
~
6. PERFORMlNG ORGANIZATION CODE
8. PERFORMING ORGANIZATION REPOR r
0. WORK UNIT NO.
M-399 1. CONTRACT OR GRANT NO.
3. TYPE OF REPORY & PERIOD COVERE
Technical Paper 4. SPONSORING AGENCY CODE
Prepared by Materials and Processes Laboratory, Systems Analysis and Integration Laboratory, and Space Science Laboratory, Science and Engineering.
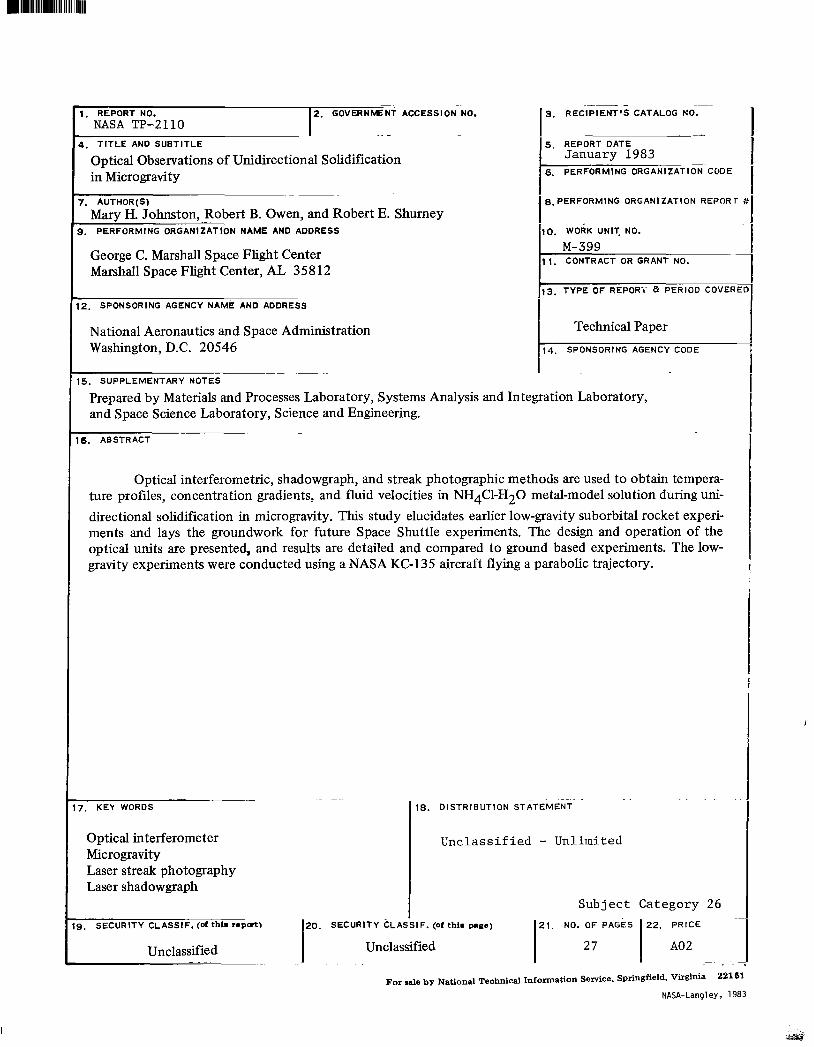
Optical interferometric, shadowgraph, and streak photographic methods are used to obtain tempera- ture profiles, concentration gradients, and fluid velocities in NH4Cl-H20 metal-model solution during uni- directional solidification in microgravity. This study elucidates earlier low-gravity suborbital rocket experi- ments and lays the groundwork for future Space Shuttle experiments. The design and operation of the optical units are presented, and results are detailed and compared to ground based experiments. The low- gravity experiments were conducted using a NASA KC-135 aircraft flying a parabolic trajectory.
17.' KEY WORDS
Optical interferometer Microgravity Laser streak photography Laser shadowgraph
19. SECURITY CLASSIF. (d thl. r.Pa't)
Unclassified ~. - .
. 18. DISTRIBUTION STATEMENT
Unclassified - Unlimited
Subject Category 26 -~
21. NO. OF PAGES 22. PRICE I
SECURITY CLASSIF. (or thi.
Unclassified I A02 - . . -
F~~ de by ~ ~ t i ~ ~ d Technical Information Service, Springfield. Virginia 22161
NASA-Langley, 1983
I
National Aeronautics and Space Adm in ist rat ion
THIRD-CLASS BULK RATE
Washington, D.C. 20546 Official Business
Penalty for Private Use, $300
Postage and Fees Paid National Aeronautics and Space Administration NASA451
I USMAIL
NASA ~ o s T M , Q ~ ~ ~ : If Undeliverable (Section 158 Postal Manual) Do Not Return
i
. .
, ' .