optical emission studies of nitrogen plasma generated …€¦ · 2 instituto de estructura de la...
TRANSCRIPT

Optical emission studies of nitrogen plasma generated by IR CO2 laser pulses
This article has been downloaded from IOPscience. Please scroll down to see the full text article.
2007 J. Phys. B: At. Mol. Opt. Phys. 40 4573
(http://iopscience.iop.org/0953-4075/40/24/003)
Download details:
IP Address: 161.111.22.141
The article was downloaded on 13/12/2012 at 09:38
Please note that terms and conditions apply.
View the table of contents for this issue, or go to the journal homepage for more
Home Search Collections Journals About Contact us My IOPscience

IOP PUBLISHING JOURNAL OF PHYSICS B: ATOMIC, MOLECULAR AND OPTICAL PHYSICS
J. Phys. B: At. Mol. Opt. Phys. 40 (2007) 4573–4590 doi:10.1088/0953-4075/40/24/003
Optical emission studies of nitrogen plasma generatedby IR CO2 laser pulses*
J J Camacho1, J M L Poyato1, L Dıaz2 and M Santos2
1 Departamento de Quımica-Fısica Aplicada, Facultad de Ciencias, Universidad Autonoma deMadrid, Cantoblanco, 28049 Madrid, Spain2 Instituto de Estructura de la Materia, CFMAC, CSIC, Serrano 121, 28006 Madrid, Spain
E-mail: [email protected]
Received 12 July 2007, in final form 26 September 2007Published 19 November 2007Online at stacks.iop.org/JPhysB/40/4573
AbstractLarge-scale plasma produced in nitrogen gas at room temperature andpressures ranging from 4 × 10³ to 1.2 × 10⁵ Pa by high-power laser-induced dielectric breakdown (LIDB) has been investigated. Time-integratedoptical nitrogen gas spectra excited from a CO2 laser have been measuredand analysed. The spectrum of the generated plasma is dominated by theemission of strong N+ and N and very weak N2+ atomic lines and molecularfeatures of N+
2
(B2�+
u –X2�+g
), N+
2(D2�g–A2�u), N2(C3�u–B3�g) and veryweak N2
(B3�g–A3�+
u
). The relative intensities of the 0–0 band heads in
the N2(C–B) and N+2(B–X) systems are very weak as compared with the
chemiluminescence spectrum of nitrogen formed in a glow discharge. Anexcitation temperature Texc = 21 000 ± 1300 K was calculated by meansof the relative intensity of ionized nitrogen atomic lines assuming localthermodynamic equilibrium. Optical breakdown threshold intensities in N2 at9.621 µm have been determined. The physical processes leading to the LIDBof nitrogen in the power density range 0.4 < J < 4.5 GW cm−2 have beenanalysed. From our experimental observations we can suggest that, althoughthe first electrons must appear via multiphoton ionization or natural ionization,electron cascade is the main mechanism responsible for the LIDB in nitrogen.
(Some figures in this article are in colour only in the electronic version)
1. Introduction
It is well known that gases such as N2 under normal absorption conditions are relativelytransparent to laser radiation. Since nitrogen is a homonuclear diatomic molecule, the
* In Memoriam: Professor Antonio Pardo Martinez.
0953-4075/07/244573+18$30.00 © 2007 IOP Publishing Ltd Printed in the UK 4573

4574 J J Camacho et al
vibration–rotation and pure rotation spectra are not allowed, hence N2 exhibits no infraredspectrum. However, when the laser intensity increases and reaches a certain threshold value,as happens with high-power lasers (ruby, Nd:YAG, CO2, iodine, XeF excimer, etc), they are nolonger transparent. Laser-induced dielectric breakdown (LIDB) is characterized by a brilliantflash and a cracking noise. Since its discovery in the early 1970s, LIDB has been the subject ofmany investigations [1–5]. The two principal mechanisms involved in LIDB are multiphotonionization (MPI) and avalanche collisionally induced ionization (electron cascade) throughinverse bremsstrahlung (IB). The MPI phenomenon supposes the simultaneous absorption ofmany infrared photons of the same frequency by a single molecule. The IB process assumesthe presence of initial free electrons that absorb energy from the intense electromagnetic fieldassociated with the laser beam, until they have enough energy to ionize the surrounding mediaupon collisions. This produces other electrons which are in turn accelerated, resulting in anexponential rate of growth of the ionization process. The contributions of the MPI and IBmechanisms to the plasma formation depend on the kind of gas, pressure, pulse length, beamsize of the laser, laser wavelength and laser power energy.
One of the most spectroscopically studied diatomic molecules is nitrogen. An extensivecompilation and critical review of the observed electronic band systems of the N2 moleculeand its ions has been reported by Lofthus and Krupenie [6]. As the principal component ofthe Earth’s atmosphere, nitrogen plays a significant role in atmospheric phenomena includingauroras and airglows. In laboratory, nitrogen is often present in gas mixtures in discharges,including various laser gas media as the CO2 laser used in these experiments.
Several groups have examined the LIDB emission from nitrogen by using different high-power lasers: iodine photodissociation laser [7], CO2 laser [8], ruby laser [9], neodymium–glass laser [10] and soft x-ray free-electron laser [11]. The LIDB nitrogen spectrum recordedby Babankova and co-workers [7] in the spectral region 300–700 nm is composed of onebroadband formed from unresolved lines of N+ and from the v′ = 0 − v′′ = 0 electronictransition of N+
2(B2�+
u –X2�+g band system). The LIDB spectra from N2 reported by Nordstrom
[8] and Hanafi et al [9] are composed of N and N+ atomic lines without identification of anymolecular emission. The LIDB studies of molecular nitrogen reported by Baravian et al[10] and Sorokin et al [11] detect several ion species N+, N+
2 and N22+ by ion time-of-flight
spectroscopy.In this work, optical emission spectroscopy (OES) has been used to investigate the
chemical consequences of LIDB in nitrogen gas. The plasma generated is dominated bythe emission of strong N+ and N and very weak N2+ atomic lines and molecular featuresof N+
2
(B2�+
u –X2�+g
), N+
2(D2�g–A2�u), N2(C3�u–B3�g) and N2(B3�g–A3�+
u
). The most
intense molecular band is N+2(B–X). Surprisingly, the relative intensities of the 0–0 band
heads in the N2(C–B) and N+2(B–X) systems are very weak. The excitation temperature
was obtained by means of the relative intensity of N+ lines assuming local thermodynamicequilibrium (LTE). The LIDB spectrum has been compared with the band spectrum of anitrogen-filled Geissler tube formed in a glow discharge. This spectrum is dominated bythe emission of strong molecular features N2(C3�u–B3�g) and N2
(B3�g–A3�+
u
)and weak
N+2
(B2�+
u –X2�+g
). The strong differences shown by both LIDB and glow discharge spectra
must be connected with the different excitation mechanisms. On the other hand, the LIDBemission spectrum recorded here is rather similar, both in the excited neutral N fragmentsand N+, N2+ ionic fragments, to the spectrum produced by an inner-shell excitation ofnitrogen (1s-π∗ at 401 eV) using a synchrotron radiation from the SuperACO storage ringreported by Marquette and co-workers [12]. Optical breakdown threshold intensities in N2 at9.621 µm have been determined for pressures ranging from 4 × 10³ to 1.2 × 10⁵ Pa. Themost important physical processes in the LIDB of nitrogen at the power density range 0.4 <

Optical emission studies of nitrogen plasma generated by IR CO2 laser pulses 4575
Figure 1. Schematic diagram of the experimental set-up for laser-induced breakdown.
J < 4.5 GW cm−2 have been analysed. From our experimental observations we can proposethat, although the first electrons must emerge via MPI or natural ionization, electron cascadeis the most important mechanism responsible for the laser-induced breakdown in nitrogen.
2. Experimental details
The experimental configuration used in this work is shown in figure 1. The light sourceused was a Lumonics model K-103 transverse excitation atmospheric CO2 laser operatingwith a 8:8:84 mixture of 12CO2:N2:He. The laser is equipped with frontal Ge multimodeoptics (35% reflectivity) and a rear diffraction grating with 135 lines mm−1 blazed at10.6 µm. The CO2 laser irradiation of nitrogen was carried out using the 9P(28) line at1039.36 cm−1. This wavelength was checked with a 16-A spectrum analyzer (Optical Eng.Co.). The pulse temporal profile was monitored with a photon drag detector (Rofin Sinar7415). The pulse consisted of a spike (60 ns-FWHM) and a tail lasting approximately 3 µs.The optical breakdown was produced in a pyrex cell of 4.5 cm diameter and 43 cm lengthequipped with two NaCl windows for the IR laser beam orthogonal to two quartz windowsfor optical detection. Focused geometry was used by placing a lens (24 cm focal length)in front of the cell for the CO2 laser beam. The CO2 laser fluence was calculated as theratio of the pulse energy (measured in front of the lens with a Lumonics 20D pyroelectricdetectors through a Tektronix TDS 540 digital oscilloscope) and the 1/e cross-sectional beamarea (measured at the cell position with a pyroelectric array Delta Development Mark IV).In our experimental conditions, fluences of around 100 ± 10 J cm−2 were used. Betweenthe two measurement series, the vacuum chamber was evacuated with a rotary pump with aresidual pressure of 5 Pa. During the experiments, the chamber was filled with N2 at pressuresranging from 4 × 10³ to 1.2 × 10⁵ Pa, measured by a mechanical gauge. The plasma plumewas imaged by a collecting optical system onto the entrance slit of different monochromators.

4576 J J Camacho et al
Figure 2. Four images of the laser-induced breakdown of nitrogen at atmospheric pressure atdifferent times of the experiment.
Two spectrometers were used: ISA Jobin Yvon Spex (Model HR320) 0.32 m equipped witha plane holographic grating (2400 grooves mm−1) in the spectral region 2000–7500 A at aresolution of ∼0.12 A in first order, and a 1/8 m Oriel spectrometer (10 and 25 µm slits)with two different gratings (1200 and 2400 grooves mm−1) in the spectral region 2000–11000 A at a resolution of ∼1.3 A in first order (1200 grooves mm−1 grating). The detectorwas an Andor DU420-OE (open electrode) CCD (charge-coupled device) camera (1024 ×256 matrix of 26 × 26 µm2 individual pixels) with thermoelectric cooling working at −30 ◦C.The low noise level of the CCD allows long integration times and therefore the detection ofvery low emission intensities. The intensity response of the detection system was calibratedwith a standard (Osram No 6438, 6.6 A, 200 W) halogen lamp [13] and an Hg/Ar pencillamp [14]. An uncertainty in the experimental intensity measurements of about 10% wasestimated. Several (Cu/Ne, Fe/Ne and Cr/Ar) hollow cathode lamps (HCL) were used forthe spectral wavelength calibration of the spectrometers. The HCL lamps produce extremelynarrow atomic lines with line widths around 0.01–0.02 A.
3. Results and discussion
3.1. Plasma visualization
When a sample of nitrogen is irradiated by CO2 laser lines of sufficient power, a visiblebreakdown occurs. Figure 2 shows a series of images of the laser-induced breakdown nitrogenplasma at different times of the experiment. A number of plasma lobes can be distinguishedas well as diffuse, luminous cloud surrounding the central plasma core. Images (a)–(d) weretaken at the same experimental conditions. In the images (a) and (b) only a partial breakdownis produced, while in the images (c) and (d) the breakdown is total. The LIDB spectraanalysed in this work correspond to the situations described in cases (c) and (d) of figure 2.

Optical emission studies of nitrogen plasma generated by IR CO2 laser pulses 4577
1x10⁴ 1x10⁵
0.4
0.50.60.70.80.9
11
2
3
4
56
Pressure /Pa
Th
resh
old
Po
wer
Den
sity
/GW
cm-2
Figure 3. Threshold laser power density of the optical breakdown in nitrogen for differentpressures. Solid circle: without previous breakdown; open triangle: after previous breakdown.
The observations of the LIDB geometry during the experiments indicate that the actual plasmaregion is not spherical, but elongated in the direction of the laser beam propagation.
3.2. Optical breakdown threshold intensities for N2
Several models have been proposed to describe LIDB [15–19]. From these models, thebreakdown induced by the IR laser seems to be quite well explained as a collisional-assisted avalanche ionization mechanism or IB in which the development of gas breakdownis determined by the presence of some free electrons in the focal volume. It is deduced fromthe cited models that the procedure to do the measurements of the threshold determines themeasured value. Some authors induce the breakdown at a pressure over the desired value;later the pressure is lowered and the energy is adjusted until the breakdown begins with someprobability, usually around 50% [15]. This method is similar to inducing the breakdown withenergy in excess and to attenuating the laser until the spark disappears [20]. In these cases, itcould be that initial free electrons have been produced by previous breakdowns and they arethe seed of the avalanche process [15]. Another way to induce the breakdown is to fix thepressure and to gradually increase the energy until a visible spark is observed around the focalregion at a determined number of laser pulses, 50% [21]. In this last method, the obtainedthreshold value is more than 25% higher [22]. We have used both methods to measure thenitrogen breakdown at several pressures and the results are shown in figure 3. As can be seen,the behaviour of both curves is similar but, if a breakdown has been previously induced in thesample (open triangles), the pressure range to induce the breakdown is bigger and the powerdensity is around one order of magnitude lower than when no previous breakdown is induced(solid circles). The number of free electrons is higher in conditions of previous breakdownthan in the case of no previous breakdown, lowering the threshold for the plasma initiation.Also, if a sufficient concentration of electrons is generated by MPI early in the pulse so asto affect the diffusion of electrons out of the focal volume, diffusion becomes ambipolar innature as opposed to free. In this case, the breakdown thresholds will be significantly lowered.The threshold for LIDB depends on the pressure, kind of gas, laser wavelength, pulse length,beam size and frequency of radiation. This fact can be deduced by analysing the different

4578 J J Camacho et al
2000 3000 4000 5000 6000 7000 8000 9000
2000 3000 4000 5000 6000 7000 8000 9000
N-II
N-II
N-II
N-II
N-II
N-II
N-II
N-II N-I
IN
-IIN-I
I
N-II
N-II
N-II
N-II
N-II N-I
I
N-II
N-II
N-II
N-II
N-II N-I
I
N-I
I
N-I
I
N-I
I
N-II N-II
N-I
IN
-IIN
-II
N-I
I
N-I
IN
-II
N-I
IN
-II
N-I
I
N-II
N-I
I
N-II
N-II
N-I
IN
-II N-II
N-II
N-I
I
N-II
N-I
I
N-I
IN
-IIN
-IIN
-II
N-II
N-II
N-II
N-I
IN
-II
N-II
N-II
N-I
I
N-II
N-II N-II
N-II
N-II
N-I
I
N-I
IN
-IIN
-II
N-II
N-I
I
N-I
I
N-I
I
N-II
N-II
N-II
N-II
N-I
IN
-IIN
-IIN
-II
N-I N-I
N-I
N-I
N-I
N-I
N-I
N-I
N-I N
-IN
-I
N-I
N-I
N-I
N-I
N-I
N-I
N-I
N-I
N-I
N-I
N-I
N-I
N-I
N-I
N-I
N-I
N-I
N-I
N-I
N-I
N-I
N-I
N-I
N-I
N-I
N-I
N-I
N-I
N-I N
-I
N-I
N-I
N-I N-I
N-I
N-I
N-I N-I
N-I
N-I
N-I
N-I N-I
N-I N-I
N-I
N-I
N-I
N-I
N-I
N-I
N-I N-I
N-I
N-I
Air Wavelength/Å
Figure 4. An overview of the LIDB emission spectrum of nitrogen at a pressure of 1.2 × 10⁵ Pa,excited by the 9P(28) line at 1039.36 cm−1 of the CO2 laser, compared with atomic lines of N, N+
and N2+ (red, blue and green respectively in the online version).
values found in the literature. In the case of nitrogen, the range of threshold intensity ishigher than in noble gases due to additional vibrational energy losses inherent to the nitrogenmolecule [23]. Threshold intensity for 3 × 10⁵ Pa of nitrogen irradiated at 530 or 350 nmchange from 1012 to 5 × 10¹¹ W cm−2 [21], for 1.064 µm and pressures between 105 and4.3 × 106 Pa the threshold intensity range between 5 × 10¹⁰ and 2 × 10¹¹ W cm−2 [22], forCO2 lasers irradiating nitrogen in the pressures interval 2 × 10⁴–1.3 × 10⁵ Pa, power densitiesof 3 × 10¹³–2 × 10¹⁴ W cm−2 were found [23]. It has to be noted that we have obtainedlower threshold power densities for N2 than those given above [21–23] (figure 3). This factcan be related in part to the used focal length (24 cm) and beam size in the focal region(7.85 × 10⁻³ cm2) that is one order of magnitude, at least, higher than the values commonlyused in the literature, favouring the probability of existence of free electrons to seed the processand decreasing the threshold laser intensity due to the lack of the diffusion losses.
3.3. Identification of the chemical species in the laser-induced nitrogen plasma
The emission spectrum has a continuum on which the emission lines are superimposed. Thiscontinuum extends over the whole range of wavelength and has been subtracted in our spectra.It is due to the interactions between free electrons (bremsstrahlung) and to the interactionof free and bound electrons (recombination continuum). The former one is particularlyimportant in the UV spectral region, whereas the latter one is important at longer wavelengths.Figure 4 displays an overview of the optical emission spectrum of the LIDB in nitrogen(2000–9565 A) compared with the atomic lines of N, N+ and N2+ [24]. Strong atomic N+
lines dominate the spectrum but, atomic N lines (about three times weaker) and very weak N2+
lines (about 102–103 times weaker) also are present. The assignments of the atomic N (mainlyin the 5700–9565 A spectral region), N+ (2000–6000 A) and N2+ (2000–5500 A) individuallines are indicated by stick labels. In the upper part of figure 4, we indicate in a column graphthe relative intensities of atomic observed N, N+ and N2+ lines tabled in the NIST AtomicSpectral Database [24–30]. There is a good agreement between line intensities tabulatedin NIST and the measured intensities observed here for N, N+ and N2+. The spectrum offigure 4 has been obtained with six successive exposures on the CCD detector using the

Optical emission studies of nitrogen plasma generated by IR CO2 laser pulses 4579
20002100220023002400250026002700280029003000310032003300
0
5000
10000
15000
20000
25000
30000
35000
40000
45000
50000
N-II
N-II
N-II
N-II
N-II
N-II
N-II
N-II
N-II
N-II
N-II
N-II
N-II
N-II
N-II
N-II
N-II
N-II
N-II
N-II
N-II
N-II
N-IIN-I
IIN
-III
N-I
IIN
-III
N-I
IIN
-III
N-I
IIN
-III
N-I
II
N-I
II
Air Wavelength/Å
Inte
nsity
/a.u
.
3400 3500 3600 3700 3800 3900 4000 4100 4200 4300 4400 4500 4600 4700 4800 4900
0
20000
40000
60000
80000
100000
N-II
N-II
N-II
N-II N-II
N-II
N-II
N-II
N-II
N-II
N-II
N-II
N-II
N-II
N-II
N-II
N-II
N-II
N-II
N-II N-II
N-II
N-II
N-II
N-II
N-I
N-I
N-I
NI
N-I
IIN
-III
N-I
IIN
-III
N-I
II
N-I
IIN
-III
N-I
IIN
-III
N-I
IIN
-III
N-I
II
N-I
IIN
-III
N-I
IIN
-III
N-I
IIN
-III
Air Wavelength/Å
Inte
nsity
/a.u
.
49005000510052005300 54005500560057005800590060006100 62006300
0
20000
40000
60000
80000
NII
N-II
N-II
N-II
N-II N-II
N-II
N-II
N-II
N-II
N-II
N-II
N-II
N-II
N-II
N-II
N-II
N-II
N-II
N-II
N-II
N-II
N-II
N-II
N-II
N-I
N-I
N-I
N-I
N-I
N-I N-I
N-I
N-I
N-I
N-I
N-I
N-I
IIN
-III
N-I
II
Air Wavelength/Å
Inte
nsity
/a.u
.
6300 6400 6500 6600 6700 6800 6900 7000 7100 7200
0
5000
10000
15000
20000
25000
30000
35000
N-II N-II
N-II
N-I
N-I
N-I
N-I
N-I
N-I
N-I
N-I
N-I
N-I
N-I
N-I
N-I
N-I
N-I
N-I
N-I
N-I
N-I
N-I
N-I
N-I
N-I
IIN
-III
Air Wavelength/Å
Inte
nsity
/a.u
.
7200 7400 7600 7800 8000 8200 8400 8600 8800
0
20000
40000
60000
80000
100000
120000
140000
N-II
N-II
N-II
N-II
N-II
N-II
N-I
N-I
N-I
N-I
N-I
N-I
N-I
N-I
N-I
N-I
N-I
N-I
N-I
N-I
N-I
N-I
N-I
N-I
N-I
N-I
N-I
N-I
N-I
N-I
N-I
N-I
Air Wavelength/Å
Inte
nsity
/a.u
.
8900 9000 9100 9200 9300 9400 9500 9600
0
2500
5000
7500
10000
12500
15000
17500
N-I N-I
N-I
Air Wavelength/Å
Inte
nsity
/a.u
.
Figure 5. A zoom of the spectrum of figure 4.
1/8 m Oriel spectrometer (1200 grooves mm−1 grating). A zoom of this spectrum is shown infigure 5. In this figure, in addition to the identified atomic lines, molecular bands associatedwith N+
2 and N2 diatomic molecules are observed. The analysis of the molecular emission hasalready been used for a long time to get information on the structure and symmetry of excitedstates [31–34].
Studies of the electronic spectra of N2 and N+2 in a number of discharge tubes, such as
electrodeless microwave discharges and conventional ac and dc discharges, are well known. In

4580 J J Camacho et al
many electrical discharges, the most prominent electronic transitions of N2 are the first positiveB3�g–A3�+
u system (between 480 and 2530 nm) and the second positive C3�u–B3�g system(between 270 and 550 nm) [6]. For the electronic states implied in the electronic transitionsof N2(C–B and B–A) and N+
2(B–X and D–A), the vibrational quanta �G(v + 1/2) in the upperand lower electronic states have similar magnitudes, and therefore the vibrational transitionswith �v = v′ − v′′ constant (sequences) appear quite close. The known part of the C–B secondpositive system of molecular nitrogen consists of the �v = 4, 3, 2, 1, 0, −1, −2, −3, −4,−5, −6 and −7 triple-headed band sequence, all degraded to the violet. A sharp cutting-offof the rotational in v′ = 4 vibrational level of the C state is observed, which Herzberg [35]attributed to a predissociation. Pannetier et al [36] observed the 5–5 band of the C–B systemwith band-head at 3259.2 A. Also, Tanaka and Jursa [37] studied this band system with highintensity in the aurora afterglow observed for weak red-degraded triplet bands originate fromv′ = 5 (C3�u). Perturbations of various types in the C3�u state of molecular nitrogen werealso observed. Moreover, the most prominent electronic transitions of N+
2 are the first negativeB2�+
u –X2�+g system (between 280 and 590 nm) and the A2�u–X2�+
g Meinel system (550 and1770 nm) [6]. The A–X Meinel bands for nitrogen cation were first identified in the auroraborealis [38]. The analysis of these band systems of N2 and N+
2 was accomplished in the earlywork of many authors and played an important part in the development of our understandingof the spectra of diatomic molecules.
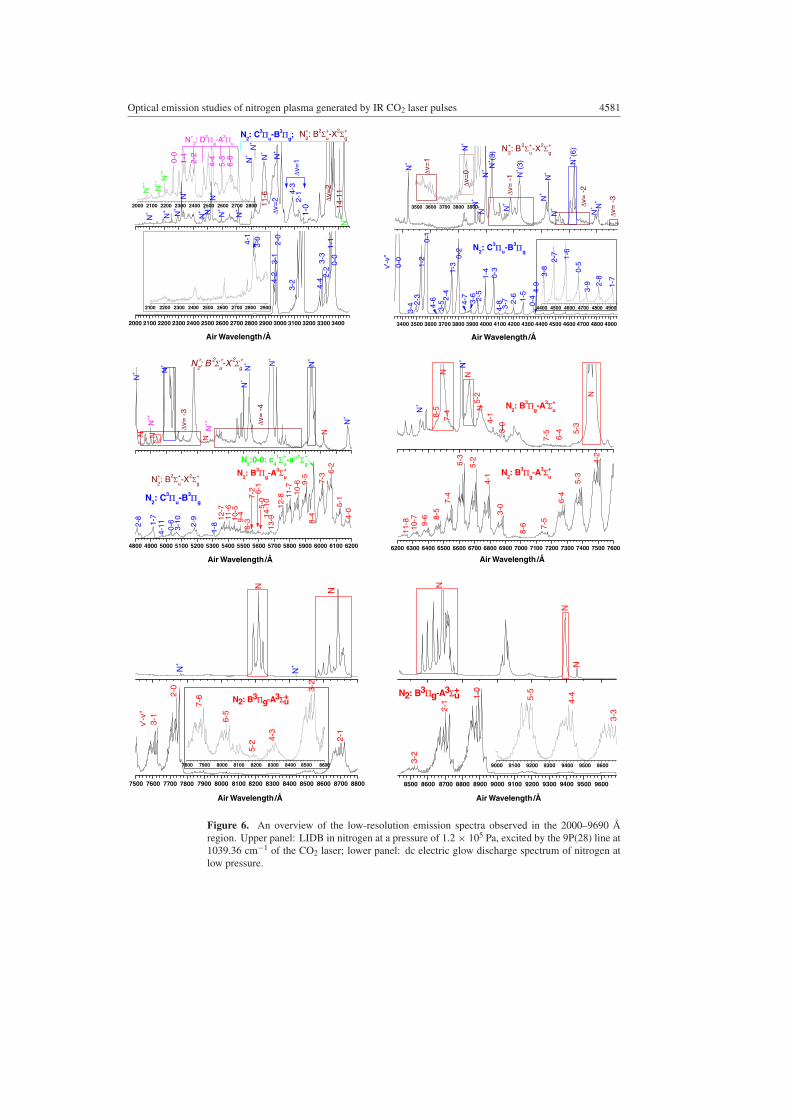
In order to assign the molecular features of the LIDB in nitrogen, its spectrum is comparedto that of the dc electric glow discharge at low pressure (∼5 Torr). Typical spectra recordedwith the Oriel spectrometer (25 µm slit and grating of 1200 grooves mm−1) after CO2 laserexcitation and in the cathode glow discharge of N2 are given in figure 6. A global analysisof the latter allows one to distinguish the second positive C–B system (between 270 and530 nm) and the first positive B–A system (between 570 and 970 nm) of N2 and veryweak emissions corresponding to the first negative B–X system of N+
2 ions. Moreover,spectroscopic measurements performed on the dc electric glow in N2 spectrum showed thatalthough numerous molecular bands appear, nitrogen atomic lines are not present. Besides,the second positive system of N2 and the first negative system of N+
2 spectra are frequentlyobserved simultaneously in plasma containing nitrogen. In the glow discharge in N2 at5977.4 A, the 0–0 band of the c4
1�u–a1�+g Ledbetter Rydberg series [39] of nitrogen is
observed overlapped with the 8–4 band sequence of the first positive B–A system. The LIDBemission spectrum of N2 (figure 6) shows six red-degraded heads in the region 225–275 nmwhich were readily assigned to the �v = 0 (v = 0, 1, . . . , 6) band sequence of the D2�g–A2�u
Janin-d’Incan system [6] of N+2. In the spectral range between 2700 and 5300 A, the second
positive system of N2(C–B) and the first negative system of N+2(B–X) spectra are observed
simultaneously. Table 1 lists the different molecular species that have been observed in theLIDB spectrum of nitrogen.
In order to investigate the different electronic bands of N2 and N+2, both LIDB and high-
voltage dc electric glow discharge spectra were recorded with a resolution of ∼0.12 A by a ISAJobin Yvon Spex 0.32 m spectrometer. The high-resolution of the LIDB spectrum allowed usto resolve partially the vibrational bands of the second positive C–B system of N2 and the firstnegative B–X system of N+
2. Both spectra have been obtained with 40 successive exposureson the CCD camera in the spectral region 2000–7500 A. In the high-resolution spectra, nonew processes were detected but allow us to identify unequivocally the band structure of thedifferent transitions. As examples, figures 7(a)–(f) show a comparison between two spectra,the lower one obtained for the high-voltage dc electric discharge, and the upper one recordedin the LIDB experiment. We indicate with italic the position of the band-head (v′ − v′′) of firstnegative system of N+
2(B–X) while in regular typeface the bands of the second positive system
Optical emission studies of nitrogen plasma generated by IR CO2 laser pulses 4581
2100 2200 2300 2400 2500 2600 2700 2800 2900
2000 2100 2200 2300 2400 2500 2600 2700 2800
2000 2100 2200 2300 2400 2500 2600 2700 2800 2900 3000 3100 3200 3300 3400
4-1
3-0
Air Wavelength/Å2-
2
N+
N2: C3
u-B3
g;
v=2
14-1
1
11-6
v=1
v=2
4-3
4-2
3-1
2-0
3-2
2-1
1-0
4-4
3-3
1-1
0-0
N+
2: B2 +
u-X2 +
g
5-5
6-6
4-42-2
1-1 N+
N+
N+
N+
N+
N+
N++
N+
N+
N+
N+
N+
N+
N++
N++
N+
+N+
2: D2
g-A2
u
0-0
4400 4500 4600 4700 4800 4900
3500 3600 3700 3800 3900
3400 3500 3600 3700 3800 3900 4000 4100 4200 4300 4400 4500 4600 4700 4800 4900
N+
2: B2 +
u-X2 +
g
v'-v
"
1-7
2-8
3-9
4-7
4-6
1-2
0-1
0-0
N2: C3
u-B3
g
Air Wavelength/Å
4-8
v= -
3v= -
2v= -
1
v=1
3-4
N+
N+ N
+N
+
N+(6
)
N+
N+
N+(3
)
N+(3
)N
+N
+N+
N+
N+
0-52-
73-
84-
9
1-6
3-7 0-41-
52-
6
0-3
3-6 2-5
1-4
0-2
3-5 2-
41-
3
2-3
v=0
4800 4900 5000 5100 5200 5300 5400 5500 5600 5700 5800 5900 6000 6100 6200
N+
2: B2 +
u-X2 +
g
N2:0-0: c'
4
1 +
u-a"1 +
g
N2: B3
g-A3 +
u
N
N+
N+
N
N+
N+
N+
N+
+
N+ N
+ N +
2: B 2 +
u-X 2 +
g
N2: C3
u-B3
g
Air Wavelength/Å
9-4
8-310
-511
-612
-7
7-2
5-0
6-1
13-914
-10 5-1
9-5
8-4
7-3
4-012
-8 11-7
10-6
6-2
3-10
1-82-
9
0-6
4-112-
8
1-7
v= -
4
v= -
3
NN
++
N
6200 6300 6400 6500 6600 6700 6800 6900 7000 7100 7200 7300 7400 7500 7600
8-5
7-4
5-2
8-6
11-8 9-
610
-7 8-5
7-4
6-4
4-2
6-3
5-3
3-0
5-2
4-1
7-5
N2: B3
g-A3 +
u
Air Wavelength/Å
5-3
6-4
7-5
4-1
N2: B3
g-A3 +
u
3-0
N
N
N
N+
N+
N
7800 7900 8000 8100 8200 8300 8400 8500 8600
7500 7600 7700 7800 7900 8000 8100 8200 8300 8400 8500 8600 8700 8800
v'-v
"
2-1
7-6
6-5
3-1
5-2 4-
3
2-0 3-
2
Air Wavelength/Å
N+
N
N+
N
N2: B3g-A3 +
u
9000 9100 9200 9300 9400 9500 9600
8500 8600 8700 8800 8900 9000 9100 9200 9300 9400 9500 9600
N2: B3g-A3 +
u
Air Wavelength/Å
N4-
45-5
2-1
3-2
1-0
3-3
N
N
Figure 6. An overview of the low-resolution emission spectra observed in the 2000–9690 Aregion. Upper panel: LIDB in nitrogen at a pressure of 1.2 × 10⁵ Pa, excited by the 9P(28) line at1039.36 cm−1 of the CO2 laser; lower panel: dc electric glow discharge spectrum of nitrogen atlow pressure.
4582 J J Camacho et al
Table 1. List of the most intense observed molecular bands in the laser-induced dielectricbreakdown in nitrogen, corresponding electronic transition and wavelength in A (air) for themajor band heads.
Molecule Name of the system Observed band system Major band heads (A) (v′, v′′)
N+2 Janin-d’Incan D2�g –A2�u 2343 (0, 0); 2398 (1, 1); 2456 (2, 2); 2516 (3, 3);
2579 (4, 4); 2645 (5, 5); 2714 (6, 6)N+
2 First negative B2�+u –X2�+
g 2861.7 (11, 6); 3033.0 (11, 7); 3065.1 (15, 10);3076.4 (4, 1); 3078.2 (3, 0); 3291.6 (5, 3);3293.4 (4, 2); 3298.7 (3, 1); 3308.0 (2, 0);3319.9 (8, 6); 3349.6 (18, 13); 3381.5 (10, 8);3419.6 (14, 11); 3447.3 (23, 16); 3460.8 (17, 13);3493.4 (12, 10); 3532.3 (5, 3); 3538.3 (4, 3);3548.9 (3, 2); 3563.9 (2, 1); 3582.1 (1, 0);3588.6 (16, 13); 3612.4 (10, 9); 3806.8 (5, 5);3818.1 (4, 4); 3835.4 (3, 3); 3857.9 (2, 2);3884.3 (1, 1); 3914.4 (0, 0); 4110.9 (6, 7);4121.3 (5, 6); 4140.5 (4, 5); 4199.1 (2, 3);4236.5 (1, 2); 4278.1 (0, 1); 4459.3 (7, 9);4466.6 (6, 8); 4490.3 (5, 7); 4515.9 (4, 6);4554.1 (3, 5); 4599.7 (2, 4); 4651.8 (1, 3);4709.2 (0, 2); 4864.4 (7, 10); 4881.7 (6, 9);4913.2 (5, 8); 4957.9 (4, 7); 5012.7 (3, 6);5076.6 (2, 5); 5148.8 (1, 4); 5228.3 (0, 3);5485.5 (4, 8); 5564.1 (3, 7); 5653.1 (2, 6);5754.4 (1, 5); 5864.7 (0, 4)
N2 Second positive C3�u–B3�g 2953.2 (4, 2); 2962.0 (3, 1); 2976.8 (2, 0); 3116.7(3, 2); 3136.0 (2, 1); 3159.3 (1, 0); 3268.1 (4, 4);3285.3 (3, 3); 3311.9 (2, 2); 3338.9 (1, 1); 3371.3(0, 0); 3500.5 (2, 3); 3536.7 (1, 2); 3576.9 (0, 1);3641.7 (4, 6); 3671.9 (3, 5); 3710.5 (2, 4); 3755.4(1, 3); 3804.9 (0, 2); 3857.9 (4, 7); 3894.6 (3, 6);3943.0 (2, 5); 3998.4 (1, 4); 4059.4 (0, 3); 4094.8(4, 8); 4141.8 (3, 7); 4200.5 (2, 6); 4269.7 (1, 5);4343.6 (0, 4); 4355.0 (4, 9); 4416.7 (3, 8); 4490.2(2, 7); 4574.3 (1, 6); 4667.3 (0, 5); 4723.5 (3, 9);4814.7 (2, 8); 4916.8 (1, 7); 5031.5 (0, 6); 5066.0(3, 10); 5179.3 (2, 9); 5309.3 (1, 8)
N2 First positive B3�g–A3�+u 6322.9 (10, 7); 6394.7 (9, 6); 6468.6 (8, 5);
6544.9 (7, 4); 6623.6 (6, 3); 6704.8 (5, 2);6788.6 (4, 1); 6875.2 (3, 0); 7164.8 (7, 5)
of N2(C–B). The upper panel of figure 7(a) shows the LIDB emission spectrum of nitrogen inthe spectral region 2925–3175 A of nitrogen. Assignment of the emission band heads is shownin table 1 and indicated also on the spectra. The two sets of three blue-degraded band heads(2925–2980 A) and (3105–3165 A) are readily assigned to the �v = 2 and �v = 1 sequencesof the second positive system of N2(C–B), respectively. The series of bands between 3020 and3095 A belong to any of the bands 11–7, 4–1 and 3–0 of the first negative system of N+
2(B–X).The lower panel, corresponding to the dc electric glow discharge of nitrogen at low pressure,shows practically the same bands with different intensity distributions and spectral widths. Inthe spectrum of the lower panel of figure 7(b) (nitrogen electric glow discharge), we easilyidentified five bands of the �v = 0 sequence and the 1–0 band of the second positive system

Optical emission studies of nitrogen plasma generated by IR CO2 laser pulses 4583
of N2(C–B). The main intensity is observed for the dominant transition N2(C, v′ = 0) → (B,v′′ = 0) which corresponds to the most intense nitrogen laser line at 3371 A. However, thissimple picture changes drastically in the LIDB emission spectrum of nitrogen excited by theCO2 laser, the 0–0 band being now very weak. A large number of additional strong bandsmainly in the region 3260–3410 A are detected in the LIDB spectrum and can be attributedto emissions from the first negative system of N+
2 (especially for �v = 2). The B–X systemof N+
2 has been observed over a wide range of vibrational levels. The highest values observedso far are v′ = 29 for the excited B state and v′′ = 23 for the X state. The main bands ofthis system lie in the −2 � �v � 2 with v′ < 5 sequences and all of these bands are bluedegraded. However, under certain circumstances many more bands, some red degraded, areobserved, most being tail bands of these sequences. The observed bands with v′ � 7 and alsothose with 8 � v′ � 11 and �v < −1 are shaded with violet. All the observed bands withv′ � 12 and those with v′ = 10 and 11, �v � 0 are shaded with red although some bands appearheadless. These bands are so-called tail bands taking place a reversal in the successions of thebands in the sequence. Moreover, in the bands of the first negative system of N+
2, numerousrotational line displacements and intensities anomalies arising from perturbations in the Bstate have been observed. The perturbing state is A2�u. In the Deslandres table listing theobserved band heads, there is a pronounced gap in one arm of the Condon locus, and a lessmarked one in the other [6]. Franck–Condon factors indicate that the missing bands shouldbe as intense as many of the observed. The few bands observed in the region of the gap are8–6 and 9–8 which are headless, and the 10–9 and 10–8 which have no definite heads. Themissing bands coincide with the strong bands of either first negative system of N+
2(B–X) orthe second positive system of N2(C–B), and are difficult to detect. In the spectrum of thelower panel of figure 7(c), corresponding to the nitrogen electric glow discharge we easilyidentified several bands of the �v = −1 sequence and two weak 4–6 and 3–5 bands of thesecond positive system of N2(C–B). In this spectral region (3425–3675 A), the most intensebands are due to the transitions N2(C, v′ = 0) → (B, v′′ = 1) and N2(C, v′ = 1) → (B, v′′ = 2),also present in the LIDB emission spectrum of nitrogen in the upper panel of figure 7(c). As inthe previous cases, the LIDB emission spectrum excited by the CO2 laser changes drasticallyregarding the emission spectrum of nitrogen electric glow discharge. In it a large number ofadditional strong bands corresponding mainly to the �v = +1 sequence B–X band system ofN+
2 are detected which are partially overlapped by the weak bands of the C–B system of N2.For low v′ the 1–0, 2–1, 3—2, . . . bands of the B–X system of N+
2 are degraded to shorterwavelengths, and for high v′ values the bands are degraded to longer wavelengths (tail bands).In the nitrogen electric glow discharge spectrum (lower panel of figure 7(d)), we identified3–6, 4–7, 0–2, 1–3 and 2–4 bands of the second positive system of N2(C–B) and 0–0, 1–1 and2–2 bands of the first negative system of N+
2. In this spectral region (3675–3935 A), the mostintense band is the 0–2 band of N2(C–B). The LIDB emission spectrum in this region hardlyshows bands of the second positive system of N2(C–B). However, this emission spectrumexhibits a large number of bands corresponding mainly to the �v = 0 sequence B–X bandsystem of N+
2.In the spectra of the lower panel of figures 7(d)–(f) (nitrogen electric glow discharge), we
identified several bands of the second positive system of N2(C–B), indicated on the spectra,and some very weak bands of the first negative system of N+
2. As in the previous cases, thespectra change drastically in the LIDB emission of nitrogen excited by the CO2 laser. A largenumber of N+ and N2+ atomic lines and additional strong bands of the first negative system ofN+
2 are now present.To understand the different processes involved in the analysed emission, Rydberg–Klein–
Rees (RKR) potential energy curves for some bound electronic states of N2 and N+2 have

4584 J J Camacho et al
2925 2950 2975 3000 3025 3050 3075 3100
2925 2950 2975 3000 3025 3050 3075 3100 3125 3150 3175
3-2
2-1
Air Wavelength/Å Air Wavelength/Å
Air Wavelength/Å Air Wavelength/Å
Air Wavelength/Å Air Wavelength/Å
v=2
3-0
4-1
v'-v
"11
-7
v'-v
"
v=1
N +
2: B 2 +
u-X 2 +
g
4-3
3-2
2-1
1-0
1-0
N2: C3
u-B3
g
N+ :2
s2 2p3p
1 P1-
2s2 2p
4p 1 P
0 1(a)
4-1
3-04-
24-
23-
13-
12-
02-
0
3175 3200 3225 3250 3275 3300 3325 3350
3150 3175 3200 3225 3250 3275 3300
3150 3175 3200 3225 3250 3275 3300 3325 3350 3375 3400 3425
v'-v
"
v'-v
"
4-4
1-1
2-23-3 1-
1 0-0
1-0
1-0
v=0
N2: C3
u-B3
g
2-2
0-0
16-1
2
4-2 N +
2: B2 +
u-X2 +
g
v=0 14-1
1
(b)
3-3
18-1
38-6
2-0
3-1
3425 3450 3475 3500 3525 3550
3425 3450 3475 3500 3525 3550 3575 3600 3625 3650 3675
4-6
3-5
2-3
4-5
0-1
3-4
1-2
2-3
0-1 N
2: C3
u-B3
g
10-9
12-1
0
16-1
31-
0
2-12-
3 1-2
3-2
N+ :2
s2 2p3s
1 P0 1-
2s2 2p
3p 1 P
0 N +
2: B 2 +
u-X2 +
g(c)
3675 3700 3725 3750 3775 3800 382
3825 3850 3875 3900 3925
3675 3700 3725 3750 3775 3800 3825 3850 3875 3900 3925
N2+:2s2p3s 4P0
6-2s2p3p 4P0
4
N2+:2s2p3s 4P0
4-2s2p3p 4P0
4
0-2
3-6
1-3
2-4
1-3 0-
2
N2: C3
u-B3
g
N +
2: B2 +
u-X2 +
g
N+ :2
s2 2p3p
1 P1-
2s2 2p
3p 1 P
0 1
4-4
0-0
0-0
2-4
(d)
3-3
2-2
2-2
1-1
1-1
N+ :2
s2 2p3p
3 P2-
2s2 2p
4s 3 P
0 2
4-7
3925 3950 3975 4000 4025 4050 4075 4100 4125 4150
N++
3-7
2-5 1-
4
4-8
0-3
N2: C3
u-B3
g
(e)
4-5
5-6
N+
N+
N+
N+
N+N+
N+
N+
N++
6-7
N +
2: B 2 +
u-X 2 +
g
4275 4300 4325 4350 4375
4150 4175 4200 4225 4250 4275 4300 4325 4350 4375
N++
N++
N++
N++ 4-
94-
9
3-4
2-3
3-4
0-1
1-2
4-5
2-6
1-5 0-
4
N+
N+
N++N
+
N++
N+ 0-
1
3-7
N2: C3
u-B3
g
N +
2: B 2 +
u-X2 +
g
2-6
(f)
0-4
5
Figure 7. (a)–(f) Comparison between high-voltage dc electric discharge (lower panels) and LIDB(upper panels) emission spectra for nitrogen in several spectral regions.

Optical emission studies of nitrogen plasma generated by IR CO2 laser pulses 4585
0.8 0.9 1.0 1.1 1.2 1.3 1.4 1.5 1.6 1.7 1.8 1.9 2.00
20000
40000
60000
80000
100000
120000
140000
160000
180000
200000
SE
CO
ND
NE
GA
TIV
E
C 2 +
u
JAN
IN-D
'INC
AN
FIR
ST
NE
GA
TIV
E
ME
INE
LS
EC
ON
D P
OS
ITIV
E
FIR
ST
PO
SIT
IVE
D 2
g N(4S0)+N+(3P)B2 +
u
A2
u
X 2 +
g
14N +
2
N(4S0)+N(2D0)
A3 +
u
C3
u
B3
g
X1 +
g
14N2
En
erg
y (c
m-1)
Internuclear distance (Å)
N(4S0)+N(4S0)
VE
GA
RD
-KA
PL
AN
Figure 8. RKR potential energy curves for some bound electronic states of N2 and N+2 studied in
this work.
been calculated. The potential energy curves for the X1�+g , A3�+
u , B3�g, C3�u states of N2
and X2�+g , A2�u, B2�+
u , C2�+u and D2�g states of N+
2 were obtained from the experimentalinformation reported by Huber and Herzberg [40] and Laher and Gilmore [41]. Figure 8shows the calculated RKR potentials and associated transitions for electronic states of N2 andN+
2 which can be relevant to interpret the results of the present work. Many perturbationsare known in molecular states of nitrogen, although an in-depth explanation of these featuresin terms of mixing of electronic states is not yet available. A useful graphical summary ofmany potential energy curves has been reported by Gilmore [42]. Perturbations are oftenaccompanied by complex intensity irregularities as happens in the first negative system ofN+
2. Whereas the vibrational and rotational constants run quite normal for the X2�+g state of
N+2, this is not at all the case for the B2�+
u electronic state. Both the Bv and G(v) curvesversus the vibrational quantum number v have unusual shapes. This can be interpreted ascaused by a strong mutual vibrational perturbation between the B2�+
u and C2�+u states of the
same species of N+2 (see figure 8). As this perturbation is homogeneous (i.e., �� = 0), the
shifts in both levels will be nearly independent of J producing that the B2�+u potential curve
to flatten out in the middle of its energy range. The minimum of the C2�+u potential energy
curve should be moved to smaller internuclear distances. There are also observed numerousrotational perturbations in the B–X system of N+
2, caused by an interaction between the A2�u
and the B2�+u states.
3.4. Ionization degree of the plasma
When dielectric breakdown is produced in nitrogen under high intensity laser radiation, somemolecules can obtain an energy that exceeds the binding energy. Also some of their electronsbecome so energetic that the atoms and molecules ionize. Taking into account our experimentalspectral observations, at these high temperatures nitrogen becomes a mixture of N2, N+
2, N,N+, N2+ and electrons. The transition between a gas and a plasma is essentially a chemicalequilibrium which shifts from gas to plasma side with increasing temperature. For example, ifwe assume a LTE between nitrogen atoms in the ground state N
(1s22s22p3: 4S0
3/2
)and ionized

4586 J J Camacho et al
0 5000 10000 15000 20000 25000 300000.0
0.1
0.2
0.3
0.4
0.5
0.6
0.7
0.8
0.9
1.0
Ion
izat
ion
deg
ree
T (K)
N(1s22s22p3 4S0
3/2) N+(1s22s22p2 3P
0) + 1e
Figure 9. Temperature dependence of the ionization degree Ni/(N0 + Ni) of atomic nitrogen at aconstant pressure of 1.2 × 10⁵ Pa.
nitrogen atoms N+(1s22s22p2: 3P0) at temperature T, the ionization degree is described by theSaha equation:
Ne × Ni
N0= ge × gi
g0
(2πmekBT )3/2
h3e−Ei/kBT , (1)
where Ne = Ni are the electron and ion densities, N0 is the density of the neutrals, h is Planck’sconstant, kB is Boltzmann’s constant, me is the electron mass, ge, gi and g0 are the statisticalweights of the electrons (ge = 2), N+ ions (gi = 1), N neutrals (g0 = 4) and Ei is the ionizationenergy. For atomic nitrogen, the Saha equation reads (Ei = 14.5341 eV [43])
Ne × Ni
N0= 1.207 34 × 1021T 3/2 e−Ei/kBT , (2)
where T is in K and Ne × Ni/N0 is in m−3. Figure 9 shows the ionization degree Ni/(N0 + Ni)of nitrogen gas, plotted as a function of the gas temperature T at a constant total pressureP = (N0 + Ne + Ni)kBT of 1.2 × 10⁵ Pa. The graph shows that the nitrogen is already fullyionized at thermal energies well below the ionization energy of 14.5341 eV (equivalent to168 661 K). From our experiments, it is obtained that at about 1/8 of the ionization energy(equivalent to IR 14 photons), the majority of the nitrogen atoms are ionized (ionization degree0.87). The situation for the hypothetical equilibrium N2
(X1�+
g
) ↔ N+2
(X2�+
g
)+ e is quite
similar. Already at lower temperatures the electrically charged components of a partiallyionized nitrogen gas can dominate the behaviour of the gas.
3.5. Plasma temperature measurement
We have calculated the excitation temperature Texc according to the Boltzmann equation underthe assumption of LTE. The conditions satisfying this assumption of LTE require that theradiative population rates are negligible compared to the collisional population rates. Thisessentially implies that an excited state must have a higher probability of de-excitation bycollision than by spontaneous emission. Generally, LTE is established among all the speciesin the plasma beyond ∼1 µs delay time from the plasma start. The excitation temperature was
Optical emission studies of nitrogen plasma generated by IR CO2 laser pulses 4587
250000 260000 270000 280000
-1.0
-0.5
0.0
0.5
ln(I
kiki
/gk
Aki)
(a. u
.)
Ek /kB (K-1)
Texc=21000 ± 1300 K
N+
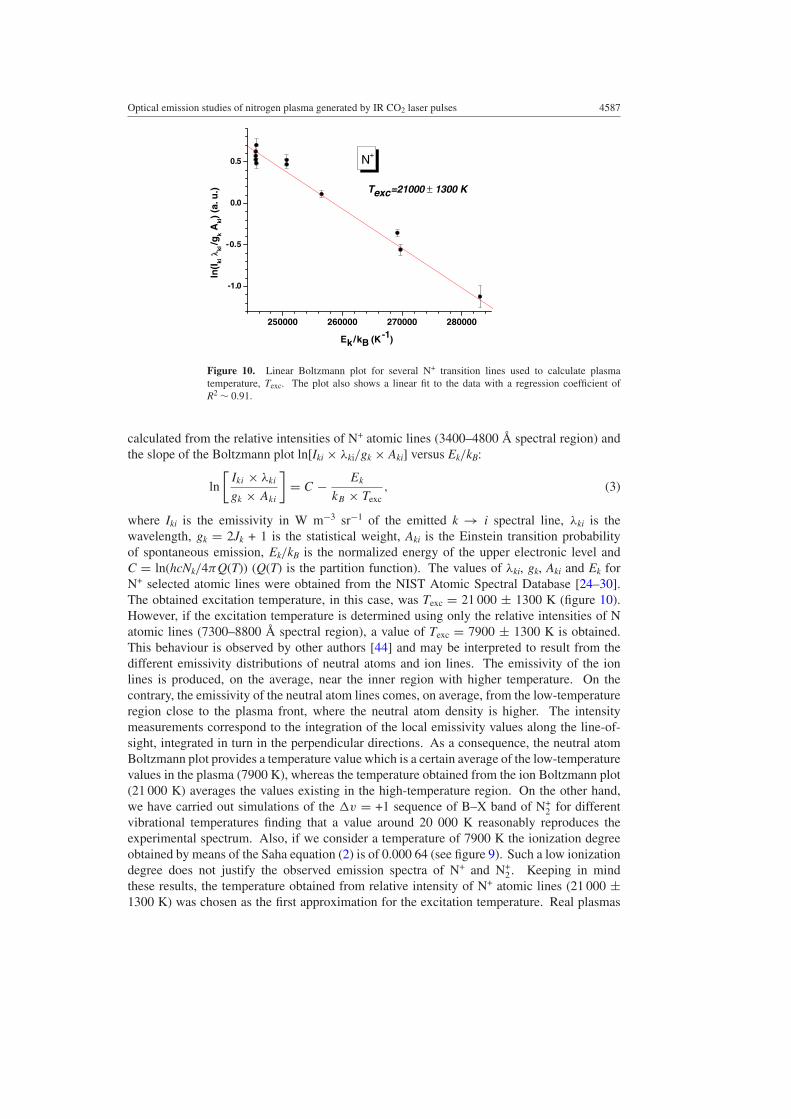
Figure 10. Linear Boltzmann plot for several N+ transition lines used to calculate plasmatemperature, Texc. The plot also shows a linear fit to the data with a regression coefficient ofR2 ∼ 0.91.
calculated from the relative intensities of N+ atomic lines (3400–4800 A spectral region) andthe slope of the Boltzmann plot ln[Iki × λki/gk × Aki] versus Ek/kB:
ln
[Iki × λki
gk × Aki
]= C − Ek
kB × Texc, (3)
where Iki is the emissivity in W m−3 sr−1 of the emitted k → i spectral line, λki is thewavelength, gk = 2Jk + 1 is the statistical weight, Aki is the Einstein transition probabilityof spontaneous emission, Ek/kB is the normalized energy of the upper electronic level andC = ln(hcNk/4πQ(T)) (Q(T) is the partition function). The values of λki, gk, Aki and Ek forN+ selected atomic lines were obtained from the NIST Atomic Spectral Database [24–30].The obtained excitation temperature, in this case, was Texc = 21 000 ± 1300 K (figure 10).However, if the excitation temperature is determined using only the relative intensities of Natomic lines (7300–8800 A spectral region), a value of Texc = 7900 ± 1300 K is obtained.This behaviour is observed by other authors [44] and may be interpreted to result from thedifferent emissivity distributions of neutral atoms and ion lines. The emissivity of the ionlines is produced, on the average, near the inner region with higher temperature. On thecontrary, the emissivity of the neutral atom lines comes, on average, from the low-temperatureregion close to the plasma front, where the neutral atom density is higher. The intensitymeasurements correspond to the integration of the local emissivity values along the line-of-sight, integrated in turn in the perpendicular directions. As a consequence, the neutral atomBoltzmann plot provides a temperature value which is a certain average of the low-temperaturevalues in the plasma (7900 K), whereas the temperature obtained from the ion Boltzmann plot(21 000 K) averages the values existing in the high-temperature region. On the other hand,we have carried out simulations of the �v = +1 sequence of B–X band of N+
2 for differentvibrational temperatures finding that a value around 20 000 K reasonably reproduces theexperimental spectrum. Also, if we consider a temperature of 7900 K the ionization degreeobtained by means of the Saha equation (2) is of 0.000 64 (see figure 9). Such a low ionizationdegree does not justify the observed emission spectra of N+ and N+
2. Keeping in mindthese results, the temperature obtained from relative intensity of N+ atomic lines (21 000 ±1300 K) was chosen as the first approximation for the excitation temperature. Real plasmas
4588 J J Camacho et al
provide, even in the worst cases, just an approximation to LTE. However, their spatialinhomogeneity is very large as concerns the temperature and number density distributionsof the different species. Consequently, the LTE occurs only within very small volume of theplasma.
3.6. Laser-induced breakdown mechanism in nitrogen
It is clear that the LIDB and glow discharge spectra are remarkably different. The lack ofcorrelation between the LIDB spectrum generated by the CO2 laser pulses in nitrogen andthe molecular emission spectrum formed in a glow discharge suggests that the relaxationfrom excited states of nitrogen and nitrogen cation during the LIDB plasma emission occursthrough other pathways. The strong atomic lines observed in the LIDB spectra in comparisonwith the dc glow discharge spectra, as well as the similarities between the LIDB spectra andthose obtained using synchrotron radiation [12], indicate the high degree of excitation and thehigh rate of the N2 dissociation process achieved in the plasma. As we have mentioned, thetwo most important processes involving the formation of laser-induced plasma are MPI andelectron cascade or IB. While the multiphoton ionization process is self-sufficient, the electroncascade requires the presence of at least one electron in the laser focal region. The MPI processinvolves the simultaneous absorption of a number of photons required to equal the ionizationpotential of a gas. Due to the small energy of the laser photons (hν = 0.128 864 eV) and theionization potential of nitrogen (15.5807 eV [6]), the usual photoelectric effect is not possible.Multiphoton ionization process would be possible if a simultaneous absorption of 121 photonswould occur. In general, the probability wn of a species absorbing simultaneously n photonswhen in the field E (E is the root-mean-square electric field, i.e., the amplitude of the fieldoscillations E = √
2E0) corresponding to a photon flux density F (F = J (power density inW cm−2)/hυ photons cm−2 s) is wn ∝ Fn ∝ E2n. As it can be seen, the dependence onthe laser field is very sharp. Bebb and Gold [45, 46] concluded that although multiphotonionization may supply the initial electrons, it does not account entirely for the breakdownphenomenon, except possibly at very low pressures when the formation of an electron cascadeis inhibited. Moreover, it has been established [45, 46] that the threshold photon flux densityFth or equivalently the threshold power density Jth for multiphoton ionization varies withP−1/n, where P is the gas pressure and n is the number of simultaneously absorbed photons.Therefore, MPI predicts a very weak dependence of Jth on P for nitrogen. However, as wecan see from figure 3, the breakdown threshold power density Jth in N2 versus pressure showsa minimum around 5 × 10⁴ Pa if previous breakdown have existed and 1 × 10⁵ Pa withoutprevious breakdown. Therefore, it can be seen from figure 3 that the pressure dependenceis incompatible with MPI which predicts a very weak P−1/n dependence for the thresholdpower density, while it is in qualitative agreement with electron cascade. Moreover, Rosenand Weyl [21] reported a P−0.6 scaling (0.2 < P < 10 atm) of threshold laser power density Jth
for N2 at 0.53 and 0.35 µm, indicating that this behaviour is associated with electron cascaderather than MPI. A minimum in the variation of the threshold power density versus pressureis predicted by the classical theory [47, 48]. In our experiments, a minimum in the thresholdpower density versus pressure curve (figure 3) is observed. The electron cascade processcan also starts with an initial number of electrons in the focal volume that are produced bynatural ionization due to cosmic radiation [49]. In air at atmospheric pressure, the naturalelectron density is ∼103 cm−3. Therefore, starting from our experimental observations we canconclude that although, the first electrons must appear via multiphoton ionization or naturalionization, electron cascade is the main mechanism responsible for the breakdown in N2.

Optical emission studies of nitrogen plasma generated by IR CO2 laser pulses 4589
4. Conclusions
Laser-induced dielectric breakdown generated by CO2 laser pulses in nitrogen gas has beeninvestigated by means of OES. The plasma produced in nitrogen gas and pressures rangingfrom 4 × 10³ to 1.2 × 10⁵ Pa has been measured and analysed. Optical breakdown thresholdintensities in N2 at 9.621 µm have been measured. The strong emission observed in the plasmaregion is mainly due to the relaxation of excited atomic N and ionic fragments N+ and N2+.Various atomic lines overlap with molecular features of N+
2
(B2�+
u –X2�+g
), N+
2(D2�g–A2�u),N2(C3�u–B3�g) and N2
(B3�g–A3�+
u
)transitions and produce a rather complex structure,
but the high-resolution spectra allow for a precise assignment of many observed transitions.In LIDB spectra, the relative intensities of the 0–0 band heads in the N2(C–B) and N+
2(B–X)systems are surprisingly very weak. The LIDB spectrum has been compared with the bandspectrum of a dc electric glow discharge at low pressure. This spectrum is dominated bythe emission of strong molecular features N2(C–B) and N2(B–A) and very weak N+
2(B–X).Both spectra exhibit very big differences associated with the involved different excitationmechanisms. An excitation temperature around 21 000 K was calculated by means of ionizednitrogen atomic lines assuming LTE. This value implies an ionization degree that agrees withthe observed LIDB emission spectra. The physical processes leading to the LIDB of nitrogenin the power density range 0.4 < J < 4.5 GW cm−2 have been analysed. On the basis ofour experimental observations, we can suggest that although the first electrons must appearvia multiphoton ionization or natural ionization, electron cascade is the main mechanismresponsible for the breakdown in nitrogen.
Acknowledgments
It is a pleasure to acknowledge the excellent technical support of A Magro. We gratefullyacknowledge the support received from the DGICYT (Spain) Projects I+D: BQU2002-01502and MEC: CTQ2007-60177/BQU for this research.
References
[1] Isenor N R and Richardson M C 1971 Appl. Phys. Lett. 18 224[2] Lyman J L and Jensen R J 1972 Chem. Phys. Lett. 13 421[3] Cantrell C D, Freund S M and Lyman J L 1979 Laser Induced Chemical Reactions and Isotope Separation in
Laser Handbook vol 3b ed M L Stitch (Amsterdam: North-Holland)[4] Lyman J L, Quigley G P and Judd O P 1980 Multiple-Photon Excitation and Dissociation of Polyatomic
Molecules ed C D Cantrell (Berlin: Springer)[5] Hermann J and Floch T L 2004 J. Appl. Phys. 96 3084[6] Lofthus A and Krupenie P H 1977 J. Phys. Chem. Ref. Data 6 113[7] Babankova D et al 2006 J. Phys. Chem. A 110 12113[8] Nordstrom R J 1995 Appl. Spectrosc. 49 1490[9] Hanafi M, Omar M M and Gamal Y E E D 2000 Radiat. Phys. Chem. 11 57
[10] Baravian G, Godart J and Sultan G 1982 Phys. Rev. A 25 1483[11] Sorokin A A, Bobashev S V, Tiedke K and Richter M 2006 J. Phys. B: At. Mol. Opt. Phys. 39 299[12] Marquette A, Gisselbrecht M, Benten W and Meyer M 2000 Phys. Rev. A 62 22513[13] D’Orazio M and Schrader B 1974 J. Raman Spectrosc. 2 585[14] Reader J, Sansonetti C J and Bridges J M 1996 Appl. Opt. 35 78[15] Chan C H, Moody C D and McKnight W K 1973 J. Appl. Phys. 44 1179[16] Chan C H and Moody C D 1974 J. Appl. Phys. 45 1105[17] Gamal Y E E-D and Abdel-Monelm N M 1987 J. Phys. D: Appl. Phys. 20 757[18] Kroll N and Watson K M 1972 Phys. Rev. A 5 1883[19] Gamal Y E E-D and Azzouz I M 2001 J. Phys. D: Appl. Phys. 34 3243
4590 J J Camacho et al
[20] Smith D C 1971 Appl. Phys. Lett. 19 405[21] Rosen D I and Weyl G 1987 J. Phys. D: Appl. Phys. 20 1264[22] Striker J and Parker J G 1982 J. Appl. Phys. 53 851[23] Gasmi T, Zeaiter H A, Ropero G and Gonzalez-Urena A 2000 Appl. Phys. B 71 169[24] NIST Atomic Spectra Database http://physics.nist.gov/PhysRefData/ASD/index.html[25] Eriksson K B S 1983 Phys. Scr. 28 593[26] Moore C E 1975 Natl Stand. Ref. Data Ser., Natl Bur. Stand. (U.S.) vol 3 section 5[27] Brown J M, Varberg T D, Evenson K and Cooksy A L 1994 Astrophys. J. 428 L37[28] Spyromilio J 1995 Mon. Not. R. Astron. Soc. 277 L59[29] Wiese W L, Fuhr J R and Deters T M 1996 J. Phys. Chem. Ref. Data Monogr. 7 335[30] Morton D C 2003 Astrophys. J. Suppl. Ser. 149 205[31] Herzberg G 1950 Spectra of Diatomic Molecules (New York: Van Nostrand)[32] Gaydon A G 1968 Dissociation Energies and Spectra of Diatomic Molecules (London: Chapman and Hall)[33] Steinfeld J I 1986 An Introduction to Modern Molecular Spectroscopy (London: MIT Press)[34] Bernath P F 1995 Spectra of Atoms and Molecules (New York: Oxford University Press)[35] Herzberg G 1931 Ergeb. Exakten Nat.wiss. 10 207[36] Pannetier G, Marsigny G L and Guenebaut H C 1961 R. Acad. Sci., Paris 252 1753[37] Tanaka Y and Jursa A S 1961 J. Opt. Soc. Am. 51 1239[38] Meinel A B 1950 Astrophys. J. 112 562[39] Ledbetter J W Jr 1972 J. Mol. Spectrosc. 42 100[40] Huber K P and Herzberg G 1979 Molecular Spectra an Molecular Structure: IV. Constants of Diatomic
Molecules (New York: Van Nostrand-Reinhold)[41] Laher R R and Gilmore F R 1991 J. Phys. Chem. Ref. Data 20 685[42] Gilmore F R 1965 J. Quant. Spectrosc. Radiat. Transfer 5 369[43] Eriksson K B S and Pettersson J E 1971 Phys. Scr. 3 211[44] Aguilera J A and Aragon C 2004 Spectrochim. Acta B 59 1861[45] Bebb H B and Gold A 1966 Multiphoton ionization of hydrogen and rare gas atoms Physics of Quantum
Electronics ed P L Kelly, B Lax and P E Tannenwald (New York: McGraw-Hill)[46] Bebb H B and Gold A 1966 Phys. Rev. 143 1[47] Zel’dovich Y B and Raiser Y P 1965 Sov. Phys.—JETP 21 190[48] Demichelis C 1969 IEEE J. Quantum Electron. 5 188[49] Kopiczynski T L, Bogdan M, Kalin A W, Schotzau H J and Kneubuhl F K 1992 Appl. Phys. B: Photophys.
Laser Chem. 54 526