optical communications with a geiger mode apd · 1.1 underwater communication ... there is a window...
TRANSCRIPT

Optical Communications With A Geiger Mode APD
Array
by
Benjamin William HorkleyS.B., EECS, MIT 2014
Submitted to the Department of Electrical Engineering and Computer
Science
in partial fulfillment of the requirements for the degree of
Master of Engineering in Electrical Engineering and Computer Science
at the
MASSACHUSETTS INSTITUTE OF
TECHNOLOGY
Distribution A: Public Release
February 2016
○c Massachusetts Institute of Technology 2016. All rights reserved.
Author . . . . . . . . . . . . . . . . . . . . . . . . . . . . . . . . . . . . . . . . . . . . . . . . . . . . . . . . . . . . . . . .
Department of Electrical Engineering and Computer Science
January 29, 2016
Certified by. . . . . . . . . . . . . . . . . . . . . . . . . . . . . . . . . . . . . . . . . . . . . . . . . . . . . . . . . . . .
Timothy M. Yarnall
Technical Staff, MIT Lincoln Laboratory
Thesis Supervisor
Certified by. . . . . . . . . . . . . . . . . . . . . . . . . . . . . . . . . . . . . . . . . . . . . . . . . . . . . . . . . . . .
Robert T. Morris
Professor, MIT EECS
Thesis Supervisor
Accepted by . . . . . . . . . . . . . . . . . . . . . . . . . . . . . . . . . . . . . . . . . . . . . . . . . . . . . . . . . . .
Dr. Christopher Terman
Chairman, Masters of Engineering Thesis Committee

2

Optical Communications With A Geiger Mode APD Array
by
Benjamin William Horkley
Submitted to the Department of Electrical Engineering and Computer Scienceon January 29, 2016, in partial fulfillment of the
requirements for the degree ofMaster of Engineering in Electrical Engineering and Computer Science
Abstract
In this thesis, I evaluated the theoretical and practical performance of a Geiger modeavalanche photodiode (GM-APD, or Geiger mode APD) array for use in optical com-munications systems. I designed and implemented a test pattern generator, capableof producing waveforms with OOK and PPM modulations at a variety of symbolrates and duty cycles. Using this pattern generator, I tested the receiver propertiesover a wide range of data rates and illumination levels, and was able to demonstratethe capability for error-free communications in both modulation formats, up to 78.8Mbps at a sensitivity of 1.8 photons per bit for OOK, and 34.9 Mbps at 2 photonsper bit for PPM.
Thesis Supervisor: Timothy M. YarnallTitle: Technical Staff, MIT Lincoln Laboratory
Thesis Supervisor: Robert T. MorrisTitle: Professor, MIT EECS
3

4

Acknowledgments
Working in Group 67 at Lincoln Laboratory has been an incredible experience over
the past year and a half, and I have enjoyed getting to know all of the people here and
see the passion and drive that goes into the Lab’s amazing research. My thanks go
especially to Tim Yarnall, Ajay Garg, and Scott Hamilton, for their care and guidance
in completing this project, and their patience in helping me to learn a great many
things over the course of my research.
5

6

Chapter 1
Introduction
1.1 Underwater Communication
Underwater communication is important for many applications across a variety of
fields, from military to scientific to commercial. Reliable and high-rate links are
needed for applications such as interfacing with underwater sensor networks, commu-
nication between autonomous vehicles, and networking underwater devices. While
underwater fibers have been enormously successful at networking around the globe,
many applications cannot use a physical connection between devices, giving a need
for communication systems which can work directly over the underwater channel.
Acoustic underwater communication systems have a long history, arising from re-
search on sonar early in the 20th century. Because acoustic waves transmit very well
under water, such systems are able to operate at extremely long ranges, on the order
of dozens of miles. However, acoustic systems are naturally limited in available band-
width due to the relatively small range of audio spectrum available. Additionally,
acoustic systems can experience extreme Doppler shifts, channel fading, multipath
propagation, and time variance, all of which make maintaining communication diffi-
cult (particularly in shallow water) [1].
7

1.2 Underwater Optical Channel
Optical communication systems can offer extremely high data rate links (in excess
of a Gbit/s) by operating at much higher carrier frequencies, and by using band-
width in a regime where it is much more plentifully available. Such systems have
been used extensively in free-space applications, one of the shining examples being
the recent Lunar Laser Communication Demonstration (LLCD) performed by NASA
and Lincoln Laboratory in 2013 [2]. However, the underwater channel offers a par-
ticular challenge for optical systems, as electromagnetic radiation is absorbed much
more readily than in air. Frequencies in the radio band, which can work over enor-
mously long ranges for space or telecommunications applications, are absorbed over
the order of centimeters in water, making them wholly unsuitable in that domain.
Figure 1-1 shows the absorption spectrum of water, as compiled from several studies;
most wavelengths of light have similarly poor extinction lengths, with a few peaks in
the IR wavelengths corresponding to specific molecular absorption points. However,
there is a window in the visible wavelengths, centered around blue-green wavelengths
near 500 nm. Although water absorption still severely limits transmission of signals,
the presence of such a window with considerable bandwidth offers the possibility of
extremely high data rate communications, leveraging approaches developed for free-
space optical communication.
A variety of underwater optical systems have been explored, primarily over the
past 10 to 15 years. Hanson and Radic in 2008 demonstrated the capability for 1
Gbit/s communication over a 2-meter long pipe in the laboratory, with simulation
results suggesting the possibility of similarly high data rates over distances of tens
of meters [4]. Current commercial systems boast data rates of up to 250 Mbps at a
range of 200 meters [5].
8

Figure 1-1: Electromagnetic absorption spectrum of water for various wavelengths.Higher values indicate faster absorption and lower extinction range. [3]
1.3 APDs and APD Arrays
Avalanche photodiodes, or APDs, are a class of extremely sensitive semiconductor
photodetectors [6]. When a relatively small negative bias is applied, APDs operate in
linear mode, in which the electrical response is proportional to the incoming optical
power. Linear APDs are widely used in optical communications systems, including
for underwater applications. Applying a larger negative bias to the APD puts it into
Geiger mode, in which the response becomes non-linear. Incident photons while the
APD is in this state trigger a chain reaction, resulting in a large sudden spike in
voltage which can be read out as a digital pulse. This pulse can be timed to high
precision, making it suitable for use in a photon counting system. Another benefit of
Geiger-mode APDs is that they do not require cryogenic cooling, as is required for
other high-sensitivity systems like superconducting nanowire detectors [7].
The main drawback of a Geiger-mode APD system is its potentially high dark
count rate. Because the APDs are biased to the point of complete breakdown from
a single photon, they are also susceptible to spurious fires from numerous sources,
including crosstalk from other detectors in the same array. Additionally, after a
9

successful detection, the detector must be quenched and reset through a specific
pattern of voltage biases, which leaves the APD out of operation for a short time
period after recording a fire, ranging from 10’s of nanoseconds to microseconds. This
limits the number of counts a single APD can record, and thus its sensitivity; a linear
APD is limited instead by the speed at which its output voltage can be read, and
high-speed ADCs are readily available.
Geiger-mode APDs can be combined into arrays with large numbers of detectors,
allowing for scaling of dynamic range with relatively little overhead on space and
power. These help to offset some, though not necessarily all, of the general issues
with Geiger-mode APDs. While an array of Geiger-mode APDs does have an overall
higher rate of dark counts than a single detector, this is more than compensated for
by the extra detectors. A sufficiently large APD array could potentially provide a
high-sensitivity detection system with extremely fine-grained timing resolution, which
could work across a variety of modulation formats. While the use of Geiger-mode APD
arrays has been successful in applications such as 3D imaging [8], the use of silicon
Geiger-mode APD arrays for undersea applications has not been well-explored.
1.4 Thesis Structure
My thesis work at MIT Lincoln Laboratory was focused on exploring the poten-
tial application of a Geiger-mode APD array for communications, by designing and
performing small-scale experiments with a custom Geiger-mode APD receiver array
developed at Lincoln Laboratory. Chapter 2 discusses the array’s operation, and the
limitations on the array’s noise floor and count rate ceiling. Chapter 3 discusses the
setup of the communications experiments performed, the test transmitter developed
for carrying out these experiments, and both a theoretical and experimental analysis
of the communications results. Chapter 4 examines directions for possible future work
based on this Geiger-mode APD array technology, and summarizes the main results.
10

Chapter 2
Receiver Hardware
The experiments for this thesis were performed using a Geiger-mode APD array
developed by Group 87 at MIT Lincoln Laboratory, consisting of 1024 individual
photodiodes arranged in a 32x32 grid. This detector array is backed by a custom
readout integrated circuit, or ROIC, which takes care of resetting each of the detectors
after they are triggered, determining exactly when each detector fired, and all of the
other maintenance tasks required to keep each of the detectors running.
The ROIC contains an on-board memory which can buffer the time-of-fire infor-
mation from the APD array, allowing readout to a PC for external processing. The
address of each of these fires within the memory uniquely determines the position
of the detector and the frame number in which it fired, which can be used during
readout to build up a complete time- and position-stamped map of all pixel fires.
2.1 ROIC Clocking
The major unit of time for the ROIC is the frame, which consists of 1024 individual
time bins. The length of each of these bins is determined by the ROIC’s clock,
which can be set either to an internally generated 311 MHz clock or an external
source. For all of my experiments, the frequency was kept to 311 MHz to match
this internal frequency, as the array had received significant prior testing at this
frequency; however, an external clock generator was used instead of the internal clock
11

as discussed in Section 3.1. Each element of the array can signal exactly one count
per frame.
Elements of the array are reset individually, but all resets occur on a quarter-frame
clock, running 4 times as fast as the overall frame clock. A minimum reset time can
also be specified (as a number of quarter-frames), to ensure that a single element is
not triggered, reset, and re-triggered within a single frame. The setting of the reset
time is discussed below, in section 2.2.2.
The ROIC firmware also allows the setting of a switch for using the Vernier bit in
timing of photon arrivals. While this mode is enabled, the array’s timing resolution
is effectively doubled, with arrival events clocked on a 622 MHz clock instead of the
311 MHz base clock frequency, and the frame clock which drives the resetting of
triggered elements is also doubled. This lowers the minimum reset time for a single
element from 1024 311 MHz clock cycles to 1024 622 MHz clock cycles, or 1.65 𝜇s.
The Vernier-enabled mode was used for all of my tests.
2.2 Receiver Limitations
The nature of the detector array imposes limitations for both very weak signals (in the
form of a noise floor) and very strong signals (from blocking loss), both of which have
an impact on the maximum performance which can be expected from the array as a
receiver. As discussed in 1.3, because Geiger-mode APDs are biased in the breakdown
region, they frequently register dark counts, spurious fires triggered by noise within
the system. The noise floor is raised significantly by particular detectors within
the array which consistently register dark counts, far above the rate of the rest of the
array; this can be largely mitigated by identifying those detectors and disabling them,
as described in section 2.2.1. The signal ceiling is limited primarily by the number of
available detectors, and how quickly they are able to reset to register new detections
while having all triggering events recorded. While this ceiling is fixed for a particular
size array, it can be quantified and used to determine the range of optical powers the
array can reasonably handle for doing communications. This ceiling is examined in
12

section 2.2.2.
2.2.1 Always-on Detectors
Because the array used for testing was not a mass-production system, but rather
a research-grade prototype, some irregularities were identified which needed to be
corrected when using it as a communications receiver. In particular, due to minute
differences in the individual detectors, the entire array was not able to be stably
operated in Geiger mode at once. An operating voltage of -30.6 V was found to
provide the best performance for testing; however, at this voltage, many pixels in
the array would be stuck in a state of continuous fire, triggering another fire count
immediately after being reset by the ROIC firmware. These always-on pixels, which
at times were up to 20% of the array, made an enormous impact on the sensitivity of
the array, and under most light conditions tested completely overwhelmed the non-
noise portion of the incoming signal. Additionally, many of these always-on detectors
caused spillover to neighboring detectors, often triggering a fire on them as well
through cross-talk. This level of dark-count noise made communications completely
impossible, and the problematic detectors needed to be disabled through the ROIC
firmware. These issues were dealt with by generating a mask of the most problematic
detectors through post-processing a no-light data collection, and then disabling those
detectors through the ROIC firmware. Figure 2-1 shows a typical distribution of the
counts from one of these dark count collections. A threshold was selected shortly
above the “knee” of the distribution, where the number of dark counts began to rise
rapidly; in the example distribution shown, this would be at around 5000 counts, out
of 80,000 total chances to fire over the capture.
For later tests, a standardized mask was adopted across data collections, to keep
the array properties constant while changing data rates and illumination. While ini-
tially a new mask was generated for each data set, each of these masks showed little
variation from day to day, and the standard was adopted for simplicity and consis-
tency. Rather than the one-level generation described above, this standardized mask
was generated in two stages. First, a mask was generated using a higher threshold,
13

Figu
re2-1:
Cumulative
distrib
ution
ofdark
countsfor
atypical
unmasked
collection.Thebottom
charts
aresorted
inascen
ding
order
ofcou
nts,
fromthequietest
pixelto
thenoisiest.
Thespatial
distrib
ution
ofalw
ays-on
pixels
isran
dom
,as
canbeseen
inthetop
grids.
14

which disabled only the most problematic detectors (those which were very close to
100% fire rate). Then, an additional dark count collection was taken using that mask,
and a new threshold selected. This two-stage mask generation helped identify detec-
tors which were only problematic as a result of cross-talk and allowed them to be
kept on, increasing the array sensitivity. Figure 2-2 demonstrates the results of this
masking; the highest rate of dark counts after masking is about 5% of highest rate
pre-masking.
A dark count collection with the array masked was also used to determine the
background level of dark counts; this is of importance in determining the best per-
formance of the non-ideal array for communications as discussed in section 3.2. This
background level of dark counts was found to remain very consistent across multiple
days of data collection, despite not being able to completely isolate the detector from
the ambient lighting conditions in the lab. Consequently, several different dark count
rates were averaged together and used as a canonical level of dark-count background.
2.2.2 Blocking Loss
The reset time of the ROIC firmware imposes an upper bound on the number of
photons the array is able to detect in a given amount of time; if additional photons
are incident on a particular APD before it is re-armed, it will simply fail to fire,
and the count will not be registered. For low light levels, this is not problematic, as
photons are distributed around the array, and the probability of consecutive photons
hitting exactly the same detector element is quite low. This is especially true as the
beam profile becomes more flatly distributed around the array as would be expected
from a transmission beam starting a long way away from the detector and going
through diffraction. However, as more photons are incident on the detector, there
becomes a higher probability of a detection event being missed because a detector is
not reset in time to be re-triggered. This can limit the array’s sensitivity, especially
if particular detectors have more incident photons than the array-wide time average,
due to either spatial or temporal clustering.
The maximum counting capacity of the array can be found by simply multiplying
15

Figu
re2-2:
Thetop
leftim
ageshow
satypical
dark
countcap
ture,
before
mask
ingof
always-on
detectors.
Thetop
rightim
ageisthestan
dard
mask
used
forcom
munication
sexperim
ents,
with
167disab
leddetectors.
Thebottom
image
isanoth
erdark
countcap
ture,
with
thedisab
lemask
applied
;thehigh
estdark
countrate
isabout5%
oftherates
seenin
theunmasked
capture.
16

the number of active pixels by the maximum rate at which they can be reset and
fire again. With the Vernier bit mode enabled, the minimum reset time of one full
ROIC frame is 1024 bins divided by a 622 MHz clock signal, or 1.65 𝜇𝑠. With the
standardized pixel mask as described in the previous section disabling 167 of the 1024
detectors in the array, this gives an absolute maximum rate of 520 · 106 counts per
second. In practice, blocking loss can be observed significantly below this maximum
level, as the spatial distribution of the beam is not uniform around the array, and
incoming photons are not able to perfectly redistribute to use all available detectors.
Figure 2-3 below shows the rate of counts found under constant illumination at various
power levels, with the ROIC firmware’s minimum reset time set to several different
values.
As indicated in figure 2-3, the count rates under various illuminations show three
broad regions. At low powers, the total count rate is completely dominated by dark
counts, which occur at a rate of roughly 4.5 Mcounts/s over the entire array. At
illuminations from about -70 to -55 dBm, the number of detected photons grows
roughly linearly with input power. Past that point, the number of counts the array can
detect saturates, approaching the count rate at which all enabled detectors are firing
continuously. The longest reset time tested, equivalent to 5 ROIC quarter-frames, left
additional dead time after an APD fire and began exhibiting signs of blocking loss
at lower power levels, which can be seen in the black curve’s downward tail before
-55 dBm. Although the shorter reset times performed about equivalently over the
linear portion of the input-to-detected graph, they offer the possibility of counts later
in a frame overwriting those coming earlier in the frame. Similarly to the effects of
blocking loss, these overwrites could cause burst errors in the communications signal,
degrading the signal quality in the first half of the frame. These shorter reset times
also did not offer any advantage in the maximum number of counts able to be detected,
due to the limitation on the speed at which the ROIC can report counts; reset times
of 2, 3, and 4 quarter frames all gave a maximum count rate of approximately 500 ·106
counts per second, compared to 400 ·106 for the longest reset time. For these reasons,
the reset time for all experiments was fixed to be equal to one ROIC frame, 1.65 𝜇𝑠.
17

Figu
re2-3:
Detected
photon
svs.
inputpow
erfor
severaldifferen
tROIC
minimum
resettim
es.
18

Chapter 3
Communications Experiments
These experiments were primarily designed with the goal of proof-of-concept use of
the Geiger mode array as a communications receiver under laboratory conditions.
Consequently, the experimental setup was in many ways simplified from how it would
appear in a larger-scale commercial system. The primary clock input for the ROIC
board was sourced from the same board providing the transmission test pattern, as
discussed below in section 3.1, rather than performing clock recovery at the receiver
board. This avoided the need for a dedicated clock feedback system, and ensured
that the ROIC bins remained at the same clock speed as the transmitted pattern,
although perfect alignment of the receiver time bins to the input pattern was not
guaranteed due to the delay in the optical system.
Illumination of the detector array was provided through a fiber coupling, mounted
a few centimeters above the array. The beam pattern was Gaussian in shape, with
maximum illumination at the center of the array and pixels at the edge receiving
approximately half as many photon counts as at the center. This pattern of illumina-
tion does mean that the center of the array begins to experience blocking loss before
the edge, although under most input powers tested blocking loss did not significantly
come into play. However, a non-uniform beam pattern is crucial for being able to
distinguish the center of the incident beam for performing tracking, and the beam
pattern was kept the same for the communications experiments as well, to provide
consistency and to evaluate the possibility for future experiments to provide both
19

Figure 3-1: System diagram for communications experiments. Dotted lines indicateoptical linkages; solid arrows indicate electrical linkages.
communications and tracking capabilities.
Two different modulation formats were used for these experiments: on-off keying
(OOK) and pulse-position modulation (PPM). In OOK, bits are directly modulated as
1 or 0 by the presence or absence of transmitted signal. In PPM, signal is transmitted
in exactly one of 𝑚 slots which make up a symbol; the choice of slot encodes log2𝑚
bits of information. Here PPM-𝑚 is used to refer to a PPM modulation scheme in
which each symbol has 𝑚 slots.
When discussing the rate at which the system operates, there are several important
terms to define. The symbol rate refers to the rate at which OOK or PPM symbols are
sent from the transmitter, given in baud. For OOK, this was always equal to either
1/2 or 1/4 the clock rate of the ROIC collection bins, which comes out to either 311
MBd or 155.5 MBd. For PPM, each slot was set to either 2 or 4 ROIC bins, the same
as a single OOK symbol; however, PPM-16 requires 16 of these slots per symbol, for
20

a symbol rate of either 19.4 MBd or 9.7 MBd. Block repeats are discussed in detail
below, and refer to layering repetitions of the input pattern over itself to aggregate
more counts in demodulating a single symbol. The channel rate refers to the rate
at which uncoded bits are sent over the channel, and is equal to the symbol rate,
divided by the number of block repetitions, and then multiplied by the number of
bits encoded by a single symbol. For OOK modulation, this multiplicative factor is
1, while for PPM-16 this factor is 4 (log2 16). Finally, the user rate refers to the
error-free data rate which could expect to be achieved by putting the demodulated
bit stream through a forward error correction (FEC) code, given in MBit/s.
3.1 Test Transmitter
To generate waveforms for communications testing of the array, I developed a pseudo-
random bit sequence (PRBS) transmitter, using the GTX high-speed transceivers on
a Xilinx Virtex 5 FPGA development board. I used a pre-existing 32-bit parallel
PRBS IP core, the output of which is then passed through a PPM encoder and then
to the input of the GTX transmitter block. The GTX transmitter output was passed
through RocketIO electrical outputs to an optical modulator, which gates light from
a 780 nm fiber-coupled laser. Figure 3-2 shows the overall architecture of the system,
up until the GTX transmitter. Switching between operating modes of the transmitter
is controlled through DIP switches on the development board.
The operating frequency of the transmitter is controlled using an on-board MAX3674
clock generation chip, with its frequency set through more DIP switches. A standard
operating frequency of 311 MHz was selected to match the ROIC’s onboard generated
clock frequency. The 311 MHz reference clock from the transmitter board was also
piped to the receiver board, for easier clock synchronization during initial testing. For
a field test, the full experimental setup would also include clock recovery and phase
alignment circuitry. GTX transceivers on the Virtex 5 FPGA platform operate at an
internal frequency of 10 times the reference clock, but the inputs are duplicated such
that the output bit clock operates at 2 times the reference frequency, or 622 MHz in
21

Figu
re3-2:
Block
diagram
oftest
transm
itter.
22

typical operation.
The transmitter can also be configured for either NRZ or RZ transmission, with
adjustable duty cycles of 80, 60, or 40 percent on for 1-bits. Multiple PRBS gen-
erators operating at different frequencies are included to allow seamless switching
between OOK and PPM-16. For both modulation settings (PPM and OOK), the
input unmodulated bit sequence is the same. Because the length of the test pattern
is odd, the same number of OOK and PPM-16 symbols are needed for encoding the
full pattern, although the PPM sequence requires 16 times as many ROIC bins to
repeat because of the size of the symbols.
For lower data rates, such as to accommodate aggregating multiple bins at the
receiver end to give better symbol differentiation, the transmitter can be reconfigured
to divide down the output rate by a factor of 2 or 4. This is done by further dividing
down the clocks used to drive the PRBS generator and PPM encoder, and duplicating
each bit more times on the GTX block input. While other clock divisions would be
possible to do with the same hardware, they would require large reconfiguration of
the transmitter design, in particular interfacing with the GTX’s 20-bit internal data
bus, and thus they were not included in this design The table in figure 3-3 shows the
uncoded data rates of the transmitter in its different modes of operation, with the
reference clock from the transmission board’s clock generator set to 311 MHz. Figure
3-2 shows a simplified block diagram of the PRBS transmitter system. Figure 3-4
shows the optical output pattern from OOK modulation at several duty cycles and
symbol rates, while figure 3-5 shows the optical output pattern from PPM modulation
with a 60% duty cycle at the three available base symbol rates. In both of the figures
with traces, the modulator output shown is inverted; these traces were taken from
the modulator’s electrical drive signal, where the higher voltage corresponds to the
modulator being set to block output.
The 80% duty cycle traces in figure 3-4 demonstrate why that duty cycle was
ultimately abandoned for testing, and why the 60% duty cycle was kept as the stan-
dard for the communications experiments. Although the most prominent peak in the
waveform occurs within a single OOK symbol duration, the modulator is not able
23

Modulation 1 slot/clock 2 slots/clock 4 slots/clockOOK 622 MBd 311 MBd 155.5 MBd
PPM-16 38.9 MBd 19.4 MBd 9.7 MBd
Figure 3-3: Symbol rates used on PRBS generator used for communications testpatterns.
to cleanly return to zero within a single symbol duration, and consequently the ex-
tinction ratio between adjacent “on" and “off" symbols is extremely poor. While this
issue still exists to a small degree in the 60% duty cycle case, it is far less pronounced,
and at a symbol rate of 155.5 MBd there is clear return to the baseline level between
adjacent symbols. The top row of traces, taken with a symbol rate of 622 MBd, show
the same issue; even at a duty cycle of 40% (not pictured), the modulator was not
able to respond quickly enough to return to the baseline level between adjacent “on"
symbols. Preliminary tests with a commercial BER tester were unable to lock onto
the signal at any light level, suggesting high levels of inter-symbol interference.
The PRBS generator was designed to be easily reconfigurable for a longer test
pattern, by swapping out the 27− 1 pattern for an IP core with a longer repeat time,
several of which existed in-house. However, 27 − 1 was deemed to be sufficient for
communications benchmarking, and using a relatively short pattern was advantageous
for the modifications being made in post-processing on the benchmark data. In
particular, this allowed post-processing results with block repeats added, while having
enough symbols in the collections (limited by the ROIC’s on-board memory) to draw
meaningful results. Block repeating, or aggregating received counts over multiple
repetitions of the input pattern, allows for the simulation of a larger and more sensitive
array, or equivalently a longer symbol duration.
3.2 Theoretical Communications Analysis
For a photon-counting detector such as a Geiger-mode APD, the distribution of pho-
tons typically follows a Poisson distribution. This distribution is defined completely
by a mean number of counts 𝜆; given this mean, the probability of detecting exactly
24

Figure 3-4: Electrical drive from modulator for OOK modulation, at various symbolrates and duty cycles. The left column is an 80% duty cycle, the right column is 60%.From top to bottom, the rows are at symbol rates of 622 MBd, 311 MBd, and 155.5MBd.
25

Figure 3-5: Electrical drive from modulator for PPM modulation, with a 60% dutycycle at 39.4 MBd, 19.7 MBd, and 9.8 MBd.
26

𝑘 photons during a particular symbol duration is given by 𝜆𝑘𝑒−𝜆
𝑘!. For modulation for-
mats such as PPM and OOK, in which each slot is either in an “on” or “off” position,
these two possibilities will have separate associated means, and thus different distri-
butions of expected counts. For the discussions below, 𝑓(𝑘;𝜆) denotes the probability
of detecting exactly 𝑘 photons in a particular slot from a Poisson distribution with
mean 𝜆.
3.2.1 OOK
To demodulate an OOK signal, a static threshold is set, against which the number of
photons detected in a symbol duration is compared. Any number of photons greater
than the threshold is demodulated as a 1, and any number less than the threshold
is demodulated as a 0. The mean number of photons in a dark count symbol is
denoted here by 𝜆𝐷, while the number of photons in a “signal" symbols is denoted
by 𝜆𝑆. Because spurious counts also occur during “signal" symbols, 𝜆𝑆 will always be
greater than 𝜆𝐷. To optimize the bit error rate, the threshold should be set to the
point at which the two Poisson distributions with these means intersect. The lowest
integer number of counts which should be demodulated as a 1 is the first 𝑛 for which
𝑓(𝑛;𝜆𝑆) > 𝑓(𝑛;𝜆𝐷) and 𝑓(𝑛− 1;𝜆𝑆) < 𝑓(𝑛− 1;𝜆𝐷).
When performing OOK demodulation with no background noise, the optimal
strategy will always be to decode anything with 0 counts as 0, and anything with
positive counts as a 1. However, when background is factored in, the optimal decoding
threshold will change as a function of the input power. This can be seen in the
theory vs. experiment curves in Section 3.3, as the theoretical BER curve is not
a single smooth curve, but rather several distinct curves spliced together, with a
discontinuous derivative at the joining point. These discontinuities mark where the
optimal threshold value changes, as the input power becomes sufficiently high that
the point at which the 0-bit and 1-bit Poisson curves intersect moves to the right past
an integer.
27
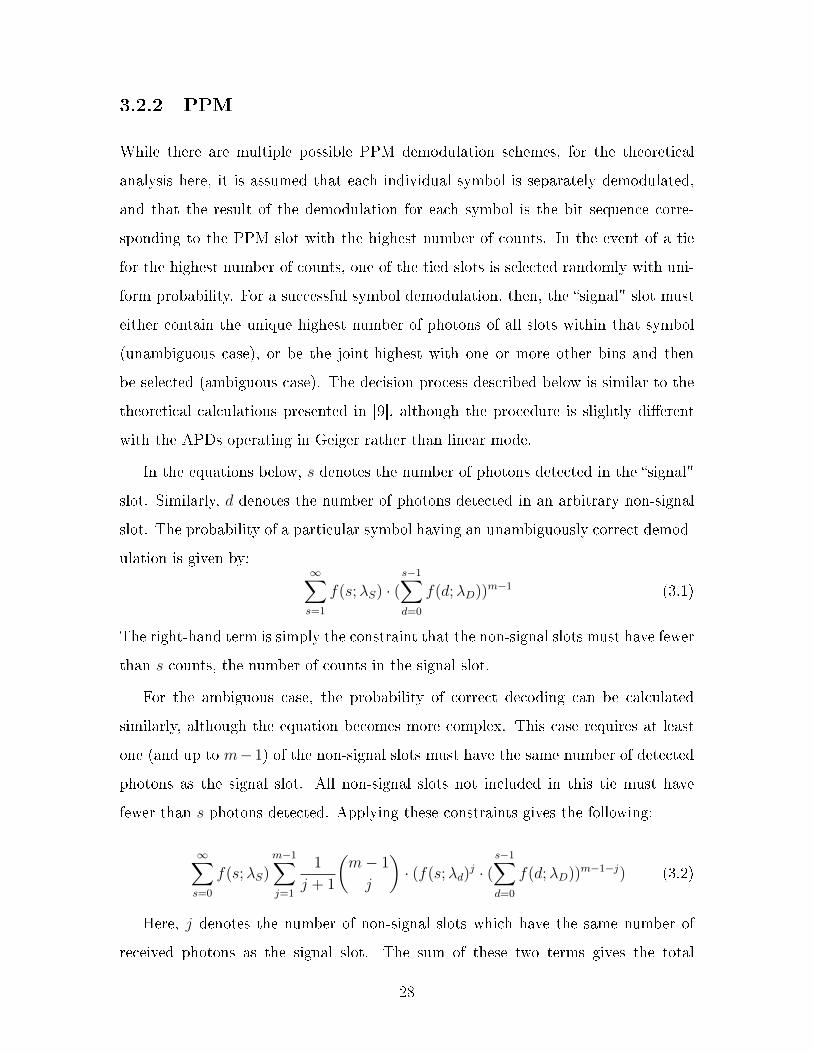
3.2.2 PPM
While there are multiple possible PPM demodulation schemes, for the theoretical
analysis here, it is assumed that each individual symbol is separately demodulated,
and that the result of the demodulation for each symbol is the bit sequence corre-
sponding to the PPM slot with the highest number of counts. In the event of a tie
for the highest number of counts, one of the tied slots is selected randomly with uni-
form probability. For a successful symbol demodulation, then, the “signal" slot must
either contain the unique highest number of photons of all slots within that symbol
(unambiguous case), or be the joint-highest with one or more other bins and then
be selected (ambiguous case). The decision process described below is similar to the
theoretical calculations presented in [9], although the procedure is slightly different
with the APDs operating in Geiger rather than linear mode.
In the equations below, 𝑠 denotes the number of photons detected in the “signal"
slot. Similarly, 𝑑 denotes the number of photons detected in an arbitrary non-signal
slot. The probability of a particular symbol having an unambiguously correct demod-
ulation is given by:∞∑︁𝑠=1
𝑓(𝑠;𝜆𝑆) · (𝑠−1∑︁𝑑=0
𝑓(𝑑;𝜆𝐷))𝑚−1 (3.1)
The right-hand term is simply the constraint that the non-signal slots must have fewer
than 𝑠 counts, the number of counts in the signal slot.
For the ambiguous case, the probability of correct decoding can be calculated
similarly, although the equation becomes more complex. This case requires at least
one (and up to 𝑚− 1) of the non-signal slots must have the same number of detected
photons as the signal slot. All non-signal slots not included in this tie must have
fewer than 𝑠 photons detected. Applying these constraints gives the following:
∞∑︁𝑠=0
𝑓(𝑠;𝜆𝑆)𝑚−1∑︁𝑗=1
1
𝑗 + 1
(︂𝑚− 1
𝑗
)︂· (𝑓(𝑠;𝜆𝑑)
𝑗 · (𝑠−1∑︁𝑑=0
𝑓(𝑑;𝜆𝐷))𝑚−1−𝑗) (3.2)
Here, 𝑗 denotes the number of non-signal slots which have the same number of
received photons as the signal slot. The sum of these two terms gives the total
28

probability of a correct demodulation, so the probability of a symbol error (that is,
an incorrect demodulation) can be found by subtracting both of these terms from 1.
𝑆𝐸𝑅 = 1−∞∑︁𝑠=1
𝑓(𝑠;𝜆𝑆) · (𝑠−1∑︁𝑑=0
𝑓(𝑑;𝜆𝐷))𝑚−1
−∞∑︁𝑠=0
𝑓(𝑠;𝜆𝑆)𝑚−1∑︁𝑗=1
1
𝑗 + 1
(︂𝑚− 1
𝑗
)︂· (𝑓(𝑠;𝜆𝑑)
𝑗 · (𝑠−1∑︁𝑑=0
𝑓(𝑑;𝜆𝐷))𝑚−1−𝑗
(3.3)
3.2.3 Error Correction Capacity
Given a channel bit error rate 𝑝, the maximum error-free data rate of the channel can
be approximated as the channel data rate, multiplied by:
1 + 𝑝 · log2 𝑝+ (1− 𝑝) · log2 (1− 𝑝)
This is the Shannon capacity of the channel; many varieties of modern FEC code
are able to approach this limit. This quantity therefore gives an approximation for
the rate of the FEC code that would be needed for encoding the bits being sent over
the channel, such that error-free communication could occur. As an example, using
𝑝 = 3 · 10−2 gives a value of 0.8056, suggesting that if the uncoded data has a bit
error rate of 3%, then a rate .8 (or 4/5) code would be an appropriate choice of
encoding. This approximation is used below in discussion of appropriate choices of
error correction code rates.
3.3 Communications Results
For both modulation schemes, data sets of 100,000 ROIC frames were collected, cor-
responding to about 1/6 of a second worth of data. This was close to the maximum
capacity of the ROIC board’s on-board memory, and provided enough repetitions of
the test pattern to draw meaningful conclusions about the data; at the maximum
data rate tested, these 100,000 frames contain over 400,000 repetitions of the input
29

pattern, and over 50 million symbols. The input power level on the array was varied
between -70 and -55 dBm, as measured from the tip of the fiber shining onto the
detector array. This corresponds to the region on figure 2-3 where the ROIC showed
a linear response to input power, with the outermost data points lying just in the
background-dominated and saturation regions. The results below are discussed in
terms of detected signal photons, rather than a direct measurement of power, as the
exact quantum efficiency of the detector is not known, and measurement in terms of
detected photons allows for the best comparison to existing systems. As discussed
in the theory section above, and in the discussion on receiver limitations in section
2.2, the level of background dark counts was assumed to be constant for the purposes
of these tests. Verification of this assumption is discussed in the section on OOK
demodulation below.
3.3.1 Block Repetition
To simulate the results from performing the same test with a slower data clock,
multiple repetitions of the received pattern were layered on top of one another, and
counts across the repetitions were aggregated to perform demodulation. This scheme
provides results equivalent to those which could be expected by reducing the data
clock on the input and aggregating counts over additional time bins on the output,
but without needing to desync the generated clock from the clock used in the data
pathway, and without requiring additional redundant data collection. While aggre-
gating counts over multiple repetitions does increase the number of signal photons
available per symbol, it also does increase the total dark count background present
for each symbol, which for OOK modulation requires raising the decoding threshold,
in addition to reducing the effective symbol rate.
3.3.2 Background Counts
Because of the nature of the testing, an exact measurement of background counts for
any particular data set is impossible to count, as it cannot be determined whether
30

any particular detection event was actually triggered by the input signal or was spon-
taneous. Instead, background counts were assumed to occur with the same frequency
as seen in the complete darkness tests, with signal counts added on top of those. As
shown in figure 3-6, for tests in which the signal light level was not high enough to
encounter blocking loss in the array, this provided a good estimate for the background
count level, with counts in 0 symbols closely matching a Poisson distribution with a
mean of the assumed dark count rate. When blocking loss became a large enough ef-
fect to distort the distribution of signal counts, the distribution of dark counts among
non-signal slots also became heavily distorted.
3.3.3 OOK Modulation
Although the 311 MHz master clock was shared between the test pattern generator
and the receiver array on the ROIC, there is still potential for a mismatch in alignment
between the transmitted pattern and the received pattern, from the time needed to
propagate the optical signal through the modulator and fiber. For instance, it would
not be safe to assume that the repeated PRBS pattern begins a cycle directly at
the start of the first frame recorded; it is not only possible but highly probable that
the first symbol received is from somewhere in the middle of the PRBS sequence.
Further, it is not even guaranteed that the first bin recorded corresponds to the first
bin of a symbol which spans multiple ROIC bins, as is the case for all of the symbol
rates considered for further testing. In finding the bit error rates reported below, all
reasonable offsets in both the ROIC bins within a single symbol and symbols within
the full PRBS sequence were considered, and the reported error rates represent the
minimum of these.
Distributions of Bin Counts
The offsets used in finding the optimal BER (symbol offset within pattern, and ROIC
bin offset within symbol) were recorded, and used to generate a distribution of de-
tected photon counts for symbols now known to be 1 or 0. Figure 3-6 shows an
31

Figure 3-6: Distribution of counts for symbols corresponding to 0 in input pattern, forOOK modulation at 311 MBd, input power of -57 dBm, and no block repeats. Theblue histogram indicates experimental data; the red stars is the proportion predictedby a Poisson distribution of the same mean.
example of this distribution for the 0 bits in a particular input, while figure 3-7 shows
the count distribution for the 1 bits in that same data set. The blue bars are a
histogram of the number of detected photons in each symbol; the red stars overlaid
correspond to a Poisson distribution with the same mean. This same process can be
repeated for all combinations of input power, symbol rate, and block repeats. For
input powers well within the linear region, both the 0 bit and 1 bit histograms con-
sistently matched up well with the theoretical predictions. However, as the input
power rose to the saturation-limited region, the experimental curves began to match
up much less well, with high-count symbols overrepresented in the histogram.
32

Figure 3-7: Distribution of counts for symbols corresponding to 1 in input pattern, forOOK modulation at 311 MBd, input power of -57 dBm, and no block repeats. Theblue histogram indicates experimental data; the red stars is the proportion predictedby a Poisson distribution of the same mean.
33

Bit Error Rates
Figure 3-8 gives an example of the relationship between input power and symbol error
rate, given a fixed channel rate and number of block repetitions. The solid lines show
the theoretical best bit error rates, with the measured signal level. The lower blue
line represents shows the bit error rate assuming no background noise, while the red
line assumes the same level of background counts as measured in no-signal captures.
For lower input powers, the shape of the experimental curve mirrors the shape of the
red theory curve; at the highest input powers measured, a clear uptick in BER can
be observed. This is due to blocking loss from the array beginning to approach its
detection capacity; the highest input power levels being tested were very close to the
boundary discussed in 2.2.2 between the linear response and saturation regions. As
the signal level approaches saturation, a particularly strongly detected symbol earlier
in a ROIC frame can block out detections later in the same frame, leading to errors in
the later symbol. In this example, the minimal BER is reached at around 10 detected
photons per bit, or a detection rate of 260 ·106 photons per second. This is very close
to the count rate at the cutoff between the linear and saturation regions from figure
2-3, and indeed collections at other symbol rates and numbers of block repetitions
also showed saturation effects at a similar overall count level (though not at the same
number of photons per bit).
Figures 3-9 and 3-10 show the BER performance over a range of input powers and
block repeats for OOK modulation, at 311 MBd and 155.5 MBd respectively. As the
number of block repeats increases, the curves shift lower and to the right, indicating
a greater number of signal photons per symbol and a lower BER, as expected.
Similar to figure 3-8, we can observe the onset of blocking loss at a count rate of
between 250 and 300 Mcounts per second, most evident in the black triangles in figure
3-9, which correspond to data at a symbol rate of 311 MBd and 10 block repetitions.
The dotted lines in figures 3-9 and 3-10 represent the error correction thresholds
discussed in section 3.2.3. Three particular thresholds of interest were chosen, corre-
sponding to the error correction capabilities of Shannon-capacity codes at rates 1/2,
34

Figure
3-8:
BERforOOK
modulation
at155.5MBd,with6block
repeats.
35

Figu
re3-9:
BERfor
OOK
modulation
at311
MBd.
36

Figure
3-10:BERforOOK
modulation
at155.5MBd.
37

4/5, and 9/10. These three code rates are all used in the DVB-S2 standard, and
between them provide a representative sample of common code rates which would
be seen in telecommunications systems. At a symbol rate of 311 MBd, OOK modu-
lation is not able to pass any of these decoding thresholds without the use of block
repetitions. However, with block repetitions, the error rate can be pushed below the
decoding thresholds for both the rate 1/2 and 4/5 codes, although the tradeoff in
both symbol rate and photons per bit required to reach the error threshold for 4/5
make that impractical. Three different operating points of particular note were found,
with 4, 5, and 6 block repetitions. At 4 block repetitions, for a channel rate of 77.8
Mbit/s, the 1/2 rate error decoding threshold was passed with a signal strength of
3.25 detected photons per bit. With 5 repetitions, this threshold could be improved
to 2.20 photons per bit, and with 6 repetitions, it could be improved again to 1.98
photons per bit, although the extra block repetitions lead to lower channel rates of
62.2 Mbit/s and 51.8 Mbit/s respectively. This gives a maximum user data rate of
38.9 Mbit/s.
With a symbol rate of 155.5 MBd, a BER below the cutoff for a rate 1/2 code could
be reached with no block repetitions at a level of 1.78 photons per bit, yielding a user
data rate of 78.8 Mbit/s. This operating point can be seen at the right end of the data
points shown as red circles in figure 3-10. This was the lowest photons per bit required
across all OOK data which passed at least one of the error correction thresholds, and
across both modulation formats was the highest user data rate achieved. Figure 3-10
also shows that with block repetitions, these data were able to pass the lower-rate
error thresholds, and achieve symbol error rates as low as 10−4. However, because of
the block repetitions, this operating points require significantly more photons per bit
and a much lower user data rate, even with the higher-rate FEC codes.
3.3.4 PPM Modulation
Similar to the method used for OOK modulation described above, the best symbol
error rate for PPM modulation was determined by testing all possible alignments
of the detected sequence of counts with respect to the ROIC frame and the input
38

pattern, as this is the same function which would be performed by a clock recovery
loop in a real-world end-to-end communications system. As described in section 3.1,
the test pattern used for PPM modulation was the same as for OOK, but with bits in
the pattern divided into groups of 4 and encoded as PPM symbols. Over a period of
127 symbols, this gives a nearly flat distribution of symbols and a realistic distribution
of the number of PPM slots between adjacent symbols, making this modulated PRBS
pattern useful for PPM testing.
The nature of PPM modulation dictates that the symbol error rate specifies an
upper bound on the bit error rate. For symbols which are correctly demodulated,
then all log2𝑀 bits (for PPM-16, 4) are correctly identified. For symbols which are
incorrectly demodulated, we can still expect that on average, about half of the bits
for that symbol will have been correctly identified as well, simply from the chance of
having incorrectly guessed a symbol which shares some bits. The exact proportion of
correct bits from incorrect demodulations depends on several factors, including the
nature of the errors leading to the incorrect demodulation and whether the ‘signal’
slot for the PPM encoding is Gray-coded or directly translated from binary, and the
discrepancy between bit error rate and symbol error rate is not explored further here.
However, this upper bound does give some information about the code rates which
would be viable for forward error correction, as with OOK, and the data collected
show that PPM encoding is viable for a variety of measured data rates.
Figure 3-11 shows a sample of one of the symbol error rate curves collected for
PPM modulation, in this case with a symbol rate of 9.7 MBd and no block repeating.
Similar to the OOK results above, the experimental curve closely follows the shape of
the theoretical curve, before blocking loss causes a sharp drop in BER performance
as more of the detectors are spending more time waiting to be reset. As with OOK
demodulation above, the background count level is assumed to be equivalent to the
measured background with no incoming signal, and the signal count level is based on
the measured counts over the collection period with background counts subtracted
out. The blue line again represents the theoretical performance with no background,
while the red line indicates theoretical best performance including background.
39

Figu
re3-11:
SERfor
PPM
modulation
at9.7
MBd.From
topto
bottom
,thethree
dash
edlin
esshow
theFECerror
correctioncutoff
sfor
rate1/2,
4/5,and9/10
codes.
40

As in the OOK results, the PPM results clearly demonstrate the effect of blocking
loss, as evidenced by the symbol error rate decreasing with incoming signal power,
and However, the number of detected photons before the array exhibits blocking loss
is dramatically lower with PPM encoding. To again use figure 3-11 as an example,
at a symbol rate of 9.7 MBd, the lowest SER was achieved at a detection level of 5.7
photons per bit. This corresponds to a total count rate of 220 ·106 counts per second,
as compared to count rates of 260 to 300 ·106 counts per second with OOK. However,
this still leaves room for a greater number of photons per bit before blocking losses
occur, as PPM signals require a far lower proportion of the slots to contain signal,
and thus the same average power is concentrated into fewer slots with higher power
in each of those slots. This allowed the PPM collections to reach a much lower error
floor than OOK. With higher block repetitions, completely error-free runs were seen,
although the sample size of the data collections available was not sufficient to firmly
conclude that the channel was capable of completely error-free operation. For these
cases, while there is insufficient data to conclude that the communication is truly
error-free, we can give an approximation of the true symbol error rate as the inverse
of the number of symbols collected, multiplied by 10, on the order of 10−5; this can
be taken as a reasonable estimate of the error floor of the system, based on the data
available.
In addition to exemplifying the typical shape of the curve seen across all rates,
with the symbol error rate markedly rising at the saturation point, the data shown in
figure 3-11 also represent the best performance for PPM modulation among all of the
tests carried out. As with OOK, there is a tradeoff between user data rate and the
number of photons per bit needed to achieve that rate. Figure 3-11 contains three
particular operating points of interest, in the points which lie on or adjacent to the
FEC cutoff lines. At a symbol rate of 9.7 MBd, to achieve symbol error rate below
the 1/2 rate code cutoff requires 1.00 detected photons per bit, and yields a user data
rate of 19.4 Mbit/s. To improve to the error threshold of a rate 4/5 code requires
moving up to 1.45 photons per bit, for a user data rate of 31.0 Mbit/s. Finally, for
a rate 9/10 code and a data rate of 34.9 Mbit/s requires 2.05 detected photons per
41

bit. The 19.4 MBd tests were unable to reach the 1/2 rate code correction threshold
without block repeats, pushing both the photons required per bit up and the effective
channel rate down to less favorable levels than the slower channel rate. Similarly, the
collections which were able to achieve a symbol error rate below the 4/5 rate cutoff
performed worse on both of these metrics, with a minimum of 2.5 photons per bit
required at a channel rate of 19.4 Mbit/s, for a user data rate of 15.5 Mbit/s.
42

Chapter 4
Conclusions
This thesis demonstrates the potential for using a Geiger mode APD array as the
primary receiver in an optical communications system. Successful receipt and de-
modulation of an input signal was demonstrated over a wide range of data rates and
input powers, and at channel data rates of 30 Mbit/s and above (enough bandwidth
for applications such as streaming high-definition video), symbol error rates of less
than 10−4 were achieved, a low enough error floor for a wide variety of FEC codes to
function.
For OOK, a maximum user data rate of 78.8 Mbit/s was achieved, with a symbol
rate of 155.5 MBd, an input power of 1.78 photons per bit, and a BER suitable for
a rate 1/2 FEC code. At a channel rate of 311 MBd, operating points were achieved
with user data rates of 38.9, 31.1, and 25.9 Mbit/s, with input powers of 3.25, 2.20,
and 1.98 photons per bit. With PPM, user data rates of 34.9, 31.0, and 19.4 Mbit/s
were achieved, with corresponding input powers of 2.05, 1.45, and 1.00 photons per
bit. For both OOK and PPM modulations, using the slowest of the available channel
rates was significantly better for achieving both a higher user data rate and a lower
required input power. Further study with lower base symbol rates, which could be
done with a redesign of the test transmitter, could yield higher potential data rates,
and would be an interesting topic for future work in this area.
43

4.1 Future Work
4.1.1 450 nm Detector
The system used for this project operated at 780 nm, in the near-infrared. While
this wavelength is suitable for free-space optical communications (and indeed is used
in many such systems currently in operation), as discussed in the introduction, it
has significant absorption underwater, and thus would be unsuitable for underwater
use. A replacement detector array specifically designed for a blue-green wavelength
of around 450 nm is in development, but was not available at the time of this project.
This replacement will use exactly the same ROIC and underlying firmware, but the
detectors themselves and the optics will be replaced to be optimized for the new
wavelength. Once this updated detector is available, it would be of value to replicate
the results from this thesis, to ensure that the new detector has the same potential
as the current 780 nm system. Following that, tests under less idealized conditions
would help establish the system’s potential, including testing through an actual water
channel, which was not practical for the system available for this thesis due to the
high absorption of 780 nm light.
4.1.2 Real-Time Communications
In order to determine the best possible conditions for demodulation, all of the process-
ing for this thesis took place in post-processing, with data sets that had been collected
in full and buffered off the detector’s memory with effectively unlimited time for pro-
cessing. In order to run a real-world communications system, though, this processing
would need to take place in real time, with demodulation and decoding happening
directly on a data stream.
4.1.3 Pointing and Tracking
Experiments involving pointing and tracking were originally part of the proposed
work for this thesis; unfortunately, due to time constraints, they were not able to
44

be included in the work presented here. However, as previously mentioned, an APD
array such as this one has a great deal of potential for use in a tracking system. The
spatial information on the number of fires at each pixel location is already available,
and the firmware could be modified to process that information in real time, giving
a centroid value as an estimate for the beam’s position. This centroid information
could be fed back to the transmitter over a low rate out-of-band system, and the
transmitter beam could then be adjusted to properly center on the primary detector.
One of the challenges in adapting the ROIC firmware for tracking would be in
properly accounting for the anomalous always-on pixels. For communications, the
only result of these pixels is a loss in efficiency, as they must be turned off to prevent
background noise from overwhelming the detected signal. However, having many
detectors turned off, in a random arrangement around the detector array, could have
serious consequences for the performance when used for tracking. If the detectors in
question are clustered toward a specific part of the array, this can induce a systemic
bias into the perceived center of the tracking beam, and feeding back this skewed value
to the transmitter would lead to incorrect adjustments. As an extreme example, if
the upper right quadrant contained all of the disabled detectors (which for the mask
used for communications here would require turning off over half of the detectors
in the quadrant), the perceived center of the tracking beam would be permanently
biased toward the lower left quadrant, causing overcorrection in steering the signal
toward the part of the array with the worst sensitivity. Although this type of defect
would be much less likely to occur in a consumer-grade rather than a research-grade
system, it is still worth considering possible approaches to solving this problem.
One possible scheme to account for this asymmetry would be to duplicate the
mask of disabled detectors in a symmetric pattern about the center, such that if a
detector is disabled in one quadrant, the corresponding detector in the other three
quadrants is also disabled. Figure 4-1 shows an example of such a mask, based on the
standardized mask used in this thesis. While this type of mask could greatly reduce
the sensitivity of the array, even halving the number of available detectors should
provide sufficient sensitivity to perform tracking; many tracking systems currently in
45

Figure 4-1: Detector disabling mask, modified to be symmetric across all four quad-rants. Black squares indicate detectors which have been turned off.
use have far fewer elements.
Alternative schemes for performing tracking with an array that may not have
all elements available would have to involve either interpolating the missing values
based on the surrounding counts, or assigning different weights to the pixels for which
the counts are known in order to account for the missing information. These would
require much more complex firmware, but would allow for better usage of the array’s
detection sensitivity.
46

Bibliography
[1] M. Chitre, S. Shahabudeen, L. Freitag, and M. Stojanovic. Recent advances in
underwater acoustic communications & networking. In OCEANS 2008, volume
2008-Supplement, pages 1–10, Sept 2008.
[2] Laser demonstration reveals bright future for space communication. http://esc.
gsfc.nasa.gov/267/278/279/490.html. Accessed 2012-12-15.
[3] Wikipedia user kebes. Absorption spectrum of liquid water. https://en.
wikipedia.org/wiki/File:Absorption_spectrum_of_liquid_water.png.
[4] Frank Hanson and Stojan Radic. High bandwidth underwater optical communi-
cation. Appl. Opt., 47(2):277–283, Jan 2008.
[5] SA Photonics: Neptune underwater communications. http://www.saphotonics.
com/high-bandwidth-optical-communications/underwater/. Accessed 2014-
12-11.
[6] P.P. Webb, R.J. McIntyre, and J. Conradi. Properties of avalanche photodiodes.
RCA Review, 35:234–278, 1974.
[7] Andrew J. Kerman, Eric A. Dauler, William E. Keicher, Joel K.W. Yang, Karl
K. Berggren, G. Gol’Tsman, and B. Voronov. Kinetic-inductance-limited re-
set time of superconducting nanowire photon counters. Applied Physics Letters,
88(11):111116, 2006.
[8] Marius A. Albota, Brian F. Aull, Daniel G. Fouche, Richard M. Heinrichs,
David G. Kocher, Richard M. Marino, James G. Mooney, Nathan R. Newbury,
47

Michael E. O’Brien, Brian E. Player Three-dimensional imaging laser radars with
Geiger-mode avalanche photodiode arrays. Lincoln Laboratory Journal, 13(2):351–
370, 2002.
[9] Meera Srinivasan and Victor Vilnrotter. Symbol-error probabilities for pulse-
position modulation signaling with an avalanche photodiode receiver and gaussian
thermal noise. The Telecommunications and Mission Operations Progress Report
42-134, April–June 1998, pages 1–11, 1998.
48