optical coherence tomography imaging in uveitis · optical coherence tomography imaging in uveitis...
TRANSCRIPT
REVIEW
Optical coherence tomography imaging in uveitis
Sumru Onal • Ilknur Tugal-Tutkun •
Piergiorgio Neri • Carl P Herbort
Received: 26 May 2013 / Accepted: 24 June 2013 / Published online: 9 July 2013
� Springer Science+Business Media Dordrecht 2013
Abstract Optical coherence tomography (OCT) is a
non-contact noninvasive technique that allows in vivo
imaging of the retina, choroid, optic nerve head,
retinal nerve fiber layer, and the anterior structures of
the eye. It was introduced into clinical practice two
decades ago. Advances in OCT technology have been
achieved by searching ultra-high-resolution OCT,
adaptive optics OCT, eye-tracking OCT, and changes
in signal detection technique from time-domain (TD)
to spectral-domain (SD) detection. Today, SD OCT
has become a part of routine uveitis practice. Apart
from its diagnostic value in uveitis, OCT has enabled
objective assessment of treatment response and
provided predictive value for visual recovery and
prognosis of uveitic entities. It is the standard
diagnostic technique in the detection, monitoring of
treatment, and determination of prognosis in uveitic
macular edema as well as other inflammatory macular
pathologies, including epiretinal membrane forma-
tion, vitreomacular traction, foveal atrophy, and
lamellar/full-thickness macular holes. OCT has also
shed light on the pathophysiology of several posterior
uveitic entities. SD OCT has enabled visualization of
four lines in the sensory retina which represent the
external limiting membrane, the photoreceptor inner
and outer segment junction, the photoreceptor outer
segment and the retina pigment epithelium junction,
and the retina pigment epithelium-choriocapillaris
complex. Thus, we have gained substantial informa-
tion about the pathologic and structural changes in
uveitic conditions with primary or secondary outer
retinal involvement. SD OCT has also provided
invaluable information on the inner retinal and the
vitreoretinal interface changes in uveitic conditions.
With the introduction of enhanced depth imaging,
visualization of the choroid and choriocapillaries has
become possible. Therefore, OCT has become an
indispensible ancillary test in the diagnosis and
management of inflammatory diseases involving the
retina and/or the choroid. As OCT technology con-
tinues to develop further it will provide new insights
S. Onal (&)
Department of Ophthalmology, Koc University School of
Medicine, Istanbul, Turkey
e-mail: [email protected]
S. Onal
Department of Ophthalmology, V.K. Foundation
American Hospital, Istanbul, Turkey
I. Tugal-Tutkun
Department of Ophthalmology, Istanbul Faculty of
Medicine, Istanbul University, Istanbul, Turkey
P. Neri
The Eye Clinic, Polytechnic University of Marche,
Ancona, Italy
C. P Herbort
University of Lausanne, Lausanne, Switzerland
C. P Herbort
Retinal and Inflammatory Eye Diseases, Centre for
Ophthalmic Specialised Care (COS), Lausanne,
Switzerland
123
Int Ophthalmol (2014) 34:401–435
DOI 10.1007/s10792-013-9822-7
into the retinal and choroidal structure and the
pathogenesis of posterior uveitic entities.
Keywords Optical coherence tomography � Time-
domain � Spectral-domain � Enhanced depth imaging �Uveitis
Introduction
Definition
Optical coherence tomography (OCT) is a rapid non-
contact method that allows in vivo imaging of the retina,
choroid, optic nerve head, retinal nerve fiber layer
(RNFL), and the anterior segment structures of the eye.
It provides high-resolution cross-sectional images of
tissue morphology both in situ and in real-time. The
ability of OCT to image tissue morphology in situ and in
real-time has been termed ‘optical biopsy’.
Historical background
OCT was introduced in 1991 as a noninvasive in vivo
imaging technique [1]. In vivo imaging of the healthy
retina and optic nerve head and of retinal diseases as
well as the ease of obtaining these images changed the
diagnostic strategy used by ophthalmologists [2–6].
OCT was introduced commercially in 1996. Early
models (OCT 1 and OCT 2; Carl Zeiss Meditec, Dublin,
CA, USA) produced axial resolution at 12-15 lm. In
2002, a third generation time-domain (TD) OCT 3
(Stratus OCT; Carl Zeiss Meditec) became available
with an axial resolution of 10 lm and a scan velocity of
400 axial scans/sec. Since 2004, higher resolution
spectral-domain OCT (SD OCT) has entered clinical
practice with reported resolutions of 3-5 lm as well as
improved visualization of retinal morphologic and
pathologic features [7–14]. SD OCT is the current gold
standard for posterior segment retinal tomography.
Technique
OCT imaging is analogous to ultrasound; however, it
uses light instead of sound to acquire high-resolution
images of ocular structures. Measurements are obtained
by directing a beam of light onto tissue and measuring
the echo time delay and magnitude of reflected or
backscattered light using low-coherence interferometry.
Time-domain optical coherence tomography
In TD OCT technology low-coherence, near-infrared
light from a superluminescent diode light source is split
to go to a reference mirror and to the retina. As the light
comes back from the mirror and the eye, it creates an
interference pattern, which is then analyzed by a
photodetector and an image is created. In this technol-
ogy, an individual A-scan is acquired by varying the
length of the reference arm in an interferometer, such
that the scanned length of the reference arm corre-
sponds to the A-scan length. Cross-sectional images
are generated by scanning the optical beam in the
transverse direction, thereby yielding a two-dimen-
sional data set (B-scan) that can be displayed as a false
color or gray-scale image [1]. With the commercially
available machine, Stratus OCT, axial resolutions of
10 lm can be achieved, and cross-sectional retinal
images consisting of 512 A-scans can be acquired in
1.28 s. For scanning of the optic nerve head or the
macula with TD OCT, six radial line scans in a spoke-
like pattern are centered on either the optic nerve head
or the fovea, respectively. OCT interpolates to fill in
the gaps of information between the radial line scans.
Spectral-domain optical coherence tomography
Until 2006, all commercially available OCT machines
were based on TD OCT, in which depth information is
acquired sequentially with a moving reference mirror
and by looking at the change of interference pattern in
time. Advances in OCT technology have been
achieved by exploring ultra-high-resolution (UHR)
OCT, adaptive optics OCT, eye-tracking OCT, and
changes in signal detection technique from TD to SD
detection [15]. SD OCT uses essentially the same
system as the conventional TD OCT. It may use either
a superluminescent diode or femtosecond titanium-
sapphire laser as a light source. In contrast to TD OCT,
the reference mirror for SD OCT remains stationary,
and the depth information is acquired by analyzing the
interference patterns in a spectrum of mixed reflected
lights [7–14]. SD OCT technology uses low-coherence
402 Int Ophthalmol (2014) 34:401–435
123

interferometry to detect light echoes, relying on a
spectrometer and high-speed camera and based on the
mathematical premise of Fourier transformation.
Because application of Fourier mathematical formula
has the effect of measuring all echoes of light
simultaneously, as compared with sequentially in the
case of TD OCT, SD OCT significantly increases the
amount of data acquired in each session, resulting in a
significant reduction of motion artifacts and an
increased signal-to-noise ratio compared to TD
OCT. Because the SD technique shows a higher
sensitivity (i.e., signal-to-noise ratio) than the TD
technique, the cross-sectional images obtained by the
currently available SD OCT instruments have both a
higher axial resolution and sensitivity than those
obtained by Stratus OCT. Less interpolation between
scans is required, making volumetric analysis and
3-dimensional (3D) imaging possible. Increased
amounts of data allow image registration, which aids
in improved visit-to-visit measurement reproducibil-
ity. Commercially available SD OCT systems possess
image acquisition speeds between 18,000 and 53,000
A-scans/sec [16].
To overcome motion artifacts caused by fixational
eye movements in OCT imaging, several commercial
systems have implemented eye tracking into their
existing OCT devices e.g., Spectralis HRA and SD
OCT device (Heidelberg Engineering, Heidelberg,
Germany), RTVue (Optovue Inc., Fremont, CA, USA)
and Cirrus HD-OCT (Carl Zeiss Meditec). The
Spectralis and RTVue systems use image-based real-
time eye tracking in which eye motions are extracted
from video frames and the OCT beam is steered to
keep it on target. The built-in real-time eye movement
tracking system recognizes features in the scanning
laser ophthalmoscope (SLO) image including blood
vessels and the optic disc. This enables stabilization of
the scan coordinates in relation to the retina coordi-
nates and minimizes motion artifacts during image
acquisition. In the Spectralis system, the retinal image
(1,000 points) from the infra-red SLO imaging chan-
nel is used to track motion. In the RTVue system the
motion is measured at 30 Hz from an infrared full-
field fundus camera [17, 18]. The Cirrus system
reduces eye motion artifacts with a proprietary scan
acquisition strategy, a high-speed 20 Hz line scanning
ophthalmoscope (LSO) camera, and single-pass align-
ment scanning. The retinal tracking system locks onto
the patient’s retina to negate eye movement and
enables tracking of the current scan to the position of a
prior scan. During acquisition, proprietary algorithms
automatically detect motion and track the eye.
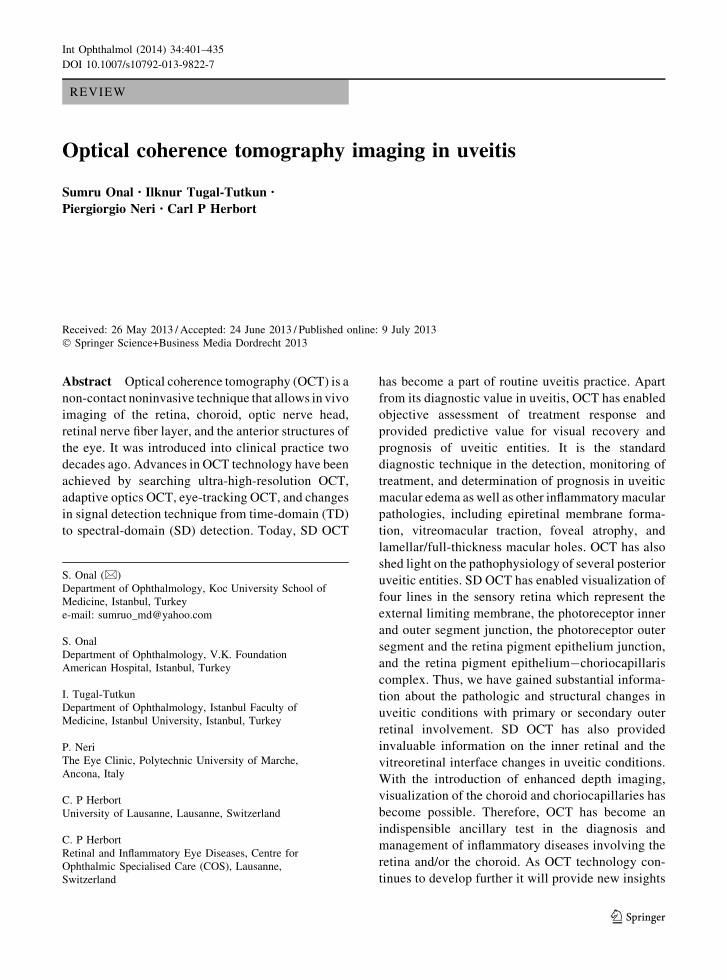
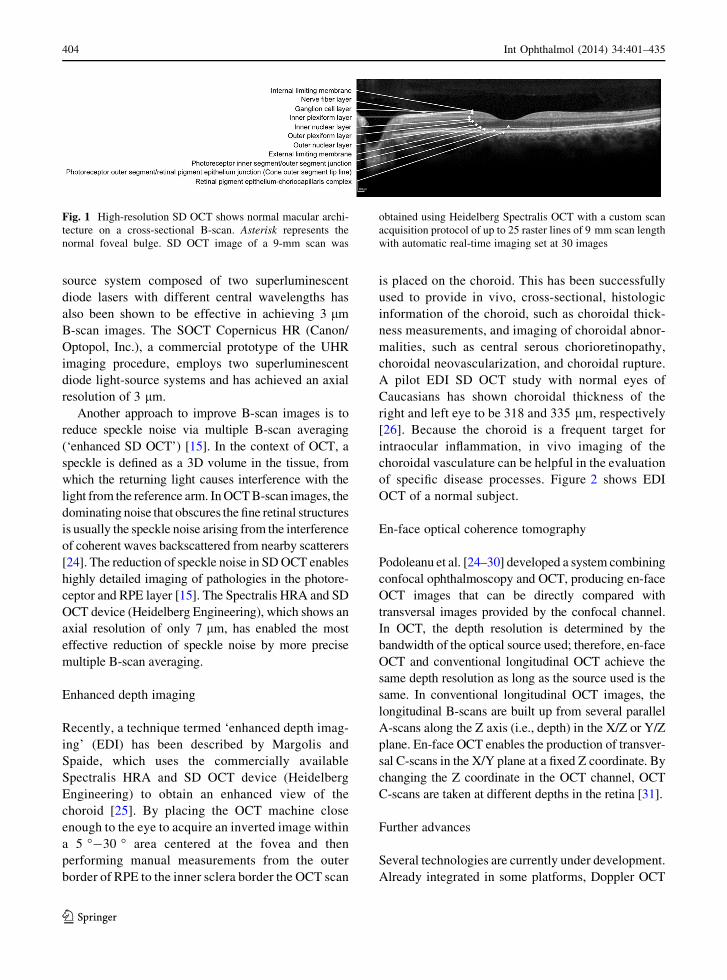
The currently available SD OCT instruments allow
improved visualization of four lines in the sensory
retina, which represent the external limiting mem-
brane (ELM), the photoreceptor inner and outer
segment (IS/OS) junction, the interdigitation of the
photoreceptor OS and the retina pigment epithelium
(RPE) or OS/RPE junction, and the RPE-choriocap-
illaris complex. The OS/RPE junction line is also
named cone outer segment tip (COST) line and
represents a thin line between the IS/OS junction and
RPE [19]. However, lately Spaide and Curcio have
raised a debate regarding the anatomical assignments
of these four lines. By creating a scale model of outer
retinal morphology from published information and by
comparing this information with SD OCT scans the
authors argued that the four outer lines seen are the
ELM, the ellipsoid section of the photoreceptors, the
contact cylinder of the cones, and finally the RPE.
Studies comparing OCT in vivo with histologic
correlative evaluations are currently underway and
may lead to definitive assignments of these outer lines
[20]. Nevertheless, all four lines are diagnostically
useful in understanding the pathologies and structural
changes of the retina. Figure 1 shows a high-resolu-
tion SD OCT scan of the normal retina.
Furthermore, several of the SD OCT devices
incorporate overlay software that permits correlation
of OCT images with photographic, angiographic,
autofluorescent, and other studies. Nine different
posterior segment SD OCT systems are currently
commercially available. There are also reports from
separate groups who have designed customized SD
OCT devices and software [21–23].
Ultra-high-resolution optical coherence
tomography
On a commercial basis, further improvement of
B-scan images has been achieved by using UHR SD
OCT and speckle noise-reduction technology with SD
OCT. UHR SD OCT using a femtosecond titanium-
sapphire laser light source achieves a 3 lm B-scan
image with a high contrast and allows highly detailed
imaging of pathologies. However, the expensive cost
of the titanium-sapphire laser light source hinders
wide commercial use of this technique. Using a light-
Int Ophthalmol (2014) 34:401–435 403
123
source system composed of two superluminescent
diode lasers with different central wavelengths has
also been shown to be effective in achieving 3 lm
B-scan images. The SOCT Copernicus HR (Canon/
Optopol, Inc.), a commercial prototype of the UHR
imaging procedure, employs two superluminescent
diode light-source systems and has achieved an axial
resolution of 3 lm.
Another approach to improve B-scan images is to
reduce speckle noise via multiple B-scan averaging
(‘enhanced SD OCT’) [15]. In the context of OCT, a
speckle is defined as a 3D volume in the tissue, from
which the returning light causes interference with the
light from the reference arm. In OCT B-scan images, the
dominating noise that obscures the fine retinal structures
is usually the speckle noise arising from the interference
of coherent waves backscattered from nearby scatterers
[24]. The reduction of speckle noise in SD OCT enables
highly detailed imaging of pathologies in the photore-
ceptor and RPE layer [15]. The Spectralis HRA and SD
OCT device (Heidelberg Engineering), which shows an
axial resolution of only 7 lm, has enabled the most
effective reduction of speckle noise by more precise
multiple B-scan averaging.
Enhanced depth imaging
Recently, a technique termed ‘enhanced depth imag-
ing’ (EDI) has been described by Margolis and
Spaide, which uses the commercially available
Spectralis HRA and SD OCT device (Heidelberg
Engineering) to obtain an enhanced view of the
choroid [25]. By placing the OCT machine close
enough to the eye to acquire an inverted image within
a 5 �-30 � area centered at the fovea and then
performing manual measurements from the outer
border of RPE to the inner sclera border the OCT scan
is placed on the choroid. This has been successfully
used to provide in vivo, cross-sectional, histologic
information of the choroid, such as choroidal thick-
ness measurements, and imaging of choroidal abnor-
malities, such as central serous chorioretinopathy,
choroidal neovascularization, and choroidal rupture.
A pilot EDI SD OCT study with normal eyes of
Caucasians has shown choroidal thickness of the
right and left eye to be 318 and 335 lm, respectively
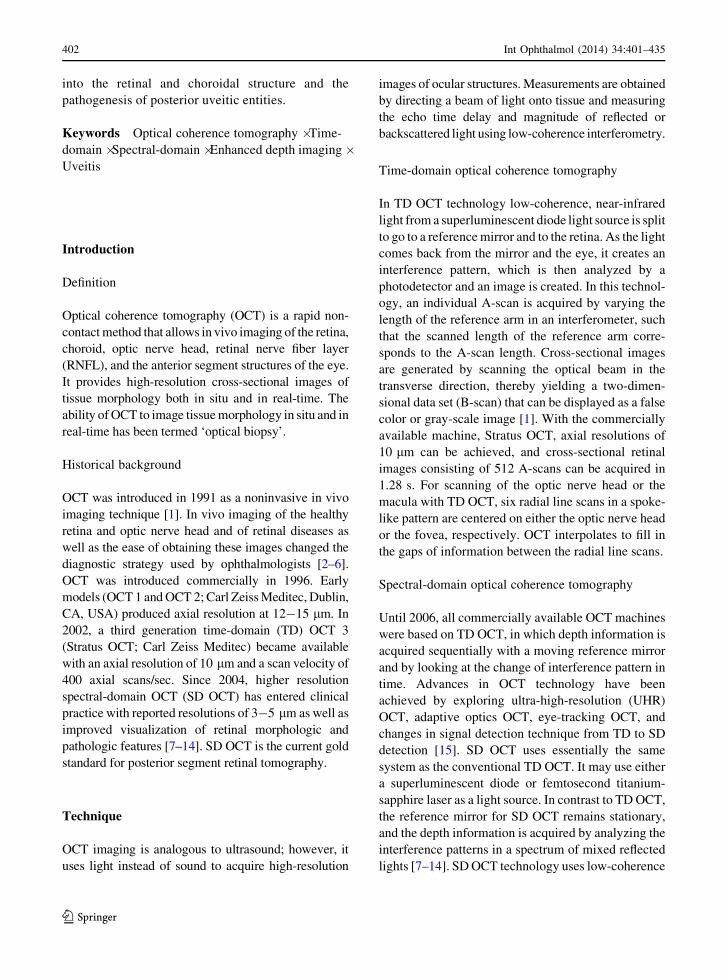
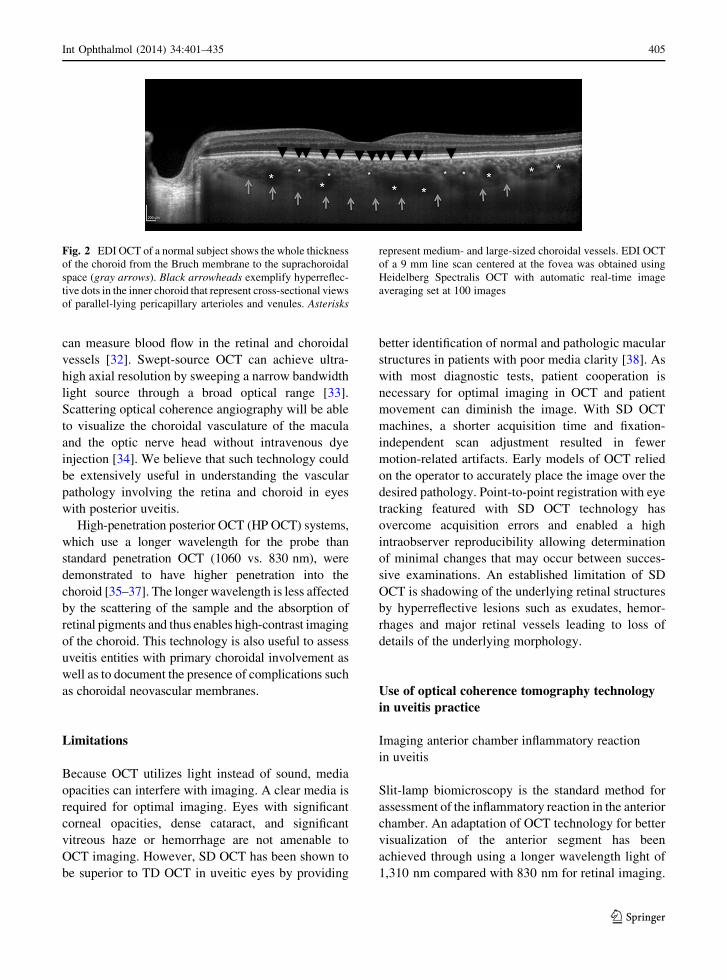
[26]. Because the choroid is a frequent target for
intraocular inflammation, in vivo imaging of the
choroidal vasculature can be helpful in the evaluation
of specific disease processes. Figure 2 shows EDI
OCT of a normal subject.
En-face optical coherence tomography
Podoleanu et al. [24–30] developed a system combining
confocal ophthalmoscopy and OCT, producing en-face
OCT images that can be directly compared with
transversal images provided by the confocal channel.
In OCT, the depth resolution is determined by the
bandwidth of the optical source used; therefore, en-face
OCT and conventional longitudinal OCT achieve the
same depth resolution as long as the source used is the
same. In conventional longitudinal OCT images, the
longitudinal B-scans are built up from several parallel
A-scans along the Z axis (i.e., depth) in the X/Z or Y/Z
plane. En-face OCT enables the production of transver-
sal C-scans in the X/Y plane at a fixed Z coordinate. By
changing the Z coordinate in the OCT channel, OCT
C-scans are taken at different depths in the retina [31].
Further advances
Several technologies are currently under development.
Already integrated in some platforms, Doppler OCT
Fig. 1 High-resolution SD OCT shows normal macular archi-
tecture on a cross-sectional B-scan. Asterisk represents the
normal foveal bulge. SD OCT image of a 9-mm scan was
obtained using Heidelberg Spectralis OCT with a custom scan
acquisition protocol of up to 25 raster lines of 9 mm scan length
with automatic real-time imaging set at 30 images
404 Int Ophthalmol (2014) 34:401–435
123
can measure blood flow in the retinal and choroidal
vessels [32]. Swept-source OCT can achieve ultra-
high axial resolution by sweeping a narrow bandwidth
light source through a broad optical range [33].
Scattering optical coherence angiography will be able
to visualize the choroidal vasculature of the macula
and the optic nerve head without intravenous dye
injection [34]. We believe that such technology could
be extensively useful in understanding the vascular
pathology involving the retina and choroid in eyes
with posterior uveitis.
High-penetration posterior OCT (HP OCT) systems,
which use a longer wavelength for the probe than
standard penetration OCT (1060 vs. 830 nm), were
demonstrated to have higher penetration into the
choroid [35–37]. The longer wavelength is less affected
by the scattering of the sample and the absorption of
retinal pigments and thus enables high-contrast imaging
of the choroid. This technology is also useful to assess
uveitis entities with primary choroidal involvement as
well as to document the presence of complications such
as choroidal neovascular membranes.
Limitations
Because OCT utilizes light instead of sound, media
opacities can interfere with imaging. A clear media is
required for optimal imaging. Eyes with significant
corneal opacities, dense cataract, and significant
vitreous haze or hemorrhage are not amenable to
OCT imaging. However, SD OCT has been shown to
be superior to TD OCT in uveitic eyes by providing
better identification of normal and pathologic macular
structures in patients with poor media clarity [38]. As
with most diagnostic tests, patient cooperation is
necessary for optimal imaging in OCT and patient
movement can diminish the image. With SD OCT
machines, a shorter acquisition time and fixation-
independent scan adjustment resulted in fewer
motion-related artifacts. Early models of OCT relied
on the operator to accurately place the image over the
desired pathology. Point-to-point registration with eye
tracking featured with SD OCT technology has
overcome acquisition errors and enabled a high
intraobserver reproducibility allowing determination
of minimal changes that may occur between succes-
sive examinations. An established limitation of SD
OCT is shadowing of the underlying retinal structures
by hyperreflective lesions such as exudates, hemor-
rhages and major retinal vessels leading to loss of
details of the underlying morphology.
Use of optical coherence tomography technology
in uveitis practice
Imaging anterior chamber inflammatory reaction
in uveitis
Slit-lamp biomicroscopy is the standard method for
assessment of the inflammatory reaction in the anterior
chamber. An adaptation of OCT technology for better
visualization of the anterior segment has been
achieved through using a longer wavelength light of
1,310 nm compared with 830 nm for retinal imaging.
Fig. 2 EDI OCT of a normal subject shows the whole thickness
of the choroid from the Bruch membrane to the suprachoroidal
space (gray arrows). Black arrowheads exemplify hyperreflec-
tive dots in the inner choroid that represent cross-sectional views
of parallel-lying pericapillary arterioles and venules. Asterisks
represent medium- and large-sized choroidal vessels. EDI OCT
of a 9 mm line scan centered at the fovea was obtained using
Heidelberg Spectralis OCT with automatic real-time image
averaging set at 100 images
Int Ophthalmol (2014) 34:401–435 405
123

In one study, cross-sectional images of the anterior
chamber were obtained using anterior segment OCT
(AS OCT) (Visante; Carl Zeiss Meditec) and hyper-
reflective spots were counted in non-enhanced images
manually and with automated computer algorithms
[39]. There was good correlation between automated
and manual methods in grading the hyperreflective
spots. The automated method was more sensitive in
detecting hyperreflective dots in eyes with 4(?) cells
in the anterior chamber. Aqueous flare was not
detected in eyes except with 4(?) flare and fibrinous
reaction. Notably, AS OCT was able to detect anterior
chamber cells in eyes with significant corneal edema
ranging from 702-1,020 lm. The ability of AS OCT
to detect anterior chamber cells in eyes with corneal
haze or edema is the most striking advantage of this
new modality.
The AS of one patient with sclerokeratouveitis
presumed to be of tuberculous etiology was evaluated
using AS OCT [40]. AS OCT showed a poorly
demarcated amorphous lesion in the iridocorneal
angle, corneal edema, narrowing and synechiae of
the iridocorneal angle, and anterior chamber exudates
and cells. Improvement of corneal edema and a
decrease of corneal thickness and exudates were
observed after anti-tuberculosis treatment was begun.
AS OCT was shown to be useful in assessing the
extent of anterior synechiae and angle lesions. It
allowed noninvasive non-contact analysis of treatment
response and was useful to assess disease activity.
Because the pigmented posterior layer of the iris
prevents light transmission beyond this structure, the
ciliary body cannot be visualized using AS OCT.
Therefore, the current technology is not applicable for
evaluation of the ciliary body and the pars plana in
intermediate uveitis, and complications arising at this
anatomical space.
Uveitic macular edema and other macular
pathological findings
Today, OCT has become a standard diagnostic tech-
nique for the evaluation of uveitic macular edema and
other pathologies involving the macula in patients with
uveitis. The currently increased resolution and
improved image quality along with the ease of obtaining
these images have augmented its significance for
macular diagnostics in uveitis practice. Gupta et al.
[38] compared the performance of TD OCT (Stratus
OCT) and SD OCT (Cirrus HD-OCT) in patients with
uveitis with vitreous haze 1(?) or worse. Preliminary
results suggested that SD Cirrus HD-OCT has an
advantage over TD Stratus OCT in uveitic eyes by
providing better identification of normal and pathologic
structures in patients with poor media clarity. Compared
with TD Stratus OCT, SD Cirrus HD-OCT was able to
detect internal limiting membrane (ILM) folds, poster-
ior vitreous detachment, cystoid retinal spaces, outer
lamellar hole, and disruption of the IS/OS junction in
eyes where conventional TD OCT could not. Addition-
ally, Cirrus HD-OCT was able to diagnose vitreomacu-
lar traction in eyes that produced normal results on
Stratus OCT. Roesel et al. [41] evaluated uveitic
macular edema using TD OCT (Stratus OCT) and SD
OCT (Spectralis OCT) and confirmed the advantages of
SD OCT for defining macular morphologic features in
uveitis patients with macular edema, including detection
of the IS/OS junction. The authors also concluded that
loss of the IS/OS junction on OCT in eyes with uveitic
macular edema was associated with poor visual acuity.
Foveal thickness measured by SD was higher than that
measured with the TD OCT. Several reasons have been
shown to account for this variability. First, SD OCT
measures the retinal thickness from RPE to the ILM,
whereas TD Stratus OCT measures the retinal thickness
from IS/OS to the ILM, excluding a significant part of
the structure for retinal thickness measurements. The
distance between IS/OS and RPE is approximately
45 lm; thus, SD OCT would be inherently thicker
compared to TD OCT. Second, the retinal thickness
measurement in Stratus OCT may be biased by the
retinal thickness in the central subfield alone as only six
linear line scans pass through the foveal center. SD
OCT, on the other hand, measures the retinal thickness
by an evenly distributed square centered on the fovea
and is likely to indicate the true retinal thickness.
Another established important feature of SD OCT is a
high intraobserver reproducibility of macular thickness
measurements in eyes with uveitic macular edema
allowing the determination of a minimal thickness
change to occur as a consequence of treatment [42].
Optical coherence tomography is suitable for
detecting and monitoring uveitic macular edema [43,
44]. It provides important information about the fluid
distribution in eyes with macular edema and the
morphology of the vitreoretinal interface. Markomich-
elakis et al. [45] using OCT 1, first described three
406 Int Ophthalmol (2014) 34:401–435
123
different patterns of distribution of fluid in the macula
of patients with uveitis—cystoid macular edema
(CME), diffuse macular edema (DME), and serous
retinal detachment. A similar classification of mor-
phological features on OCT exists in patients with
diabetic macular edema and has been correlated with
focal and diffuse fluorescein leakage patterns by Byeon
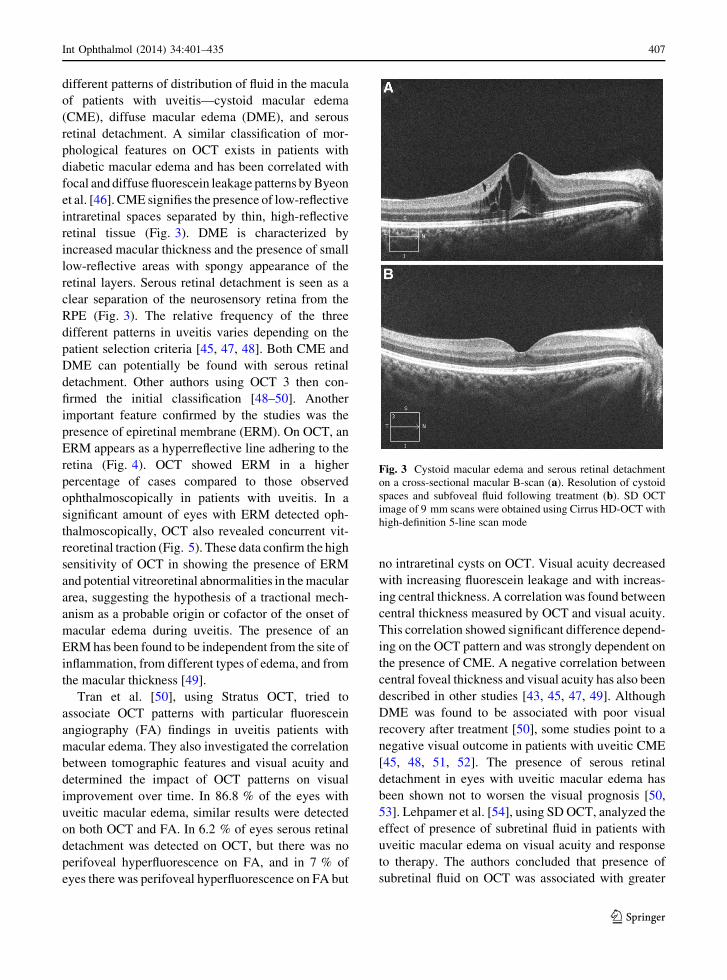
et al. [46]. CME signifies the presence of low-reflective
intraretinal spaces separated by thin, high-reflective
retinal tissue (Fig. 3). DME is characterized by
increased macular thickness and the presence of small
low-reflective areas with spongy appearance of the
retinal layers. Serous retinal detachment is seen as a
clear separation of the neurosensory retina from the
RPE (Fig. 3). The relative frequency of the three
different patterns in uveitis varies depending on the
patient selection criteria [45, 47, 48]. Both CME and
DME can potentially be found with serous retinal
detachment. Other authors using OCT 3 then con-
firmed the initial classification [48–50]. Another
important feature confirmed by the studies was the
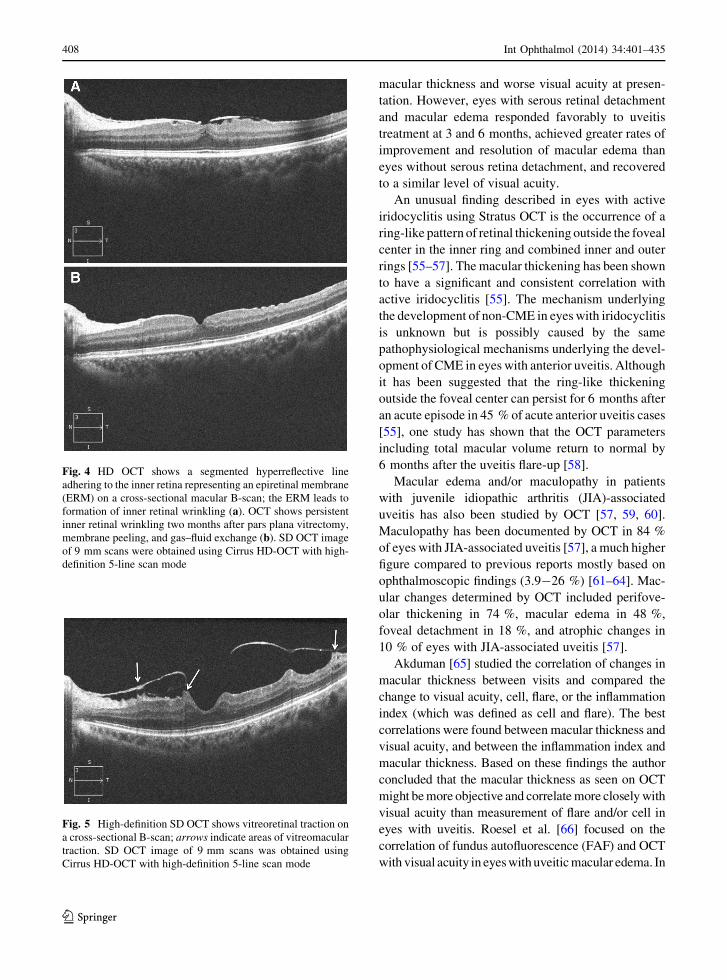
presence of epiretinal membrane (ERM). On OCT, an
ERM appears as a hyperreflective line adhering to the
retina (Fig. 4). OCT showed ERM in a higher
percentage of cases compared to those observed
ophthalmoscopically in patients with uveitis. In a
significant amount of eyes with ERM detected oph-
thalmoscopically, OCT also revealed concurrent vit-
reoretinal traction (Fig. 5). These data confirm the high
sensitivity of OCT in showing the presence of ERM
and potential vitreoretinal abnormalities in the macular
area, suggesting the hypothesis of a tractional mech-
anism as a probable origin or cofactor of the onset of
macular edema during uveitis. The presence of an
ERM has been found to be independent from the site of
inflammation, from different types of edema, and from
the macular thickness [49].
Tran et al. [50], using Stratus OCT, tried to
associate OCT patterns with particular fluorescein
angiography (FA) findings in uveitis patients with
macular edema. They also investigated the correlation
between tomographic features and visual acuity and
determined the impact of OCT patterns on visual
improvement over time. In 86.8 % of the eyes with
uveitic macular edema, similar results were detected
on both OCT and FA. In 6.2 % of eyes serous retinal
detachment was detected on OCT, but there was no
perifoveal hyperfluorescence on FA, and in 7 % of
eyes there was perifoveal hyperfluorescence on FA but
no intraretinal cysts on OCT. Visual acuity decreased
with increasing fluorescein leakage and with increas-
ing central thickness. A correlation was found between
central thickness measured by OCT and visual acuity.
This correlation showed significant difference depend-
ing on the OCT pattern and was strongly dependent on
the presence of CME. A negative correlation between
central foveal thickness and visual acuity has also been
described in other studies [43, 45, 47, 49]. Although
DME was found to be associated with poor visual
recovery after treatment [50], some studies point to a
negative visual outcome in patients with uveitic CME
[45, 48, 51, 52]. The presence of serous retinal
detachment in eyes with uveitic macular edema has
been shown not to worsen the visual prognosis [50,
53]. Lehpamer et al. [54], using SD OCT, analyzed the
effect of presence of subretinal fluid in patients with
uveitic macular edema on visual acuity and response
to therapy. The authors concluded that presence of
subretinal fluid on OCT was associated with greater
Fig. 3 Cystoid macular edema and serous retinal detachment
on a cross-sectional macular B-scan (a). Resolution of cystoid
spaces and subfoveal fluid following treatment (b). SD OCT
image of 9 mm scans were obtained using Cirrus HD-OCT with
high-definition 5-line scan mode
Int Ophthalmol (2014) 34:401–435 407
123
macular thickness and worse visual acuity at presen-
tation. However, eyes with serous retinal detachment
and macular edema responded favorably to uveitis
treatment at 3 and 6 months, achieved greater rates of
improvement and resolution of macular edema than
eyes without serous retina detachment, and recovered
to a similar level of visual acuity.
An unusual finding described in eyes with active
iridocyclitis using Stratus OCT is the occurrence of a
ring-like pattern of retinal thickening outside the foveal
center in the inner ring and combined inner and outer
rings [55–57]. The macular thickening has been shown
to have a significant and consistent correlation with
active iridocyclitis [55]. The mechanism underlying
the development of non-CME in eyes with iridocyclitis
is unknown but is possibly caused by the same
pathophysiological mechanisms underlying the devel-
opment of CME in eyes with anterior uveitis. Although
it has been suggested that the ring-like thickening
outside the foveal center can persist for 6 months after
an acute episode in 45 % of acute anterior uveitis cases
[55], one study has shown that the OCT parameters
including total macular volume return to normal by
6 months after the uveitis flare-up [58].
Macular edema and/or maculopathy in patients
with juvenile idiopathic arthritis (JIA)-associated
uveitis has also been studied by OCT [57, 59, 60].
Maculopathy has been documented by OCT in 84 %
of eyes with JIA-associated uveitis [57], a much higher
figure compared to previous reports mostly based on
ophthalmoscopic findings (3.9-26 %) [61–64]. Mac-
ular changes determined by OCT included perifove-
olar thickening in 74 %, macular edema in 48 %,
foveal detachment in 18 %, and atrophic changes in
10 % of eyes with JIA-associated uveitis [57].
Akduman [65] studied the correlation of changes in
macular thickness between visits and compared the
change to visual acuity, cell, flare, or the inflammation
index (which was defined as cell and flare). The best
correlations were found between macular thickness and
visual acuity, and between the inflammation index and
macular thickness. Based on these findings the author
concluded that the macular thickness as seen on OCT
might be more objective and correlate more closely with
visual acuity than measurement of flare and/or cell in
eyes with uveitis. Roesel et al. [66] focused on the
correlation of fundus autofluorescence (FAF) and OCT
with visual acuity in eyes with uveitic macular edema. In
Fig. 4 HD OCT shows a segmented hyperreflective line
adhering to the inner retina representing an epiretinal membrane
(ERM) on a cross-sectional macular B-scan; the ERM leads to
formation of inner retinal wrinkling (a). OCT shows persistent
inner retinal wrinkling two months after pars plana vitrectomy,
membrane peeling, and gas–fluid exchange (b). SD OCT image
of 9 mm scans were obtained using Cirrus HD-OCT with high-
definition 5-line scan mode
Fig. 5 High-definition SD OCT shows vitreoretinal traction on
a cross-sectional B-scan; arrows indicate areas of vitreomacular
traction. SD OCT image of 9 mm scans was obtained using
Cirrus HD-OCT with high-definition 5-line scan mode
408 Int Ophthalmol (2014) 34:401–435
123

eyes with macular edema an increased FAF, which
probably arises from proteins such as retinoids in the
extracellular fluid, has been observed. Using Spectralis
OCT, the authors concluded that FAF and OCT are
useful diagnostic tools for the evaluation of uveitic
macular edema. Increased central FAF, presence of
cystoid changes, a disrupted IS/OS junction on OCT,
and ERM were associated with poor vision. Roesel et al.
[67] also analyzed the correlation of microperimetry
(photoreceptor function) and SD OCT with visual acuity
in eyes with uveitic macular edema. Foveal thickness
and fundus-related microperimetry were correlated with
visual acuity. Cystoid changes in the outer plexiform
and inner nuclear layer (INL) and the presence of ERM
were associated with poor visual acuity. Fixation
abnormalities were not associated with poor visual
acuity. Georgiadou et al. [68] assessed the correlation of
visual acuity, OCT, and multifocal electroretinography
(mfERG) in patients with uveitic macular edema before
and after treatment. In CME, the value of mfERG before
treatment was related to the central foveal thickness and
visual acuity. In contrast, after treatment, the decrease of
macular thickness was not always followed by an
improvement of mfERG and visual acuity.
Optical coherence tomography has also been used
to diagnose, assess, and monitor the therapeutic
response in uveitic macular edema [48, 51, 69–85].
In a recent study, Sugar et al. [86] tried to identify a
clinically meaningful threshold for change in uveitic
macular edema evaluated by OCT. A 20 % change in
retinal thickness in patients with uveitic macular
edema was found to be optimal for clinically important
changes in visual acuity. A threshold for change in
retinal center subfield thickness of 20 % balanced the
percentage of false positives and false negatives for
predicting more than a 10-letter change in visual
acuity with a sensitivity of 77 % and a specificity of
75 %. For studies of treatments for uveitic macular
edema in which improvement is monitored through
changes in retinal thickness, this threshold was
suggested to be optimal in terms of balancing the
sensitivity and specificity associated with clinically
meaningful changes in visual acuity. The authors also
proposed that this threshold could be considered as an
outcome for clinical trials of treatments for uveitic
macular edema. Payne et al. [87] determined the utility
of logarithmic transformation of SD OCT (logSD
OCT) retinal thickness data for assessment of clini-
cally meaningful changes in uveitic macular edema.
The authors transformed central subfield thickness
values into logarithmic equivalents for SD OCT. By
defining the scale for logSD OCT a central subfield
thickness of 250 lm was assumed normal. A three-
step change on the logSD OCT scale was equivalent to
either doubling or halving of the central subfield
thickness. Logarithmic transformation of SD OCT
central retinal thickness provided a more normal
distribution than central retinal thickness data alone
and correlated positively with logMAR visual acuity.
The correlation of logSD OCT with logMAR visual
acuity suggested that changes in logSD OCT were
clinically meaningful, objective, and a potentially
useful measure for the evaluation of therapies target-
ing uveitic macular edema [87].
Swelling of Muller cells due to disturbed fluid
transport has been described in states of macular
edema [88, 89]. We believe, through combining UHR
OCT and adaptive optics and thereby increasing image
resolution, demonstration of in vivo morphological
changes of Muller cells could unveil new information
on the pathogenesis of uveitic macular edema.
Apart from macular edema, ERM, and vitreoma-
cular traction, other macular pathological findings in
patients with uveitis include macular hole and foveal
atrophy (Figs. 6, 7) [90]. Forooghian et al. [91]
characterized foveal atrophy in a heterogeneous group
of patients with uveitis using HD-OCT images. The
most common diagnoses associated with foveal atro-
phy were Behcet uveitis, serpiginous choroidopathy
and sympathetic ophthalmia (13 %, each) followed by
other posterior and panuveitis entities and intermedi-
ate uveitis. Using Cirrus HD-OCT, the authors defined
foveal atrophy as a center point foveal thickness
\150 lm. The integrity of the photoreceptor layer
was determined through examination of the IS/OS
junction using the horizontal 5-line raster scan pattern.
The status of the IS/OS junction was found to be
associated with significant differences in mean visual
acuity. The cause of foveal atrophy was multifactorial
and included dysfunction and atrophy of the RPE and
choroid, CME, macular ischemia secondary to occlu-
sive retinal vasculitis, choroidal neovascularization,
retinal detachment, and possibly antibody-mediated
damage directed against photoreceptors. The authors
suggested that careful observation of the IS/OS
junction using HD-OCT could help to identify patients
who are at risk for visual loss secondary to foveal
atrophy.
Int Ophthalmol (2014) 34:401–435 409
123

Vogt-Koyanagi-Harada disease
Posterior segment manifestations of Vogt-Koyanagi-
Harada (VKH) disease are the earliest and extensively
studied findings by OCT. Key OCT features of acute-
phase VKH disease are summarized in Table 1. While
early studies involved the use of TD OCT, more recent
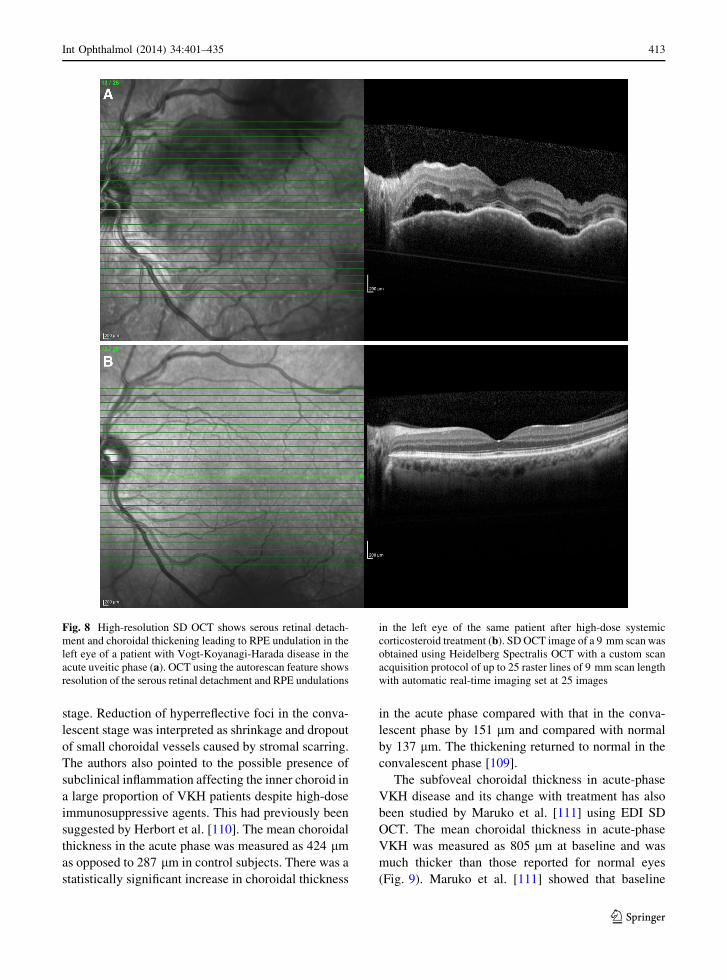
studies focused on SD OCT findings of the disease. SD
OCT of acute-phase VKH disease is shown in Fig. 8.
Maruyama and Kishi [92] evaluated the cross-sectional
image of serous retinal detachments using OCT 1 in
eyes with VKH disease and reported that serous retinal
detachments had two changes in structural patterns—a
true serous retinal detachment and intraretinal fluid
accumulation in the outer retina. They also reported
observation of a thin reflective layer on the RPE and
septa between the two types of fluid spaces, but they
could not suggest what these structures represent. Parc
et al. [93] described the use of OCT to measure and
monitor serous retinal detachment during the acute and
chronic phases of VKH disease. OCT revealed an
atypical serous retinal detachment with the presence of
intraretinal edema with a hyporeflective area corre-
sponding to fluid located between different layers of the
neurosensory retina. Tsujikawa et al. [94] reported that
the thin vertical walls of the large cystoid spaces within
the subretinal fluid appeared as subfoveal yellowish
round structures in eyes with VKH disease and assumed
that cross-sectional images of OCT 2 showed intraret-
inal cystoid spaces. The authors hypothesized that the
inner space was the subfoveal cystoid space and the
outer space was the subretinal fluid. They also consid-
ered that the septa of the intraretinal cystoid spaces
could represent subretinal fibrosis or a fibrin membrane,
which is reportedly a feature in eyes with recurrent or
chronic VKH disease. De Smet and Rao [95] inter-
preted peculiar subretinal septae seen by OCT as
fibrinous strands. Yamaguchi et al. [96] reported similar
findings on higher resolution OCT 3. They examined
cross-sectional images of retinal detachments with
multilobular dye pooling and monitored the subretinal
structure after pulse corticosteroid therapy. Based on
their observation that the subretinal septae dissolved
immediately after pulse corticosteroid therapy, the
authors concluded that the subretinal septae were
composed of inflammatory products such as fibrin
[96]. The rapid effect of pulse corticosteroid therapy on
Fig. 6 High-definition SD OCT shows a full-thickness macular
hole that developed secondary to cystoid macular edema in a
patient with Behcet uveitis. Cystoid macular edema is noted at
the edges of the macular hole (a). Closure of the macular hole
with no interruption in the continuity of foveal tissue above the
RPE layer after pars plana vitrectomy, membrane peeling, and
gas–fluid exchange (b). SD OCT images of 9 mm scans were
obtained using Cirrus HD-OCT with high-definition 5-line scan
mode
Fig. 7 Thinning and disruption of normal retinal architecture in
a patient with Behcet uveitis. Loss of the IS/OS junction and OS/
RPE line (COST line), and thinning of the ONL. A thin
hyperreflective line adhering to the inner retina represents an
ERM formation; a prominent part of the ERM is indicated by the
asterisk. Foveal depression is indicated by an arrow. SD OCT
image of a 9 mm scan was obtained using Cirrus HD-OCT with
high-definition 5-line scan mode
410 Int Ophthalmol (2014) 34:401–435
123

the serous retinal detachment observed at the acute
uveitic phase of VKH disease had initially been
reported by Yamanaka et al. [97] using a sequence of
sectional images obtained by OCT. Other findings
suggested, based on TD OCT scans, were the occur-
rence of fluid accumulation in the photoreceptor layer
due to swelling of photoreceptors induced by acute
inflammation and small focal limited RPE detachment
at the level of severe dye leakage on FA [98, 99].
SD OCT further increased the understanding of
retinal and choroidal manifestations of VKH disease.
Using enhanced SD OCT images, Ishihara et al. [100]
were able to clarify the pathologic features of multi-
focal serous retinal detachment that correspond to the
multilobular pools of subretinal dye with dark rims on
late-phase FA in eyes with acute VKH disease. The
key findings were (1) uniform thickness of the
membranous structure (named as septae in previous
studies) forming the base of cystoid spaces; (2)
continuity of the membranous structure with the outer
photoreceptor layer of attached retina; (3) blurring
around the cystoid spaces of the normally distinct line
representing the IS/OS and continuity of the abnormal
line with the highly reflective line within the mem-
branous structure, suggesting that the membranous
structure is a part of the outer photoreceptor layer; (4)
intraretinal split in the outer photoreceptor layer that
overlies the IS/OS line in the vicinity of the cystoid
spaces in about half of the cases; and (5) a mean
distance from the line representing the ELM to the
anterior border of cystoid spaces in the central fovea
that is much shorter than the length for the ISs/OSs
indicating a separation of all or part of the OSs in this
region. Based on OCT findings, the authors indicated
that the OS becomes detached from the photoreceptor
layer as intraretinal fluid accumulates; thereafter,
inflammation causes fibrin to precipitate in the fluid
space within the outer photoreceptor layer and acts as
glue between the OSs and forms the membranous
structure and the cystoid spaces characteristic of acute
VKH disease. As corticosteroid therapy dissolves the
fibrin, unbound pieces of the OSs have also been
shown to collapse onto the RPE, appearing as granular
structures on OCT.
Ikewaki et al. [101], using 3D OCT-1000 (Topcon,
Tokyo, Japan), suggested that the initial visual acuity
was significantly worse in VKH patients with a higher
serous retinal detachment and that the initial visual
acuity was not significantly correlated with the
sensory retinal thickness. Another important outcome
reported by the authors was the persistence of serous
retinal detachment even after final visual acuity had
been reached. Based on this finding, the authors
concluded that the SD OCT parameters could be a
reliable real-time indicator of the severity of inflam-
mation and the effectiveness of treatment.
Gupta et al. [102] used SD Cirrus HD-OCT to study
the structural alterations in the retina and RPE
corresponding to the choroidal striations seen on FA
in the acute uveitic phase of VKH disease. The
occurrence of choroidal folds was initially demon-
strated by Wu et al. [103] using TD OCT. Gupta et al.
[102] reported that areas of serous RD were found to
be adjacent to the large undulations on the 3D RPE
map in the acute phase. The authors assumed that these
undulations resulted from thickened choroid infiltrated
with inflammatory cells that pushes the RPE forward,
resulting in the formation of an undulation (Fig. 8).
The troughs of these undulations corresponded to the
choroidal striations seen in acute-stage VKH disease
and are seen as hypo-fluorescent lines on FA. The
small bumps seen on the surface of the undulation
corresponded to the areas seen typically on FA as
multiple pinpoint leakage sites, which result in late
pooling of dye in the subretinal space [102]. The
presence of undulations of RPE was also confirmed by
Ishihara et al. using enhanced SD OCT and by Zhao
et al. [100, 104] demonstrating 3D reconstructions of
choroidal folds by using the 3D OCT-1000 (Topcon,
Tokyo, Japan) device. Gupta et al. [102] also observed
thickening or irregularity of the IS/OS junction in all
eyes with acute VKH disease. The authors hypothe-
sized that involvement of the photoreceptor in the
acute phase could explain the delayed visual recovery.
This finding was earlier attributed to the delayed
regeneration of foveal cone photopigmentation
despite the normal OCT scan results [105].
Vasconcelos-Santos et al. [106] studied the RPE
and the outer retina in chronic VKH disease using FAF
imaging and SD OCT. No FAF abnormality was
reported corresponding to the sunset glow fundus.
However, hypoautofluorescent lesions were associ-
ated with RPE loss and outer retinal involvement on
SD OCT, and hyperautofluorescent lesions were
associated with focal RPE hyperplasia and variable
involvement of outer retina on SD OCT.
EDI SD OCT has been utilized to understand
choroidal changes in VKH disease. EDI SD OCT
Int Ophthalmol (2014) 34:401–435 411
123

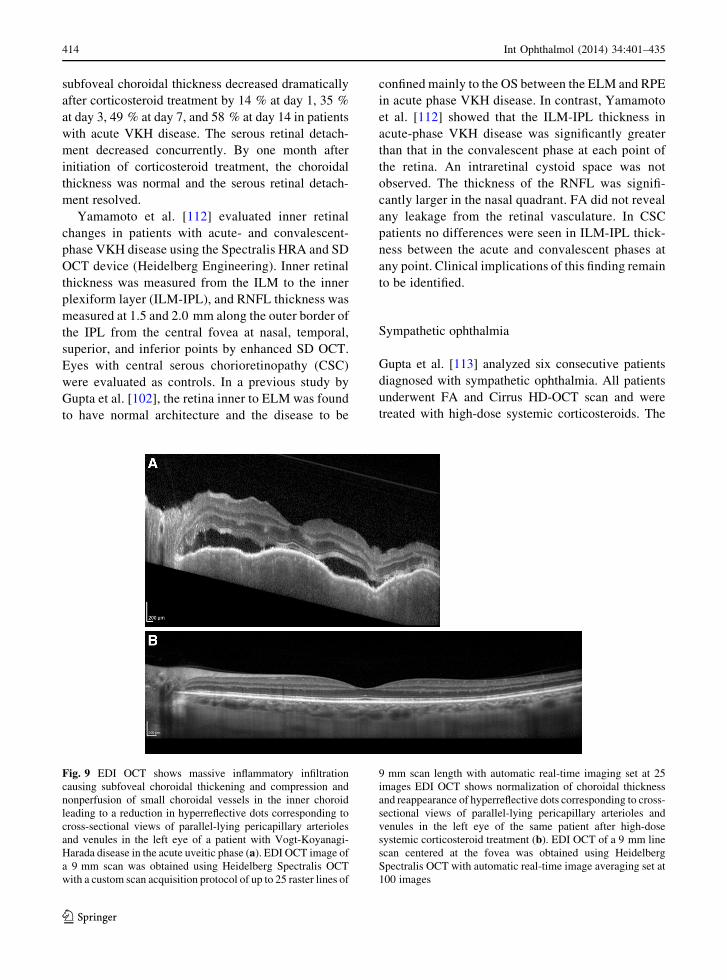
features of acute VKH disease are shown in Fig. 9. It is
known that the retinal findings observed in VKH
disease are secondary to choroidal inflammation [107,
108]. Fong et al. [109] used EDI SD OCT to examine
the choroid of VKH patients in the acute and
convalescent stages and to compare the findings with
control subjects. The authors observed multiple
hyperreflective dots in the inner choroid that increased
in number towards the Bruch membrane in normal
control eyes and speculated that these hyperreflective
dots represent cross-sectional views of parallel-lying
pericapillary arterioles and venules. EDI SD OCT
highlighted a reduction of inner choroidal hyperre-
flective foci in VKH patients in the acute and
convalescent stages of the disease (Fig. 9). This
finding was attributed to the compression and nonper-
fusion of small choroidal vessels by massive infiltra-
tion of inflammatory cells and granuloma in the acute
Table 1 Key OCT features of Vogt-Koyanagi-Harada disease
Acute phase
Outer retina:
Subretinal fluid (serous retinal detachment) [92–94, 100]
Intraretinal cystoid spaces in the outer retina [92–94, 100]
Membranous structures (septae), that form the base of the intraretinal cystoid spaces, composed of inflammatory products such
as fibrin that dissolve after intravenous pulse corticosteroid therapy [94–97, 100]
Separation of photoreceptor outer segments from photoreceptors in the vicinity of cystoid spaces [100]
Blurring of the photoreceptor IS/OS junction line around the cystoid spaces [100]
Thickening and irregularity of the IS/OS junction line [102]
Choroid and RPE:
Choroidal thickening leading to RPE undulation on the 3D RPE map and subretinal fluid accumulation [100, 102–104]
Troughs of choroidal/RPE undulations correspond to hypofluorescent lines on fluorescein angiography [102]
Small bumps on the surface of RPE undulations corresponding to multiple pinpoint leakage sites leading to dye pooling in the
subretinal space on fluorescein angiography [102]
Massive inflammatory infiltration causing compression and nonperfusion of small choroidal vessels in the inner choroid leading
to a reduction in hyperreflective dots corresponding to cross-sectional views of parallel-lying pericapillary arterioles and venules
[109]
Subfoveal choroidal thickening [109, 111]
Inner retina:
Increased inner retinal thickness measured from ILM to IPL [112]
Recovery phase
Intact retinal architecture in eyes with sunset glow fundus [106]
Peripapillary atrophy exhibits thinning of RPE/BM (RPE atrophy) and loss of the IS/OS junction line, ELM and ONL with
corresponding hypoautofluorescence on FAF, hyperfluorescence on FA (window defect), and hypofluorescence on ICGA
(choriocapillaris nonperfusion) [106]
Nummular and/or irregular foci with decreased autofluorescence on FAF show thinning of the RPE/BM (RPE atrophy) and
variable involvement of the outer retina ranging from sparing of the IS/OS junction line, ELM, and ONL to selective loss of one
or more of these layers. FA and ICGA disclose corresponding hyperfluorescence (window defect) and hypofluorescence
(choriocapillaris nonperfusion), respectively [106]
Atrophic scars with pigmentation show thickening of RPE/BM (RPE hyperplasia or hypertrophy) and variable involvement of
the outer retina. FAF shows corresponding hypoautofluorescence. FA and ICGA reveal blockage of fluorescence [106]
Fundus lesions with increased autofluorescence (proliferation of RPE) manifesting as pigmented patches, irregular tracks and
subretinal fibrosis show thickening of RPE/BM (RPE hyperplasia) usually with an intact outer retina. FA discloses
corresponding hypofluorescence (blockage) [106]
Reduction in hyperreflective dots in the inner choroid due to shrinkage and dropout of small choroidal vessels caused by stromal
scarring [109]
Normalization of subfoveal choroidal thickness [109, 111]
IS/OS = inner segment/outer segment, RPE = retinal pigment epithelium, ILM = inner limiting membrane, IPL = inner plexiform
layer, BM = Bruch membrane, ELM = external limiting membrane, ONL = outer nuclear layer, FAF = fundus autofluorescence,
FA = fluorescein angiography, ICGA = indocyanine green angiography
412 Int Ophthalmol (2014) 34:401–435
123
stage. Reduction of hyperreflective foci in the conva-
lescent stage was interpreted as shrinkage and dropout
of small choroidal vessels caused by stromal scarring.
The authors also pointed to the possible presence of
subclinical inflammation affecting the inner choroid in
a large proportion of VKH patients despite high-dose
immunosuppressive agents. This had previously been
suggested by Herbort et al. [110]. The mean choroidal
thickness in the acute phase was measured as 424 lm
as opposed to 287 lm in control subjects. There was a
statistically significant increase in choroidal thickness
in the acute phase compared with that in the conva-
lescent phase by 151 lm and compared with normal
by 137 lm. The thickening returned to normal in the
convalescent phase [109].
The subfoveal choroidal thickness in acute-phase
VKH disease and its change with treatment has also
been studied by Maruko et al. [111] using EDI SD
OCT. The mean choroidal thickness in acute-phase
VKH was measured as 805 lm at baseline and was
much thicker than those reported for normal eyes
(Fig. 9). Maruko et al. [111] showed that baseline
Fig. 8 High-resolution SD OCT shows serous retinal detach-
ment and choroidal thickening leading to RPE undulation in the
left eye of a patient with Vogt-Koyanagi-Harada disease in the
acute uveitic phase (a). OCT using the autorescan feature shows
resolution of the serous retinal detachment and RPE undulations
in the left eye of the same patient after high-dose systemic
corticosteroid treatment (b). SD OCT image of a 9 mm scan was
obtained using Heidelberg Spectralis OCT with a custom scan
acquisition protocol of up to 25 raster lines of 9 mm scan length
with automatic real-time imaging set at 25 images
Int Ophthalmol (2014) 34:401–435 413
123
subfoveal choroidal thickness decreased dramatically
after corticosteroid treatment by 14 % at day 1, 35 %
at day 3, 49 % at day 7, and 58 % at day 14 in patients
with acute VKH disease. The serous retinal detach-
ment decreased concurrently. By one month after
initiation of corticosteroid treatment, the choroidal
thickness was normal and the serous retinal detach-
ment resolved.
Yamamoto et al. [112] evaluated inner retinal
changes in patients with acute- and convalescent-
phase VKH disease using the Spectralis HRA and SD
OCT device (Heidelberg Engineering). Inner retinal
thickness was measured from the ILM to the inner
plexiform layer (ILM-IPL), and RNFL thickness was
measured at 1.5 and 2.0 mm along the outer border of
the IPL from the central fovea at nasal, temporal,
superior, and inferior points by enhanced SD OCT.
Eyes with central serous chorioretinopathy (CSC)
were evaluated as controls. In a previous study by
Gupta et al. [102], the retina inner to ELM was found
to have normal architecture and the disease to be
confined mainly to the OS between the ELM and RPE
in acute phase VKH disease. In contrast, Yamamoto
et al. [112] showed that the ILM-IPL thickness in
acute-phase VKH disease was significantly greater
than that in the convalescent phase at each point of
the retina. An intraretinal cystoid space was not
observed. The thickness of the RNFL was signifi-
cantly larger in the nasal quadrant. FA did not reveal
any leakage from the retinal vasculature. In CSC
patients no differences were seen in ILM-IPL thick-
ness between the acute and convalescent phases at
any point. Clinical implications of this finding remain
to be identified.
Sympathetic ophthalmia
Gupta et al. [113] analyzed six consecutive patients
diagnosed with sympathetic ophthalmia. All patients
underwent FA and Cirrus HD-OCT scan and were
treated with high-dose systemic corticosteroids. The
Fig. 9 EDI OCT shows massive inflammatory infiltration
causing subfoveal choroidal thickening and compression and
nonperfusion of small choroidal vessels in the inner choroid
leading to a reduction in hyperreflective dots corresponding to
cross-sectional views of parallel-lying pericapillary arterioles
and venules in the left eye of a patient with Vogt-Koyanagi-
Harada disease in the acute uveitic phase (a). EDI OCT image of
a 9 mm scan was obtained using Heidelberg Spectralis OCT
with a custom scan acquisition protocol of up to 25 raster lines of
9 mm scan length with automatic real-time imaging set at 25
images EDI OCT shows normalization of choroidal thickness
and reappearance of hyperreflective dots corresponding to cross-
sectional views of parallel-lying pericapillary arterioles and
venules in the left eye of the same patient after high-dose
systemic corticosteroid treatment (b). EDI OCT of a 9 mm line
scan centered at the fovea was obtained using Heidelberg
Spectralis OCT with automatic real-time image averaging set at
100 images
414 Int Ophthalmol (2014) 34:401–435
123

study showed photoreceptor involvement in the acute
stage, which was reversible in all sympathizing eyes in
the early stage of the disease. At baseline, the retina
inner to ELM did not show any remarkable structural
alteration and there was serous retinal detachment with
elongation of the photoreceptors in the OS demarcated
by the ELM and RPE lines. Although the RPE-
choriocapillaris complex could be delineated, there
was disruption of the continuity of the IS/OS and OS/
RPE (COST) junction lines. None of the eyes showed
intraretinal cystic spaces at presentation. Two eyes
showed hyperreflective bands indicating fibrinous
septae within the serous detachment. A single-layer
RPE scan map of two eyes showed undulations and
bumps on the RPE surface with one patient showing the
presence of choroidal striations on ophthalmoscopy.
The undulations were seen adjacent to the serous
retinal detachment on the raster line scans. In the
remaining four eyes, serous detachment did not allow
interpretation of the single-layer 3D RPE map. Visual
acuity recovered gradually over the following two
weeks after systemic corticosteroid therapy and coin-
cided with the resolution of serous retinal detachment
as well as restoration of the photoreceptors and IS/OS
junction line as seen on OCT scans. On systemic
corticosteroid therapy, the single-layer RPE scans
showed a reduction of the dome-like undulations
within 48 h. Repeat OCT scans performed at 12 weeks
showed complete resolution in all six patients with a
normal single-layer RPE surface map.
TD OCT scans of Dallen-Fuchs nodules were
analyzed in one patient with sympathetic ophthalmia
[114]. Dallen-Fuchs nodules appeared as discrete
nodules at the level of RPE and were associated with
mild shadowing and overlying detachment of the
neurosensory retina.
Acute posterior multifocal placoid pigment
epitheliopathy
Key OCT features of acute posterior multifocal placoid
pigment epitheliopathy (APMPPE) are summarized in
Table 2. Lofoco et al. [115] described the OCT findings
in one patient with APMPPE. An acute-phase OCT scan
revealed a mild hyperreflective area above the RPE in
the photoreceptor layer. In the later phases, OCT
showed a nodular hyperreflective lesion on the plane
of the RPE with mild underlying backscattering. Lim
et al. [116] reported on another patient with APMPPE
where an OCT scan was performed through an acute
lesion and then repeated through the same lesion
12 months later. The initial OCT scan showed marked
anterior displacement of both the neural retina and the
outer reflective band. The subsequent OCT scan
revealed resolution of the prior displacement, increased
reflectance of the outer reflective band and mild
disruption of the outer retinal layers. These changes
were found to be compatible with the enlargement of the
underlying choroid by an inflammatory infiltrate that is
associated with choroidal vasculitis.
Scheufele et al. [117] used UHR OCT to define the
morphological changes occurring in APMPPE in more
detail in three patients—one with acute and two with
healed lesions. In the three cases, UHR OCT demon-
strated early and late photoreceptor disruption which
had not been demonstrated previously in this disease.
In the acute setting, areas of increased backscattering
were seen in the outer neural layer, probably repre-
senting early degenerative changes of the photorecep-
tors. Simultaneous FA and indocyanine green
angiography (ICGA) demonstrated hypofluorescence
of these lesions. The authors speculated that choroidal
fluorescence may be blocked by the inflamed or
damaged photoreceptor cell bodies seen concurrently
on UHR OCT or alternatively, due to choroidal
ischemia, which would also result in ischemia of the
RPE and outer retina and could account for the
photoreceptor and RPE disruption seen on the UHR
OCT. RPE disruption was demonstrated after the
lesions healed. Garg and Jampol observed similar
lesion backscattering on TD OCT in a patient with
APMPPE and serous macular detachments [118];
however, UHR OCT demonstrated more clearly that
these lesions were located in the outer retina [117].
The presence of serous macular detachment and
intraretinal fluid has been further demonstrated in
APMPPE [119–121]. Birnbaum et al. [119] showed
the presence of macular subretinal fluid on OCT in two
of eight patients with APMPPE. Lee et al. [120]
reported on a patient with acute APMPPE mimicking
VKH disease. The authors demonstrated pockets of
macular and peripapillary subretinal fluid as well as
compartmentalized subretinal fluid with detachment
of the overlying neurosensory retina. Presence of
hyperreflective subretinal deposits within the fluid;
relative preservation of the RPE line; disruption of the
IS/OS junction line, ELM and outer nuclear layers
(ONLs); and significant choroidal thickening was
Int Ophthalmol (2014) 34:401–435 415
123
documented in the acute phase. Over the follow-up
there was early resolution of subretinal fluid and
deposits, loss of OS/RPE (COST), IS/OS, and ELM
lines, as well as significant thinning of the ONL. The
healing process ended with reorganization and nor-
malization of outer retinal structures with partial
reappearance of the IS/OS line and ELM, reorganiza-
tion of the OS/RPE junction (COST) line and
normalization of ONL. Montero et al. [121] reported
on the presence of large intraretinal cysts in the ONL
consistent with intraretinal edema in a patient with
acute APMPPE. There was early resolution of the
macular cysts that was associated with appearance of a
hyperreflective line corresponding to the area previ-
ously occupied by the retinal cyst and increased
backscatter suggesting initial retinal pigment epithe-
lium (RPE) disruption. SD OCT showed normaliza-
tion of the gross anatomy of the fovea at 3 months;
however, macular thinning and disruption of the RPE
and IS/OS junction lines were observed.
Other studies have also confirmed early photore-
ceptor and RPE disruption occurring as a consequence
of either primary retinal pigment epitheliitis or as a
consequence of ischemia involving the choroidal
capillaries [122–125]. Alterations in the outer retinal
layers including the ELM, IS/OS junction, and OS/
RPE (COST) lines were also confirmed. Cheung et al.
[125] reported that despite visual recovery there was
photoreceptor atrophy and lack of reconstitution of the
IS/OS junction and OS/RPE (COST) lines in resolved
APMPPE and that this disturbance even involved
areas that were unaffected both on ophthalmoscopy
and OCT in the acute phase.
Optical coherence tomography findings of one
patient with relentless placoid chorioretinitis (RPC)
were defined by Amer and Florescu [126]. RPC has been
defined as a unique entity with atypical clinical findings
and course resembling both APMPPE and serpiginous
choroidopathy. TD OCT during the active stage of the
RPC showed foveal subretinal fluid and pigment
epithelium detachment with hyperreflectivity of the
inner and outer retinal layers, suggesting a chorioretinal
pathogenetic process. Similar to active lesions in
APMPPE and serpiginous choroidopathy OCT showed
hyperreflectivity of outer retinal layers in active RPC.
Acute zonal occult outer retinopathy
Key OCT features of are defined in Table 3. Li and
Kishi [127] examined seven eyes with acute zonal
occult outer retinopathy (AZOOR) in five patients
using TD OCT and found loss of the IS/OS junction in
those with visual field defects and loss of ONL in two
eyes. Photoreceptor atrophy corresponding to dys-
functional retina has been further demonstrated by TD
and en-face OCT in acute AZOOR [128, 129].
Spaide et al. [130] defined the SD OCT features in a
group of patients diagnosed with AZOOR complex
diseases. The study involved patients with AZOOR,
multiple evanescent white dot syndrome (MEWDS),
and multifocal choroiditis and panuveitis (MCP).
Common to all of these entities is the occurrence of
an enlarged blind spot. In all patients with blind spot
enlargement there were peripapillary IS/OS junction
line defects. Peripapillary IS/OS line defects were not
encountered in eyes that did not have visual field
defects. Patients with AZOOR had blind spot enlarge-
ment with associated scotomata and SD OCT evidence
of loss of the photoreceptor OSs and cell bodies. At the
junctional areas between preserved and severely
damaged retina were areas of loss of the IS/OS line
alone. In patients with AZOOR, outer retinal problems
were more severe and were associated with loss of the
IS/OS line and ONL and with thinning of the INLs
Table 2 Key OCT features of acute posterior multifocal placoid pigment epitheliopathy
Acute phase
Photoreceptor disruption leading to hyperreflectivity in the photoreceptor layer above RPE and underlying backscattering [115–
118, 122–125]
Alterations in the outer retinal layers including the external limiting membrane, IS/OS junction, and OS/RPE (COST) junction
line [120]
Subretinal fluid or large intraretinal cysts in the outer nuclear layer in some patients [118–121]
Recovery
Photoreceptor atrophy, lack of reconstitution of the IS/OS junction and OS/RPE lines, and disruption of RPE [116, 117, 125]
RPE = retinal pigment epithelium, OS = outer segment, COST = cone outer segment tip, IS/OS = inner segment/outer segment
416 Int Ophthalmol (2014) 34:401–435
123
without visible correlates in the fundus. Treatment of
AZOOR patients with immunomodulation was asso-
ciated with improvement in visual field analysis and
with restoration of the IS/OS junction in areas where
the ONL appeared to have a relatively normal
thickness. However, there was no visual field or
anatomic improvement in regions with ONL loss. This
implies that in AZOOR, loss of OSs, which are defects
occurring as a consequence of injury to photoreceptor
cellular processes, may show signs of reconstitution of
the OSs and hence the IS/OS junction line, whereas
injury resulting in actual loss of photoreceptors does
not.
Fujiwara et al. [131] determined FAF and SD OCT
findings in patients with AZOOR and reported RPE
abnormalities as detected by FAF. The thickness of the
choroid was normal as detected by EDI SD OCT.
There was abnormality of both the OS and the
thickness of the photoreceptors in general. In the
overlying areas of photoreceptor loss, there were
abnormalities in the normal lamellar design of the
retina, although the thickness of the inner retina was
not specifically abnormal.
Additional changes in AZOOR determined by SD
OCT involve the OS/RPE (COST) line. Tsunoda et al.
[132] first reported indistinctiveness of the OS/RPE
(COST) line that was evident through the entire
follow-up. There was also absence of the foveal bulge.
The IS/OS junction was preserved. The authors
suggested that the cone photoreceptor OS dysfunction
could be initially reflected by the indistinctiveness of
the OS/RPE (COST) line and the absence of foveal
bulge and that abnormalities in the IS/OS junction may
follow these changes in the more advanced stages. So
et al. [133] also reported loss of the OS/RPE (COST)
line in acute phase AZOOR. In the acute phase,
selective loss of the IS/OS and the OS/RPE (COST)
lines corresponded with reduced visual acuity and
mfERG potentials in areas of visual field defects. In
the recovery phase, disappearance of the scotoma was
associated with improvement in visual acuity and
recovery of mfERG. The absence of the OS/RPE
(COST) line in the recovery phase appeared as a
subclinical sign. Another finding that has been shown
in convalescent AZOOR is a decrease in the retinal
thickness and has been attributed to shortening of
photoreceptors and ONL and thinning of the INL
[134].
One study combined SD OCT with adaptive optics
scanning laser ophthalmoscopy (AOSLO) to evaluate
four patients with reduced visual function and in
whom retinal changes assessed by standard techniques
were insufficient to explain the visual abnormalities
[135]. Adaptive optics, when used with an ophthal-
moscope, allows for direct imaging of the cone
photoreceptor mosaic in vivo. Macular cone structure
as assessed by AOSLO in AZOOR revealed hetero-
geneity with normal mosaic of cones, regions of cone
loss, and alterations in cone structure. SD OCT
showed a disrupted IS/OS junction in regions with
Table 3 Key OCT features of acute zonal occult outer retinopathy
Acute phase
Loss of photoreceptor bodies (ONL) and outer segments with corresponding visual field defects as well as reduced visual acuity
and mfERG potentials [127–131]
Peripapillary IS/OS junction line defects in eyes with blind spot enlargement [130]
Loss of the IS/OS junction line at the junctional areas between preserved and severely damaged retina [130]
Thinning of inner nuclear layers [130]
Indistinctiveness of OS/RPE (COST) line and absence of foveal bulge [132, 133]
Normal choroidal thickness [131]
Recovery phase
Restoration of the IS/OS junction line after immunomodulatory therapy in areas where photoreceptors (ONL) initially appeared to
have a relatively normal thickness [130, 135]
No anatomic or visual field improvement in regions with initial photoreceptor loss [130, 135]
Absence of recovery of the OS/RPE (COST) line [134]
Decrease in retinal thickness due to shortening of ONL and thinning of the INL [134]
ONL = outer nuclear layer, mfERG = multifocal electroretinography, IS/OS = inner segment/outer segment, OS/RPE = outer
segment/retinal pigment epithelium, COST = cone outer segment tip, INL = inner nuclear layer
Int Ophthalmol (2014) 34:401–435 417
123

reduced cone reflectivity; reduced reflectance of the
IS/OS junction in regions with cone loss; relative
thinning of the ONL and ganglion cell layer, and intact
ELM-OS/RPR (COST) interval where cone mosaic
was normal; and loss of the IS/OS junction with
thinning of the ONL in regions with abnormal cone
coverage and spacing on AOSLO.
Vance et al. [136] described SD OCT features of
acute macular neuroretinopathy in four patients. Acute
macular neuroretinopathy is also grouped with
AZOOR complex diseases. All patients showed oph-
thalmoscopically dark areas near the fovea that
corresponded to focal IS/OS abnormalities by SD
OCT imaging. Over the follow-up ranging from 1 to
5 months, IS/OS defects resolved in two patients and
improved in the remaining two patients, but all
patients continued to manifest focal ONL thinning.
Multiple evanescent white dot syndrome
Key OCT features of MEWDS are described in
Table 4. OCT has shed new light on the confusing
pathogenesis of MEWDS. The first case report using
TD OCT showed a disrupted IS/OS junction line at the
macula that recovered 21 weeks later [137].
Spaide et al. [130] observed widespread loss of the
IS/OS junction even in regions between the visible
white spots during the acute phase of MEWDS. By
four months after onset, spontaneous concurrent
improvement occurred in both blind spot enlargement
in the visual field and the IS/OS line disruption on the
SD OCT scans. A disturbance of the IS/OS junction in
patients with MEWDS was also described by Nguyen
et al. [138]. Apart from IS/OS junction disturbance
observed in all eyes, UHR OCT showed thinning of
the ONL in one patient with recurrent disease [138].
Li and Kishi [139] studied seven patients with
MEWDS using SD OCT and full-field EFG (ffERG)
and mfERG. SD OCT showed a disrupted IS/OS line
as the main feature of MEWDS. In acute MEWDS, the
IS/OS line was diffusely or spottily disrupted. The
disrupted IS/OS line recovered quickly and achieved
continuity 4.5 weeks to 6 months after disease onset.
Figure 10 shows disruption and recovery of the IS/OS
junction line in MEWDS. No abnormalities were
noted in the ONL and RPE during follow-up. The
authors concluded that unlike AZOOR where loss of
photoreceptor cell bodies results in lack of
reconstitution of the outer retina, disruption of the
OSs but intact photoreceptor cell bodies in MEWDS
results in almost complete recovery of the photore-
ceptor OSs and hence the IS/OS line [139]. The
reduced ffERG and mfERG amplitudes during the
acute stage, which recovered with restoration of the
IS/OS line, supported the presumption that the main
lesion is associated with damage to the photoreceptor
OS, but not the RPE or choriocapillaries. A restoration
of photoreceptor OS length along with recovery of
FAF and microperimetry has been shown to occur
with disease recovery by others [140].
It has also been suggested that disruption of the IS/
OS line is associated with RPE inflammation. RPE
inflammation could result in swelling of RPE cells
leading to the appearance of an intact but thickened
RPE line or separation of RPE from the Bruch
membrane on OCT. The inflammation in RPE in turn
could lead to an acute interruption in the orientation of
photoreceptor OSs, causing attenuation of OCT signal
from the IS/OS junction line as the photoreceptor OSs
become misaligned [141]. Therefore, disruption of the
IS/OS junction line in MEWDS may represent an
artifact induced by RPE swelling.
Although SD OCT studies pointed to a disease
process involving the photoreceptor OSs and the IS/
OS junction with no pathology involving any other
retinal layer or the inner choroid in patients with acute
MEWDS [142, 143], one study showed a subfoveal
choroidal thickening [144]. Aoyagi et al. [144] studied
the subfoveal choroidal thickness using SD OCT in
two patients with acute MEWDS. In the acute phase
there was a thickening in the subfoveal choroid in the
involved eyes compared to the fellow eyes of both
patients. In the convalescent phase there was a decline
in the choroidal thickness not only in the involved eye
but in both eyes. The authors suggested that the
choroidal thickening could point to an inflammatory
reaction involving the choroid. Choroidal involvement
has also been suggested based on TD OCT findings of
focal subretinal dome-like material accumulation and
increased reflectivity of choroid at the same point in
one patient with acute MEWDS [145].
Multifocal choroiditis and panuveitis
Spaide et al. [130] revealed loss of the IS/OS line over
chorioretinal scars in patients with MCP. There was
also SD OCT evidence of absence of the IS/OS line
418 Int Ophthalmol (2014) 34:401–435
123

and thinning of the ONL over and in the immediate
areas surrounding scarring from old choroidal neo-
vascular membrane. Patients with MCP who had blind
spot enlargement also had corresponding contiguous
regions of the IS/OS junction loss around the optic
nerve head even in ophthalmoscopically normal areas
between visible chorioretinal scars [130].
Yasuno et al. [146] used a custom-built HP OCT to
assess the retina and the choroid of patients with MCP.
Both B-scans and en face projections were obtained.
HP OCT scans revealed the following characteristic
properties of the lesion sites—thinning of the retina,
destruction of the retinal layers, and disappearance IS/
OS junction line. Due to the high penetration of this
OCT system, the following characteristic properties of
the choroid were also observed: localized thinning of
the choroid, occlusion of the choroidal vessels, and
localized hyperreflectivity that may represent hyper-
pigmentation of the choroid. The choroidal patholo-
gies visualized by HP OCT were associated with the
findings of color fundus photography, FA, and ICGA
images. The authors concluded that HP OCT could be
used as a noninvasive method to distinguish the stages
of MCP progression.
Punctate inner choroidopathy
Optical coherence tomography has been used to
document and assess the effect of treatment on
choroidal neovascular membranes secondary to punc-
tate inner choroidopathy (PIC) [147–149]. Stepien and
Carroll [149] demonstrated SD OCT evidence of
intraretinal fluid accumulation secondary to choroidal
neovascular membrane and homogenous outer retinal
thickening over chorioretinal lesions in association
with recurrent inflammatory activity in a patient with
recurrent PIC.
Serpiginous chorioretinitis and multifocal
choroiditis
Van Velthoven et al. [150] described the en-face OCT
and confocal ophthalmoscopic findings in active
multifocal and serpiginous chorioretinitis shortly after
the onset of symptoms. Apart from involvement of the
outer retina and choroid, morphological information
obtained by en-face OCT revealed that the process
extended into the inner retina leading to a circum-
scribed, focal retinal thickening in the OCT C-scans in
eyes with multifocal chorioretinitis. In serpiginous
chorioretinitis, morphological information acquired
revealed that acute-phase inflammation is limited to
the deeper retinal and choroidal structures. Taken
together, the OCT manifestations of multifocal and
serpiginous chorioretinitis were different at the same
stage of the pathophyisological process.
Vance et al. [151] compared the SD OCT findings
of multifocal choroiditis with those of new-onset
myopic choroidal neovascularization. The authors
concluded that the acute lesions of multifocal cho-
roiditis showed drusen-like material between the RPE
and the Bruch membrane, vitreous cells, and localized
choroidal hyperreflectivity below the RPE material.
These OCT findings were not usually present in eyes
with myopic choroidal neovascularization. The sub-
retinal pigment epithelial material corresponded to
acute lesions found on color photographs and FA. The
subretinal pigment epithelial material and choroidal
hyperreflectivity appeared to improve after treatment
with anti-inflammatory or anti-vascular endothelial
growth factor therapy. In contrast, SD OCT in the
patients with myopic choroidal neovascularization
showed a very thin choroid, a posterior staphyloma,
and a type 2 (subretinal) neovascular pattern. Kotsolis
et al. [152] using SD OCT technology concluded that
Table 4 Key OCT features of multiple evanescent white dot syndrome
Acute phase
Widespread, even in regions between the visible white spots, loss of the IS/OS junction (diffusely or spottily) due to loss of
photoreceptor outer segments with retaining of normal photoreceptor bodies [130, 137–139, 142, 143]
Normal retinal pigment epithelium [139]
Subfoveal choroidal thickening [144, 145]
Recovery phase
Restoration of the IS/OS junction line within 4.5 weeks to 6 months [130, 137, 139, 140]
IS/OS = inner segment/outer segment
Int Ophthalmol (2014) 34:401–435 419
123

FA was superior to OCT in revealing choroidal
neovascularization in patients with multifocal cho-
roiditis and recommended the use of FA in imaging
choroidal neovascular membranes in eyes with
multifocal choroiditis. OCT has also been used to
gather preoperative clues for submacular surgery for
choroidal neovascular membrane removal. Eyes with
neovascular membranes located anterior to and sep-
arated from the RPE that had an ‘optically clear zone’
underneath were the best candidates for surgical
removal [153].
SD OCT technology has also been utilized to define
retinal morphological changes in patients with serpig-
inous choroiditis [154, 155]. In one study, FAF was
evaluated along with SD OCT in a patient with
recurrent serpiginous choroiditis. Active new lesions
disclosed hyperautofluorescence in contrast to hypo-
autofluorescence in scarred lesions. OCT showed
increased reflectance of the choroid and deeper retinal
layers, along with disruption of the photoreceptor IS/
OS junction in both active and inactive lesions [155].
Figure 11 shows a high-definition SD OCT scan of a
patient with serpiginous-like choroiditis.
Birdshot retinochoroidopathy
UHR OCT in a case with birdshot retinochoroidopathy
revealed disorganization of inner retinal layers as well
as photoreceptor and RPE atrophy [156]. Monnet et al.
[157] used OCT 3 and FA to evaluate the macula in 80
patients with birdshot retinochoroidopathy. There was
not good agreement between macular edema identified
by OCT and FA. Decreased visual acuity was found to
be related to abnormal macular thickness and loss of
the IS/OS junction as determined by OCT and vascular
leakage on FA. When compared with macular param-
eters, symptoms were related most closely to loss of
the IS/OS junction line. There were no strong
relationships between birdshot lesion characteristics
and macular parameters. Birch et al. [158] used SD
OCT technology to evaluate the macula in patients
with birdshot retinochoroidopathy. Segmentation of
retinal layers was performed using the software
included with the Spectralis HRA and SD OCT device
(Heidelberg Engineering). The results showed that
total retinal thickness was reduced in all eyes and at all
locations when compared to the normal control eyes.
The reduction in the retinal thickness of the macula
was associated with a reduction in the segment
extending from the proximal border of the outer
plexiform layer to the Bruch membrane-choroid
interface reflecting the photoreceptors and RPE
(Fig. 12). The inner retinal layer thickness was within
Fig. 10 High-resolution SD OCT shows an intact IS/OS line in
the uninvolved right eye of a patent with multiple evanescent
white dot syndrome (a). SD OCT shows a spottily disrupted IS/
OS junction line in the involved left eye of the same patient (b).
Achievement of continuity and rapid recovery of the IS/OS
junction line along with a partially recovered OS/RPE line
(COST line) is observed eight weeks after disease onset (c). SD
OCT images of a 9 mm scan were obtained using Heidelberg
Spectralis OCT with a custom star-shaped scan acquisition
protocol of 9 mm scan length with automatic real-time imaging
set at 20 images
420 Int Ophthalmol (2014) 34:401–435
123
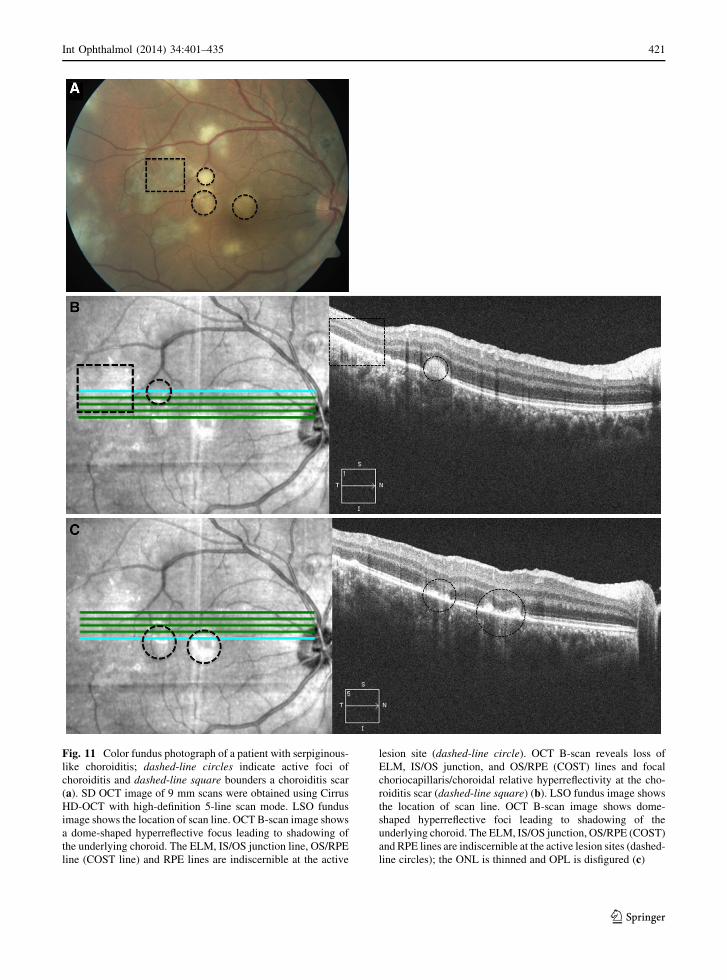
Fig. 11 Color fundus photograph of a patient with serpiginous-
like choroiditis; dashed-line circles indicate active foci of
choroiditis and dashed-line square bounders a choroiditis scar
(a). SD OCT image of 9 mm scans were obtained using Cirrus
HD-OCT with high-definition 5-line scan mode. LSO fundus
image shows the location of scan line. OCT B-scan image shows
a dome-shaped hyperreflective focus leading to shadowing of
the underlying choroid. The ELM, IS/OS junction line, OS/RPE
line (COST line) and RPE lines are indiscernible at the active
lesion site (dashed-line circle). OCT B-scan reveals loss of
ELM, IS/OS junction, and OS/RPE (COST) lines and focal
choriocapillaris/choroidal relative hyperreflectivity at the cho-
roiditis scar (dashed-line square) (b). LSO fundus image shows
the location of scan line. OCT B-scan image shows dome-
shaped hyperreflective foci leading to shadowing of the
underlying choroid. The ELM, IS/OS junction, OS/RPE (COST)
and RPE lines are indiscernible at the active lesion sites (dashed-
line circles); the ONL is thinned and OPL is disfigured (c)
Int Ophthalmol (2014) 34:401–435 421
123
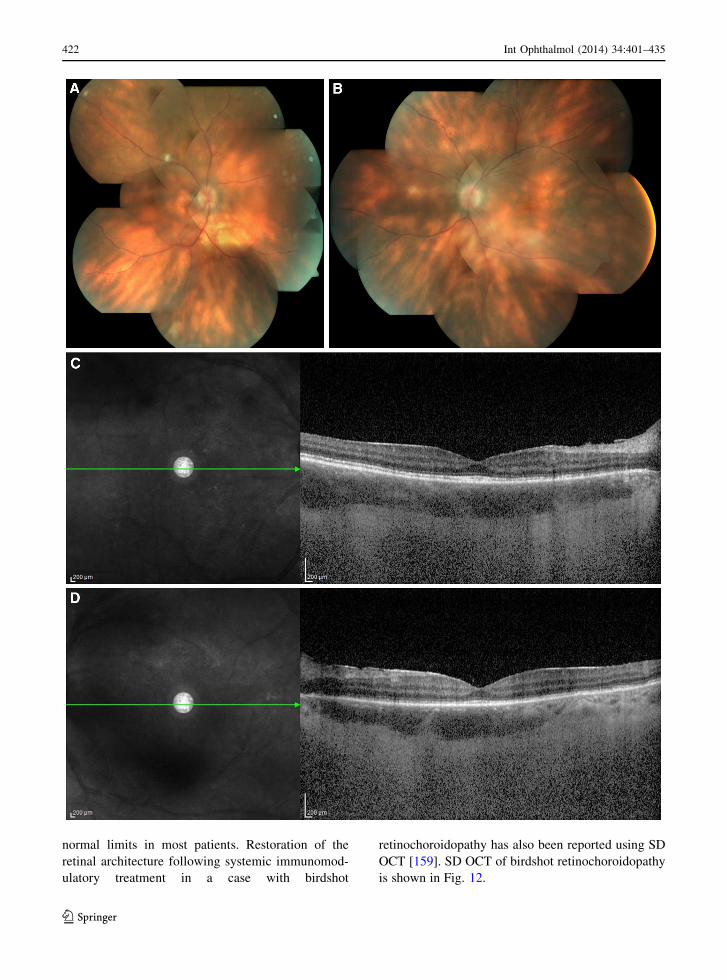
normal limits in most patients. Restoration of the
retinal architecture following systemic immunomod-
ulatory treatment in a case with birdshot
retinochoroidopathy has also been reported using SD
OCT [159]. SD OCT of birdshot retinochoroidopathy
is shown in Fig. 12.
422 Int Ophthalmol (2014) 34:401–435
123

Behcet uveitis
Optical coherence tomography was also utilized to
understand pathological changes of the neurosensory
retina in Behcet uveitis. Retinal vessels are the
primary target of occlusive vasculitis that occurs in
Behcet disease; however, one study suggested that
there may be retinal thickening or normal retinal
thickness as assessed by OCT in eyes with docu-
mented choroidal thickening on echography. The
authors suggested primary choroidal vasculitis as the
cause of choroidal thickening in eyes with Behcet
uveitis [160]. Atmaca et al. [161] compared macular
OCT findings with FA in 33 eyes of 18 patients with
Behcet uveitis. Macular edema and thickening on TD
OCT was evident in 10 eyes with variable pathological
findings on FA. Nine eyes with variable pathological
findings on FA were documented to have normal OCT
scans. OCT showed a macular hole in one eye and the
remaining 13 eyes had normal FA and OCT scans
[161]. Takeuchi et al. [162] analyzed functional
changes of the macula by microperimetry and struc-
tural changes by TD OCT during clinical remission of
ocular inflammation in patients with Behcet uveitis.
Visual acuity correlated with perimetric sensitivity but
not with retinal thickness based on OCT. The duration
of Behcet uveitis correlated with visual acuity and
with retinal thickness, but not with perimetric sensi-
tivity. No correlation was found between retinal
thickness and the corresponding retinal sensitivity.
The results suggested that visual acuity, retinal
perimetric sensitivity, and retinal thickness decrease
with increasing duration of Behcet uveitis. Among
these factors, retinal perimetric sensitivity seemed to
be relatively preserved. Unoki et al. [163] documented
foveal changes during remission of Behcet uveitis
using SD OCT. Visual acuity was significantly better
in eyes with an intact IS/OS line than in eyes with an
ill-defined IS/OS line. Male gender was more likely to
have absence of the IS/OS line. Foveal thickness of the
IS/OS intact eyes was significantly more than IS/OS
absent eyes. Status of the ELM was not associated with
changes in visual acuity.
A finding not previously described is the occur-
rence of RNFL defects in Behcet uveitis. Wedge-
shaped defects in the peripapillary RNFL, corollary
thinning detected by OCT, and corresponding visual
field loss may occur in Behcet patients in the absence
of central nervous system involvement or prior optic
neuritis (Fig. 13). The neuroretinal rim is well
preserved in these cases in contrast to the loss of
neuroretinal rim associated with RNFL atrophy in
glaucoma. These defects typically appear following
resolution of retinal infiltrates at the posterior pole,
suggesting an acute focal damage to the ganglion cell
layer and the RNFL. The same clinical picture
involving focal RNFL loss with a preserved neurore-
tinal rim has also previously been described in ocular
toxoplasmosis [164].
Ocular toxoplasmosis
Key OCT features of ocular toxoplasmosis are sum-
marized in Table 5. Changes in the retinal architecture
and vitreoretinal interface in ocular toxoplasmosis
have been analyzed using OCT technology. Orefice
et al. [165] examined the vitreoretinal morphology in
patients with active punctate, focal, and satellite ocular
toxoplasmosis lesions. On OCT 3 scans, retinal layers
were hyperreflective at the active lesion site and some
degree of retinal RPE-choriocapillaris/choroidal
optical shadowing was seen in all patients. In general,
the retina was thinned at the active lesion site in eyes
with punctate lesions and thickened in eyes with focal
and satellite lesions. When detected by OCT 3, the
posterior hyaloid appeared thickened. While focally
detached over punctate lesions, the posterior hyaloid
was partially detached, but still attached to the lesion
in focal and satellite lesions. Additional findings that
were not detected on clinical examination included
presence of DME, vitreomacular traction and macu-
loschisis. During follow-up, a decrease in retinal
thickness and focal choriocapillaris/choroidal relative
hyperreflectivity were observed at the former lesion
site, and posterior vitreous detachment was docu-
mented in all patients.
Punctate outer retinal toxoplasmosis (PORT) is an
atypical clinical presentation of ocular toxoplasmosis
Fig. 12 Composite color fundus photograph of the right (a) and
left eye (b) of a patient with birdshot retinochoroidopathy. SD
OCT shows retinal thinning more prominent in the segment
extending from the proximal border of the outer plexiform layer
to the Bruch membrane-choroid interface reflecting the
photoreceptors and RPE in the right (c) and left eye (d). OCT
B-scan also shows disruption of the IS/OS junction line and loss
of OS/RPE line (COST line). SD OCT of a 9 mm line scan
centered at the fovea was obtained using Heidelberg Spectralis
OCT with automatic real-time image averaging set at 25 images
b
Int Ophthalmol (2014) 34:401–435 423
123
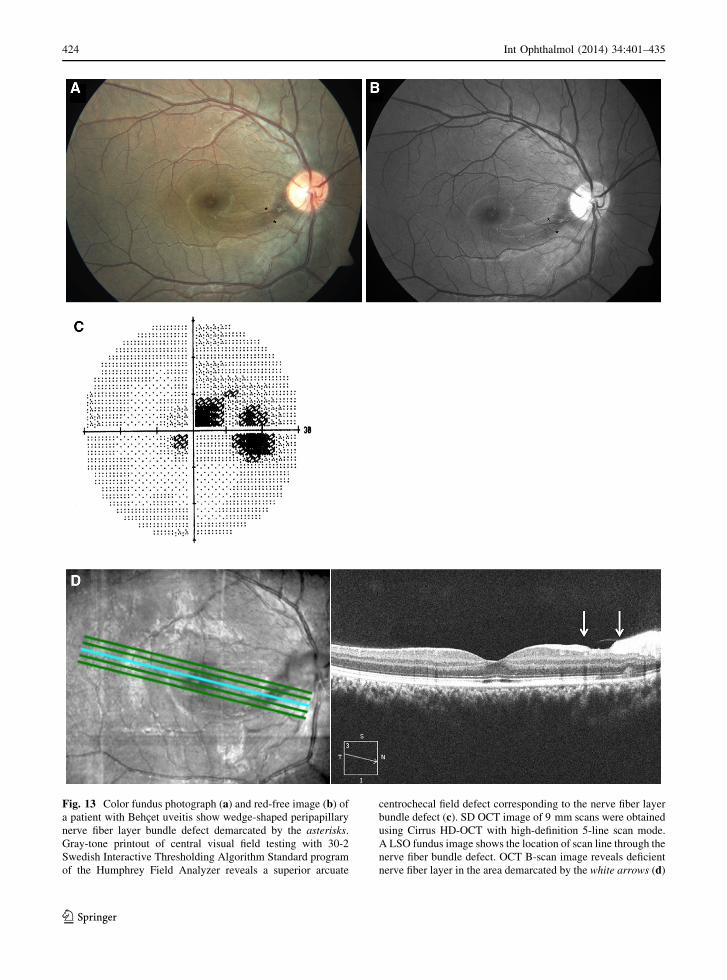
Fig. 13 Color fundus photograph (a) and red-free image (b) of
a patient with Behcet uveitis show wedge-shaped peripapillary
nerve fiber layer bundle defect demarcated by the asterisks.
Gray-tone printout of central visual field testing with 30-2
Swedish Interactive Thresholding Algorithm Standard program
of the Humphrey Field Analyzer reveals a superior arcuate
centrochecal field defect corresponding to the nerve fiber layer
bundle defect (c). SD OCT image of 9 mm scans were obtained
using Cirrus HD-OCT with high-definition 5-line scan mode.
A LSO fundus image shows the location of scan line through the
nerve fiber bundle defect. OCT B-scan image reveals deficient
nerve fiber layer in the area demarcated by the white arrows (d)
424 Int Ophthalmol (2014) 34:401–435
123

and is characterized by small gray-white lesions that
develop at the level of the outer retinal layers and the
RPE. Figure 14 shows a color fundus photograph and
TD OCT scan in a patient with PORT. In one study,
OCT 3 scans showed thickening and focal detachment
of the posterior hyaloid over PORT lesions (Fig. 14).
The posterior hyaloid contained irregular hyperreflec-
tive formations in most patients. At the lesion site
inner retinal layers were abnormally hyperreflective
and some degree of RPE-choriocapillaris/choroidal
optical shadowing was observed (Fig. 14). The retina
was thinned at the lesion site in most patients. In some
patients tractional maculopathy was evident due to
incomplete vitreofoveal separation. During the fol-
low-up expanded separation of the posterior hyaloid,
epiretinal hyperreflective formation, inner retinal
surface increased reflectivity, and disorganized retinal
signaling at the lesion site associated with subjacent
choriocapillaris/choroidal relative hyperreflectivity
were documented [166]. In another study, OCT
findings of macular PORT lesions were defined. A
consistent finding on TD OCT line scan through
the active lesion was attachment of the RPE-
choriocapillaris layer and the neurosensory retina over
the lesion with inflammatory retinal infiltrate in the
deeper retinal layers and minimal intraretinal fluid in
the macular area. Other findings were thickening and
elevation of the RPE, focal hyperreflectivity limited to
beneath the RPE, and associated minimal subretinal
fluid in the macular area [167].
An additional finding detected by OCT in one
patient with ocular toxoplasmosis is the appearance of
multiple, small, granular, gray deposits on the vitre-
oretinal interface in the vicinity of acute retinochor-
oiditis focus [168]. The case reported by Guagnini
et al. [168] showed that such deposits may appear
away from the active toxoplasmic focus along retinal
vessels and the macula. Deposits disappeared with
combined, systemic, antiparasitic and corticosteroid
treatments. OCT was helpful in following the resolu-
tion of these lesions.
Structural changes in the macula in congenital
toxoplasmosis have been described using TD OCT and
consisted of retinal thinning, RPE hyperreflectivity,
excavation, intraretinal cysts, and fibrosis. Patients
with better visual acuity than expected were shown to
Table 5 Key OCT features of ocular toxoplasmosis
Active retinochoroidal lesion
Increased retinal reflectivity and thickening of the lesion site [165, 170, 171]
RPE - choriocapillaris/choroidal optical shadowing [165, 170, 171]
Thickening of the posterior hyaloid, partial or complete posterior vitreous detachment over the retinochoroidal lesion [165, 170,
171]
Multiple, small, granular hyperreflective spots on the vitreoretinal interface in the vicinity of the retinochoroidal lesion [166, 168]
Retinochoroidal scar
Decreased retinal thickness [165, 171]
Focal choriocapillaris/choroidal relative hyperreflectivity [165, 171]
Complete posterior vitreous detachment [165, 171]
Punctate outer retinal toxoplasmosis
Hyperreflective inner retina and thinning of the lesion site [166]
RPE - choriocapillaris/choroidal optical shadowing [166]
Thickening of the posterior hyaloid and focal detachment of the posterior hyaloid over the lesion site [166]
Congenital toxoplasmosis
Retinal thinning [169]
RPE hyperreflectivity [169]
Excavation [169]
Intraretinal cysts [169]
IS/OS inner segment/outer segment, RPE retinal pigment epithelium, ILM inner limiting membrane, IPL inner plexiform layer, BM
bruch membrane, ELM external limiting membrane, ONL outer nuclear layer, FAF fundus autofluorescence, FA fluorescein
angiography, ICGA indocyanine green angiography
Int Ophthalmol (2014) 34:401–435 425
123
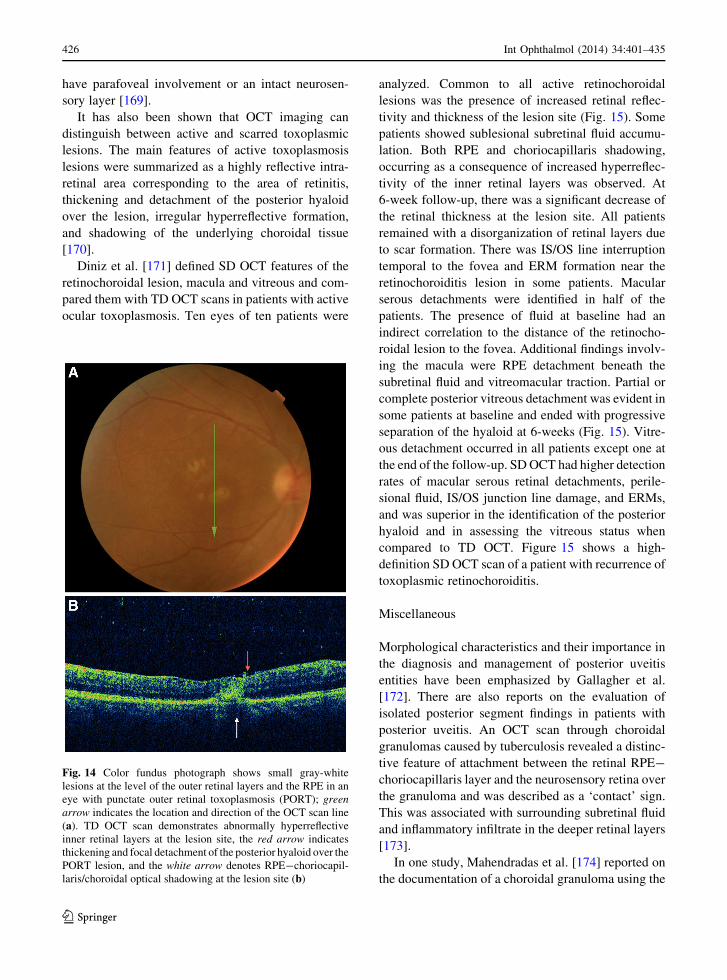
have parafoveal involvement or an intact neurosen-
sory layer [169].
It has also been shown that OCT imaging can
distinguish between active and scarred toxoplasmic
lesions. The main features of active toxoplasmosis
lesions were summarized as a highly reflective intra-
retinal area corresponding to the area of retinitis,
thickening and detachment of the posterior hyaloid
over the lesion, irregular hyperreflective formation,
and shadowing of the underlying choroidal tissue
[170].
Diniz et al. [171] defined SD OCT features of the
retinochoroidal lesion, macula and vitreous and com-
pared them with TD OCT scans in patients with active
ocular toxoplasmosis. Ten eyes of ten patients were
analyzed. Common to all active retinochoroidal
lesions was the presence of increased retinal reflec-
tivity and thickness of the lesion site (Fig. 15). Some
patients showed sublesional subretinal fluid accumu-
lation. Both RPE and choriocapillaris shadowing,
occurring as a consequence of increased hyperreflec-
tivity of the inner retinal layers was observed. At
6-week follow-up, there was a significant decrease of
the retinal thickness at the lesion site. All patients
remained with a disorganization of retinal layers due
to scar formation. There was IS/OS line interruption
temporal to the fovea and ERM formation near the
retinochoroiditis lesion in some patients. Macular
serous detachments were identified in half of the
patients. The presence of fluid at baseline had an
indirect correlation to the distance of the retinocho-
roidal lesion to the fovea. Additional findings involv-
ing the macula were RPE detachment beneath the
subretinal fluid and vitreomacular traction. Partial or
complete posterior vitreous detachment was evident in
some patients at baseline and ended with progressive
separation of the hyaloid at 6-weeks (Fig. 15). Vitre-
ous detachment occurred in all patients except one at
the end of the follow-up. SD OCT had higher detection
rates of macular serous retinal detachments, perile-
sional fluid, IS/OS junction line damage, and ERMs,
and was superior in the identification of the posterior
hyaloid and in assessing the vitreous status when
compared to TD OCT. Figure 15 shows a high-
definition SD OCT scan of a patient with recurrence of
toxoplasmic retinochoroiditis.
Miscellaneous
Morphological characteristics and their importance in
the diagnosis and management of posterior uveitis
entities have been emphasized by Gallagher et al.
[172]. There are also reports on the evaluation of
isolated posterior segment findings in patients with
posterior uveitis. An OCT scan through choroidal
granulomas caused by tuberculosis revealed a distinc-
tive feature of attachment between the retinal RPE-
choriocapillaris layer and the neurosensory retina over
the granuloma and was described as a ‘contact’ sign.
This was associated with surrounding subretinal fluid
and inflammatory infiltrate in the deeper retinal layers
[173].
In one study, Mahendradas et al. [174] reported on
the documentation of a choroidal granuloma using the
Fig. 14 Color fundus photograph shows small gray-white
lesions at the level of the outer retinal layers and the RPE in an
eye with punctate outer retinal toxoplasmosis (PORT); green
arrow indicates the location and direction of the OCT scan line
(a). TD OCT scan demonstrates abnormally hyperreflective
inner retinal layers at the lesion site, the red arrow indicates
thickening and focal detachment of the posterior hyaloid over the
PORT lesion, and the white arrow denotes RPE-choriocapil-
laris/choroidal optical shadowing at the lesion site (b)
426 Int Ophthalmol (2014) 34:401–435
123
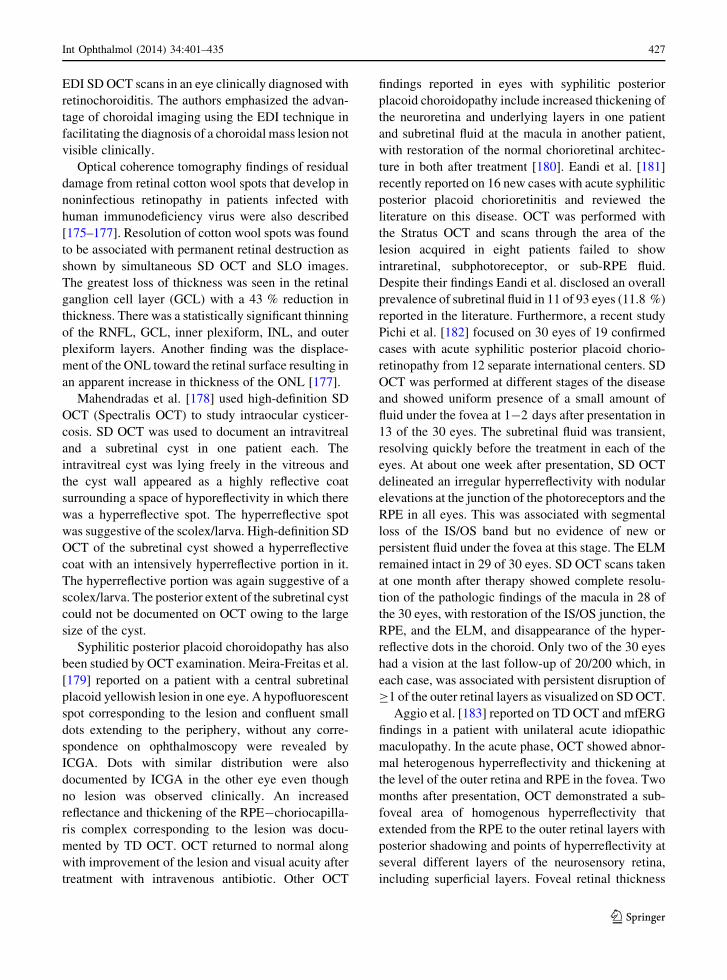
EDI SD OCT scans in an eye clinically diagnosed with
retinochoroiditis. The authors emphasized the advan-
tage of choroidal imaging using the EDI technique in
facilitating the diagnosis of a choroidal mass lesion not
visible clinically.
Optical coherence tomography findings of residual
damage from retinal cotton wool spots that develop in
noninfectious retinopathy in patients infected with
human immunodeficiency virus were also described
[175–177]. Resolution of cotton wool spots was found
to be associated with permanent retinal destruction as
shown by simultaneous SD OCT and SLO images.
The greatest loss of thickness was seen in the retinal
ganglion cell layer (GCL) with a 43 % reduction in
thickness. There was a statistically significant thinning
of the RNFL, GCL, inner plexiform, INL, and outer
plexiform layers. Another finding was the displace-
ment of the ONL toward the retinal surface resulting in
an apparent increase in thickness of the ONL [177].
Mahendradas et al. [178] used high-definition SD
OCT (Spectralis OCT) to study intraocular cysticer-
cosis. SD OCT was used to document an intravitreal
and a subretinal cyst in one patient each. The
intravitreal cyst was lying freely in the vitreous and
the cyst wall appeared as a highly reflective coat
surrounding a space of hyporeflectivity in which there
was a hyperreflective spot. The hyperreflective spot
was suggestive of the scolex/larva. High-definition SD
OCT of the subretinal cyst showed a hyperreflective
coat with an intensively hyperreflective portion in it.
The hyperreflective portion was again suggestive of a
scolex/larva. The posterior extent of the subretinal cyst
could not be documented on OCT owing to the large
size of the cyst.
Syphilitic posterior placoid choroidopathy has also
been studied by OCT examination. Meira-Freitas et al.
[179] reported on a patient with a central subretinal
placoid yellowish lesion in one eye. A hypofluorescent
spot corresponding to the lesion and confluent small
dots extending to the periphery, without any corre-
spondence on ophthalmoscopy were revealed by
ICGA. Dots with similar distribution were also
documented by ICGA in the other eye even though
no lesion was observed clinically. An increased
reflectance and thickening of the RPE-choriocapilla-
ris complex corresponding to the lesion was docu-
mented by TD OCT. OCT returned to normal along
with improvement of the lesion and visual acuity after
treatment with intravenous antibiotic. Other OCT
findings reported in eyes with syphilitic posterior
placoid choroidopathy include increased thickening of
the neuroretina and underlying layers in one patient
and subretinal fluid at the macula in another patient,
with restoration of the normal chorioretinal architec-
ture in both after treatment [180]. Eandi et al. [181]
recently reported on 16 new cases with acute syphilitic
posterior placoid chorioretinitis and reviewed the
literature on this disease. OCT was performed with
the Stratus OCT and scans through the area of the
lesion acquired in eight patients failed to show
intraretinal, subphotoreceptor, or sub-RPE fluid.
Despite their findings Eandi et al. disclosed an overall
prevalence of subretinal fluid in 11 of 93 eyes (11.8 %)
reported in the literature. Furthermore, a recent study
Pichi et al. [182] focused on 30 eyes of 19 confirmed
cases with acute syphilitic posterior placoid chorio-
retinopathy from 12 separate international centers. SD
OCT was performed at different stages of the disease
and showed uniform presence of a small amount of
fluid under the fovea at 1-2 days after presentation in
13 of the 30 eyes. The subretinal fluid was transient,
resolving quickly before the treatment in each of the
eyes. At about one week after presentation, SD OCT
delineated an irregular hyperreflectivity with nodular
elevations at the junction of the photoreceptors and the
RPE in all eyes. This was associated with segmental
loss of the IS/OS band but no evidence of new or
persistent fluid under the fovea at this stage. The ELM
remained intact in 29 of 30 eyes. SD OCT scans taken
at one month after therapy showed complete resolu-
tion of the pathologic findings of the macula in 28 of
the 30 eyes, with restoration of the IS/OS junction, the
RPE, and the ELM, and disappearance of the hyper-
reflective dots in the choroid. Only two of the 30 eyes
had a vision at the last follow-up of 20/200 which, in
each case, was associated with persistent disruption of
C1 of the outer retinal layers as visualized on SD OCT.
Aggio et al. [183] reported on TD OCT and mfERG
findings in a patient with unilateral acute idiopathic
maculopathy. In the acute phase, OCT showed abnor-
mal heterogenous hyperreflectivity and thickening at
the level of the outer retina and RPE in the fovea. Two
months after presentation, OCT demonstrated a sub-
foveal area of homogenous hyperreflectivity that
extended from the RPE to the outer retinal layers with
posterior shadowing and points of hyperreflectivity at
several different layers of the neurosensory retina,
including superficial layers. Foveal retinal thickness
Int Ophthalmol (2014) 34:401–435 427
123
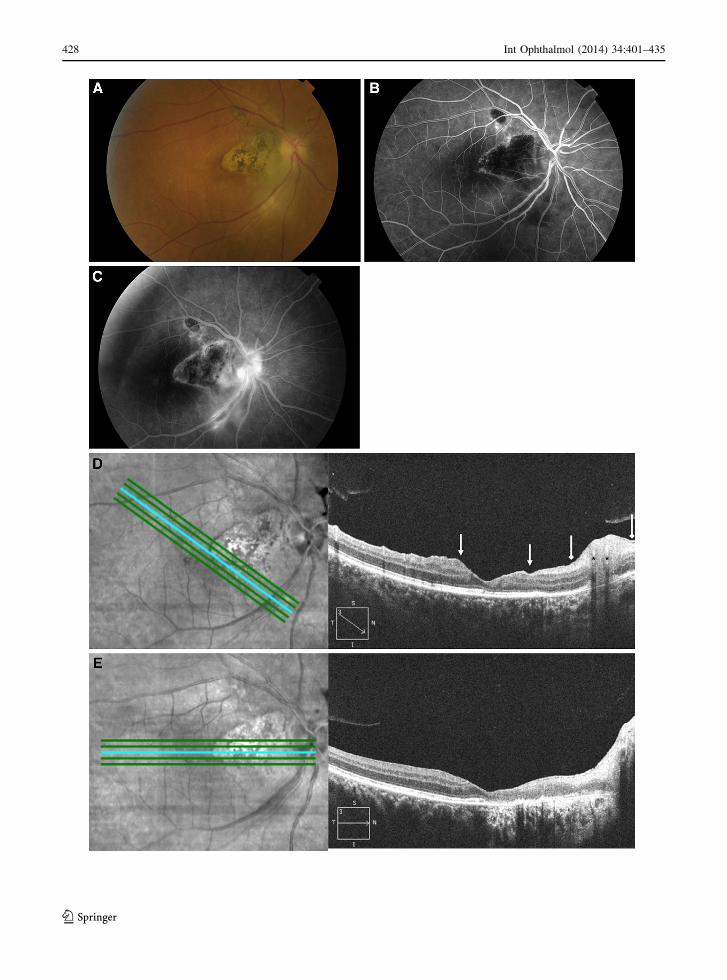
428 Int Ophthalmol (2014) 34:401–435
123

decreased with resolution. Abnormal mfERG readings
also returned to normal with disease resolution.
Conclusion
With the advent of OCT technology and the change
from TD to SD signal detection, noninvasive in vivo
imaging of the retina in detail has become possible.
This technology has revolutionized the qualitative and
quantitative assessment of posterior segment pathol-
ogies associated with uveitis, especially inflammatory
macular edema. As it allows fast noninvasive, non-
contact, real-time, and reproducible imaging of mac-
ular anatomy, OCT has now become a standard
ancillary test for detecting and monitoring uveitic
macular edema. Physiopathology of uveitic maculop-
athies has been better understood since the introduc-
tion of OCT, and classification and prognostication
have become possible. Determination of an intact IS/
OS line has been proven to be a good predictor of
visual recovery and prognosis in uveitic macular
edema. Application of OCT technology to uveitis
practice has also shed light on the physiopathology of
several uveitis entities. High-resolution OCT imaging
of morphological changes in the retina, vitreoretinal
interface, and choroid have led to a better understand-
ing of disease processes and distinctive features of
these entities. With the introduction of the EDI OCT
technique, visualization of the choroid and choriocap-
illaries has also become possible, providing informa-
tion not available with other imaging methods, on the
primary focus of inflammation in some uveitic
diseases. Thus, OCT imaging has become an indis-
pensable tool for both the differential diagnosis and
follow-up of inflammatory diseases of the retina and
choroid. Future advances in this field will enable
visualization of the retinal and choroidal vessels in
detail and high-penetration OCT systems will allow
high-contrast imaging of the choroid.
References
1. Huang D, Swanson EA, Lin CP et al (1991) Optical
coherence tomography. Science 254:1178–1181
2. Hee MR, Izatt JA, Swanson EA et al (1995) Optical
coherence tomography of the human retina. Arch Oph-
thalmol 113:325–332
3. Hee MR, Puliafito CA, Wong C et al (1995) Quantitative
assessment of macular edema with optical coherence
tomography. Arch Ophthalmol 113:1019–1029
4. Hee HR, Puliafito CA, Wong C et al (1995) Optical
coherence tomography of macular holes. Ophthalmology
102:748–756
5. Hee MR, Puliafito CA, Wong C et al (1995) Optical
coherence tomography of central serous chorioretinopa-
thy. Am J Ophthalmol 120:65–74
6. Hee MR, Baumal CR, Puliafito CA et al (1996) Optical
coherence tomography of age-related macular degenera-
tion and choroidal neovascularization. Ophthalmology
103:1260–1270
7. Yi K, Chen TC, de Boer JF (2006) Spectral domain optical
coherence tomography. Tech Ophthalmol 4:170–174
8. Fercher AF, Hitzenberger CK, Kamp G, Elzaiat SY (1995)
Measurement of intraocular distances by backscattering
spectral interferometry. Opt Commun 117:43–48
9. Wojtkowski M, Leitgeb R, Kowalczyk A et al (2002)
In vivo human retinal imaging by Fourier domain optical
coherence tomography. J Biomed Opt 7:457–463
10. Drexler W, Sattmann H, Hermann B et al (2003) Enhanced
visualization of macular pathology with the use of ultra-
high resolution optical coherence tomography. Arch
Ophthalmol 121:695–706
11. Nassif N, Cense B, Park BH et al (2004) In vivo human
retinal imaging by ultrahigh-speed spectral domain optical
coherence tomography. Opt Lett 29:480–482
12. Chen TC, Cense B, Pierce MC et al (2005) Spectral
domain optical coherence tomography: ultra-high speed,
ultra-high resolution ophthalmic imaging. Arch Ophthal-
mol 123:1715–1720
13. Cense B, Nassif N, Chen T et al (2004) Ultrahigh-resolu-
tion high-speed retinal imaging using spectral-domain
optical coherence tomography. Opt Express 12:2435–2447
14. Wojtkowski M, Srinivasan V, Ko T et al (2004) Ultrahigh-
resolution, high-speed, Fourier domain optical coherence
Fig. 15 Color fundus photograph of the right eye shows active
toxoplasmic retinochoroiditis along the inferior temporal
vascular arcade in an eye with a pre-existing retinochoroidal
scars (a). Arteriovenous phase fluorescein angiogram shows
hypofluorescence of the active lesion and the scars with
hyperfluorescent borders (b). Late-phase fluorescein angiogram
shows hyperfluorescence of the active lesion, focal staining of
the inferotemporal retinal artery and vein walls, focal disc
staining, and irregular hyperfluorescence of the scars (c). SD
OCT image of 9 mm scans were obtained using Cirrus HD-OCT
with high-definition 5-line scan mode. LSO fundus image shows
the location of scan line through the retinochoroiditis focus.
OCT B-scan image reveals thickening of the retina and
hyperreflectance of inner retinal layers and RPE-choriocapil-
laris/choroidal optical shadowing at the active lesion site
demarcated by the diamond arrows. There is thickening and
detachment of the posterior hyaloid over the lesion. Asterisks
indicate shadowing of the retinal artery and vein. The same scan
line passes along the border of the pigmented retinochoroidal
scar and the fovea (arrows) (d). LSO fundus image shows the
location of scan line through the retinochoroidal scar. OCT
B-scan image reveals a disorganized and thinned retina with
focal choriocapillaris/choroidal relative hyperreflectivity. Com-
plete posterior vitreous detachment is evident across the scan (e)
b
Int Ophthalmol (2014) 34:401–435 429
123
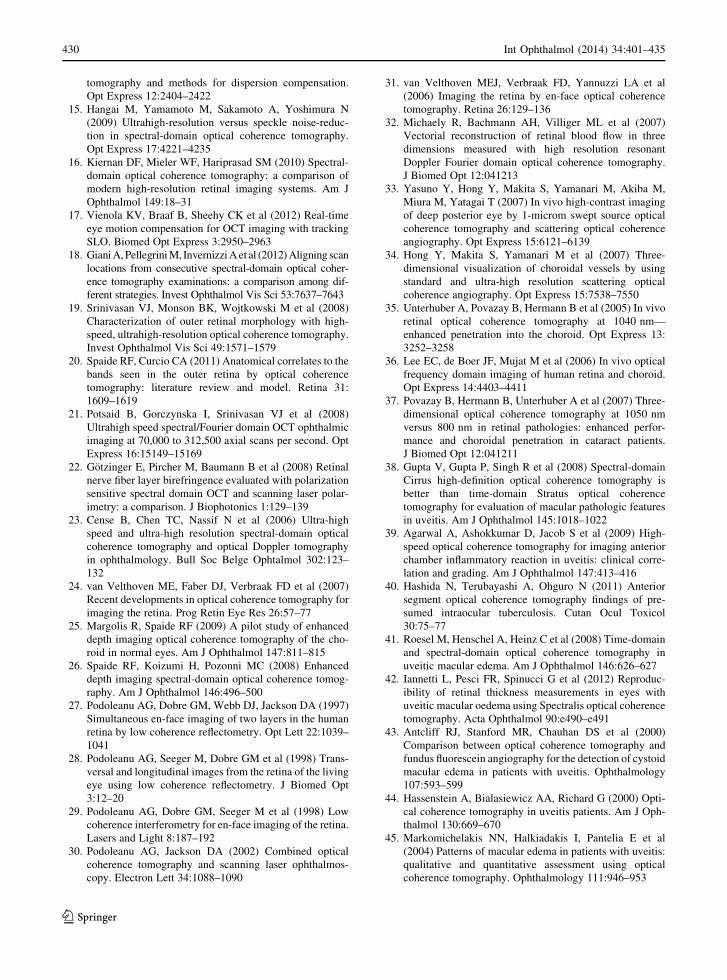
tomography and methods for dispersion compensation.
Opt Express 12:2404–2422
15. Hangai M, Yamamoto M, Sakamoto A, Yoshimura N
(2009) Ultrahigh-resolution versus speckle noise-reduc-
tion in spectral-domain optical coherence tomography.
Opt Express 17:4221–4235
16. Kiernan DF, Mieler WF, Hariprasad SM (2010) Spectral-
domain optical coherence tomography: a comparison of
modern high-resolution retinal imaging systems. Am J
Ophthalmol 149:18–31
17. Vienola KV, Braaf B, Sheehy CK et al (2012) Real-time
eye motion compensation for OCT imaging with tracking
SLO. Biomed Opt Express 3:2950–2963
18. Giani A, Pellegrini M, Invernizzi A et al (2012) Aligning scan
locations from consecutive spectral-domain optical coher-
ence tomography examinations: a comparison among dif-
ferent strategies. Invest Ophthalmol Vis Sci 53:7637–7643
19. Srinivasan VJ, Monson BK, Wojtkowski M et al (2008)
Characterization of outer retinal morphology with high-
speed, ultrahigh-resolution optical coherence tomography.
Invest Ophthalmol Vis Sci 49:1571–1579
20. Spaide RF, Curcio CA (2011) Anatomical correlates to the
bands seen in the outer retina by optical coherence
tomography: literature review and model. Retina 31:
1609–1619
21. Potsaid B, Gorczynska I, Srinivasan VJ et al (2008)
Ultrahigh speed spectral/Fourier domain OCT ophthalmic
imaging at 70,000 to 312,500 axial scans per second. Opt
Express 16:15149–15169
22. Gotzinger E, Pircher M, Baumann B et al (2008) Retinal
nerve fiber layer birefringence evaluated with polarization
sensitive spectral domain OCT and scanning laser polar-
imetry: a comparison. J Biophotonics 1:129–139
23. Cense B, Chen TC, Nassif N et al (2006) Ultra-high
speed and ultra-high resolution spectral-domain optical
coherence tomography and optical Doppler tomography
in ophthalmology. Bull Soc Belge Ophtalmol 302:123–
132
24. van Velthoven ME, Faber DJ, Verbraak FD et al (2007)
Recent developments in optical coherence tomography for
imaging the retina. Prog Retin Eye Res 26:57–77
25. Margolis R, Spaide RF (2009) A pilot study of enhanced
depth imaging optical coherence tomography of the cho-
roid in normal eyes. Am J Ophthalmol 147:811–815
26. Spaide RF, Koizumi H, Pozonni MC (2008) Enhanced
depth imaging spectral-domain optical coherence tomog-
raphy. Am J Ophthalmol 146:496–500
27. Podoleanu AG, Dobre GM, Webb DJ, Jackson DA (1997)
Simultaneous en-face imaging of two layers in the human
retina by low coherence reflectometry. Opt Lett 22:1039–
1041
28. Podoleanu AG, Seeger M, Dobre GM et al (1998) Trans-
versal and longitudinal images from the retina of the living
eye using low coherence reflectometry. J Biomed Opt
3:12–20
29. Podoleanu AG, Dobre GM, Seeger M et al (1998) Low
coherence interferometry for en-face imaging of the retina.
Lasers and Light 8:187–192
30. Podoleanu AG, Jackson DA (2002) Combined optical
coherence tomography and scanning laser ophthalmos-
copy. Electron Lett 34:1088–1090
31. van Velthoven MEJ, Verbraak FD, Yannuzzi LA et al
(2006) Imaging the retina by en-face optical coherence
tomography. Retina 26:129–136
32. Michaely R, Bachmann AH, Villiger ML et al (2007)
Vectorial reconstruction of retinal blood flow in three
dimensions measured with high resolution resonant
Doppler Fourier domain optical coherence tomography.
J Biomed Opt 12:041213
33. Yasuno Y, Hong Y, Makita S, Yamanari M, Akiba M,
Miura M, Yatagai T (2007) In vivo high-contrast imaging
of deep posterior eye by 1-microm swept source optical
coherence tomography and scattering optical coherence
angiography. Opt Express 15:6121–6139
34. Hong Y, Makita S, Yamanari M et al (2007) Three-
dimensional visualization of choroidal vessels by using
standard and ultra-high resolution scattering optical
coherence angiography. Opt Express 15:7538–7550
35. Unterhuber A, Povazay B, Hermann B et al (2005) In vivo
retinal optical coherence tomography at 1040 nm—
enhanced penetration into the choroid. Opt Express 13:
3252–3258
36. Lee EC, de Boer JF, Mujat M et al (2006) In vivo optical
frequency domain imaging of human retina and choroid.
Opt Express 14:4403–4411
37. Povazay B, Hermann B, Unterhuber A et al (2007) Three-
dimensional optical coherence tomography at 1050 nm
versus 800 nm in retinal pathologies: enhanced perfor-
mance and choroidal penetration in cataract patients.
J Biomed Opt 12:041211
38. Gupta V, Gupta P, Singh R et al (2008) Spectral-domain
Cirrus high-definition optical coherence tomography is
better than time-domain Stratus optical coherence
tomography for evaluation of macular pathologic features
in uveitis. Am J Ophthalmol 145:1018–1022
39. Agarwal A, Ashokkumar D, Jacob S et al (2009) High-
speed optical coherence tomography for imaging anterior
chamber inflammatory reaction in uveitis: clinical corre-
lation and grading. Am J Ophthalmol 147:413–416
40. Hashida N, Terubayashi A, Ohguro N (2011) Anterior
segment optical coherence tomography findings of pre-
sumed intraocular tuberculosis. Cutan Ocul Toxicol
30:75–77
41. Roesel M, Henschel A, Heinz C et al (2008) Time-domain
and spectral-domain optical coherence tomography in
uveitic macular edema. Am J Ophthalmol 146:626–627
42. Iannetti L, Pesci FR, Spinucci G et al (2012) Reproduc-
ibility of retinal thickness measurements in eyes with
uveitic macular oedema using Spectralis optical coherence
tomography. Acta Ophthalmol 90:e490–e491
43. Antcliff RJ, Stanford MR, Chauhan DS et al (2000)
Comparison between optical coherence tomography and
fundus fluorescein angiography for the detection of cystoid
macular edema in patients with uveitis. Ophthalmology
107:593–599
44. Hassenstein A, Bialasiewicz AA, Richard G (2000) Opti-
cal coherence tomography in uveitis patients. Am J Oph-
thalmol 130:669–670
45. Markomichelakis NN, Halkiadakis I, Pantelia E et al
(2004) Patterns of macular edema in patients with uveitis:
qualitative and quantitative assessment using optical
coherence tomography. Ophthalmology 111:946–953
430 Int Ophthalmol (2014) 34:401–435
123
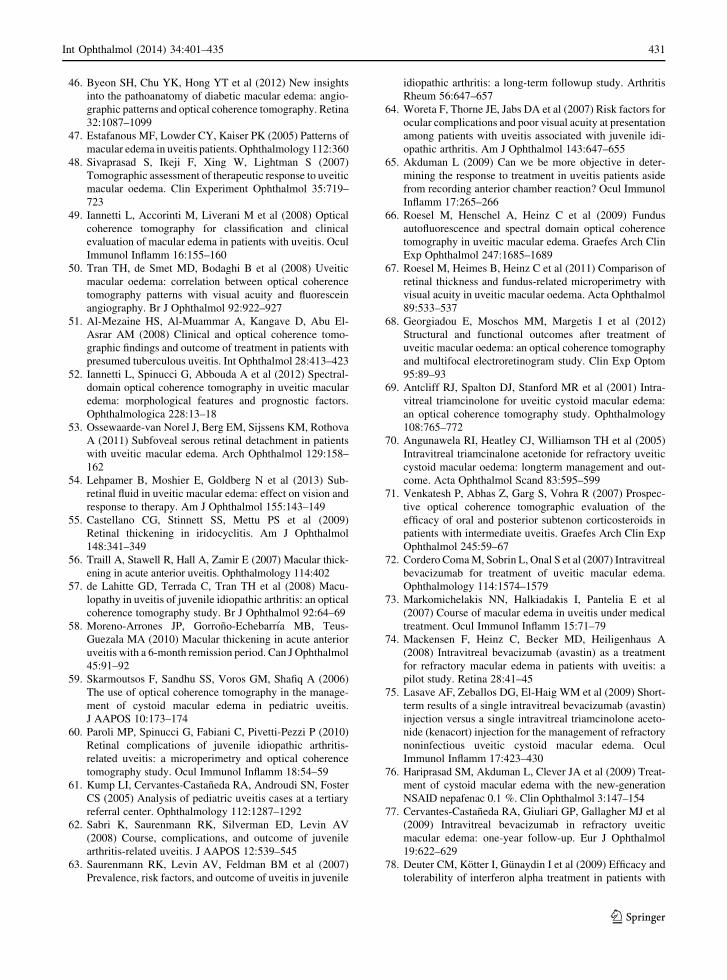
46. Byeon SH, Chu YK, Hong YT et al (2012) New insights
into the pathoanatomy of diabetic macular edema: angio-
graphic patterns and optical coherence tomography. Retina
32:1087–1099
47. Estafanous MF, Lowder CY, Kaiser PK (2005) Patterns of
macular edema in uveitis patients. Ophthalmology 112:360
48. Sivaprasad S, Ikeji F, Xing W, Lightman S (2007)
Tomographic assessment of therapeutic response to uveitic
macular oedema. Clin Experiment Ophthalmol 35:719–
723
49. Iannetti L, Accorinti M, Liverani M et al (2008) Optical
coherence tomography for classification and clinical
evaluation of macular edema in patients with uveitis. Ocul
Immunol Inflamm 16:155–160
50. Tran TH, de Smet MD, Bodaghi B et al (2008) Uveitic
macular oedema: correlation between optical coherence
tomography patterns with visual acuity and fluorescein
angiography. Br J Ophthalmol 92:922–927
51. Al-Mezaine HS, Al-Muammar A, Kangave D, Abu El-
Asrar AM (2008) Clinical and optical coherence tomo-
graphic findings and outcome of treatment in patients with
presumed tuberculous uveitis. Int Ophthalmol 28:413–423
52. Iannetti L, Spinucci G, Abbouda A et al (2012) Spectral-
domain optical coherence tomography in uveitic macular
edema: morphological features and prognostic factors.
Ophthalmologica 228:13–18
53. Ossewaarde-van Norel J, Berg EM, Sijssens KM, Rothova
A (2011) Subfoveal serous retinal detachment in patients
with uveitic macular edema. Arch Ophthalmol 129:158–
162
54. Lehpamer B, Moshier E, Goldberg N et al (2013) Sub-
retinal fluid in uveitic macular edema: effect on vision and
response to therapy. Am J Ophthalmol 155:143–149
55. Castellano CG, Stinnett SS, Mettu PS et al (2009)
Retinal thickening in iridocyclitis. Am J Ophthalmol
148:341–349
56. Traill A, Stawell R, Hall A, Zamir E (2007) Macular thick-
ening in acute anterior uveitis. Ophthalmology 114:402
57. de Lahitte GD, Terrada C, Tran TH et al (2008) Macu-
lopathy in uveitis of juvenile idiopathic arthritis: an optical
coherence tomography study. Br J Ophthalmol 92:64–69
58. Moreno-Arrones JP, Gorrono-Echebarrıa MB, Teus-
Guezala MA (2010) Macular thickening in acute anterior
uveitis with a 6-month remission period. Can J Ophthalmol
45:91–92
59. Skarmoutsos F, Sandhu SS, Voros GM, Shafiq A (2006)
The use of optical coherence tomography in the manage-
ment of cystoid macular edema in pediatric uveitis.
J AAPOS 10:173–174
60. Paroli MP, Spinucci G, Fabiani C, Pivetti-Pezzi P (2010)
Retinal complications of juvenile idiopathic arthritis-
related uveitis: a microperimetry and optical coherence
tomography study. Ocul Immunol Inflamm 18:54–59
61. Kump LI, Cervantes-Castaneda RA, Androudi SN, Foster
CS (2005) Analysis of pediatric uveitis cases at a tertiary
referral center. Ophthalmology 112:1287–1292
62. Sabri K, Saurenmann RK, Silverman ED, Levin AV
(2008) Course, complications, and outcome of juvenile
arthritis-related uveitis. J AAPOS 12:539–545
63. Saurenmann RK, Levin AV, Feldman BM et al (2007)
Prevalence, risk factors, and outcome of uveitis in juvenile
idiopathic arthritis: a long-term followup study. Arthritis
Rheum 56:647–657
64. Woreta F, Thorne JE, Jabs DA et al (2007) Risk factors for
ocular complications and poor visual acuity at presentation
among patients with uveitis associated with juvenile idi-
opathic arthritis. Am J Ophthalmol 143:647–655
65. Akduman L (2009) Can we be more objective in deter-
mining the response to treatment in uveitis patients aside
from recording anterior chamber reaction? Ocul Immunol
Inflamm 17:265–266
66. Roesel M, Henschel A, Heinz C et al (2009) Fundus
autofluorescence and spectral domain optical coherence
tomography in uveitic macular edema. Graefes Arch Clin
Exp Ophthalmol 247:1685–1689
67. Roesel M, Heimes B, Heinz C et al (2011) Comparison of
retinal thickness and fundus-related microperimetry with
visual acuity in uveitic macular oedema. Acta Ophthalmol
89:533–537
68. Georgiadou E, Moschos MM, Margetis I et al (2012)
Structural and functional outcomes after treatment of
uveitic macular oedema: an optical coherence tomography
and multifocal electroretinogram study. Clin Exp Optom
95:89–93
69. Antcliff RJ, Spalton DJ, Stanford MR et al (2001) Intra-
vitreal triamcinolone for uveitic cystoid macular edema:
an optical coherence tomography study. Ophthalmology
108:765–772
70. Angunawela RI, Heatley CJ, Williamson TH et al (2005)
Intravitreal triamcinalone acetonide for refractory uveitic
cystoid macular oedema: longterm management and out-
come. Acta Ophthalmol Scand 83:595–599
71. Venkatesh P, Abhas Z, Garg S, Vohra R (2007) Prospec-
tive optical coherence tomographic evaluation of the
efficacy of oral and posterior subtenon corticosteroids in
patients with intermediate uveitis. Graefes Arch Clin Exp
Ophthalmol 245:59–67
72. Cordero Coma M, Sobrin L, Onal S et al (2007) Intravitreal
bevacizumab for treatment of uveitic macular edema.
Ophthalmology 114:1574–1579
73. Markomichelakis NN, Halkiadakis I, Pantelia E et al
(2007) Course of macular edema in uveitis under medical
treatment. Ocul Immunol Inflamm 15:71–79
74. Mackensen F, Heinz C, Becker MD, Heiligenhaus A
(2008) Intravitreal bevacizumab (avastin) as a treatment
for refractory macular edema in patients with uveitis: a
pilot study. Retina 28:41–45
75. Lasave AF, Zeballos DG, El-Haig WM et al (2009) Short-
term results of a single intravitreal bevacizumab (avastin)
injection versus a single intravitreal triamcinolone aceto-
nide (kenacort) injection for the management of refractory
noninfectious uveitic cystoid macular edema. Ocul
Immunol Inflamm 17:423–430
76. Hariprasad SM, Akduman L, Clever JA et al (2009) Treat-
ment of cystoid macular edema with the new-generation
NSAID nepafenac 0.1 %. Clin Ophthalmol 3:147–154
77. Cervantes-Castaneda RA, Giuliari GP, Gallagher MJ et al
(2009) Intravitreal bevacizumab in refractory uveitic
macular edema: one-year follow-up. Eur J Ophthalmol
19:622–629
78. Deuter CM, Kotter I, Gunaydin I et al (2009) Efficacy and
tolerability of interferon alpha treatment in patients with
Int Ophthalmol (2014) 34:401–435 431
123

chronic cystoid macular oedema due to non-infectious
uveitis. Br J Ophthalmol 93:906–913
79. Schulze-Dobold C, Weber M (2009) Loss of visual func-
tion after repeated intravitreal injections of triamcinolone
acetonide in refractory uveitic macular oedema. Int Oph-
thalmol 29:427–429
80. Belair ML, Kim SJ, Thorne JE et al (2009) Incidence of
cystoid macular edema after cataract surgery in patients
with and without uveitis using optical coherence tomog-
raphy. Am J Ophthalmol 148:128–135
81. Androudi S, Tsironi E, Kalogeropoulos C et al (2010)
Intravitreal adalimumab for refractory uveitis-related
macular edema. Ophthalmology 117:1612–1616
82. Soheilian M, Rabbanikhah Z, Ramezani A et al (2010)
Intravitreal bevacizumab versus triamcinolone acetonide
for refractory uveitic cystoid macular edema: a random-
ized pilot study. J Ocul Pharmacol Ther 26:199–206
83. Acharya NR, Sittivarakul W, Qian Y et al (2011) Bilateral
effect of unilateral ranibizumab in patients with uveitis-
related macular edema. Retina 31:1871–1876
84. Faia LJ, Sen HN, Li Z et al (2011) Treatment of inflam-
matory macular edema with humanized anti-CD11a anti-
body therapy. Invest Ophthalmol Vis Sci 52:6919–6924
85. Bae JH, Lee CS, Lee SC (2011) Efficacy and safety of
intravitreal bevacizumab compared with intravitreal and
posterior sub-tenon triamcinolone acetonide for treatment
of uveitic cystoid macular edema. Retina 31:111–118
86. Sugar EA, Jabs DA, Altaweel MM, Multicenter Uveitis
Steroid Treatment (MUST) Trial Research Group et al
(2011) Identifying a clinically meaningful threshold for
change in uveitic macular edema evaluated by optical
coherence tomography. Am J Ophthalmol 152:1044–
1052
87. Payne JF, Bruce BB, Lee LB, Yeh S (2011) Logarithmic
transformation of spectral-domain optical coherence
tomography data in uveitis-associated macular edema.
Invest Ophthalmol Vis Sci 52:8939–8943
88. Scholl S, Kirchhof J, Augustin AJ (2010) Pathophysi-
ology of macular edema. Ophthalmologica 224(Suppl
1):8–15
89. Reichenbach A, Wurm A, Pannicke T et al (2007) Muller
cells as players in retinal degeneration and edema. Graefes
Arch Clin Exp Ophthalmol 245:627–636
90. Nussenblatt RB (1986) Macular alterations secondary to
intraocular inflammatory disease. Ophthalmology 93:984–
988
91. Forooghian F, Yeh S, Faia LJ, Nussenblatt RB (2009)
Uveitic foveal atrophy: clinical features and associations.
Arch Ophthalmol 127:179–186
92. Maruyama Y, Kishi S (2004) Tomographic features of
serous retinal detachment in Vogt-Koyanagi-Harada syn-
drome. Ophthalmic Surg Lasers Imaging 35:239–242
93. Parc C, Guenoun JM, Dhote R, Brezin A (2005) Optical
coherence tomography in the acute and chronic phases of
Vogt-Koyanagi-Harada disease. Ocul Immunol Inflamm
13:225–227
94. Tsujikawa A, Yamashiro K, Yamamoto K et al (2005)
Retinal cystoid spaces in acute Vogt-Koyanagi-Harada
syndrome. Am J Ophthalmol 139:670–677
95. de Smet MD, Rao NA (2005) Retinal cystoid spaces in
acute Vogt-Koyanagi-Harada syndrome. Am J Ophthal-
mol 140:962–963
96. Yamaguchi Y, Otani T, Kishi S (2007) Tomographic
features of serous retinal detachment with multilobular dye
pooling in acute Vogt-Koyanagi-Harada disease. Am J
Ophthalmol 144:260–265
97. Yamanaka E, Ohguro N, Yamamoto S et al (2002) Eval-
uation of pulse corticosteroid therapy for Vogt-Koyanagi-
Harada disease assessed by optical coherence tomography.
Am J Ophthalmol 134:454–456
98. Lee JE, Park SW, Lee JK et al (2009) Edema of the pho-
toreceptor layer in Vogt-Koyanagi-Harada disease
observed using high-resolution optical coherence tomog-
raphy. Korean J Ophthalmol 23:74–79
99. Fardeau C, Tran TH, Gharbi B et al (2007) Retinal fluo-
rescein and indocyanine green angiography and optical
coherence tomography in successive stages of Vogt-Ko-
yanagi-Harada disease. Int Ophthalmol 27:163–172
100. Ishihara K, Hangai M, Kita M, Yoshimura N (2009) Acute
Vogt-Koyanagi-Harada disease in enhanced spectral-
domain optical coherence tomography. Ophthalmology
116:1799–1807
101. Ikewaki J, Kimoto K, Choshi T et al (2011) Optical
coherence tomographic assessment of dynamic macular
changes in patients with Vogt-Koyanagi-Harada disease.
Int Ophthalmol 31:9–13
102. Gupta V, Gupta A, Gupta P, Sharma A (2009) Spectral-
domain cirrus optical coherence tomography of choroidal
striations seen in the acute stage of Vogt-Koyanagi-Harada
disease. Am J Ophthalmol 147:148–153
103. Wu W, Wen F, Huang S et al (2007) Choroidal folds in
Vogt-Koyanagi-Harada disease. Am J Ophthalmol 143:
900–901
104. Zhao C, Zhang M, Wen X et al (2009) Choroidal folds in
acute Vogt-Koyanagi-Harada disease. Ocul Immunol In-
flamm 17:282–288
105. Okamoto Y, Miyake Y, Horio N et al (2004) Delayed
regeneration of foveal cone photopigments in Vogt-Ko-
yanagi-Harada disease at the convalescent stage. Invest
Ophthalmol Vis Sci 45:318–322
106. Vasconcelos-Santos DV, Sohn EH, Sadda S, Rao NA (2010)
Retinal pigment epithelial changes in chronic Vogt-Koyanagi-
Harada disease: fundus autofluorescence and spectral domain-
optical coherence tomography findings. Retina 30:33–41
107. Read RW, Holland GN, Rao NA et al (2001) Revised
diagnostic criteria for Vogt-Koyanagi-Harada disease:
report of an international committee on nomenclature. Am
J Ophthalmol 131:647–652
108. Rao NA (2007) Pathology of Vogt-Koyanagi-Harada dis-
ease. Int Ophthalmol 27:81–85
109. Fong AH, Li KK, Wong D (2011) Choroidal evaluation
using enhanced depth imaging spectral-domain optical
coherence tomography in Vogt-Koyanagi-Harada disease.
Retina 31:502–509
110. Herbort CP, Mantovani A, Bouchenaki N (2007) Indocy-
anine green angiography in Vogt-Koyanagi-Harada dis-
ease: angiographic signs and utility in patient follow-up.
Int Ophthalmol 27:173–182
432 Int Ophthalmol (2014) 34:401–435
123
111. Maruko I, Iida T, Sugano Y et al (2011) Subfoveal cho-
roidal thickness after treatment of Vogt-Koyanagi-Harada
disease. Retina 31:510–517
112. Yamamoto M, Nishijima K, Nakamura M, Yoshimura N
(2011) Inner retinal changes in acute-phase Vogt-Koyan-
agi-Harada disease measured by enhanced spectral domain
optical coherence tomography. Jpn J Ophthalmol 55:1–6
113. Gupta V, Gupta A, Dogra MR, Singh I (2011) Reversible
retinal changes in the acute stage of sympathetic oph-
thalmia seen on spectral domain optical coherence
tomography. Int Ophthalmol 31:105–110
114. Correnti AJ, Read RW, Kimble JA, Morris R (2010)
Imaging of Dalen-Fuchs nodules in a likely case of sym-
pathetic ophthalmia by fluorescein angiography and OCT.
Ophthalmic Surg Lasers Imaging 9:1–3
115. Lofoco G, Ciucci F, Bardocci A et al (2005) Optical
coherence tomography findings in a case of acute multi-
focal posterior placoid pigment epitheliopathy (AMP-
PPE). Eur J Ophthalmol 15:143–147
116. Lim LL, Watzke RC, Lauer AK, Smith JR (2006) Ocular
coherence tomography in acute posterior multifocal plac-
oid pigment epitheliopathy. Clin Experiment Ophthalmol
34:810–812
117. Scheufele TA, Witkin AJ, Schocket LS et al (2005) Pho-
toreceptor atrophy in acute posterior multifocal placoid
pigment epitheliopathy demonstrated by optical coherence
tomography. Retina 25:1109–1112
118. Garg S, Jampol LM (2004) Macular serous detachment in
acute posterior multifocal placoid pigment epitheliopathy.
Retina 24:650–651
119. Birnbaum AD, Blair MP, Tessler HH, Goldstein DA
(2010) Subretinal fluid in acute posterior multifocal plac-
oid pigment epitheliopathy. Retina 30:810–814
120. Lee GE, Lee BW, Rao NA, Fawzi AA (2011) Spectral
domain optical coherence tomography and autofluores-
cence in a case of acute posterior multifocal placoid pig-
ment epitheliopathy mimicking Vogt-Koyanagi-Harada
disease: case report and review of literature. Ocul Immu-
nol Inflamm 19:42–47
121. Montero JA, Ruiz-Moreno JM, Fernandez-Munoz M
(2011) Spectral domain optical coherence tomography
findings in acute posterior multifocal placoid pigment
epitheliopathy. Ocul Immunol Inflamm 19:48–50
122. Batioglu F, Ozmert E, Kurt R (2008) Fundus autofluores-
cence and spectral optical coherence tomography findings
in a case with acute posterior multifocal placoid pigment
epitheliopathy. Ann Ophthalmol (Skokie) 40:185–189
123. Souka AA, Hillenkamp J, Gora F et al (2006) Correlation
between optical coherence tomography and autofluorescence
in acute posterior multifocal placoid pigment epitheliopathy.
Graefes Arch Clin Exp Ophthalmol 244:1219–1223
124. Tarabishy AB, Lowder CY (2010) Retinal pigment epi-
thelium disturbances in acute posterior multifocal placoid
pigment epitheliopathy. Eye (Lond) 24:1404–1405
125. Cheung CM, Yeo IY, Koh A (2010) Photoreceptor changes in
acute and resolved acute posterior multifocal placoid pigment
epitheliopathy documented by spectral-domain optical
coherence tomography. Arch Ophthalmol 128:644–646
126. Amer R, Florescu T (2008) Optical coherence tomography
in relentless placoid chorioretinitis. Clin Experiment
Ophthalmol 36:388–390
127. Li D, Kishi S (2007) Loss of photoreceptor outer segment
in acute zonal occult outer retinopathy. Arch Ophthalmol
125:1194–1200
128. Zibrandtsen N, Munch IC, Klemp K et al (2008) Photo-
receptor atrophy in acute zonal occult outer retinopathy.
Acta Ophthalmol 86:913–916
129. Takai Y, Ishiko S, Kagokawa H et al (2009) Morpholog-
ical study of acute zonal occult outer retinopathy
(AZOOR) by multiplanar optical coherence tomography.
Acta Ophthalmol 87:408–418
130. Spaide RF, Koizumi H, Freund KB (2008) Photoreceptor
outer segment abnormalities as a cause of blind spot
enlargement in acute zonal occult outer retinopathy-com-
plex diseases. Am J Ophthalmol 146:111–120
131. Fujiwara T, Imamura Y, Giovinazzo VJ, Spaide RF (2010)
Fundus autofluorescence and optical coherence tomo-
graphic findings in acute zonal occult outer retinopathy.
Retina 30:1206–1216
132. Tunoda K, Fujinami K, Miyake Y (2011) Selective abnor-
mality of cone outer segment tip line in acute zonal occult
outer retinopathy as observed by spectral-domain optical
coherence tomography. Arch Ophthalmol 129:1099–1101
133. So K, Shinoda K, Matsumoto CS, Satofuka S, Imamura
Y, Mizota A (2011) Focal functional and microstructural
changes of photoreceptors in eyes with acute zonal
occult outer retinopathy. Case Report Ophthalmol 2:
307–313
134. Ohta K, Sato A, Fukui E (2009) Spectral domain optical
coherence tomographic findings at convalescent stage of
acute zonal occult outer retinopathy. Clin Ophthalmol
3:423–428
135. Mkrtchyan M, Lujan BJ, Merino D et al (2012) Outer
retinal structure in patients with acute zonal occult outer
retinopathy. Am J Ophthalmol 153:757–768
136. Vance SK, Spaide RF, Freund KB et al (2011) Outer ret-
inal abnormalities in acute macular neuroretinopathy.
Retina 31:441–445
137. Kanis MJ, van Norren D (2006) Integrity of foveal cones in
multiple evanescent white dot syndrome assessed with
OCT and foveal reflection analyser. Br J Ophthalmol
90:795–796
138. Nguyen MH, Witkin AJ, Reichel E et al (2007) Micro-
structural abnormalities in MEWDS demonstrated by
ultrahigh resolution optical coherence tomography. Retina
27:414–418
139. Li D, Kishi S (2009) Restored photoreceptor outer segment
damage in multiple evanescent white dot syndrome.
Ophthalmology 116:762–770
140. Forooghian F, Stetson PF, Gross NE, Meyerle CB (2010)
Quantitative assessment of photoreceptor recovery in atypi-
cal multiple evanescent white dot syndrome. Ophthalmic
Surg Lasers Imaging 41:S77–S80. doi:10.3928/1542
8877-20101031-06
141. Hua R, Chen K, Liu LM et al (2012) Multi-modality
imaging on multiple evanescent white dot syndrome-a
Spectralis study. Int J Ophthalmol 5:644–647
142. Sikorski BL, Wojtkowski M, Kaluzny JJ et al (2008)
Correlation of spectral optical coherence tomography with
fluorescein and indocyanine green angiography in multiple
evanescent white dot syndrome. Br J Ophthalmol 92:
1552–1557
Int Ophthalmol (2014) 34:401–435 433
123
143. Hangai M, Fujimoto M, Yoshimura N (2009) Features and
function of multiple evanescent white dot syndrome. Arch
Ophthalmol 127:1307–1313
144. Aoyagi R, Hayashi T, Masai A et al (2012) Subfoveal
choroidal thickness in multiple evanescent white dot syn-
drome. Clin Exp Optom 95:212–217
145. Amin HI (2006) Optical coherence tomography findings in
multiple evanescent white dot syndrome. Retina 26:483–
484
146. Yasuno Y, Okamoto F, Kawana K et al (2009) Investiga-
tion of multifocal choroiditis with panuveitis by three-
dimensional high-penetration optical coherence tomogra-
phy. J Biophotonics 2:435–441
147. Rao VG, Rao GS, Narkhede NS (2011) Flare up of cho-
roiditis and choroidal neovasculazation associated with
punctate inner choroidopathy during early pregnancy.
Indian J Ophthalmol 59:145–148
148. Chan WM, Lai TY, Liu DT, Lam DS (2007) Intravitreal
bevacizumab (avastin) for choroidal neovascularization
secondary to central serous chorioretinopathy, secondary
to punctate inner choroidopathy, or of idiopathic origin.
Am J Ophthalmol 143:977–983
149. Stepien KE, Carroll J (2011) Using spectral-domain opti-
cal coherence tomography to follow outer retinal structure
changes in a patient with recurrent punctate inner chor-
oidopathy. J Ophthalmol 2011:753741
150. van Velthoven ME, Ongkosuwito JV, Verbraak FD et al
(2006) Combined en-face optical coherence tomography
and confocal ophthalmoscopy findings in active multifocal
and serpiginous chorioretinitis. Am J Ophthalmol 141:
972–975
151. Vance SK, Khan S, Klancnik JM, Freund KB (2011)
Characteristic spectral-domain optical coherence tomog-
raphy findings of multifocal choroiditis. Retina 31:717–
723
152. Kotsolis AI, Killian FA, Ladas ID, Yannuzzi LA (2010)
Fluorescein angiography and optical coherence tomography
concordance for choroidal neovascularisation in multifocal
choroidtis. Br J Ophthalmol 94:1506–1508
153. Zolf R, Glacet-Bernard A, Benhamou N et al (2002)
Imaging analysis with optical coherence tomography:
relevance for submacular surgery in high myopia and in
multifocal choroiditis. Retina 22:192–201
154. Punjabi OS, Rich R, Davis JL et al (2008) Imaging ser-
piginous choroidopathy with spectral domain optical
coherence tomography. Ophthalmic Surg Lasers Imaging
39(4Suppl):S95–S98
155. Arantes TE, Matos K, Garcia CR et al (2011) Fundus
autofluorescence and spectral domain optical coherence
tomography in recurrent serpiginous choroiditis: case
report. Ocul Immunol Inflamm 19:39–41
156. Witkin AJ, Duker JS, Ko TH et al (2005) Ultrahigh reso-
lution optical coherence tomography of birdshot reti-
nochoroidopathy. Br J Ophthalmol 89:1660–1661
157. Monnet D, Levinson RD, Holland GN et al (2007) Lon-
gitudinal cohort study of patients with birdshot chorioret-
inopathy. III. Macular imaging at baseline. Am J
Ophthalmol 144:818–828
158. Birch DG, Williams PD, Callanan D et al (2010) Macular
atrophy in birdshot retinochoroidopathy: an optical
coherence tomography and multifocal electroretinography
analysis. Retina 30:930–937
159. Forooghian F, Gulati N, Jabs DA (2010) Restoration of
retinal architecture following systemic immunosuppres-
sion in birdshot chorioretinopathy. Ocul Immunol Inflamm
18:470–471
160. Iaccarino G, Cennamo G, Forte R, Cennamo G (2009)
Evaluation of posterior pole with echography and optical
coherence tomography in patients with Behcet’s disease.
Ophthalmologica 223:250–255
161. Atmaca LS, Batioglu F, Muftuoglu O (2003) Fluorescein
angiography and optical coherence tomography in ocular
Behcet’s disease. A preliminary study. Adv Exp Med Biol
528:355–360
162. Takeuchi M, Iwasaki T, Kezuka T et al (2010) Functional
and morphological changes in the eyes of Behcet’s patients
with uveitis. Acta Ophthalmol 88:257–262
163. Unoki N, Nishijima K, Kita M et al (2010) Structural
changes of fovea during remission of Behcet’s disease as
imaged by spectral domain optical coherence tomography.
Eye (Lond) 24:969–975
164. Sheets CW, Grewal DS, Greenfield DS (2009) Ocular
toxoplasmosis presenting with focal retinal nerve fiber
atrophy simulating glaucoma. J Glaucoma 18:129–131
165. Orefice JL, Costa RA, Orefice F et al (2007) Vitreoretinal
morphology in active ocular toxoplasmosis: a prospective
study by optical coherence tomography. Br J Ophthalmol
91:773–780
166. Orefice JL, Costa RA, Campos W et al (2006) Third-gen-
eration optical coherence tomography findings in punctate
retinal toxoplasmosis. Am J Ophthalmol 142:503–505
167. de Souza EC, Casella AM (2009) Clinical and tomo-
graphic features of macular punctate outer retinal toxo-
plasmosis. Arch Ophthalmol 127:1390–1394
168. Guagnini AP, De Potter P, Levecq L, Kozyreff A (2007)
Atypical spherical deposition on vitreoretinal interface
associated with toxoplasmic chorioretinitis. Graefes Arch
Clin Exp Ophthalmol 245:158–160
169. Garg S, Mets MB, Bearelly S, Mets R (2009) Imaging of
congenital toxoplasmosis macular scars with optical
coherence tomography. Retina 29:631–637
170. Monnet D, Averous K, Delair E, Brezin AP (2009) Optical
coherence tomography in ocular toxoplasmosis. Int J Med
Sci 6:137–138
171. Diniz B, Regatieri C, Andrade R, Maia A (2011) Evalua-
tion of spectral domain and time domain optical coherence
tomography findings in toxoplasmic retinochoroiditis.
Clin Ophthalmol 5:645–650
172. Gallagher MJ, Yilmaz T, Cervantes-Castaneda RA, Foster
CS (2007) The characteristic features of optical coherence
tomography in posterior uveitis. Br J Ophthalmol
91:1680–1685
173. Salman A, Parmar P, Rajamohan M et al (2006) Optical
coherence tomography in choroidal tuberculosis. Am J
Ophthalmol 142:170–172
174. Mahendradas P, Avadhani K, Yadav NK et al (2010) Role
of Spectralis HRA ? OCT spectral domain optical
coherence tomography in the diagnosis and management
of fungal choroidal granuloma. Ocul Immunol Inflamm
18:408–410
434 Int Ophthalmol (2014) 34:401–435
123

175. Kozak I, Bartsch DU, Cheng L, Freeman WR (2006)
In vivo histology of cotton-wool spots using high-resolu-
tion optical coherence tomography. Am J Ophthalmol
141:748–750
176. Kozak I, Bartsch DU, Cheng L, Freeman WR (2007)
Hyperreflective sign in resolved cotton wool spots using
high-resolution optical coherence tomography and optical
coherence tomography ophthalmoscopy. Ophthalmology
114:537–543
177. Gomez ML, Mojana F, Bartsch DU, Freeman WR (2009)
Imaging of long-term retinal damage after resolved cotton
wool spots. Ophthalmology 116:2407–2414
178. Mahendradas P, Avadhani K, Yadav NK et al (2011) High-
definition spectral-domain optical coherence tomography
of intravitreal and subretinal cysticercus cysts in intraoc-
ular cysticercosis. Retina 31:2132–2133
179. Meira-Freitas D, Farah ME, Hofling-Lima AL, Aggio FB
(2009) Optical coherence tomography and indocyanine
green angiography findings in acute syphilitic posterior
placoid choroidopathy: case report. Arq Bras Oftalmol
72:832–835
180. Joseph A, Rogers S, Browning A et al (2007) Syphilitic
acute posterior placoid chorioretinitis in nonimmuno-
compromised patients. Eye (Lond) 21:1114–1119
181. Eandi CM, Neri P, Adelman RA et al (2012) On behalf of
International syphilis study group. Acute syphilitic pos-
terior placoid chorioretinitis: report of a case series and
comprehensive review of the literature. Retina 32:1915–
1941
182. Pichi F, Ciardella AP, Cunningham ET, et al (2013).
Spectral domain optical coherence tomography findings in
patients with acute syphilitic posterior placoid chorioreti-
nopathy. Retina (in press)
183. Aggio FB, Farah ME, Meirelles RL, de Souza EC (2006)
STRATUS OCT and multifocal ERG in unilateral acute
idiopathic maculopathy. Graefes Arch Clin Exp Ophthal-
mol 244:510–516
Int Ophthalmol (2014) 34:401–435 435
123