opt plus form 4. regional consolidation sheet of …opt plus form 4. regional consolidation sheet of...
TRANSCRIPT

OPT Plus Form 4. Regional Consolidation Sheet of Operation Timbang Plus Results
Revised February 2012 Page 1 of 4
Region Central Visayas (R7) Total No.: Province ___4__ City ___16____ Year __2015___________
Total No.with OPT Plus Results: Province _______City ______ Indigenous Group/s: ___________________
Number of Indigenous PS measured: 0-59 mos old ______ 0-71 mos old _______
Please Check:
Estimated No. Total No of
of 0-71 mos old 0-71 mos old Coverage
PS PS measured Boys Girls Boys Girls Boys Girls Boys Girls Boys Girls Boys Girls Boys Girls
(1) (2) (3) (4) (5) (6) (7) (8) (9) (10) (11) (12) (13) (14) (15) (16) (17)
Provinces
Bohol 213,321 145467 68% 6191 5755 5657 5313 11981 10987 12206 11201 12437 11410 12528 11273 11219 10278 138436
Cebu 325,829 272445 84% 10494 9809 10621 9876 21218 20037 21931 20049 22430 20325 22100 20567 20890 18994 249341
Oriental Negros 222,407 110054 49% 4384 4194 4254 4065 8636 8105 8654 8496 8616 8162 8667 8175 8539 8397 101344
Siquijor 15,579 9324 60% 285 305 334 330 732 735 756 748 826 749 795 733 717 676 8721
Subtotal 777,136 537290 69% 21354 20063 20866 19584 42567 39864 43547 40494 44309 40646 44090 40748 41365 38345 497842
Cities 0
Bais City 12,652 9709 77% 414 375 371 340 718 769 708 680 739 710 749 719 650 624 8566
Bayawan City 19,568 14032 72% 660 661 562 570 1036 1089 1120 1107 1114 1066 1158 1022 994 864 13023
Bogo City 11,525 11298 98% 458 414 424 366 964 888 977 947 999 876 1039 944 885 794 10975
Carcar City 18,578 16038 86% 694 636 634 617 1314 1195 1374 1211 1338 1232 1317 1215 1117 1059 14953
Canlaon City 8,534 7380 86% 238 221 260 256 581 547 665 641 712 648 575 573 600 570 7087
Cebu City 158,541 150196 95% 6,624 6,347 5,829 5,546 11,748 11,025 12,280 11,276 12,161 11,120 12,117 11,111 13,650 12,915 143749
Danao City 20,679 18854 91% 759 724 690 694 1619 1523 1625 1478 1607 1503 1575 1463 1365 1265 17890
Dumaguete City 21,273 15674 74% 498 443 656 582 1318 1187 1414 1217 1374 1287 1397 1239 1276 1302 15190
Guihulngan City 15,936 14083 88% 647 613 601 577 995 964 998 996 1028 987 1019 1005 1076 1031 12537
Lapu-lapu City 74,626 73520 99% 3392 3348 3012 2787 6394 5892 6571 6178 6025 5255 6043 5535 6130 5876 72438
Mandaue City 62,456 46931 75% 2256 2358 1835 1818 4035 3685 4010 3841 3799 3640 3949 3644 3352 3428 45650
Naga City 18,055 15739 87% 616 526 667 625 1355 1200 1330 1216 1336 1217 1346 1274 1210 1122 15040
Tagbilaran City 17,454 11606 66% 526 497 458 435 1002 925 1026 957 990 932 961 813 820 818 11160
Talisay City 36,963 33745 91% 1354 1253 1377 1269 2765 2483 2646 2549 2741 2646 2880 2595 3091 2942 32591
Tanjay City 13,582 9253 68% 442 391 412 341 676 673 753 714 752 724 771 664 758 683 8754
Toledo City 26,114 25347 97% 1211 1240 1163 1177 1829 2020 1934 1768 1990 1840 2297 2077 2186 1953 24685
Subtotal 536,536 473405 88% 20789 20047 18951 18000 38349 36065 39431 36776 38705 35683 39193 35893 39160 37246 454288
Total 1,313,672 1010695 77% 42143 40110 39817 37584 80916 75929 82978 77270 83014 76329 83283 76641 80525 75591 952130
82253 77401 156845 160248 159343 159924 156116
8.64% 8.13% 16.47% 16.83% 16.74% 16.80% 16.40%
Prepared by: Validated by: SUSAN Y. ORPILLA Approved by: PAROLITA A. MISSION, DPA. RN.
Nutrition Officer III, NNC Regional Nutrition Program Coordinator
%
Province/CityTotal Number of Children
0-5 months 6-11 months 12-23 months 24-35 months 36-47 months 48-59 months 60-71 months
Republic of the Philippines
Department of Health
NATIONAL NUTRITION COUNCIL
Normal Weight-for-Age Normal Length/Height-for-Age Normal Weight-for-Length/Height
NASUDI G. SOLUTA
Nutrition Officer II- NNC 7

OPT Plus Form 4. Regional Consolidation Sheet of Operation Timbang Plus Results
Revised February 2012 Page 2 of 4
Region Central Visayas (R7) Total No.: Province ___4__ City ___16____ Year __2015___________
Total No.with OPT Plus Results: Province _______City ______ Indigenous Group/s: ___________________
Number of Indigenous PS measured: 0-59 mos old ______ 0-71 mos old _______
Estimated No. Total No of
of 0-71 mos old 0-71 mos old Coverage
PS PS measured Boys Girls Boys Girls Boys Girls Boys Girls Boys Girls Boys Girls Boys Girls
(1) (2) (3) (4) (5) (6) (7) (8) (9) (10) (11) (12) (13) (14) (15) (16) (17)
Provinces
Bohol 213,321 145467 68% 67 51 138 108 490 341 500 508 530 558 542 567 553 501 5454
Cebu 325,829 272445 84% 279 193 425 341 1408 1070 1491 1312 1582 1528 1582 1508 1558 1521 15798
Oriental Negros 222,407 110054 49% 86 69 192 138 540 425 597 547 604 575 550 585 657 612 6177
Siquijor 15,579 9324 60% 2 2 5 8 35 28 45 37 50 46 43 41 37 55 434
Subtotal 777,136 537290 69% 434 315 760 595 2473 1864 2633 2404 2766 2707 2717 2701 2805 2689 27863
Cities 0 0
Bais City 12,652 9709 77% 4 9 31 12 50 26 57 64 71 61 62 71 83 76 677
Bayawan City 19,568 14032 72% 14 13 26 9 59 58 60 69 62 79 70 76 63 61 719
Bogo City 11,525 11298 98% 5 1 8 2 22 8 20 17 33 24 28 22 26 25 241
Carcar City 18,578 16038 86% 10 5 13 15 55 39 70 57 51 69 65 74 59 79 661
Canlaon City 8,534 7380 86% 1 2 4 3 17 13 26 17 19 20 25 21 26 24 218
Cebu City 158,541 150196 95% 88 64 115 83 347 308 371 373 378 389 372 397 381 377 4043
Danao City 20,679 18854 91% 12 9 27 14 64 62 80 86 69 60 80 71 64 65 763
Dumaguete City 21,273 15674 74% 4 0 11 13 66 49 51 52 17 28 23 15 11 11 351
Guihulngan City 15,936 14083 88% 36 13 24 20 90 74 117 108 99 120 113 110 110 131 1165
Lapu-lapu City 74,626 73520 99% 18 16 23 20 58 54 75 71 44 72 54 62 41 49 657
Mandaue City 62,456 46931 75% 12 8 12 18 53 63 71 73 68 79 103 82 75 76 793
Naga City 18,055 15739 87% 4 6 23 7 42 32 55 52 58 53 34 38 48 46 498
Tagbilaran City 17,454 11606 66% 2 7 8 5 21 18 25 30 19 22 21 34 33 34 279
Talisay City 36,963 33745 91% 10 5 13 7 43 28 37 50 78 49 54 58 66 58 556
Tanjay City 13,582 9253 68% 2 1 14 6 28 27 31 28 26 41 25 43 25 34 331
Toledo City 26,114 25347 97% 7 6 15 11 39 18 35 38 41 52 44 52 33 34 425
Subtotal 536,536 473405 88% 229 165 367 245 1054 877 1181 1185 1133 1218 1173 1226 1144 1180 12377
Total 1,313,672 1010695 77% 663 480 1127 840 3527 2741 3814 3589 3899 3925 3890 3927 3949 3869 40240
1143 1967 6268 7403 7824 7817 7818
2.84% 4.89% 15.58% 18.40% 19.44% 19.43% 19.43%
Prepared by: Validated by: SUSAN Y. ORPILLA Approved by: PAROLITA A. MISSION, DPA. RN.
Nutrition Officer III, NNC Regional Nutrition Program Coordinator
%
60-71 monthsProvince/CityTotal Number of Children
0-5 months 6-11 months 12-23 months 24-35 months 36-47 months 48-59 months
Underweight Weight-for-Age Stunted Length/Height-for-Age Wasted Weight-for-Length/Height
NASUDI G. SOLUTA
Nutrition Officer II- NNC 7

OPT Plus Form 4. Regional Consolidation Sheet of Operation Timbang Plus Results
Revised February 2012 Page 3 of 4
Region Central Visayas (R7) Total No.: Province ___4__ City ___16____ Year __2015___________
Total No.with OPT Plus Results: Province _______City ______ Indigenous Group/s: ___________________
Number of Indigenous PS measured: 0-59 mos old ______ 0-71 mos old _______
Estimated No. Total No of
of 0-71 mos old 0-71 mos old Coverage
PS PS measured Boys Girls Boys Girls Boys Girls Boys Girls Boys Girls Boys Girls Boys Girls
(1) (2) (3) (4) (5) (6) (7) (8) (9) (10) (11) (12) (13) (14) (15) (16) (17)
Provinces
Bohol 213,321 145467 68% 23 14 35 24 89 57 84 81 73 84 69 73 74 66 846
Cebu 325,829 272445 84% 135 111 125 105 412 298 397 337 396 383 353 338 311 329 4030
Oriental Negros 222,407 110054 49% 24 34 48 37 146 121 164 131 129 132 112 126 144 122 1470
Siquijor 15,579 9324 60% 1 2 3 0 7 2 4 8 5 2 7 4 7 9 61
Subtotal 777,136 537290 69% 183 161 211 166 654 478 649 557 603 601 541 541 536 526 6407
Cities 0 0
Bais City 12,652 9709 77% 5 2 12 8 23 9 20 17 36 20 26 17 22 20 237
Bayawan City 19,568 14032 72% 3 7 8 3 11 12 20 12 26 20 14 14 15 13 178
Bogo City 11,525 11298 98% 2 0 2 0 2 3 3 1 6 3 1 2 2 2 29
Carcar City 18,578 16038 86% 9 3 10 7 30 17 21 17 17 27 29 13 13 22 235
Canlaon City 8,534 7380 86% 1 0 2 0 5 3 7 5 3 4 4 7 9 7 57
Cebu City 158,541 150196 95% 33 29 24 20 92 65 79 95 82 81 72 76 71 97 916
Danao City 20,679 18854 91% 0 0 5 7 7 7 5 13 5 8 7 6 6 8 84
Dumaguete City 21,273 15674 74% 0 0 0 0 3 0 0 1 0 0 0 0 1 0 5
Guihulngan City 15,936 14083 88% 10 7 15 10 23 23 27 32 26 31 12 25 25 18 284
Lapu-lapu City 74,626 73520 99% 8 5 3 4 13 15 15 22 19 23 16 18 7 8 176
Mandaue City 62,456 46931 75% 4 6 6 6 12 23 31 16 22 11 33 16 17 14 217
Naga City 18,055 15739 87% 1 2 3 5 6 9 5 7 6 11 11 18 7 8 99
Tagbilaran City 17,454 11606 66% 3 1 2 0 3 2 1 5 6 5 3 7 2 5 45
Talisay City 36,963 33745 91% 5 2 6 2 18 12 12 11 21 20 21 27 17 22 196
Tanjay City 13,582 9253 68% 3 1 4 4 9 7 9 8 10 7 4 1 5 3 75
Toledo City 26,114 25347 97% 3 6 9 10 26 19 30 16 16 12 11 9 6 6 179
Subtotal 536,536 473405 88% 90 71 111 86 283 226 285 278 301 283 264 256 225 253 3012
Total 1,313,672 1010695 77% 273 232 322 252 937 704 934 835 904 884 805 797 761 779 9419
505 574 1641 1769 1788 1602 1540
5.36% 6.09% 17.42% 18.78% 18.98% 17.01% 16.35%
Prepared by: Validated by: SUSAN Y. ORPILLA Approved by: PAROLITA A. MISSION, DPA. RN.
Nutrition Officer III, NNC Regional Nutrition Program Coordinator
%
48-59 months 60-71 months0-5 monthsProvince/CityTotal Number of Children
6-11 months 12-23 months 24-35 months 36-47 months
Sev. UW Weight-for-Age Sev. Stunted Length/Height-for-Age Sev. Wasted Weight-for-Length/Height
NASUDI G. SOLUTA
Nutrition Officer II- NNC 7

OPT Plus Form 4. Regional Consolidation Sheet of Operation Timbang Plus Results
Revised February 2012 Page 4 of 4
Region Central Visayas (R7) Total No.: Province ___4__ City ___16____ Year __2015___________
Total No.with OPT Plus Results: Province _______City ______ Indigenous Group/s: ___________________
Number of Indigenous PS measured: 0-59 mos old ______ 0-71 mos old _______
Estimated No. Total No of
of 0-71 mos old 0-71 mos old Coverage
PS PS measured Boys Girls Boys Girls Boys Girls Boys Girls Boys Girls Boys Girls Boys Girls
(1) (2) (3) (4) (5) (6) (7) (8) (9) (10) (11) (12) (13) (14) (15) (16) (17)
Provinces
Bohol 213,321 145467 68% 94 65 25 20 59 41 58 45 51 34 83 39 76 41 731
Cebu 325,829 272445 84% 419 321 219 176 340 256 260 193 222 146 239 151 193 141 3276
Oriental Negros 222,407 110054 49% 168 164 68 69 98 69 58 55 54 44 71 48 56 41 1063
Siquijor 15,579 9324 60% 8 5 4 6 8 5 10 8 15 5 9 10 8 7 108
Subtotal 777,136 537290 69% 689 555 316 271 505 371 386 301 342 229 402 248 333 230 5178
Cities 0 0
Bais City 12,652 9709 77% 38 30 13 17 26 20 15 13 12 12 11 9 8 5 229
Bayawan City 19,568 14032 72% 23 24 7 2 10 5 3 8 8 2 7 7 3 3 112
Bogo City 11,525 11298 98% 13 4 1 2 1 1 4 4 2 2 6 4 6 3 53
Carcar City 18,578 16038 86% 38 18 4 10 24 15 15 10 16 5 9 6 8 11 189
Canlaon City 8,534 7380 86% 0 2 1 0 0 0 1 2 1 1 2 1 3 4 18
Cebu City 158,541 150196 95% 138 99 68 56 143 135 129 108 129 89 118 70 134 72 1488
Danao City 20,679 18854 91% 17 9 8 5 10 7 9 6 9 5 14 3 6 9 117
Dumaguete City 21,273 15674 74% 18 14 4 5 12 7 9 6 8 6 11 9 14 5 128
Guihulngan City 15,936 14083 88% 16 7 7 5 5 10 8 6 4 5 4 4 9 7 97
Lapu-lapu City 74,626 73520 99% 45 56 11 11 15 18 23 15 11 16 9 10 4 5 249
Mandaue City 62,456 46931 75% 39 47 15 8 24 13 20 14 16 13 14 13 23 12 271
Naga City 18,055 15739 87% 8 6 3 7 12 12 10 9 7 4 8 6 9 1 102
Tagbilaran City 17,454 11606 66% 7 3 7 2 13 8 15 7 12 7 13 3 20 5 122
Talisay City 36,963 33745 91% 31 24 23 18 37 29 26 25 38 34 37 24 34 22 402
Tanjay City 13,582 9253 68% 6 1 6 0 8 5 10 6 18 8 8 6 6 5 93
Toledo City 26,114 25347 97% 12 12 2 5 3 4 0 3 3 5 3 2 4 0 58
Subtotal 536,536 473405 88% 449 356 180 153 343 289 297 242 294 214 274 177 291 169 3728
Total 1,313,672 1010695 77% 1138 911 496 424 848 660 683 543 636 443 676 425 624 399 8906
2049 920 1508 1226 1079 1101 1023
23.01% 10.33% 16.93% 13.77% 12.12% 12.36% 11.49%
Prepared by: Validated by: SUSAN Y. ORPILLA Approved by: PAROLITA A. MISSION, DPA. RN.
Nutrition Officer III, NNC Regional Nutrition Program Coordinator
36-47 months 48-59 months 60-71 months
%
0-5 months 6-11 months 12-23 months 24-35 months
Please check: Overweight Weight-for-Age Tall Length/Height-for-Age Overweight Weight-for-Length1/
/Height2/
Obese Weight-for-Length1/
/Height2/
Province/CityTotal Number of Children
NASUDI G. SOLUTA
Nutrition Officer II- NNC 7

OPT Plus Form 4. Regional Consolidation Sheet of Operation Timbang Plus Results
Revised February 2012 Page 1 of 4
Region Central Visayas (R7) Total No.: Province ___4__ City ___16____ Year __2014___________
Total No.with OPT Plus Results: Province _______City ______ Indigenous Group/s: ___________________
Number of Indigenous PS measured: 0-59 mos old ______ 0-71 mos old _______
Please Check:
Estimated No. Total No of
of 0-71 mos old 0-71 mos old Coverage
PS PS measured Boys Girls Boys Girls Boys Girls Boys Girls Boys Girls Boys Girls Boys Girls
(1) (2) (3) (4) (5) (6) (7) (8) (9) (10) (11) (12) (13) (14) (15) (16) (17)
Provinces
Bohol 213,321 145321 68% 5,742 5,384 5,091 5,039 10,266 9,651 10,940 10,668 10,762 9,941 11,070 9,896 9,763 9,114 123327
Cebu 325,829 223779 69% 7933 7384 7697 7294 14809 14239 15310 14029 15532 14107 15792 14475 14694 13574 176869
Oriental Negros 222,407 103742 47% 3676 3533 3396 3406 6651 6501 6899 6873 6955 6682 7135 6707 7129 6994 82537
Siquijor 15,579 9324 60% 263 272 294 294 630 636 667 669 729 662 716 650 646 631 7759
Subtotal 777,136 482166 62% 17,614 16,573 16,478 16,033 32,356 31,027 33,816 32,239 33,978 31,392 34,713 31,728 32,232 30,313 390492
Cities 0
Bais City 12,652 9709 77% 287 282 281 245 477 560 484 504 541 537 589 592 504 482 6365
Bayawan City 19,568 12639 65% 540 563 461 447 762 775 756 747 796 725 803 687 731 658 9451
Bogo City 11,525 11298 98% 440 386 410 353 835 814 888 841 903 787 955 866 801 735 10014
Carcar City 18,578 16185 87% 631 594 555 550 1084 1062 1152 1016 1114 1019 1114 1020 971 932 12814
Canlaon City 8,534 7380 86% 218 217 227 225 502 418 566 577 582 517 479 521 501 497 6047
Cebu City 158,541 142158 90% 6181 5708 5225 4934 10294 9804 10983 9999 10757 9888 10858 9948 12055 11320 127954
Danao City 20,679 18566 90% 715 675 630 643 1421 1354 1420 1289 1403 1291 1370 1280 1126 1129 15746
Dumaguete City 21,273 15673 74% 467 429 613 560 1269 1163 1366 1180 1331 1255 1363 1217 1238 1268 14719
Guihulngan City 15,936 14083 88% 582 544 505 500 721 777 768 779 749 750 766 788 851 842 9922
Lapu-lapu City 74,626 73520 99% 3312 3292 2944 2732 6215 5729 6417 5948 5860 5094 5896 5355 5995 5742 70531
Mandaue City 62,456 46259 74% 2193 2211 1752 1809 3679 3440 3851 3678 3657 3517 3842 3478 2988 2912 43007
Naga City 18,055 15504 86% 575 485 610 583 1223 1110 1170 1103 1213 1085 1213 1126 1142 1033 13671
Tagbilaran City 17,454 11121 64% 459 453 398 392 844 801 881 829 875 835 851 706 725 735 9784
Talisay City 36,963 33745 91% 1217 1146 1248 1171 2400 2197 2347 2266 2477 2387 2591 2295 2766 2651 29159
Tanjay City 13,582 9253 68% 445 379 408 315 635 644 717 677 731 696 733 637 729 666 8412
Toledo City 26,114 16215 62% 740 768 697 743 1222 1255 1168 1090 1157 1102 1237 1140 1099 993 14411
Subtotal 536,536 453308 84% 19002 18132 16964 16202 33583 31903 34934 32523 34146 31485 34660 31656 34222 32595 402007
Total 1,313,672 935474 71% 36616 34705 33442 32235 65939 62930 68750 64762 68124 62877 69373 63384 66454 62908 792499
71321 65677 128869 133512 131001 132757 129362
9.00% 8.29% 16.26% 16.85% 16.53% 16.75% 16.32%
Prepared by: Validated by: SUSAN Y. ORPILLA Approved by: PAROLITA A. MISSION, DPA. RN.
Nutrition Officer III, NNC Regional Nutrition Program Coordinator
Republic of the Philippines
Department of Health
0-5 months 6-11 months 12-23 months 24-35 months 36-47 months 48-59 months
NATIONAL NUTRITION COUNCIL
Normal Weight-for-Age Normal Length/Height-for-Age Normal Weight-for-Length/Height
Province/City
Total Number of Children
60-71 months
%
NASUDI G. SOLUTA
Nutrition Officer II- NNC 7

OPT Plus Form 4. Regional Consolidation Sheet of Operation Timbang Plus Results
Revised February 2012 Page 2 of 4
Region ____________________ Total No.: Province ______ City _______ Period of Weighing _____________
Total No.with OPT Plus Results: Province _______City ______ Indigenous group & No of PS: ___________________
Please Check: Number of Indigenous PS measured: 0-59 mos old ______ 0-71 mos old _______
Estimated No. Total No of
of 0-71 mos old 0-71 mos old Coverage
PS PS measured Boys Girls Boys Girls Boys Girls Boys Girls Boys Girls Boys Girls Boys Girls
(1) (2) (3) (4) (5) (6) (7) (8) (9) (10) (11) (12) (13) (14) (15) (16) (17)
Provinces
Bohol 213,321 145321 68% 301 232 391 302 1477 1040 1402 1305 1639 1469 1499 1461 1508 1220 15246
Cebu 325,829 223779 69% 606 527 840 692 2619 2092 2697 2423 3013 2723 2877 2786 2616 2384 28895
Oriental Negros 222,407 103742 47% 305 239 392 321 1124 958 1287 1155 1287 1175 1225 1197 1307 1149 13121
Siquijor 15,579 9324 60% 10 15 31 26 86 96 106 93 133 106 104 107 106 96 1115
Subtotal 777,136 482166 62% 1,222 1,013 1,654 1,341 5,306 4,186 5,492 4,976 6,072 5,473 5,705 5,551 5,537 4,849 58377
Cities 0
Bais City 12,652 9709 77% 40 34 42 32 133 98 167 140 182 157 169 147 161 184 1686
Bayawan City 19,568 12639 65% 51 38 54 46 186 153 201 192 232 247 212 201 182 170 2165
Bogo City 11,525 11298 98% 15 7 15 12 98 65 94 101 106 99 98 76 106 76 968
Carcar City 18,578 16185 87% 46 27 58 53 203 140 211 174 292 208 219 192 187 160 2170
Canlaon City 8,534 7380 86% 24 11 29 14 86 62 108 81 117 85 103 79 85 87 971
Cebu City 158,541 142158 90% 242 171 270 253 871 728 922 860 942 860 922 922 933 1392 10288
Danao City 20,679 18566 90% 26 23 58 42 168 159 190 177 187 182 218 194 240 159 2023
Dumaguete City 21,273 15673 74% 14 5 28 12 85 49 78 60 46 50 55 37 53 39 611
Guihulngan City 15,936 14083 88% 65 56 78 66 212 163 208 220 245 230 240 232 239 224 2478
Lapu-lapu City 74,626 73520 99% 72 39 56 55 156 157 160 207 183 192 154 190 147 143 1911
Mandaue City 62,456 46259 74% 83 43 69 97 153 143 182 175 192 177 174 168 269 205 2130
Naga City 18,055 15504 86% 31 19 41 25 85 70 136 88 119 113 103 116 98 93 1137
Tagbilaran City 17,454 11121 64% 35 13 21 19 81 78 80 75 71 77 77 72 67 58 824
Talisay City 36,963 33745 91% 93 69 100 61 248 216 219 224 252 228 256 265 271 248 2750
Tanjay City 13,582 9253 68% 4 4 17 22 52 42 60 55 53 59 48 54 46 50 566
Toledo City 26,114 16215 62% 17 12 40 24 82 66 122 101 133 100 114 124 116 120 1171
Subtotal 536,536 453308 84% 858 571 976 833 2899 2389 3138 2930 3352 3064 3162 3069 3200 3408 33849
Total 1,313,672 935474 71% 2080 1584 2630 2174 8205 6575 8630 7906 9424 8537 8867 8620 8737 8257 92226
3664 4804 14780 16536 17961 17487 16994
3.97% 5.21% 16.03% 17.93% 19.47% 18.96% 18.43%
Prepared by: Validated by: SUSAN Y. ORPILLA Approved by: PAROLITA A. MISSION, DPA. RN.
Nutrition Officer III, NNC Regional Nutrition Program Coordinator
Underweight Weight-for-Age Stunted Length/Height-for-Age Wasted Weight-for-Length/Height
Province/City
Total Number of Children
0-5 months 6-11 months 12-23 months
%
24-35 months 36-47 months 48-59 months 60-71 months
NASUDI G. SOLUTA
Nutrition Officer II- NNC 7

OPT Plus Form 4. Regional Consolidation Sheet of Operation Timbang Plus Results
Revised February 2012 Page 3 of 4
Region ____________________ Total No.: Province ______ City _______ Period of Weighing _____________
Total No.with OPT Plus Results: Province _______City ______ Indigenous group & No of PS: ___________________
Please Check: Number of Indigenous PS measured: 0-59 mos old ______ 0-71 mos old _______
Estimated No. Total No of
of 0-71 mos old 0-71 mos old Coverage
PS PS measured Boys Girls Boys Girls Boys Girls Boys Girls Boys Girls Boys Girls Boys Girls
(1) (2) (3) (4) (5) (6) (7) (8) (9) (10) (11) (12) (13) (14) (15) (16) (17)
Provinces
Bohol 213,321 145321 68% 112 106 154 130 586 418 562 467 496 463 505 424 388 308 5119
Cebu 325,829 223779 69% 399 312 520 352 1728 1267 1602 1348 1331 1300 1249 1147 1020 870 14445
Oriental Negros 222,407 103742 47% 156 154 230 198 740 615 715 642 606 596 590 474 551 381 6648
Siquijor 15,579 9324 60% 10 14 14 15 39 26 37 29 32 33 28 30 18 16 341
Subtotal 777,136 482166 62% 677 586 918 695 3,093 2,326 2,916 2,486 2,465 2,392 2,372 2,075 1,977 1,575 26553
Cities 0 0
Bais City 12,652 9709 77% 38 27 60 45 133 92 105 90 118 94 86 71 92 57 1108
Bayawan City 19,568 12639 65% 27 22 28 20 96 86 108 91 78 82 76 63 68 38 883
Bogo City 11,525 11298 98% 6 7 8 2 45 16 22 27 27 18 21 29 12 13 253
Carcar City 18,578 16185 87% 35 24 25 21 117 76 103 68 71 88 102 82 60 61 933
Canlaon City 8,534 7380 86% 6 0 18 0 36 0 45 32 43 34 45 23 43 20 345
Cebu City 158,541 142158 90% 67 46 61 47 202 163 202 187 141 156 149 152 138 107 1818
Danao City 20,679 18566 90% 12 9 17 16 67 52 69 74 62 60 62 57 50 33 640
Dumaguete City 21,273 15673 74% 2 1 4 10 23 12 9 11 6 6 6 5 5 3 103
Guihulngan City 15,936 14083 88% 35 18 36 30 135 89 145 114 144 131 121 100 109 100 1307
Lapu-lapu City 74,626 73520 99% 18 20 22 13 74 57 64 67 63 60 61 64 33 47 663
Mandaue City 62,456 46259 74% 66 28 39 24 83 78 76 78 76 62 63 69 53 51 846
Naga City 18,055 15504 86% 15 6 19 13 42 33 57 40 34 38 34 32 36 33 432
Tagbilaran City 17,454 11121 64% 12 11 10 7 33 13 32 33 28 19 23 33 28 26 308
Talisay City 36,963 33745 91% 44 46 51 39 156 98 114 114 117 110 118 113 126 119 1365
Tanjay City 13,582 9253 68% 2 2 7 5 24 20 20 20 17 22 20 22 16 7 204
Toledo City 26,114 16215 62% 11 10 16 19 56 43 51 26 49 51 56 44 44 28 504
Subtotal 536,536 453308 84% 396 277 421 311 1322 928 1222 1072 1074 1031 1043 959 913 743 11712
Total 1,313,672 935474 71% 1073 863 1339 1006 4415 3254 4138 3558 3539 3423 3415 3034 2890 2318 38265
1936 2345 7669 7696 6962 6449 5208
5.06% 6.13% 20.04% 20.11% 18.19% 16.85% 13.61%
Prepared by: Validated by: SUSAN Y. ORPILLA Approved by: PAROLITA A. MISSION, DPA. RN.
Nutrition Officer III, NNC Regional Nutrition Program Coordinator
Sev. UW Weight-for-Age Sev. Stunted Length/Height-for-Age Sev. Wasted Weight-for-Length/Height
Province/City
Total Number of Children
%
0-5 months 6-11 months 12-23 months 24-35 months 36-47 months 48-59 months 60-71 months
NASUDI G. SOLUTA
Nutrition Officer II- NNC 7

OPT Plus Form 4. Regional Consolidation Sheet of Operation Timbang Plus Results
Revised February 2012 Page 4 of 4
Region ____________________ Total No.: Province ______ City _______ Period of Weighing _____________
Total No.with OPT Plus Results: Province _______City ______ Indigenous group & No of PS: ___________________
Number of Indigenous PS measured: 0-59 mos old ______ 0-71 mos old _______
Estimated No. Total No of
of 0-71 mos old 0-71 mos old Coverage
PS PS measured Boys Girls Boys Girls Boys Girls Boys Girls Boys Girls Boys Girls Boys Girls
(1) (2) (3) (4) (5) (6) (7) (8) (9) (10) (11) (12) (13) (14) (15) (16) (17)
Provinces
Bohol 213,321 145321 68% 223 171 121 104 174 134 159 124 84 73 73 72 68 49 1629
Cebu 325,829 223779 69% 421 455 272 246 456 394 312 243 171 161 137 91 108 103 3570
Oriental Negros 222,407 103742 47% 164 134 87 183 159 102 100 70 69 65 55 39 45 164 1436
Siquijor 15,579 9324 60% 13 13 7 9 23 14 7 9 1 2 6 1 3 1 109
Subtotal 777,136 482166 62% 821 773 487 542 812 644 578 446 325 301 271 203 224 317 6744
Cities 0 #DIV/0! 0
Bais City 12,652 9709 77% 96 73 44 55 76 72 44 40 17 15 4 6 6 2 550
Bayawan City 19,568 12639 65% 32 37 13 14 8 10 6 6 7 0 4 2 1 0 140
Bogo City 11,525 11298 98% 17 19 2 3 11 5 0 0 4 1 0 1 0 0 63
Carcar City 18,578 16185 87% 37 27 16 19 32 33 27 13 23 15 8 5 4 9 268
Canlaon City 8,534 7380 86% 0 1 0 2 3 3 1 2 1 1 0 1 1 1 17
Cebu City 158,541 142158 90% 214 242 140 137 231 221 205 159 126 99 82 68 97 77 2098
Danao City 20,679 18566 90% 29 32 12 5 18 19 13 14 6 2 3 1 1 2 157
Dumaguete City 21,273 15673 74% 37 22 26 18 22 19 21 25 16 10 7 4 5 8 240
Guihulngan City 15,936 14083 88% 27 22 28 16 45 42 29 29 19 32 21 24 21 21 376
Lapu-lapu City 74,626 73520 99% 54 59 33 25 39 49 39 36 20 20 12 17 7 5 415
Mandaue City 62,456 46259 74% 48 33 26 26 37 34 22 13 12 10 4 4 3 4 276
Naga City 18,055 15504 86% 12 16 16 16 26 31 17 26 20 17 13 11 27 16 264
Tagbilaran City 17,454 11121 64% 16 8 21 19 27 21 31 17 17 4 7 5 8 4 205
Talisay City 36,963 33745 91% 46 23 20 25 59 41 41 31 32 24 27 31 45 26 471
Tanjay City 13,582 9253 68% 2 9 4 9 10 6 6 4 5 3 7 1 3 2 71
Toledo City 26,114 16215 62% 21 21 13 12 13 16 11 5 3 2 3 6 1 2 129
Subtotal 536,536 453308 84% 688 644 414 401 657 622 513 420 328 255 202 187 230 179 5740
Total 1,313,672 935474 71% 1509 1417 901 943 1469 1266 1091 866 653 556 473 390 454 496 12484
2926 1844 2735 1957 1209 863 950
23.44% 14.77% 21.91% 15.68% 9.68% 6.91% 7.61%
Prepared by: Validated by: SUSAN Y. ORPILLA Approved by: PAROLITA A. MISSION, DPA. RN.
Nutrition Officer III, NNC Regional Nutrition Program Coordinator
Please check: Overweight Weight-for-Age Tall Length/Height-for-Age Overweight Weight-for-Length1/
/Height2/
Obese Weight-for-Length1/
/Height2/
0-5 monthsProvince/City
Total Number of Children
60-71 months
%
6-11 months 12-23 months 24-35 months 36-47 months 48-59 months
NASUDI G. SOLUTA
Nutrition Officer II- NNC 7

OPT Plus Form 4. Regional Consolidation Sheet of Operation Timbang Plus Results
Revised February 2012 Page 1 of 4
Region Central Visayas (R7) Total No.: Province ___4__ City ___16____ Year __2015___________
Total No.with OPT Plus Results: Province _______City ______ Indigenous Group/s: ___________________
Number of Indigenous PS measured: 0-59 mos old ______ 0-71 mos old _______
Please Check:
Estimated No. Total No of
of 0-71 mos old 0-71 mos old Coverage
PS PS measured Boys Girls Boys Girls Boys Girls Boys Girls Boys Girls Boys Girls Boys Girls
(1) (2) (3) (4) (5) (6) (7) (8) (9) (10) (11) (12) (13) (14) (15) (16) (17)
Provinces
Bohol 213,321 138341 65% 5853 5452 5473 5195 11814 10720 12192 11123 12455 11424 12428 11262 8109 7624 131124
Cebu 325,829 209649 64% 7621 7196 7849 7230 16116 15100 16990 15349 17366 15982 17542 16178 16214 14979 191712
Oriental Negros 222,407 100385 45% 3631 3535 3740 3556 8103 7481 8044 7884 8118 7766 8172 7852 6823 6781 91486
Siquijor 15,579 9324 60% 260 266 307 310 729 734 771 750 846 774 810 756 734 718 8765
Subtotal 777,136 457699 59% 17365 16449 17369 16291 36762 34035 37997 35106 38785 35946 38952 36048 31880 30102 423087
Cities 0 #DIV/0! 0
Bais City 12,652 8351 66% 330 294 345 294 677 697 686 666 721 718 739 729 64 47 7007
Bayawan City 19,568 12894 66% 523 519 490 487 928 925 1027 1009 1048 1021 1063 904 938 840 11722
Bogo City 11,525 11028 96% 448 395 418 364 967 882 979 955 1020 893 1054 693 904 816 10788
Carcar City 18,578 16102 87% 642 586 610 569 1275 1205 1381 1203 1324 1272 1321 1212 1123 1081 14804
Canlaon City 8,534 7384 87% 226 222 255 248 557 517 675 653 646 647 589 590 561 512 6898
Cebu City 158,541 141351 89% 6124 5748 5337 5031 10751 10230 11543 10568 11331 10494 11431 10577 12722 11815 133702
Danao City 20,679 18566 90% 692 674 665 668 1579 1499 1599 1475 1571 1478 1583 1471 1378 1280 17612
Dumaguete City 21,273 13283 62% 464 406 627 561 1286 1158 1394 1199 1334 1261 1364 1211 101 114 12480
Guihulngan City 15,936 14083 88% 607 564 577 564 999 964 1021 1045 1073 1059 1086 1088 1154 1114 12915
Lapu-lapu City 74,626 73520 99% 3327 3279 2986 2769 6355 5849 6552 6154 5997 5243 6020 5535 6107 5871 72044
Mandaue City 62,456 46403 74% 2220 2233 1797 1839 3932 3765 3895 3816 3789 3575 3816 3710 3308 3058 44753
Naga City 18,055 15657 87% 555 482 644 606 1309 1192 1310 1217 1349 1200 1304 1254 1206 1064 14692
Tagbilaran City 17,454 10800 62% 475 464 408 399 899 841 919 890 901 878 878 764 613 601 9930
Talisay City 36,963 33609 91% 1280 1164 1325 1211 2715 2435 2571 2506 2722 2619 2866 2593 3024 2881 31912
Tanjay City 13,582 7910 58% 422 374 404 335 654 659 741 704 754 735 781 686 85 79 7413
Toledo City 26,114 0 0% 0
Subtotal 536,536 430941 80% 18335 17404 16888 15945 34883 32818 36293 34060 35580 33093 35895 33017 33288 31173 408672
Total 1,313,672 888640 68% 35700 33853 34257 32236 71645 66853 74290 69166 74365 69039 74847 69065 65168 61275 831759
69553 66493 138498 143456 143404 143912 126443
8.36% 7.99% 16.65% 17.25% 17.24% 17.30% 15.20%
Prepared by: Validated by: SUSAN Y. ORPILLA Approved by: PAROLITA A. MISSION, DPA. RN.
Nutrition Officer III, NNC Regional Nutrition Program Coordinator
Republic of the Philippines
Department of Health
NATIONAL NUTRITION COUNCIL
Normal Weight-for-Age Normal Length/Height-for-Age Normal Weight-for-Length/Height
Province/City
Total Number of Children
48-59 months 60-71 months0-5 months 6-11 months 12-23 months 24-35 months 36-47 months
%
NASUDI G. SOLUTA
Nutrition Officer II- NNC 7

OPT Plus Form 4. Regional Consolidation Sheet of Operation Timbang Plus Results
Revised February 2012 Page 2 of 4
Region ____________________ Total No.: Province ______ City _______ Period of Weighing _____________
Total No.with OPT Plus Results: Province _______City ______ Indigenous group & No of PS: ___________________
Please Check: Number of Indigenous PS measured: 0-59 mos old ______ 0-71 mos old _______
Estimated No. Total No of
of 0-71 mos old 0-71 mos old Coverage
PS PS measured Boys Girls Boys Girls Boys Girls Boys Girls Boys Girls Boys Girls Boys Girls
(1) (2) (3) (4) (5) (6) (7) (8) (9) (10) (11) (12) (13) (14) (15) (16) (17)
Provinces
Bohol 213,321 138341 65% 132 110 161 136 378 327 369 321 348 370 315 309 211 205 3692
Cebu 325,829 209649 64% 252 218 287 260 688 544 642 553 561 543 532 452 456 451 6439
Oriental Negros 222,407 100385 45% 158 131 194 138 398 306 390 316 341 315 293 265 242 200 3687
Siquijor 15,579 9324 60% 6 6 9 5 25 15 15 25 28 11 18 13 12 16 204
Subtotal 777,136 457699 59% 548 465 651 539 1489 1192 1416 1215 1278 1239 1158 1039 921 872 14022
Cities 0 #DIV/0! 0
Bais City 12,652 8351 66% 26 25 21 23 59 41 47 53 52 27 41 45 5 4 469
Bayawan City 19,568 12894 66% 16 20 15 9 43 37 39 37 51 46 29 31 28 28 429
Bogo City 11,525 11028 96% 4 7 10 1 8 8 10 6 11 5 5 7 1 5 88
Carcar City 18,578 16102 87% 20 23 21 27 46 34 45 33 38 30 23 32 29 33 434
Canlaon City 8,534 7384 87% 14 3 10 13 28 23 15 11 28 23 25 21 23 24 261
Cebu City 158,541 141351 89% 178 179 181 172 411 358 402 337 295 264 250 267 227 282 3803
Danao City 20,679 18566 90% 19 13 15 13 33 38 49 33 50 36 21 34 16 22 392
Dumaguete City 21,273 13283 62% 18 6 17 12 50 25 37 33 33 32 31 28 4 6 332
Guihulngan City 15,936 14083 88% 13 9 21 14 39 37 62 47 39 35 31 23 24 28 422
Lapu-lapu City 74,626 73520 99% 27 22 29 16 56 38 59 52 59 44 41 47 26 24 540
Mandaue City 62,456 46403 74% 21 21 18 25 51 43 44 49 48 37 67 57 82 49 612
Naga City 18,055 15657 87% 18 13 21 20 38 31 29 30 32 38 28 23 34 24 379
Tagbilaran City 17,454 10800 62% 11 13 27 15 36 30 38 27 28 19 18 27 12 19 320
Talisay City 36,963 33609 91% 24 16 19 22 37 20 42 35 51 44 41 43 35 29 458
Tanjay City 13,582 7910 58% 6 3 12 3 30 28 18 24 19 19 9 15 1 4 191
Toledo City 26,114 0 0% 0
Subtotal 536,536 430941 80% 415 373 437 385 965 791 936 807 834 699 660 700 547 581 9130
Total 1,313,672 888640 68% 963 838 1088 924 2454 1983 2352 2022 2112 1938 1818 1739 1468 1453 23152
1801 2012 4437 4374 4050 3557 2921
7.78% 8.69% 19.16% 18.89% 17.49% 15.36% 12.62%
Prepared by: Validated by: SUSAN Y. ORPILLA Approved by: PAROLITA A. MISSION, DPA. RN.
Nutrition Officer III, NNC Regional Nutrition Program Coordinator
Underweight Weight-for-Age Stunted Length/Height-for-Age Wasted Weight-for-Length/Height
Province/City
Total Number of Children
0-5 months
%
6-11 months 12-23 months 24-35 months 36-47 months 48-59 months 60-71 months
NASUDI G. SOLUTA
Nutrition Officer II- NNC 7

OPT Plus Form 4. Regional Consolidation Sheet of Operation Timbang Plus Results
Revised February 2012 Page 3 of 4
Region ____________________ Total No.: Province ______ City _______ Period of Weighing _____________
Total No.with OPT Plus Results: Province _______City ______ Indigenous group & No of PS: ___________________
Please Check: Number of Indigenous PS measured: 0-59 mos old ______ 0-71 mos old _______
Estimated No. Total No of
of 0-71 mos old 0-71 mos old Coverage
PS PS measured Boys Girls Boys Girls Boys Girls Boys Girls Boys Girls Boys Girls Boys Girls
(1) (2) (3) (4) (5) (6) (7) (8) (9) (10) (11) (12) (13) (14) (15) (16) (17)
Provinces
Bohol 213,321 138341 81 65 51 35 118 106 98 72 78 68 64 54 49 42 981
Cebu 325,829 256 218 147 148 318 273 249 223 189 211 196 169 298 259 3154
Oriental Negros 222,407 135 118 85 78 183 157 154 166 128 109 95 70 63 66 1607
Siquijor 15,579 6 8 9 2 8 8 5 6 4 4 3 3 2 1 69
Subtotal 777,136 478 409 292 263 627 544 506 467 399 392 358 296 412 368 5811
Cities 0
Bais City 12,652 25 21 20 15 28 34 29 19 21 20 16 6 1 2 257
Bayawan City 19,568 15 25 10 6 13 17 22 16 13 16 7 13 5 5 183
Bogo City 11,525 6 4 1 1 5 2 0 1 3 0 2 0 1 0 26
Carcar City 18,578 18 22 12 25 36 31 16 12 12 10 24 19 13 9 259
Canlaon City 8,534 9 5 9 5 19 9 11 3 14 6 6 7 2 10 115
Cebu City 158,541 80 60 43 34 90 61 71 45 69 34 47 42 36 33 745
Danao City 20,679 11 6 8 2 12 11 10 11 4 6 5 2 1 3 92
Dumaguete City 21,273 6 5 7 5 11 7 10 9 8 4 6 1 0 0 79
Guihulngan City 15,936 22 17 11 5 27 19 27 19 10 22 7 11 10 18 225
Lapu-lapu City 74,626 20 20 10 6 22 26 18 18 8 12 13 8 3 8 192
Mandaue City 62,456 28 29 11 10 32 25 41 19 18 18 21 25 16 33 326
Naga City 18,055 9 6 9 9 12 20 17 18 10 11 19 11 10 14 175
Tagbilaran City 17,454 7 2 14 11 16 14 22 18 14 4 12 7 1 4 146
Talisay City 36,963 13 16 11 7 24 24 18 11 12 13 18 13 9 15 204
Tanjay City 13,582 3 5 7 7 16 5 11 4 9 14 5 4 1 0 91
Toledo City 26,114 0
Subtotal 536,536 272 243 183 148 363 305 323 223 225 190 208 169 109 154 3115
Total 1,313,672 750 652 475 411 990 849 829 690 624 582 566 465 521 522 8926
1402 886 1839 1519 1206 1031 1043
15.71% 9.93% 20.60% 17.02% 13.51% 11.55% 11.68%
Prepared by: Validated by: SUSAN Y. ORPILLA Approved by: PAROLITA A. MISSION, DPA. RN.
Nutrition Officer III, NNC Regional Nutrition Program Coordinator
Province/City
Total Number of Children
Sev. UW Weight-for-Age Sev. Stunted Length/Height-for-Age Sev. Wasted Weight-for-Length/Height
36-47 months0-5 months 6-11 months 12-23 months 24-35 months
%
48-59 months 60-71 months
NASUDI G. SOLUTA
Nutrition Officer II- NNC 7

OPT Plus Form 4. Regional Consolidation Sheet of Operation Timbang Plus Results
Revised February 2012 Page 4 of 4
Region ____________________ Total No.: Province ______ City _______ Period of Weighing _____________
Total No.with OPT Plus Results: Province _______City ______ Indigenous group & No of PS: ___________________
Number of Indigenous PS measured: 0-59 mos old ______ 0-71 mos old _______
Estimated No. Total No of
of 0-71 mos old 0-71 mos old Coverage
PS PS measured Boys Girls Boys Girls Boys Girls Boys Girls Boys Girls Boys Girls Boys Girls
(1) (2) (3) (4) (5) (6) (7) (8) (9) (10) (11) (12) (13) (14) (15) (16) (17)
Provinces
Bohol 213,321 138341 65% 169 140 96 64 152 108 120 113 125 105 159 106 71 72 1600
Cebu 325,829 209649 64% 462 374 341 299 528 459 454 419 498 351 392 301 332 279 5489
Oriental Negros 222,407 100385 45% 270 240 137 142 190 175 193 118 150 142 147 95 108 84 2191
Siquijor 15,579 9324 60% 18 15 9 19 12 11 15 15 12 6 10 13 18 5 178
Subtotal 777,136 457699 59% 919 769 583 524 882 753 782 665 785 604 708 515 529 440 9458
Cities 0 #DIV/0! 0
Bais City 12,652 8351 66% 38 33 24 26 32 28 20 21 37 25 30 24 3 1 342
Bayawan City 19,568 12894 66% 34 39 21 14 21 25 27 28 26 31 23 12 19 6 326
Bogo City 11,525 11028 96% 10 5 5 3 4 5 6 2 5 4 7 0 7 0 63
Carcar City 18,578 16102 87% 43 24 18 18 36 30 35 33 30 28 38 23 31 29 416
Canlaon City 8,534 7384 87% 7 9 3 5 7 8 14 4 10 6 1 7 10 3 94
Cebu City 158,541 141351 89% 160 102 75 80 172 170 162 151 158 123 177 114 144 105 1893
Danao City 20,679 18566 90% 36 32 20 15 35 21 30 26 29 9 26 19 18 3 319
Dumaguete City 21,273 13283 62% 18 26 14 17 40 40 22 27 10 18 21 12 2 2 269
Guihulngan City 15,936 14083 88% 42 25 20 17 36 31 19 19 19 17 14 18 18 21 316
Lapu-lapu City 74,626 73520 99% 65 60 21 21 33 38 44 32 39 47 36 28 20 15 499
Mandaue City 62,456 46403 74% 72 70 21 18 34 31 37 33 35 25 22 17 13 12 440
Naga City 18,055 15657 87% 27 19 20 24 26 23 15 14 14 11 16 11 19 15 254
Tagbilaran City 17,454 10800 62% 19 13 14 5 20 17 30 19 33 26 14 11 17 12 250
Talisay City 36,963 33609 91% 35 44 19 28 33 29 34 28 41 27 19 21 22 18 398
Tanjay City 13,582 7910 58% 15 11 11 3 10 17 26 18 17 8 6 6 1 1 150
Toledo City 26,114 0 0% 0
Subtotal 536,536 430941 80% 621 512 306 294 539 513 521 455 503 405 450 323 344 243 6029
Total 1,313,672 888640 68% 1540 1281 889 818 1421 1266 1303 1120 1288 1009 1158 838 873 683 15487
2821 1707 2687 2423 2297 1996 1556
18.22% 11.02% 17.35% 15.65% 14.83% 12.89% 10.05%
Prepared by: Validated by: SUSAN Y. ORPILLA Approved by: PAROLITA A. MISSION, DPA. RN.
Nutrition Officer III, NNC Regional Nutrition Program Coordinator
Province/City
Total Number of Children
Please check: Overweight Weight-for-Age Tall Length/Height-for-Age Overweight Weight-for-Length1/
/Height2/
Obese Weight-for-Length1/
/Height2/
36-47 months
%
48-59 months 60-71 months0-5 months 6-11 months 12-23 months 24-35 months
NASUDI G. SOLUTA
Nutrition Officer II- NNC 7
OPT Plus Form 4. Regional Consolidation Sheet of Operation Timbang Plus Results
Revised February 2012 Page 3 of 4
Region ____________________ Total No.: Province ______ City _______ Period of Weighing _____________
Total No.with OPT Plus Results: Province _______City ______ Indigenous group & No of PS: ___________________
Number of Indigenous PS measured: 0-59 mos old ______ 0-71 mos old _______
Estimated No.Total No of
of 0-71 mos old0-71 mos oldCoverage
PS PS measured Boys Girls Boys Girls Boys Girls Boys Girls Boys Girls Boys Girls Boys Girls
(1) (2) (3) (4) (5) (6) (7) (8) (9) (10) (11) (12) (13) (14) (15) (16) (17)
Provinces
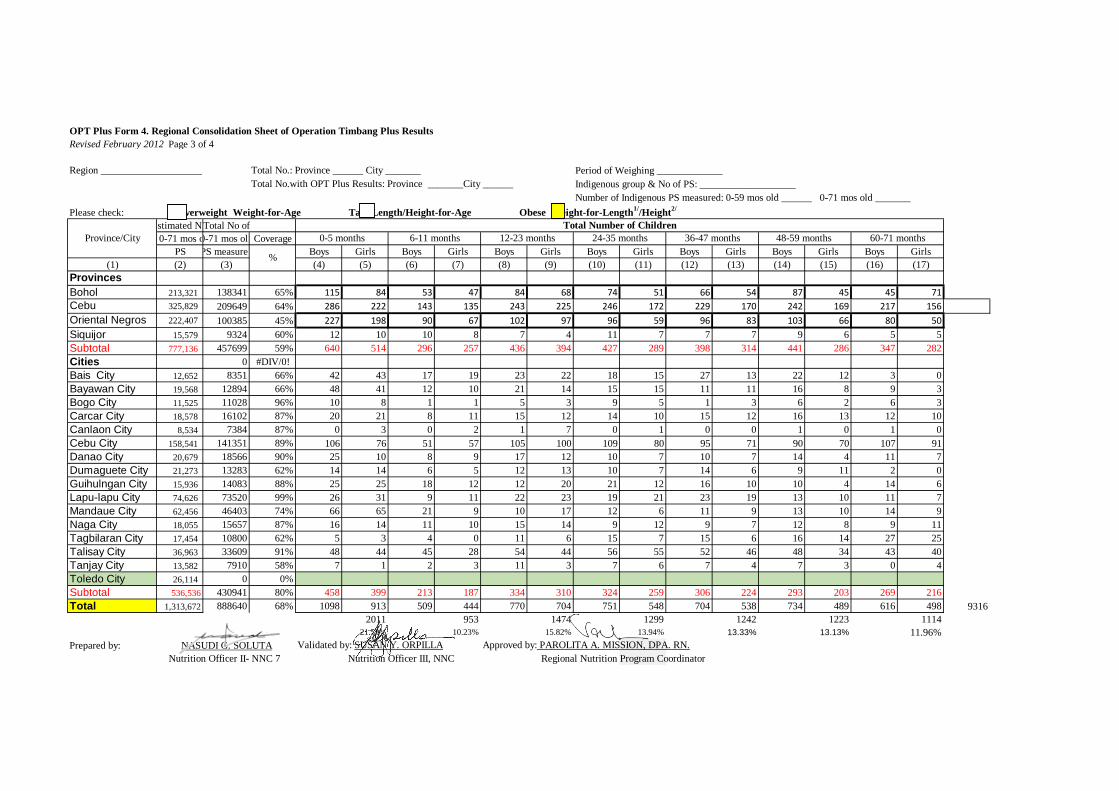
Bohol 213,321 138341 65% 115 84 53 47 84 68 74 51 66 54 87 45 45 71 944
Cebu 325,829 209649 64% 286 222 143 135 243 225 246 172 229 170 242 169 217 156 2855
Oriental Negros 222,407 100385 45% 227 198 90 67 102 97 96 59 96 83 103 66 80 50 1414
Siquijor 15,579 9324 60% 12 10 10 8 7 4 11 7 7 7 9 6 5 5 108
Subtotal 777,136 457699 59% 640 514 296 257 436 394 427 289 398 314 441 286 347 282 5321
Cities 0 #DIV/0! 0
Bais City 12,652 8351 66% 42 43 17 19 23 22 18 15 27 13 22 12 3 0 276
Bayawan City 19,568 12894 66% 48 41 12 10 21 14 15 15 11 11 16 8 9 3 234
Bogo City 11,525 11028 96% 10 8 1 1 5 3 9 5 1 3 6 2 6 3 63
Carcar City 18,578 16102 87% 20 21 8 11 15 12 14 10 15 12 16 13 12 10 189
Canlaon City 8,534 7384 87% 0 3 0 2 1 7 0 1 0 0 1 0 1 0 16
Cebu City 158,541 141351 89% 106 76 51 57 105 100 109 80 95 71 90 70 107 91 1208
Danao City 20,679 18566 90% 25 10 8 9 17 12 10 7 10 7 14 4 11 7 151
Dumaguete City 21,273 13283 62% 14 14 6 5 12 13 10 7 14 6 9 11 2 0 123
Guihulngan City 15,936 14083 88% 25 25 18 12 12 20 21 12 16 10 10 4 14 6 205
Lapu-lapu City 74,626 73520 99% 26 31 9 11 22 23 19 21 23 19 13 10 11 7 245
Mandaue City 62,456 46403 74% 66 65 21 9 10 17 12 6 11 9 13 10 14 9 272
Naga City 18,055 15657 87% 16 14 11 10 15 14 9 12 9 7 12 8 9 11 157
Tagbilaran City 17,454 10800 62% 5 3 4 0 11 6 15 7 15 6 16 14 27 25 154
Talisay City 36,963 33609 91% 48 44 45 28 54 44 56 55 52 46 48 34 43 40 637
Tanjay City 13,582 7910 58% 7 1 2 3 11 3 7 6 7 4 7 3 0 4 65
Toledo City 26,114 0 0% 0
Subtotal 536,536 430941 80% 458 399 213 187 334 310 324 259 306 224 293 203 269 216 3995
Total 1,313,672 888640 68% 1098 913 509 444 770 704 751 548 704 538 734 489 616 498 9316
2011 953 1474 1299 1242 1223 1114
21.59% 10.23% 15.82% 13.94% 13.33% 13.13% 11.96%
Prepared by: Validated by: SUSAN Y. ORPILLA Approved by: PAROLITA A. MISSION, DPA. RN.
Nutrition Officer III, NNC Regional Nutrition Program Coordinator
Please check: Overweight Weight-for-Age Tall Length/Height-for-Age Obese Weight-for-Length1/
/Height2/
36-47 months0-5 months 6-11 months 12-23 months 24-35 monthsProvince/City
Total Number of Children
48-59 months 60-71 months
%
NASUDI G. SOLUTA
Nutrition Officer II- NNC 7
Revised February 2012 Page 1 of 3
Region VII: Central Visayas Year/Period of Measurement _________________________ Estimated No. of PS: 0-59 months old2/_________ 0-71 months old3/_________
Total No. of Prov _____ City _____ Mun _____ Total Population of Region/Source ____________________ Actual No of PS measured: 0-59 months old _________ 0-71 months old _________
Total No. with OPT Plus Results: Prov _____ City _____ Mun _____ Indigenous Group: (Please specify) Percent OPT Plus Coverage: 0-59 months old _________ 0-71 months old _________
Percent OPT Plus Coverage: Prov _____ City _____ Mun _____ _______________________________________________ No. of Indigenous PS measured: 0-59 months old _________ 0-71 months old _________
CY 20______ Prevalence Rate UW & SUW1/
: ___________ _______________________________________________ Prevalence Rate of UW & SUW: 0-59 months old _________ 0-71 months old _________
Age
Group
Boys Girls Boys Girls Boys Girls Boys Girls Boys Girls Total No Prev No Prev No Prev No Prev
(1) (2) (3) (4) (5) (6) (7) (8) (9) (10) (11) (12) (13) (14) (15) (16) (17) (18) (19) (20)
0-5 .
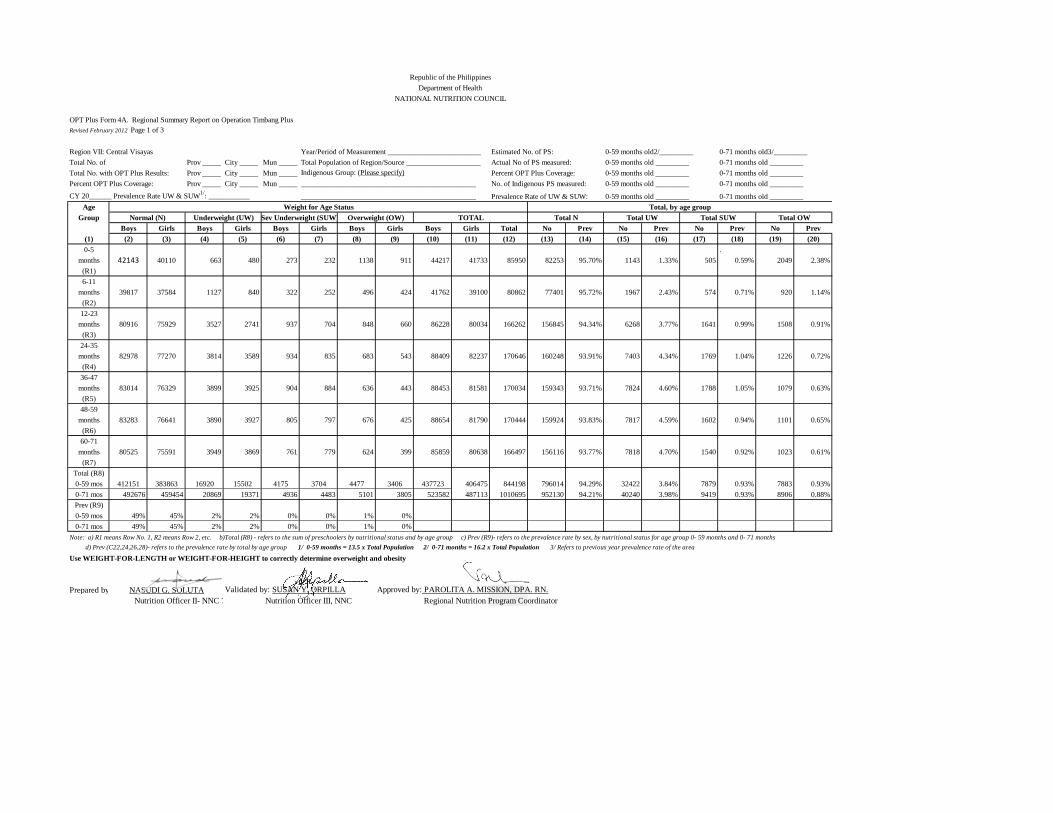
months 42143 40110 663 480 273 232 1138 911 44217 41733 85950 82253 95.70% 1143 1.33% 505 0.59% 2049 2.38%
(R1)
6-11
months 39817 37584 1127 840 322 252 496 424 41762 39100 80862 77401 95.72% 1967 2.43% 574 0.71% 920 1.14%
(R2)
12-23
months 80916 75929 3527 2741 937 704 848 660 86228 80034 166262 156845 94.34% 6268 3.77% 1641 0.99% 1508 0.91%
(R3)
24-35
months 82978 77270 3814 3589 934 835 683 543 88409 82237 170646 160248 93.91% 7403 4.34% 1769 1.04% 1226 0.72%
(R4)
36-47
months 83014 76329 3899 3925 904 884 636 443 88453 81581 170034 159343 93.71% 7824 4.60% 1788 1.05% 1079 0.63%
(R5)
48-59
months 83283 76641 3890 3927 805 797 676 425 88654 81790 170444 159924 93.83% 7817 4.59% 1602 0.94% 1101 0.65%
(R6)
60-71
months 80525 75591 3949 3869 761 779 624 399 85859 80638 166497 156116 93.77% 7818 4.70% 1540 0.92% 1023 0.61%
(R7)
Total (R8)
0-59 mos 412151 383863 16920 15502 4175 3704 4477 3406 437723 406475 844198 796014 94.29% 32422 3.84% 7879 0.93% 7883 0.93%
0-71 mos 492676 459454 20869 19371 4936 4483 5101 3805 523582 487113 1010695 952130 94.21% 40240 3.98% 9419 0.93% 8906 0.88%
Prev (R9)
0-59 mos 49% 45% 2% 2% 0% 0% 1% 0%
0-71 mos 49% 45% 2% 2% 0% 0% 1% 0%
Note: a) R1 means Row No. 1, R2 means Row 2, etc. b)Total (R8) - refers to the sum of preschoolers by nutritional status and by age group c) Prev (R9)- refers to the prevalence rate by sex, by nutritional status for age group 0- 59 months and 0- 71 months
d) Prev (C22,24,26,28)- refers to the prevalence rate by total by age group 1/ 0-59 months = 13.5 x Total Population 2/ 0-71 months = 16.2 x Total Population 3/ Refers to previous year prevalence rate of the area
Use WEIGHT-FOR-LENGTH or WEIGHT-FOR-HEIGHT to correctly determine overweight and obesity
Prepared by: Validated by: SUSAN Y. ORPILLA Approved by: PAROLITA A. MISSION, DPA. RN.
Nutrition Officer III, NNC Regional Nutrition Program Coordinator
Total N
Weight for Age Status Total, by age group
Normal (N) Underweight (UW) Sev Underweight (SUW) Overweight (OW) TOTAL Total SUW Total OWTotal UW
NATIONAL NUTRITION COUNCIL
OPT Plus Form 4A. Regional Summary Report on Operation Timbang Plus
Republic of the Philippines
Department of Health
NASUDI G. SOLUTA
Nutrition Officer II- NNC 7

Revised February 2012 Page 2 of 3
Region _______________________ Year/Period of Measurement _________________________ Estimated No. of PS: 0-59 months old2/_________ 0-71 months old3/_________
Total No. of Prov _____ City _____ Mun _____ Total Population of Region/Source ____________________ Actual No of PS measured: 0-59 months old _________ 0-71 months old _________
Total No. with OPT Plus Results: Prov _____ City _____ Mun _____ Indigenous Group: (Please specify) Percent OPT Plus Coverage: 0-59 months old _________ 0-71 months old _________
Percent OPT Plus Coverage: Prov _____ City _____ Mun _____ _______________________________________________ No. of Indigenous PS measured: 0-59 months old _________ 0-71 months old _________
CY 20______ Prevalence Rate UW & SUW1/
: ___________ _______________________________________________ Prevalence Rate of UW & SUW: 0-59 months old _________ 0-71 months old _________
Age
Group
Boys Girls Boys Girls Boys Girls Boys Girls Boys Girls Total No Prev No Prev No Prev No Prev
(1) (2) (3) (4) (5) (6) (7) (8) (9) (10) (11) (12) (13) (14) (15) (16) (17) (18) (19) (20)
0-5 .
months 36616 34705 2080 1584 1073 863 1509 1417 41278 38569 79847 71321 89.32% 3664 4.59% 1936 2.42% 2926 3.66%
(R1)
6-11
months 33442 32235 2630 2174 1339 1006 901 943 38312 36358 74670 65677 87.96% 4804 6.43% 2345 3.14% 1844 2.47%
(R2)
12-23
months 65939 62930 8205 6575 4415 3254 1469 1266 80028 74025 154053 128869 83.65% 14780 9.59% 7669 4.98% 2735 1.78%
(R3)
24-35
months 68750 64762 8630 7906 4138 3558 1091 866 82609 77092 159701 133512 83.60% 16536 10.35% 7696 4.82% 1957 1.23%
(R4)
36-47
months 68124 62877 9424 8537 3539 3423 653 556 81740 75393 157133 131001 83.37% 17961 11.43% 6962 4.43% 1209 0.77%
(R5)
48-59
months 69373 63384 8867 8620 3415 3034 473 390 82128 75428 157556 132757 84.26% 17487 11.10% 6449 4.09% 863 0.55%
(R6)
60-71
months 66454 62908 8737 8257 2890 2318 454 496 78535 73979 152514 129362 84.82% 16994 11.14% 5208 3.41% 950 0.62%
(R7)
Total (R8)
0-59 mos 342244 320893 39836 35396 17919 15138 6096 5438 406095 376865 782960 663137 84.70% 75232 9.61% 33057 4.22% 11534 1.47%
0-71 mos 408698 383801 48573 43653 20809 17456 6550 5934 484630 450844 935474 792499 84.72% 92226 9.86% 38265 4.09% 12484 1.33%
Prev (R9)
0-59 mos 44% 41% 5% 5% 2% 2% 1% 1%
0-71 mos 44% 41% 5% 5% 2% 2% 1% 1%
Note: a) R1 means Row No. 1, R2 means Row 2, etc. b)Total (R8) - refers to the sum of preschoolers by nutritional status and by age group c) Prev (R9)- refers to the prevalence rate by sex, by nutritional status for age group 0- 59 months and 0- 71 months
d) Prev (C14, 16, 18, 20) - refers to the prevalence rate by total age group per nutritional status 1/Previous year prevalence rate 2/ 0-59 months old = 13.5 x Total Population 3/ 0-71 months old = 16.2 x Total Population
Prepared by: Validated by: SUSAN Y. ORPILLA Approved by: PAROLITA A. MISSION, DPA. RN.
Nutrition Officer III, NNC Regional Nutrition Program Coordinator
Tall (T) TOTAL Total N Total St Total SSt Total T
Length/Height for Age Status Total, by age group
Normal (N) Stunted /Short (St) Severely Stunted (SSt)
NATIONAL NUTRITION COUNCIL
OPT Plus Form 4A. Regional Summary Report on Operation Timbang Plus
Republic of the Philippines
Department of Health
NASUDI G. SOLUTA
Nutrition Officer II- NNC 7

Revised February 2012 Page 3 of 3
Region _______________________ Year/Period of Measurement _________________________ Estimated No. of PS: 0-59 months old2/_________ 0-71 months old3/_________
Total No. of Prov ____ City ____ Mun ____ Total Population of Region/Source ____________________ Actual No of PS measured: 0-59 months old _________ 0-71 months old _________
Total No. with OPT Plus Results: Prov ____ City ____ Mun ____ Indigenous Group: (Please specify) Percent OPT Plus Coverage: 0-59 months old _________ 0-71 months old _________
Percent OPT Plus Coverage: Prov ____ City ____ Mun ____ _______________________________________________ No. of Indigenous PS measured: 0-59 months old _________ 0-71 months old _________
CY 20______ Prevalence Rate UW & SUW1/
: ___________ _______________________________________________ Prevalence Rate of UW & SUW: 0-59 months old _________ 0-71 months old _________
Age
Group
Boys Girls Boys Girls Boys Girls Boys Girls Boys Girls Boys Girls Total No Prev No Prev No Prev No Prev No Prev
(1) (2) (3) (4) (5) (6) (7) (8) (9) (10) (11) (12) (13) (14) (15) (16) (17) (18) (19) (20) (21) (22) (23) (24)
0-5
months 35700 33853 963 838 750 652 1540 1281 1098 913 40051 37537 77588 69553 89.64% 1801 2.32% 1402 1.81% 2821 3.64% 2011 2.59%
(R1)
6-11
months 34257 32236 1088 924 475 411 889 818 509 444 37218 34833 72051 66493 92.29% 2012 2.79% 886 1.23% 1707 2.37% 953 1.32%
(R2)
12-23
months 71645 66853 2454 1983 990 849 1421 1266 770 704 77280 71655 148935 138498 92.99% 4437 2.98% 1839 1.23% 2687 1.80% 1474 0.99%
(R3)
24-35
months 74290 69166 2352 2022 829 690 1303 1120 751 548 79525 73546 153071 143456 93.72% 4374 2.86% 1519 0.99% 2423 1.58% 1299 0.85%
(R4)
36-47
months 74365 69039 2112 1938 624 582 1288 1009 704 538 79093 73106 152199 143404 94.22% 4050 2.66% 1206 0.79% 2297 1.51% 1242 0.82%
(R5)
48-59
months 74847 69065 1818 1739 566 465 1158 838 734 489 79123 72596 151719 143912 94.85% 3557 2.34% 1031 0.68% 1996 1.32% 1223 0.81%
(R6)
60
months 65168 61275 1468 1453 521 522 873 683 616 498 68646 64431 133077 126443 95.01% 2921 2.19% 1043 0.78% 1556 1.17% 1114 0.84%
(R7)
Total (R8)
0-59 mos 365104 340212 10787 9444 4234 3649 7599 6332 4566 3636 392290 363273 755563 705316 93.35% 20231 2.68% 7883 1.04% 13931 1.84% 8202 1.09%
0-71 mos 430272 401487 12255 10897 4755 4171 8472 7015 5182 4134 460936 427704 888640 831759 93.60% 23152 2.61% 8926 1.00% 15487 1.74% 9316 1.05%
Prev (R9)
0-59 mos 48% 45% 1% 1% 1% 0% 1% 1% 1% 0%
0-71 mos 48% 45% 1% 1% 1% 0% 1% 1% 1% 0%
Note: a) R1 means Row No. 1, R2 means Row 2, etc. b)Total (R8) - refers to the sum of preschoolers by nutritional status and by age group c) Prev (R9)- refers to the prevalence rate by sex, by nutritional status for age group 0- 59 months and 0- 71 months
d) Prev (C22,24,26,28)- refers to the prevalence rate by total by age group 1/ 0-59 months = 13.5 x Total Population 2/ 0-71 months = 16.2 x Total Population 3/ Refers to previous year prevalence rate of the area
Use WEIGHT-FOR-LENGTH for 0-23 months old preschool children and WEIGHT-FOR-HEIGHT for 24-60 months old preschool children.
Use WEIGHT-FOR-LENGTH or WEIGHT-FOR-HEIGHT to correctly determine overweight and obesity
Prepared by: Validated by: SUSAN Y. ORPILLA Approved by: PAROLITA A. MISSION, DPA. RN.
Nutrition Officer III, NNC Regional Nutrition Program Coordinator
Total N Total W Total SW Total OW Total ObTOTALNormal (N) Wasted (W) Severely Wasted (SW) Overweight (OW) Obese (Ob)
Weight for Length/Height Status Total, by age group
NATIONAL NUTRITION COUNCIL
OPT Plus Form 4A. Regional Summary Report on Operation Timbang Plus
Republic of the Philippines
Department of Health
NASUDI G. SOLUTA
Nutrition Officer II- NNC 7

OPT Plus Form 4B. Report on Regional Coverage of Operation Timbang Plus
Revised February 2012
Region VII: Central Visayas Total Population/Source___________________________________ CY2014____ Prevalence Rate Weight-for-Age _________
Year/Period of Measurement 1st Q 2014 No. of Indigenous Group/s measured_________________________ Prevalence Rate Weight/Age _______Length-Height/Age _______ Weight/Length-Height ________
Total Number of Number of Municipalities Total Number of Number of Barangays Estimated Number of
Province/City Municipalities with OPT Results Barangays with OPT Results Preschoolers
Aged 0-71 months Weight Height Weight Height
(1) (2) (3) (4) (5) (6) (7) (8) (9) (10)
Provinces
Bohol 47 47 1,094 1,094 213,321 145467 145321 68.2% 68.12%
Cebu 43 43 892 892 325,829 272445 223779 83.6% 68.68%
Oriental Negros 19 18 395 395 222,407 110054 103742 49.5% 46.65%
Siquijor 6 6 134 134 15,579 9324 9324 59.8% 59.85%
Subtotal 777,136 537290 486626 69.1% 62.62%
Cities 0
Bais City 35 35 12,652 9709 9709 76.7% 76.74%
Bayawan City 28 28 19,568 14032 12639 71.7% 64.59%
Bogo City 29 29 11,525 11298 11298 98.0% 98.03%
Carcar City 15 15 18,578 16038 16185 86.3% 87.12%
Canlaon City 12 12 8,534 7380 7380 86.5% 86.48%
Cebu City 80 80 158,541 150196 142158 94.7% 89.67%
Danao City 42 42 20,679 18854 18566 91.2% 89.78%
Dumaguete City 30 30 21,273 15674 15673 73.7% 73.68%
Guihulngan City 33 33 15,936 14083 14083 88.4% 88.37%
Lapu-lapu City 30 30 74,626 73520 73520 98.5% 98.52%
Mandaue City 27 27 62,456 46931 46259 75.1% 74.07%
Naga City 28 28 18,055 15739 15504 87.2% 85.87%
Tagbilaran City 15 15 17,454 11606 11121 66.5% 63.72%
Talisay City 22 22 36,963 33745 33745 91.3% 91.29%
Tanjay City 24 24 13,582 9253 9253 68.1% 68.13%
Toledo City 38 38 26,114 25347 16215 97.1% 62.09%
Subtotal 536,536 473405 453308 88.2% 84.49%
Total 1,313,672 1010695 939934 76.9% 71.55%
Prepared by: Validated by: SUSAN Y. ORPILLA Approved by: PAROLITA A. MISSION, DPA. RN.
Nutrition Officer III, NNC Regional Nutrition Program Coordinator
NASUDI G. SOLUTA
Nutrition Officer II- NNC 7
Preschoolers Coverage
Republic of the Philippines
Department of Health
NATIONAL NUTRITION COUNCIL
Actual Number of %

Total No. of Cities : 16
Est.No. of Total No. of % OPT Total UW PREV OW
PROVINCES/ PSC 0-71 PSC Coverage & SUW PREV
CITIES mos. Weighed Normal OW UW SUW
Provinces
BOHOL 213,321 145467 68.19% 138436 731 5454 846 6300 4.33% 0.50% 4
CEBU 325,829 272445 83.62% 249341 3276 15798 4030 19828 7.28% 1.20% 1
NEGROS ORIENTAL 222,407 110054 49.48% 101344 1063 6177 1470 7647 6.95% 0.97% 2
SIQUIJOR 15,579 9324 59.85% 8721 108 434 61 495 5.31% 1.16% 3
Subtotal 777,136 537290 69.14% 497842 5178 27863 6407 34270 6.38% 0.96%
Cities #DIV/0! 0 0 0 0 0
Bais City 12,652 9709 76.74% 8566 229 677 237 914 9.41% 2.36%
Bayawan City 19,568 14032 71.71% 13023 112 719 178 897 6.39% 0.80%
Bogo City 11,525 11298 98.03% 10975 53 241 29 270 2.39% 0.47%
Carcar City 18,578 16038 86.33% 14953 189 661 235 896 5.59% 1.18%
Canlaon City 8,534 7380 86.48% 7087 18 218 57 275 3.73% 0.24%
Cebu City 158,541 150196 94.74% 143749 1488 4043 916 4959 3.30% 0.99%
Danao City 20,679 18854 91.17% 17890 117 763 84 847 4.49% 0.62%
Dumaguete City 21,273 15674 73.68% 15190 128 351 5 356 2.27% 0.82%
Guihulngan City 15,936 14083 88.37% 12537 97 1165 284 1449 10.29% 0.69%
Lapu-lapu City 74,626 73520 98.52% 72438 249 657 176 833 1.13% 0.34%
Mandaue City 62,456 46931 75.14% 45650 271 793 217 1010 2.15% 0.58%
Naga City 18,055 15739 87.17% 15040 102 498 99 597 3.79% 0.65%
Tagbilaran City 17,454 11606 66.49% 11160 122 279 45 324 2.79% 1.05%
Talisay City 36,963 33745 91.29% 32591 402 556 196 752 2.23% 1.19%
Tanjay City 13,582 9253 68.13% 8754 93 331 75 406 4.39% 1.01%
Toledo City 26,114 25347 97.06% 24685 58 425 179 604 2.38% 0.23%
Subtotal 536,536 473405 88.23% 454288 3728 12377 3012 15389 3.25% 0.79%
TOTAL 1,313,672 1,010,695 76.94% 952130 8906 40240 9419 49659 4.91% 0.88%
Note: N- Normal, UW- Underweight, SUW- Severly Underweight, OW- Overweight, PSC - Pre School Children
Percent OPT Coverage: 81.74 Actual No. of PSC 0-71 mos. Weighed: 967,868
No. of Preschoolers Weighed by
Nutritional Status
WEIGHT FOR AGE
Estimated No. of PSC. 0-71 mos.: 1,184,086
Department of Health
NATIONAL NUTRITION COUNCIL REGION VII
REGIONAL SUMMARY REPORT ON OPERATION TIMBANG
Total No. of Provinces: 4 Weighing Period and Year: Jan. to March 2014

Total No. of Cities : 16
Est.No. of Total No. of % OPT Total S PREV TALL
PROVINCES/ PSC 0-71 PSC Coverage & SS PREV
CITIES mos. measured Normal TALL S SS
Provinces
BOHOL 213,321 149781 70.21% 123327 1629 15246 5119 20365 13.60% 1.09%
CEBU 325,829 223779 68.68% 176869 3570 28895 14445 43340 19.37% 1.60%
NEGROS ORIENTAL 222,407 103742 46.65% 82537 1436 13121 6648 19769 19.06% 1.38%
SIQUIJOR 15,579 9324 59.85% 7759 109 1115 341 1456 15.62% 1.17%
Subtotal 777,136 486626 62.62% 390492 6744 58377 26553 84930 17.45% 1.39%
Cities
Bais City 12,652 9709 76.74% 6365 550 1686 1108 2794 28.78% 5.66%
Bayawan City 19,568 12639 64.59% 9451 140 2165 883 3048 24.12% 1.11%
Bogo City 11,525 11298 98.03% 10014 63 968 253 1221 10.81% 0.56%
Carcar City 18,578 16185 87.12% 12814 268 2170 933 3103 19.17% 1.66%
Canlaon City 8,534 7380 86.48% 6047 17 971 345 1316 17.83% 0.23%
Cebu City 158,541 142158 89.67% 127954 2098 10288 1818 12106 8.52% 1.48%
Danao City 20,679 18566 89.78% 15746 157 2023 640 2663 14.34% 0.85%
Dumaguete City 21,273 15673 73.68% 14719 240 611 103 714 4.56% 1.53%
Guihulngan City 15,936 14083 88.37% 9922 376 2478 1307 3785 26.88% 2.67%
Lapu-lapu City 74,626 73520 98.52% 70531 415 1911 663 2574 3.50% 0.56%
Mandaue City 62,456 46259 74.07% 43007 276 2130 846 2976 6.43% 0.60%
Naga City 18,055 15504 85.87% 13671 264 1137 432 1569 10.12% 1.70%
Tagbilaran City 17,454 11121 63.72% 9784 205 824 308 1132 10.18% 1.84%
Talisay City 36,963 33745 91.29% 29159 471 2750 1365 4115 12.19% 1.40%
Tanjay City 13,582 9253 68.13% 8412 71 566 204 770 8.32% 0.77%
Toledo City 26,114 16215 62.09% 14411 129 1171 504 1675 10.33% 0.00%
Subtotal 536,536 453308 84.49% 402007 5740 33849 11712 45561 10.05% 1.27%
TOTAL 1,313,672 939,934 71.55% 792,499 12,484 92,226 38,265 130,491 13.88% 1.33%
Note: N- Normal, S-Stunted , SS- Severly Stunted, PSC - Pre School Children
Estimated No. of PSC. 0-71 mos.: 1,184,086
Percent OPT Coverage: 60.04 Actual No. of PSC 0-71 mos. Weighed: 710983
HEIGHT/LENGTH FOR AGE
No. of Preschoolers Weighed by
Nutritional Status
Department of Health
NATIONAL NUTRITION COUNCIL REGION VII
REGIONAL SUMMARY REPORT ON OPERATION TIMBANG
Total No. of Provinces: 4 Weighing Period and Year: Jan. to March 2014

Total No. of Cities : 16
Est.No. of Total No. of % OPT Total W PREV Total Ob PREV
PROVINCES/ PSC 0-71 PSC Coverage & SW & OW
CITIES mos. with Data Normal OW Ob W SW
Provinces
BOHOL 213,321 138341 65% 131124 1600 944 3692 981 4673 3.38% 2544 1.84%
CEBU 325,829 209649 64% 191712 5489 2855 6439 3154 9593 4.58% 8344 3.98%
NEGROS ORIENTAL 222,407 100385 45% 91486 2191 1414 3687 1607 5294 5.27% 3605 3.59%
SIQUIJOR 15,579 9324 60% 8765 178 108 204 69 273 2.93% 286 3.07%
777,136 457699 59% 423087 9458 5321 14022 5811 19833 4.33% 14779 3.23%
Cities
Bais City 12,652 8351 66% 7007 342 276 469 257 726 8.69% 618 7.40%
Bayawan City 19,568 12894 66% 11722 326 234 429 183 612 4.75% 560 4.34%
Bogo City 11,525 11028 96% 10788 63 63 88 26 114 1.03% 126 1.14%
Carcar City 18,578 16102 87% 14804 416 189 434 259 693 4.30% 605 3.76%
Canlaon City 8,534 7384 87% 6898 94 16 261 115 376 5.09% 110 1.49%
Cebu City 158,541 141351 89% 133702 1893 1208 3803 745 4548 3.22% 3101 2.19%
Danao City 20,679 18566 90% 17612 319 151 392 92 484 2.61% 470 2.53%
Dumaguete City 21,273 13283 62% 12480 269 123 332 79 411 3.09% 392 2.95%
Guihulngan City 15,936 14083 88% 12915 316 205 422 225 647 4.59% 521 3.70%
Lapu-lapu City 74,626 73520 99% 72044 499 245 540 192 732 1.00% 744 1.01%
Mandaue City 62,456 46403 74% 44753 440 272 612 326 938 2.02% 712 1.53%
Naga City 18,055 15657 87% 14692 254 157 379 175 554 3.54% 411 2.63%
Tagbilaran City 17,454 10800 62% 9930 250 154 320 146 466 4.31% 404 3.74%
Talisay City 36,963 33609 91% 31912 398 637 458 204 662 1.97% 1035 3.08%
Tanjay City 13,582 7910 58% 7413 150 65 191 91 282 3.57% 215 2.72%
Toledo City 26,114 0 0% 0 0 0 0 0 0 0.00% 0 0.00%
Subtotal 536,536 430941 80.32% 408672 6029 3995 9130 3115 12245 2.84% 10024 2.33%
TOTAL 1,313,672 888,640 67.65% 831,759 15,487 9,316 23,152 8,926 32,078 3.61% 24,803 2.79%
Note: N- Normal, W- Wasted, SW- Severly Wasted, OW- Overweight, Ob- Obese PSC - Pre School Children
No. of Preschoolers Weighed by
Nutritional Status
Department of Health
NATIONAL NUTRITION COUNCIL REGION VII
REGIONAL SUMMARY REPORT ON OPERATION TIMBANG
Total No. of Provinces: 4 Weighing Period and Year: Jan. to March 2014
Estimated No. of PSC. 0-71 mos.: 1,184,086
Actual No. of PSC 0-71 mos. Weighed: 686, 707Percent OPT Coverage: 57.99
WEIGHT FOR HEIGHT/LENGTH

Area
2004 2005 2006 2007 2008 2009 2010 2011 2012 2013 2014 2015 Rank
Central Visayas 13.77 11.73 9.78 8.93 8.28 7.49 6.2 5.92 5.66 5.54 5.64 4.91
Provinces
Bohol 15.92 13.75 11.06 9.89 9.01 8.12 6.74 6.29 5.87 5.30% 5.03% 4.33% 4
Cebu 15.36 13.54 11.81 10.51 10.11 9.46 7.89 7.29 7.66 7.16% 8.16% 7.28% 1
Oriental Negros 15.84 14.72 12.71 11.88 11.57 11.31 8.71 8.26 7.13 7.36% 6.95% 6.95% 2
Siquijor 15.88 11.63 11.8 9.82 9.11 7.99 6.45 6.73 6.56 5.95% 5.21% 5.31% 3
Cities
Bais City 20.04 18.14 14.73 6.3 7.73 10.2 6.24 7.64 9.62 9.96% 11.46% 9.41% 2
Bayawan City 17.44 16.93 6.25 10.29 10.91 10.62 10.54 8.95 6.98 6.80% 6.58% 6.39% 3
Bogo City 2.97 1.66 3.66% 4.54% 2.39% 11
Carcar City 11.88 4.68 5.75% 5.72% 5.59% 4
Canlaon City 22.18 13.18 11.8 11.72 10.26 11.34 8.52 8.08 6.73 5.26% 4.72% 3.73% 8
Cebu City 11.22 9.1 7.89 7.35 6.36 5.68 4.37 4.43 4.35 3.71% 3.64% 3.30% 9
Danao City 12.97 3.92 3.45 2.87 1.88 1.71 3.84 3.32 2.24 5.77% 5.83% 4.49% 5
Dumaguete City 12.44 6.98 7.89 6.42 4.94 4.39 4.40 4.13 3.05 2.89% 2.78% 2.27% 13
Guihulngan City 12.41 9.32 10.24% 11.43% 10.29% 1
Lapu-lapu City 6.03 4.6 3.61 1.81 1.62 1.45 1.35 1.26 1.18 1.28% 1.34% 1.13% 16
Mandaue City 7.03 4.48 3.15 2.87 3.32 2.88 2.70 2.67 2.88 2.68% 2.54% 2.15% 15
Naga City 7.6 10.95 7.20% 6.81% 3.79% 7
Tagbilaran City 11.65 8.31 6.61 5.73 5 4.56 5.19 4.05 3.32 3.93% 3.72% 2.79% 10
Talisay City 13.85 11.49 12.19 16.35 7.07 2.99 2.00 2.39 2.49 2.17% 3.22% 2.23% 14
Tanjay City 13.36 11.84 7.33 6.46 6.5 6.42 4.04 3.49 5.82 4.73% 4.77% 4.39% 6
Toledo City 6.45 5.71 3.58 3.55 3.42 2.29 2.09 1.77 1.66 1.91% 2.15% 2.38% 12
Data source : DOH 7 OPT
Prepared by: Validated by: SUSAN Y. ORPILLA Approved by: PAROLITA A. MISSION, DPA. RN.
Nutrition Officer III, NNC Regional Nutrition Program Coordinator
NASUDI G. SOLUTA
Nutrition Officer II- NNC 7
Republic of the Philippines
Department of Health
NATIONAL NUTRITION COUNCIL REGION VII
TRENDS IN NUTRITION STATUS OF UNDERWEIGHT CHILDREN, CY 2004-2014
Pre School Children ( 0-71 months )
Prevalence rate