opportunity day ' 2009.ppt - set.or.th · pdf filethroughout the nation covering both...
TRANSCRIPT

1

OOpportunity Day
PREMIER MARKETING PUBLIC CO.,LTD.CO.,LTD.
2009 PERFORMANCE
2

A dAgenda COMPANY OVERVIEW
INDUSTRY OVERVIEW
FINANCIAL HIGHLIGHTS
FUTURE BUSINESS DIRECTION
SHARE PRICE PERFORMANCE
3

COMPANY OVERVIEWCOMPANY OVERVIEW
4

Business Group Structure
Premier Group Of Companies
Support Functions1. Accounting & Investment
2 Human Resources2. Human Resources
3. Corporate Core Value
4. Internal Audit
5 Communication & PR5. Communication & PR
Consumer Products
Business GroupFinancial Services
Business Group
Information Technology
Business Group
Trading & Manufacturing
Business Group
Real Estate Development
Business GroupNew Business
5

Premier VisionPremier Vision
กลุ่มบริษัทไทยที่เป็นผู้นําในการทาํธุรกิจที่ประสบความสาํเร็จ
ทัง้ในด้านสังคม องค์กร และ พนักงานทงในดานสงคม องคกร และ พนกงาน
เพื่อสร้างความสุขที่ยั่งยืนร่วมกัน
To be leading Thai conglomerate that drivesTo be leading Thai conglomerate that drives success of society, organization and staff to create sustainable and harmonious happiness
6

The Premier ValueThe Premier Value
The Premier Business ธรกจิก้าวหน้าThe Premier Business
The Premier People
ธุรกจกาวหนา
พนักงานมั่นคงp
The Premier Society สังคมยั่งยืน
“THE HARMONIOUS SUCCESS”
7

The Premier ValueThe Premier Value
ิ ้ ้ ั ั่ ั ั่ ืธุรกจิก้าวหน้า พนักงานมันคง สังคมยังยืนThe Harmonious Success
พนักงาน People สังคม Societyธุรกจิ Business
Good for Organization,
Good for SocietyGood for Our People
Customers and Shareholders
8
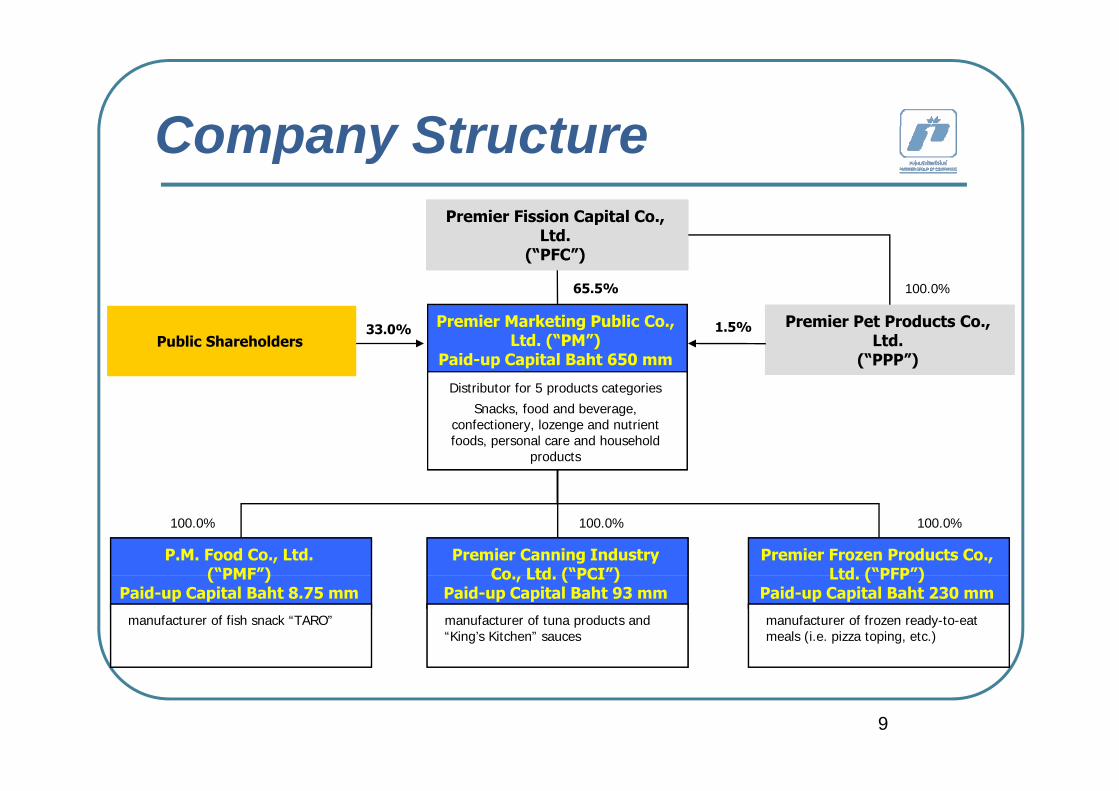
Company StructurePremier Fission Capital CoPremier Fission Capital Co
Company StructurePremier Fission Capital Co.,
Ltd.(“PFC”)
Premier Fission Capital Co., Ltd.
(“PFC”)
65.5% 100.0%
Public ShareholdersPublic Shareholders33.0% Premier Marketing Public Co.,
Ltd. (“PM”)Paid-up Capital Baht 650 mm
Premier Pet Products Co., Ltd.
(“PPP”)
Premier Pet Products Co., Ltd.
(“PPP”)
1.5%
Distributor for 5 products categoriesSnacks, food and beverage,
confectionery, lozenge and nutrient foods, personal care and household
products
P.M. Food Co., Ltd.(“PMF”)
Premier Canning Industry Co Ltd (“PCI”)
Premier Frozen Products Co., Ltd (“PFP”)
100.0% 100.0% 100.0%
( PMF )Paid-up Capital Baht 8.75 mm
Co., Ltd. ( PCI )Paid-up Capital Baht 93 mm
Ltd. ( PFP )Paid-up Capital Baht 230 mm
manufacturer of tuna products and “King’s Kitchen” sauces
manufacturer of frozen ready-to-eat meals (i.e. pizza toping, etc.)
manufacturer of fish snack “TARO”
9
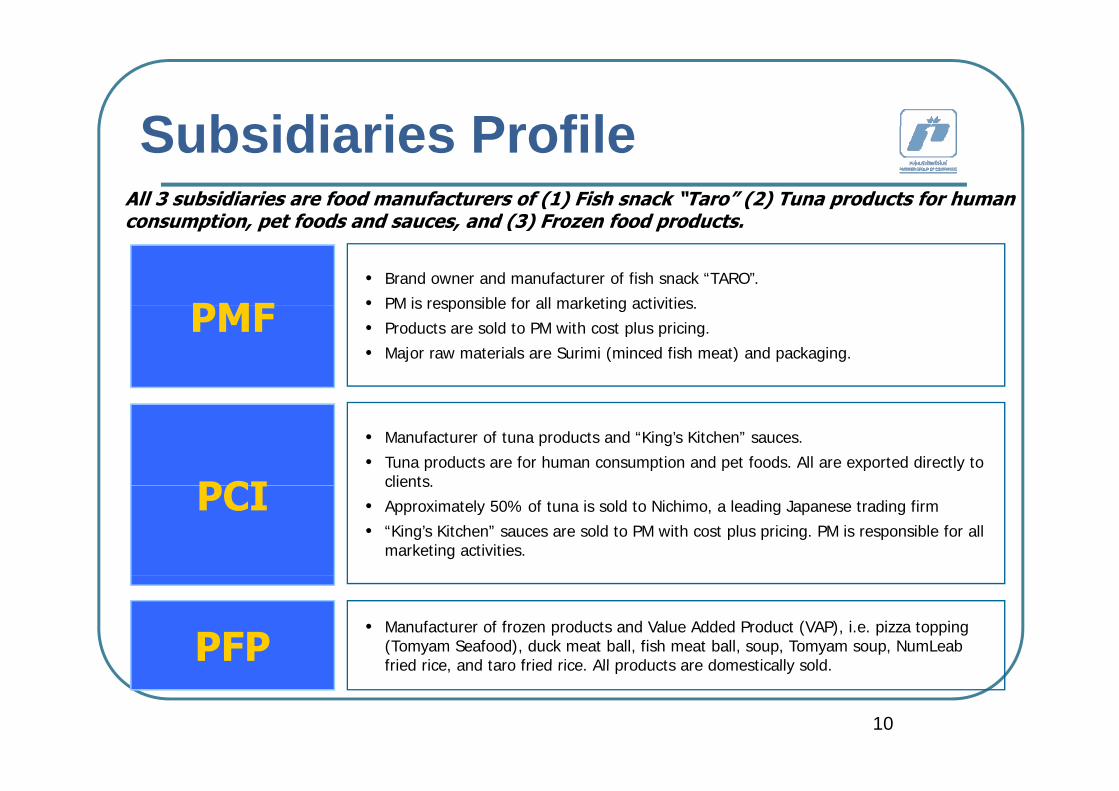
Subsidiaries ProfileAll 3 subsidiaries are food manufacturers of (1) Fish snack “Taro” (2) Tuna products for human
ti t f d d d (3) F f d d t
Subsidiaries Profileconsumption, pet foods and sauces, and (3) Frozen food products.
PMF• Brand owner and manufacturer of fish snack “TARO”.• PM is responsible for all marketing activitiesPMF • PM is responsible for all marketing activities.• Products are sold to PM with cost plus pricing.• Major raw materials are Surimi (minced fish meat) and packaging.
PCI
• Manufacturer of tuna products and “King’s Kitchen” sauces.• Tuna products are for human consumption and pet foods. All are exported directly to
clients.PCI clients.• Approximately 50% of tuna is sold to Nichimo, a leading Japanese trading firm• “King’s Kitchen” sauces are sold to PM with cost plus pricing. PM is responsible for all
marketing activities.
PFP• Manufacturer of frozen products and Value Added Product (VAP), i.e. pizza topping
(Tomyam Seafood), duck meat ball, fish meat ball, soup, Tomyam soup, NumLeab fried rice and taro fried rice All products are domestically sold
10
fried rice, and taro fried rice. All products are domestically sold.
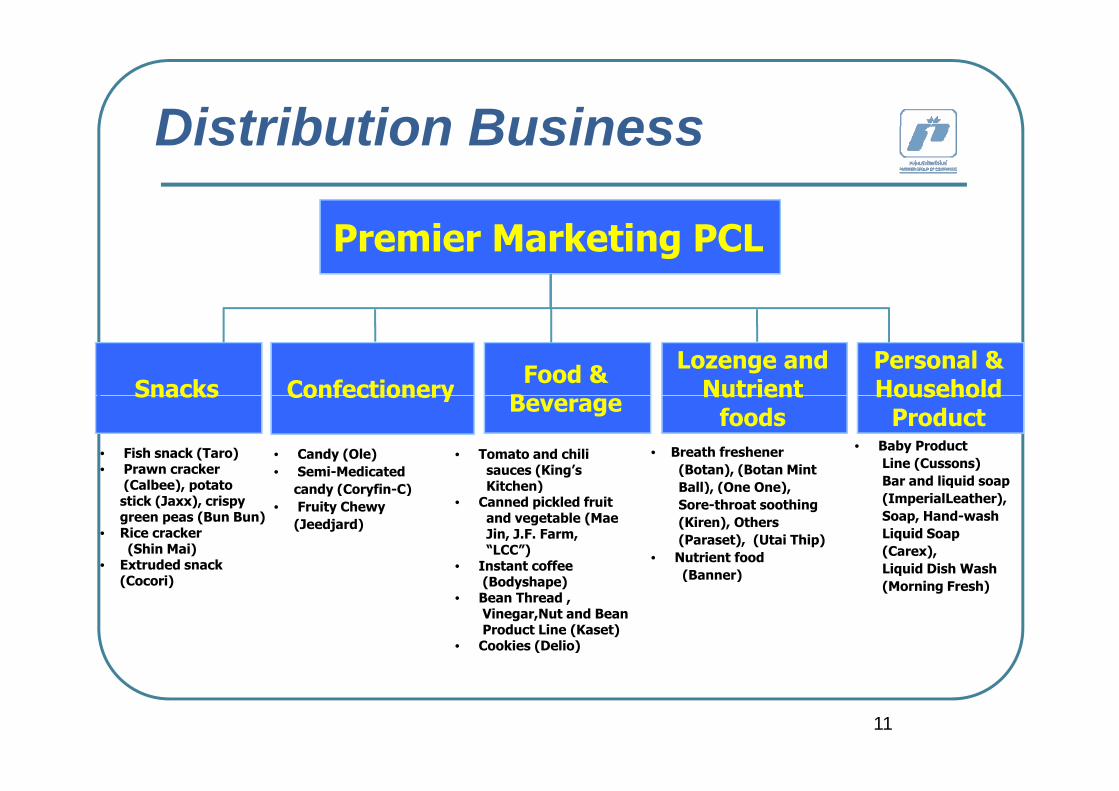
Distribution BusinessDistribution Business
Premier Marketing PCL
Snacks Confectionery Food & B
Lozenge and Nutrient
Personal & HouseholdSnacks Confectionery Beverage Nutrient
foodsHousehold
Product• Fish snack (Taro)• Prawn cracker
(Calbee) potato
• Candy (Ole)• Semi-Medicated
d (C fi C)
• Tomato and chili sauces (King’s Kitchen)
• Breath freshener (Botan), (Botan Mint Ball) (One One)
• Baby Product Line (Cussons) Bar and liquid soap(Calbee), potato
stick (Jaxx), crispy green peas (Bun Bun)
• Rice cracker (Shin Mai)
• Extruded snack
candy (Coryfin-C)• Fruity Chewy
(Jeedjard)
Kitchen)• Canned pickled fruit
and vegetable (Mae Jin, J.F. Farm, “LCC”)
• Instant coffee
Ball), (One One), Sore-throat soothing (Kiren), Others (Paraset), (Utai Thip)
• Nutrient food (Banner)
Bar and liquid soap (ImperialLeather), Soap, Hand-wash Liquid Soap (Carex),Liquid Dish Wash
(Cocori) (Bodyshape)• Bean Thread ,
Vinegar,Nut and Bean Product Line (Kaset)
• Cookies (Delio)
(Banner) q(Morning Fresh)
11

Distribution ChannelsDistribution Channels
1. Modern Trade
Distribution Channels Distribution Channels Nationwide OutletsNationwide Outlets
• Direct distribution to more than 30,000 outlets throughout the nation covering both modern Supermarket, Hypermarket,
Convenience store, and Gas station store by delivering to clients’ Distribution Centers
throughout the nation covering both modern trade retailers and traditional channels
• In 2009, Bangkok metropolitan and suburb areas represented 62.4% of PM sales and
2. Traditional TradeWholesalers and Local
37.6 % for upcountry
Supermarkets
3. Cash VanDirect visits to small retail shops,
Up-country37.6 %
Bangkok
Metropolitan62.4 %
orders are taken and goods delivered from company sales van
12

INDUSTRY OVERVIEWINDUSTRY OVERVIEW
13
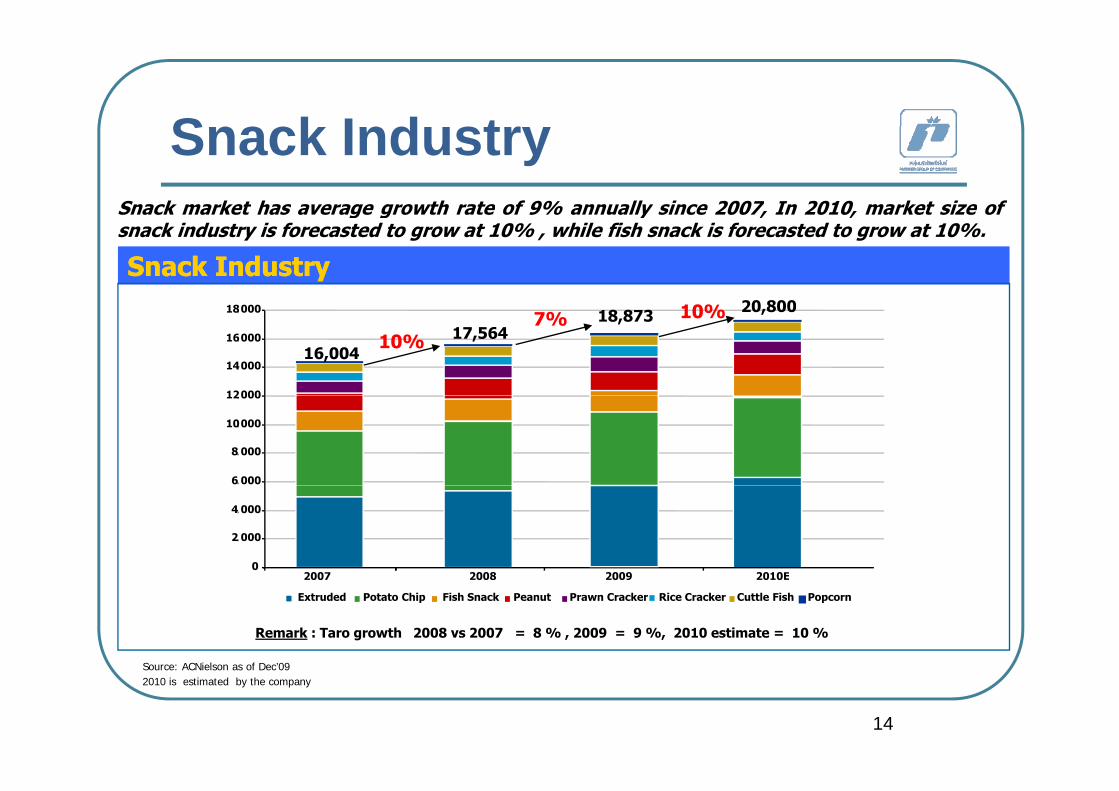
S k I d tSnack market has average growth rate of 9% annually since 2007, In 2010, market size of
Snack Industryg g y , ,
snack industry is forecasted to grow at 10% , while fish snack is forecasted to grow at 10%.
Snack IndustrySnack Industry18000 20 80010%
12000
14, 000
16, 000
18, 000
16,00417,564
7% 18,873
10%
20,80010%
6, 000
8, 000
10, 000
12, 000
0
2, 000
4, 000
2010E2007 2008 2009
Source: ACNielson as of Dec’09
Extruded Potato Chip Fish Snack Peanut Prawn Cracker Rice Cracker Cuttle Fish Popcorn
2010E2007 2008 2009
Remark : Taro growth 2008 vs 2007 = 8 % , 2009 = 9 %, 2010 estimate = 10 %
14
Source: ACNielson as of Dec’092010 is estimated by the company
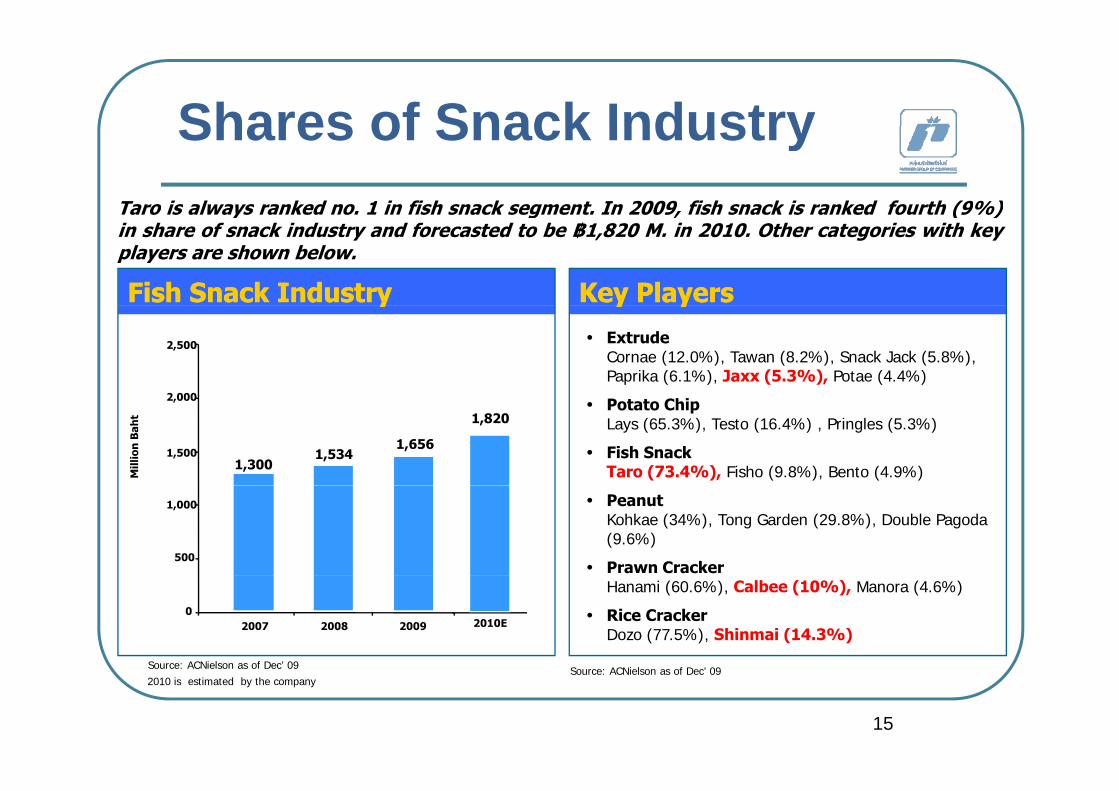
Shares of Snack IndustryTaro is always ranked no. 1 in fish snack segment. In 2009, fish snack is ranked fourth (9%)
Shares of Snack Industryy g , ( )
in share of snack industry and forecasted to be ฿1,820 M. in 2010. Other categories with keyplayers are shown below.
Key PlayersKey PlayersFish Snack IndustryFish Snack Industry y yy y• Extrude
Cornae (12.0%), Tawan (8.2%), Snack Jack (5.8%), Paprika (6.1%), Jaxx (5.3%), Potae (4.4%)
yy
2 000
2,500
• Potato ChipLays (65.3%), Testo (16.4%) , Pringles (5.3%)
• Fish SnackTaro (73.4%), Fisho (9.8%), Bento (4.9%)M
illio
n B
aht
1,656
1,820
1,3001,5341,500
2,000
• PeanutKohkae (34%), Tong Garden (29.8%), Double Pagoda (9.6%)
• Prawn Cracker500
1,000
Hanami (60.6%), Calbee (10%), Manora (4.6%)
• Rice CrackerDozo (77.5%), Shinmai (14.3%)
Source: ACNielson as of Dec’ 09
020092007 2008 2010E
15
Source: ACNielson as of Dec’ 09Source: ACNielson as of Dec 092010 is estimated by the company
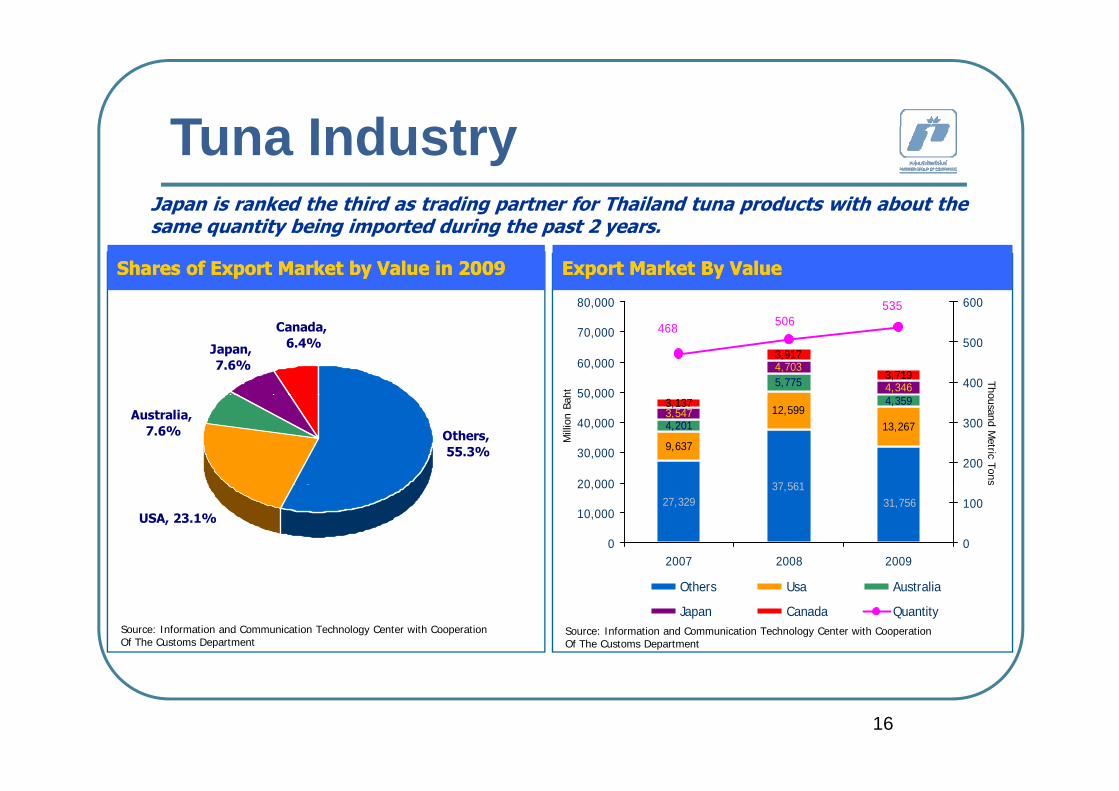
T I d tJapan is ranked the third as trading partner for Thailand tuna products with about the
Tuna Industrysame quantity being imported during the past 2 years.
Shares of Export Market by Value in Shares of Export Market by Value in 20092009
53580,000 600
Export Market By ValueExport Market By Value
Canada, 6.4%Japan,
7.6%5,7754,703
4,346
3,917
3,719
535506468
50 000
60,000
70,000
80,000
400
500
600
ht
Tho
Others, 55.3%
Australia, 7.6%
37 561
9,637
12,59913,2674,201
4,3593,5473,137
20 000
30,000
40,000
50,000
200
300
Mill
ion
Bah ousand M
etric Tons
USA, 23.1%27,329
37,56131,756
0
10,000
20,000
2007 2008 20090
100
Source: Information and Communication Technology Center with CooperationOf The Customs Department
Others Usa Australia
Japan Canada QuantitySource: Information and Communication Technology Center with CooperationOf The Customs Department
16

FINANCIAL HIGHLIGHTSFINANCIAL HIGHLIGHTS
17
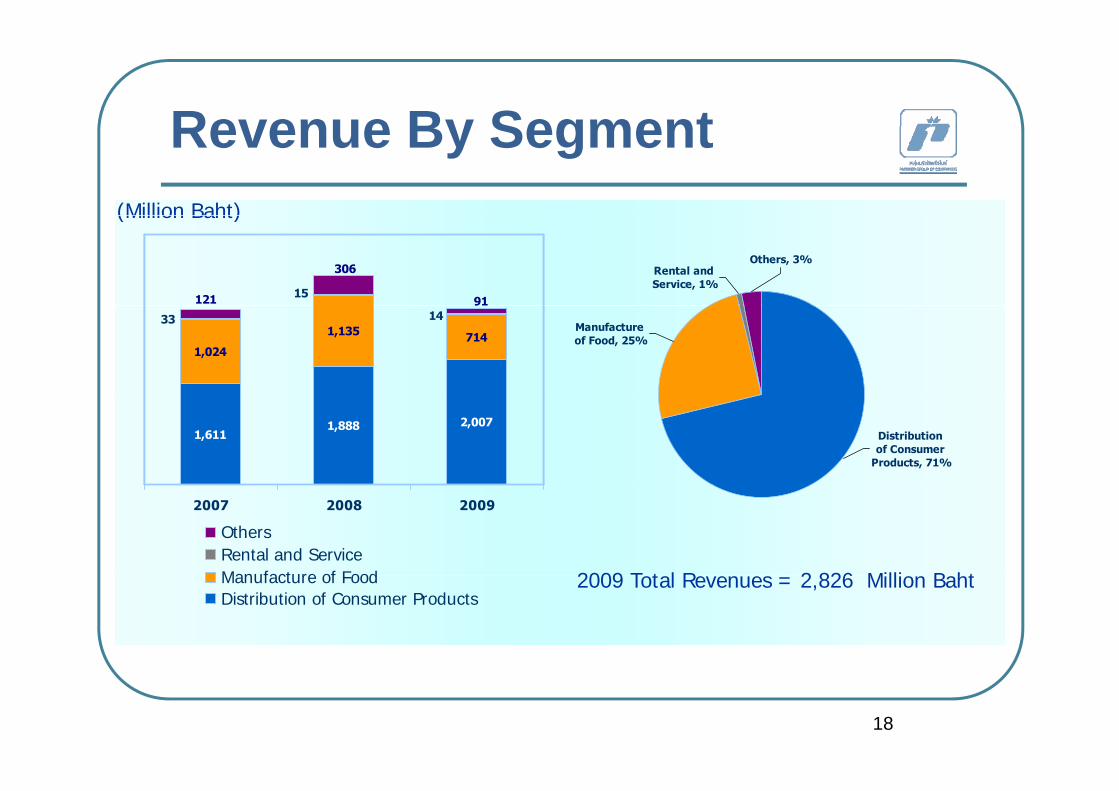
Revenue By SegmentRevenue By Segment(Million Baht)
Others, 3%Rental and Service, 1%
15
306
121 91
(Million Baht)
Manufacture of Food, 25%
1,024
1,135 71433 14
Distribution of Consumer
Products, 71%
1,6111,888 2,007
2009 T t l R 2 826 Milli B ht
2007 2008 2009
OthersRental and ServiceManufacture of Food 2009 Total Revenues = 2,826 Million BahtManufacture of FoodDistribution of Consumer Products
18
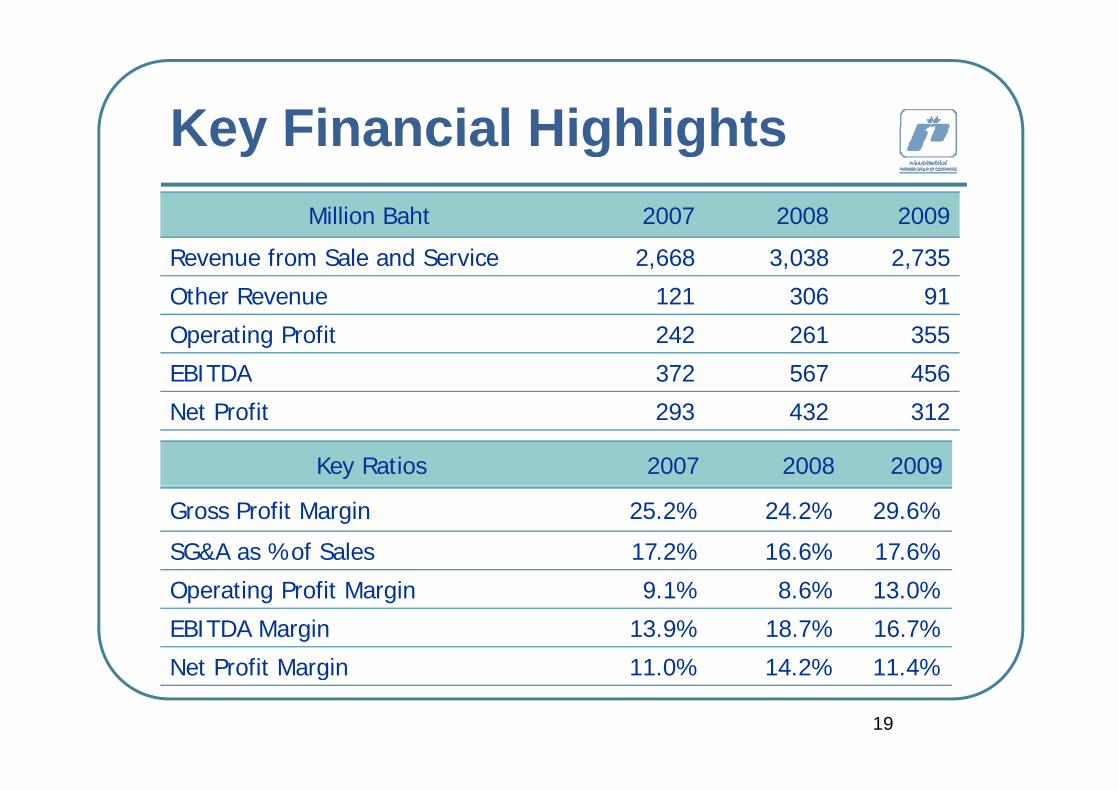
Key Financial HighlightsKey Financial HighlightsMillion Baht 2007 2008 2009Million Baht 2007 2008 2009
Revenue from Sale and Service 2,668 3,038 2,735
Other Revenue 121 306 91
Operating Profit 242 261 355
EBITDA 372 567 456
Net Profit 293 432 312
Key Ratios 2007 2008 2009
Gross Profit Margin 25.2% 24.2% 29.6%
SG&A as %of Sales 17.2% 16.6% 17.6%
Operating Profit Margin 9.1% 8.6% 13.0%
EBITDA Margin 13.9% 18.7% 16.7%
Net Profit Margin 11 0% 14 2% 11 4%
19
Net Profit Margin 11.0% 14.2% 11.4%

P f5,000
100.0%
PerformanceSales and Service & Gross Margin Operating Profit & Margin
242 261
355
200
300
400
500
40.0%
60.0%
80.0%
100.0%
2,6683,038
2,735
24.2%25.2%29.6%2,000
3,000
4,000
40.0%
60.0%
80.0%
00.0%Sales and Service & Gross Margin Operating Profit & Margin
ht)
8.6%9.1%13.0%
0
100
200
2007 2008 2009
0.0%
20.0%
40.0%
0
1,000
2007 2008 2009
0.0%
20.0%
(Mill
ion
Ba
Operating Profit Operating Profit MarginSale and Service Gross Margin
600 100 0%Net Profit & Margin
293
432
312300
400
500
600
40.0%
60.0%
80.0%
100.0%
14.2%11.0%11.4%
0
100
200
2007 2008 2009
0.0%
20.0%
20
Net Profit Net Profit Margin

FUTURE BUSINESSFUTURE BUSINESS
DIRECTIONDIRECTION
21
F t B i Di tiFuture Business Direction
Develop more premium snack food product lines
Focus on quality / premium ready to eat items Focus on quality / premium ready-to-eat items
Seek additional trading partner for export g p pmarkets
Closer cooperation with existing business Closer cooperation with existing business partners for future expansion
Explore opportunities for joint venture & business acquisition
22
q

SHARE PRICE PERFORMANCE
23

Sh P i P fShare Price PerformanceYTD Sh P i P f
2.30
2.50
YTD Share Price Performance
1.70
1.90
2.10
)
1 10
1.30
1.50
1.70
30/12/2009
(Bah
t)
0 50
0.70
0.90
1.10 Close = 2.20 Bt.
0.50
Jan-09 Feb-09 Mar-09 Apr -09 May-09 Jun-09 Jul-09 Aug-09 Sep-09 Oct-09 Nov-09 Dec-09
24

Q & AQ
DiscussionDiscussion
25