opportunities in optimization and control of wastewater
TRANSCRIPT

OPPORTUNITIES IN OPTIMIZATION AND CONTROL OF
WASTEWATER TREATMENT PLANTS
Dept. of Chemical Engineering
RIDVAN BERBER
Dept. of Chemical EngineeringFaculty of Engineering
Ankara University, Turkey
INNOVA-MED Course & Mediterranean Workshop“New Technologies of Recycling Non-conventional Water in Protected Cultivation”
28 April – 1 May 2008 Agadir, MOROCCO

Outline• ‘Process Systems Engineering’ ?• Optimization of ALTERNATING AEROBIC ANOXIC
systems• Control studies from the perspective of • Control studies from the perspective of
sludge control • Looking into the future

Process Systems Engineering (PSE)
A combination of computer aided decision support methods in
• Modelling• Simulation• Applied statistics• Design • Optimization• Control
for an essentially unlimited set of process; chemical, biological (i.e. environmental), food processing, pharmaceutical... systems

Problems that may be solved by PSE?!• WWTPs need to be operated continuously
despite large perturbations in • Pollution load• Flow
Constraints on effluent become tighter each yearConstraints on effluent become tighter each year• European Water Framework Directives
• Many plants are either controlled manually
or NOT operated!• ‘Data mining’
Abundant exp. data need to be interpreted

NOT AN EASY TASK !!!
• Complex plants with processes of different nature (chemical, biological, mechanical)
• Complicated dynamics (time constants within a very extensive range)
• Varying objectives• Frequently changing disturbances• Some information essential for the operation
cannot be quantified (smell, color, microbiological quality)
• Measurement problems (unreliable sensors, vague info)

PROBLEM:
• ACHIEVE nitrification/denitrification
in a conventional activated sludge in a conventional activated sludge
system
designed for C removal only
�without installing new anoxic tank
�at optimal operating cost

ALTERNATING AEROBIC ANOXIC SYSTEMS AND THEIR OPTIMIZATION
Wastewater Aeration tank SettlerQiX in Qi + Qr
Treated waterTreated waterXat Qeff
COD eff
TNeff
SS eff
Qr, Xr
QwRecycled sludge Excess sludge
SEQUENTIAL AERATION
(on/off)
AAA ACTIVATED SLUDGE SYSTEM

SCOPEAlternating Aerobic-Anoxic (AAA) systems
(carbon and nitrogen removal)
Main operational cost is due to energy used by the aeration equipment(operated consecutively as nonaerated/aerated manner)
Energy optimization is sought
by minimizing the
aerated fraction of total operation time
A nonA nonA nonA nonA nonA nonA nonA non--------trivial trivial trivial trivial trivial trivial trivial trivial dynamic optimization problemdynamic optimization problemdynamic optimization problemdynamic optimization problemdynamic optimization problemdynamic optimization problemdynamic optimization problemdynamic optimization problem

STEPS OF THE STUDYSelection of– Activated sludge model (ASM-3)– Settler model (Vitasovic, 10 layers)
• Settling velocity model (Takacs)• Settling velocity model (Takacs)
Mass balances; a general dynamic model for activated sludge systemSimulation for start-up period Optimal aeration profile for normal operation period

ACTIVATED SLUDGE MODEL No. 3(Gujer et al. 1999)
Correction for defects in ASM No.1Storage of readily biodegradable substrateLess dominating importance of hydrolysisSeparation of conversion processes for Separation of conversion processes for heterotrophs and autotrophs in aerobic and anoxic stateAlkalinity correction in nitrification rate
13 components (soluble and particulate)
12 processes

ASM3’de KOĐ AKIŞI
ASM-3 CONVERSION PROCESSES
SNH XA XI
SO SO
Endogenousrespiration
Growth
Autotrophic bacteria
Heterotrophic bacteriaASM3’de KOĐ AKIŞI
SOSOSO
XS SS XSTOX
HX
IEndogeneousrespiration
GrowthHydrolysis Storage
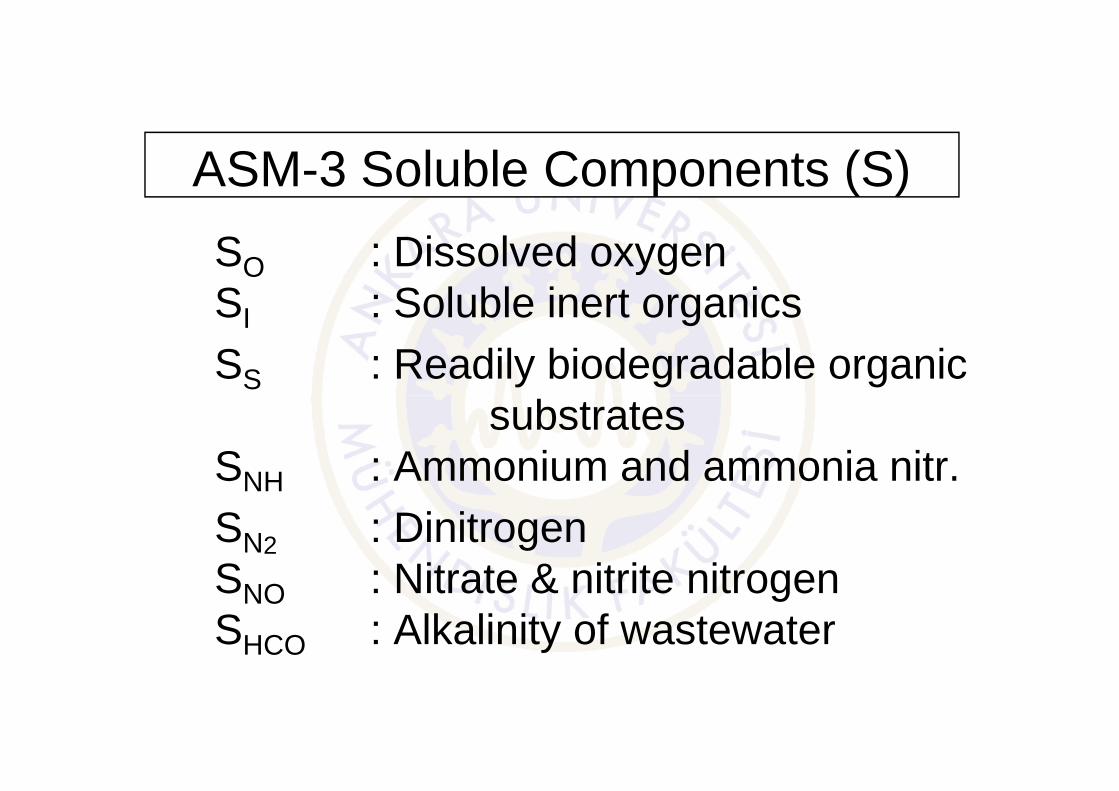
ASM-3 Soluble Components (S)
SO : Dissolved oxygenSI : Soluble inert organicsSS : Readily biodegradable organic
substratessubstratesSNH : Ammonium and ammonia nitr.SN2 : DinitrogenSNO : Nitrate & nitrite nitrogenSHCO : Alkalinity of wastewater

ASM-3 Particulate Components (X)
XI : Inert particulate organic materialXS : Slowly biodegradable substrates XH : Heterotrophic biomassXH : Heterotrophic biomassXSTO : Organics stored by
heterotrophsXA : Nitrifiying autotrophic biomass XTS : Total suspended solids

MASS BALANCES AROUND ACTIVATED SLUDGE SYSTEM
iat
atirsin
rsirs
iniin
ati R
V
XQQXQXQ
dt
dX+
+−+=
)(
For non-aerated periods :
atVdt
)( atO
satOL SSak −+i
at
atirsin
rsirs
iniin
ati R
V
XQQXQXQ
dt
dX+
+−+=
)(
For aerated periods (dissolved oxygen incorporated):
i: components of ASM-3 rsiX from settling model

STATE VARIABLES
73 dimensional vector13 � Concentrations of ASM-3 components
in aeration tankin aeration tank7 solubles
6 particulates
60 � Concentrations of particulate componentsof ASM3 for each layer in settler

START-UP SIMULATION
With assumed constant aeration profile(0.9 hrs non-aerated / 1.8 hrs aerated)
for 20 days kLa : 4.5 h-1L
� Increase microorganism concentration� Improve settling � Determine initial values of state variables

ASM-3 variables during start-up
Heterotrophic organ.
Suspended solids
Heterotrophic organ.
Cell int. storageproducts
Inert. part. org. mat.

OPTIMIZATION PROBLEM
∑∑==
+=M
k
kkM
k
k babJ11
)(/min
s.t. mass balance equations
)()( Xfdt
dX 1=
)()( Xfdt
dX 2= aerated periods
nonaerated periods
s.t. mass balance equations
Soft
constraints

HARD CONSTRAINTS
Min. and max. lengths of non-aeration and aeration periodsTreated water discharge standards Total operation timeDissolved oxygen concentration

Darwin’s natural selection principle�Genes: durations for non-aerated / aerated
periods�Chromosome (individual) : an aeration profile
EVOLUTIONARY ALGORITHM (EA)
�Chromosome (individual) : an aeration profile�Population: pool of aeration profiles
Start from an initial populationEvaluate ‘fitness value’Create a new generation

GENETIC OPERATORS
SELECTION (ranking and roulette wheel)
CROSS-OVER (mixing two individuals)
MUTATION (creating a new individual)
ELITISM (adding the best parent individual ELITISM (adding the best parent individual to the new population)
CONSTRAINTS HANDLING METHODS Rejection of infeasible individuals
Penalizing infeasible individuals

EVOLUTIONARY ALGORITHMRejection of Infeasibles
START
Random initiation of population
NOGenes satisfy boundaries? Replacement of genes
YES
Parent population
i=1i=1NO
RUN MODEL RejectionChromosomes satisfy constraints?
i+1YES
Evaluate objective function New population
i>n? GA operatorsNOYES
STOP
Optimal chromosome
Elite

Optimal aeration profile (REJECTION)
1,5
2
2,5tim
e in
terv
al (h
r)
0
0,5
1
1,5
1 2 3 4 5 6 7 8 9 10 11 12 13 14 15
periods
time
inte
rval
(hr)
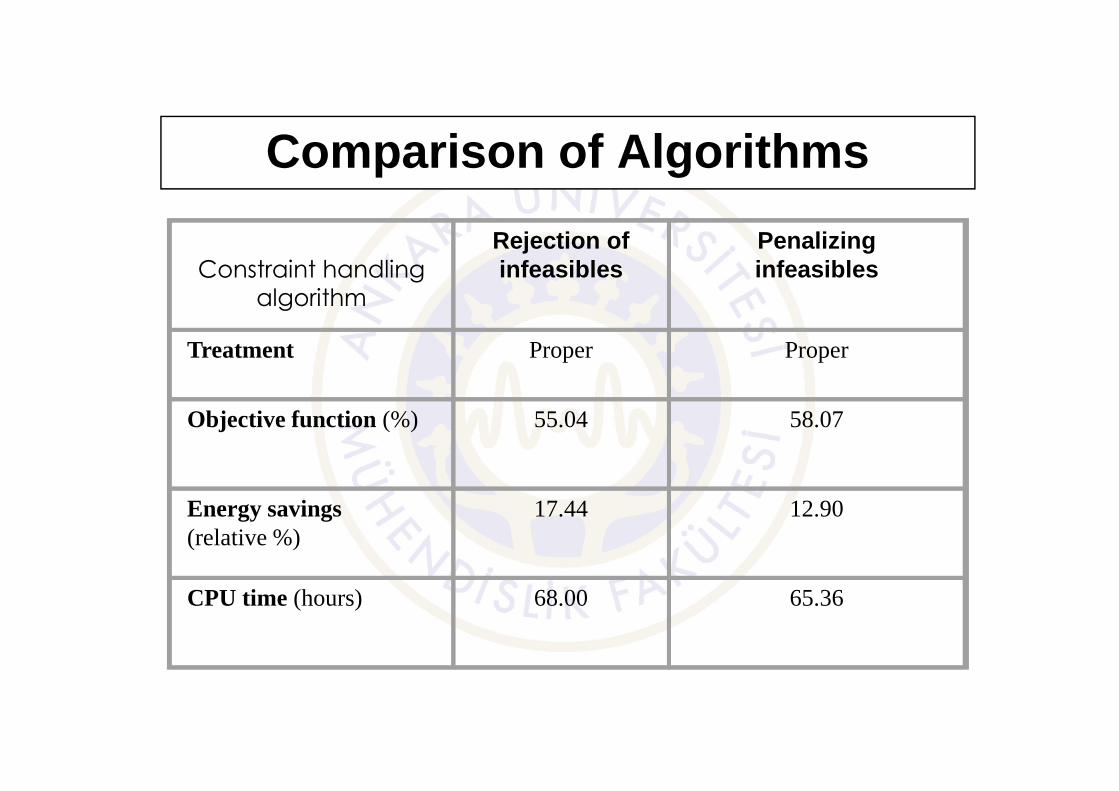
Comparison of Algorithms
Constraint handling algorithm
Rejection of infeasibles
Penalizing infeasibles
Treatment Proper Proper
Objective function (%) 55.04 58.07
Energy savings(relative %)
17.44 12.90
CPU time (hours) 68.00 65.36

ASM3 Components in Aeration Tank by optimal aeration profile
Cell internal storage product of heterotrophic organisms
Nitrifiying autotrophic organisms
Slowly biodegradable substrates
Inert soluble organic material
Readily biodegradable organic substrates

Operation results by optimal aeration profile _1
Sno : NO2 & NO3 NShco: alkalinitySnh : ammonia nitrogenSo : dissolved oxygen

Operation results by optimal aeration profile _2
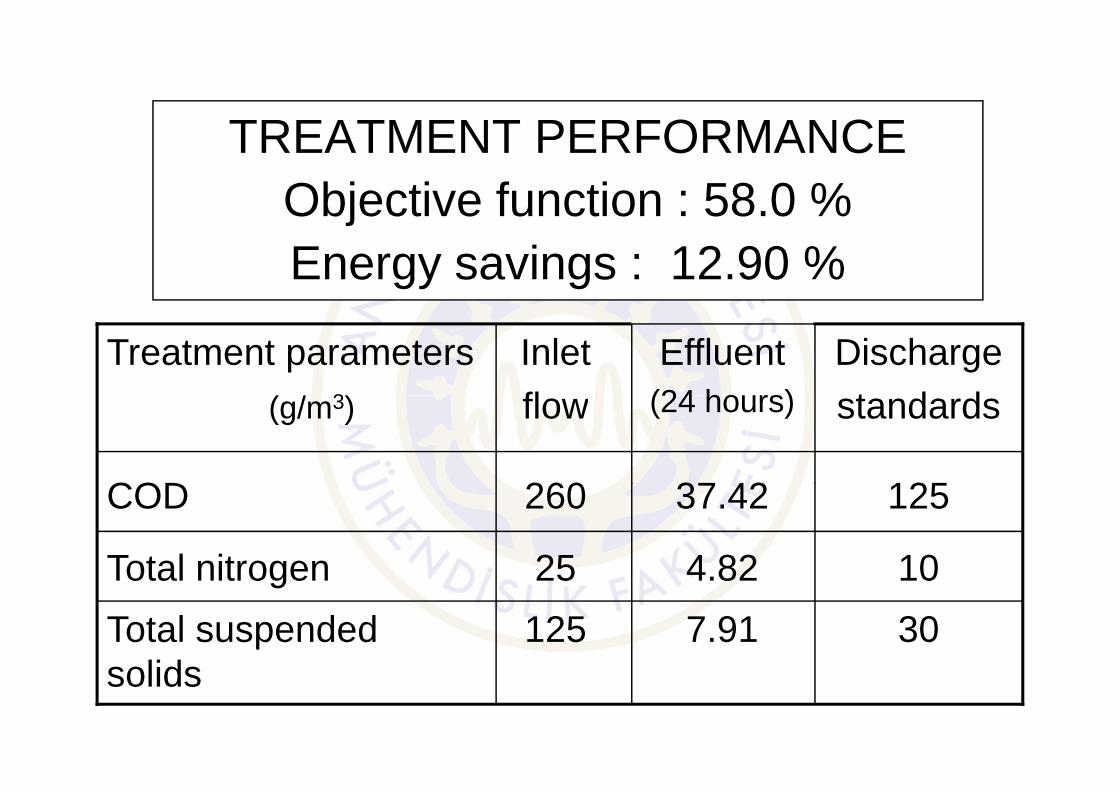
TREATMENT PERFORMANCEObjective function : 58.0 %Energy savings : 12.90 %
Dischargestandards
Effluent(24 hours)
Inletflow
Treatment parameters(g/m3)
307.91125Total suspended solids
104.8225Total nitrogen
12537.42260COD
standards(24 hours)flow(g/m3)

OVERALL EVALUATION
… holds promise for
• Nitrogen removal with no additional investment cost in existing plants
• Easy design and low investment cost for • Easy design and low investment cost for new plants
• Easy operation, and energy savings

Mountains of accumulating sludge …
Yet, another important problem, among others…
sludge …

Set point(Target)
Controller ConverterFinal Control
Element PROCESS
Measuring Device
Converter
+
-
Controlled variable
Manipulatedvariable
Converter
MODELLING...the first step
• ASM1• ASM2d• ASM3• COST Benchmark
• …
IWATask group

Controlled variables
• Dissolved oxygen conc.• Ammonia & nitrate conc.• MLSS concentration• ∆ (BOD)
• Aeration rate• Dilution rate• Internal recycle flow rate• Sludge recycle rate• External carbon dosing
Manipulated variables

This problem, recently unveiled by stricter regulations,can be tackled by a CARBON-BASED MODEL
ASM3cwhere
organic state variables are expresses organic state variables are expresses in terms of organic C.

Compound i � 1 2 3 4 5 6 7 8 9 10 11 12 13
Process j SO2 SI SS SNH4 SN2 SNOX SALK XI XS XH XSTO XA XSS
Expressed as� [O2] [TOC] [TOC] [N] [N] [N] [Mole] [TOC] [TOC] [TOC] [TOC] [TOC] [SS]1 Hydrolysis fsi x1 y1 z1 -1 -Ixs
Heterotrophic organisms
2 Aerobic storage of SS x2 -1 y2 z2 YSTO,O2 t2
3 Anoxic storage of SS -1 y3 -x3 x3 z3 YSTO,NOX t3
4 Aerobic growth of XH x4 y4 z4 1 -1/YH,O2 t4
5 Anoxic growth (denitrific.) y5 -x5 x5 z5 1 -1/YH,NOX t56 Aerobic endog. respiration x6 y6 z6 f1 -1 t67 Anoxic endog. respiration y7 -x7 x7 z7 f1 -1 t78 Aerobic respiration of XSTO x8 -1 t88 Aerobic respiration of XSTO x8 -1 t89 Anoxic respiration of XSTO -x9 x9 z9 -1 t9
Autotrophic organism10 Aerobic growth of XA x10 y10 1/YA z10 1 t1011 Aerobic endog. respiration x11 y11 z11 f1 -1 t1112 Anoxic endog. respiration y12 -x12 x12 z12 f1 -1 t12
Composition matrixkConservatives ik,l
1ThOD gThOD -1 Ithod,si
Ithod,ss -1.71 -4.57
Ithod,xi
Ithod,xs
Ithod,bm 3
Ithod,bm
2Nitrogen gN in,sı In,ss 1 1 1 In,xı In,xs In,bm In,bm
3Ionic charge Mole 1/14 1/14-1
4SS gSS iss,xi iss,xs iss,bm 1.80 iss,bm

0,00
5,00
10,00
15,00
20,00
25,00
0 1 2 3 4 5 6 7
Co
nce
ntr
atio
n (
mg
/lt)
Soluble compound for treated water
SO2
SI
SS
SNH4
SN2
SNOX
Salk
RESULTS OF SIMULATION STUDIES
Dissolved oxygenSoluble inertsTotal suspended solidsAmmonium nitrogenDinitrogen released Nitrite+nitrate nitrogenAlkalinity
0 1 2 3 4 5 6 7
kLa (1/h)
0,00
200,00
400,00
600,00
800,00
1000,00
1200,00
0 1 2 3 4 5 6
Org
anic
Car
bo
n (
mg
/lt)
kLa (1/h)
kLa vs carbon conc. in waste sludge
Q = 1000 m3/day, R = 0.988Sin = 19 mg/lt
Effect of aeration rate

0,00
2,00
4,00
6,00
8,00
10,00
12,00
14,00
16,00
18,00
20,00
0,7 0,75 0,8 0,85 0,9 0,95 1
Co
nce
ntr
atio
n (
mg
/lt)
Soluble compounds for treated water
Nitrite+nitrate nitrogen
Soluble inerts
Dissolved oxygen AlkalinityDinitrogen released Ammonium nitrogenTotal suspended solids
0,7 0,75 0,8 0,85 0,9 0,95 1
recycle ratio
0,00
200,00
400,00
600,00
800,00
1000,00
1200,00
0,7 0,75 0,8 0,85 0,9 0,95 1
Org
anic
car
bo
n (
mg
/lt)
recycle ratio
r vs carbon conc. in waste sludge
Série1
kLa = 4 1/h, Sin = 19 mg/ltQ = 1000 m3/day
.R ���� better as a
manipulated variablefor C control in sludge
Effect of sludge recycle

0,00
2,00
4,00
6,00
8,00
10,00
12,00
14,00
16,00
18,00
20,00
0 10 20 30 40 50 60 70
Co
nce
ntr
atio
n (
mg
/lt)
Substrat conc. (mg/lt)
Soluble compounds for treated water
substrat conc. vs carbon conc. in waste sludge
Nitrite+nitrate nitrogen
Soluble inerts
Dinitrogen released AlkalinityDissolved oxygen Ammonium nitrogenTotal suspended solids
0,00
200,00
400,00
600,00
800,00
1000,00
1200,00
1400,00
0 10 20 30 40 50 60 70
Co
nce
ntr
atio
n (
mg
/lt)
Substrat conc. (mg/lt)
substrat conc. vs carbon conc. in waste sludge
kLa = 4 1/h, R = 0.988Q = 1000 m3/day
Effect of CONCENTRATION changes in incoming wastewater

0,00
5,00
10,00
15,00
20,00
25,00
0 500 1000 1500 2000 2500
Co
nce
ntr
atio
n (
mg
/lt)
Influent flow rate of polluted water (m3/day)
Soluble compouds for treated water
Soluble inertsDinitrogen released
Nitrite+nitrate nitrogen
AlkalinityAmmonium nitrogenDissolved oxygen Total suspended solids
Influent flow rate of polluted water (m3/day)
0,00
200,00
400,00
600,00
800,00
1000,00
1200,00
0 500 1000 1500 2000 2500
Org
anic
car
bo
n (
mg
/lt)
Influent flow rate of polluted water (m3/day)
Flow rate vs carbon conc. in waste sludge
kLa = 4 1/h, R = 0.988Sin = 19 mg/lt
Effect of FLOW changes in incoming wastewater

CONCLUSION
• Tools available
• Team work needed(Model calibration, validation)
Close collaboration of industry/academiaClose collaboration of industry/academia
• Savings possible with advanced
optimization
• Integrated engineering approach necessary

OPTOPTIMIZATIONIMIZATION
CCONTROLONTROL
Targets
Disturbances
Measurements
THE FUTURE
PROPROCESSCESS
Manipulated variables
INTEGRATED PROCESS SYSTEMS ENGINEERING
Measurements

Work and contributions by • Şaziye Balku• Mehmet Yüceer • Evrim Akyürek• Đlknur Atasoy
are acknowledged
&&
THANKS FOR YOUR ATTENTION..