opportunities for combined heating and cooling a case ... · opportunities for combined heating and...
TRANSCRIPT

Opportunities for combined
heating and cooling
A case study from Nestle Halifax
Dave Pearson
Director of Innovation
Star Refrigeration Ltd

Why bother?
www.thisismoney.co.uk

Supply of energy
www.thisismoney.co.uk

Nestlé UK Halifax
The Nestlé UK Halifax site
covers approximately
3.0 hectares
In 2008 the site..
• Produced circa 30,000 tons of confectionery brands
• Multiple packaged glycol chillers with poor COPs utilised HCFC R22
• Was committed to the phase-out of R22 by 2010
• Generated 59,500 lb/hr (27,000kg/hr) of steam using coal fired boilers with
low efficiency levels, circa 56%
• Was the last in Nestlé Zone Europe to use coal combustion for steam
generation

Old Coal Fired Boiler House

Future Cooling Systems Options
Factory Production Process and Loads
A/C
2
A/C
3
A/C
4
A/C
5
A/C
6
A/C
7
Mou
ld 1
Mou
ld 2
Mou
ld 3
Aa
ste
d 1
Aa
ste
d 2
Aa
ste
d 3
Co
ole
rs 1
Co
ole
rs 2
Co
ole
rs 3
Tu
nn
el 1
Tu
nn
el 2
Tu
nn
el 3
Tu
nn
el 4
Co
ld S
tore
1
Co
ld S
tore
2
PH
E 1
PH
E 2
PH
E 3
A/C
1
0
100
200
300
400
500
600
Process
Du
ty k
W
Cooling
0.0
500.0
1000.0
1500.0
2000.0
2500.0
3000.0
1 15 29 43 57 71 85 99 113 127 141 155 169 183 197 211 225 239 253 267 281 295 309 323 337 351 365
Cooling
Refrigerants Policy
Natural Refrigerants = Ammonia
Central plant
Low charge design
Allowed radical re-design of
chilled glycol system
Allowed development of the concept to maximise the capture & use of waste heat
Future Heating Systems Options
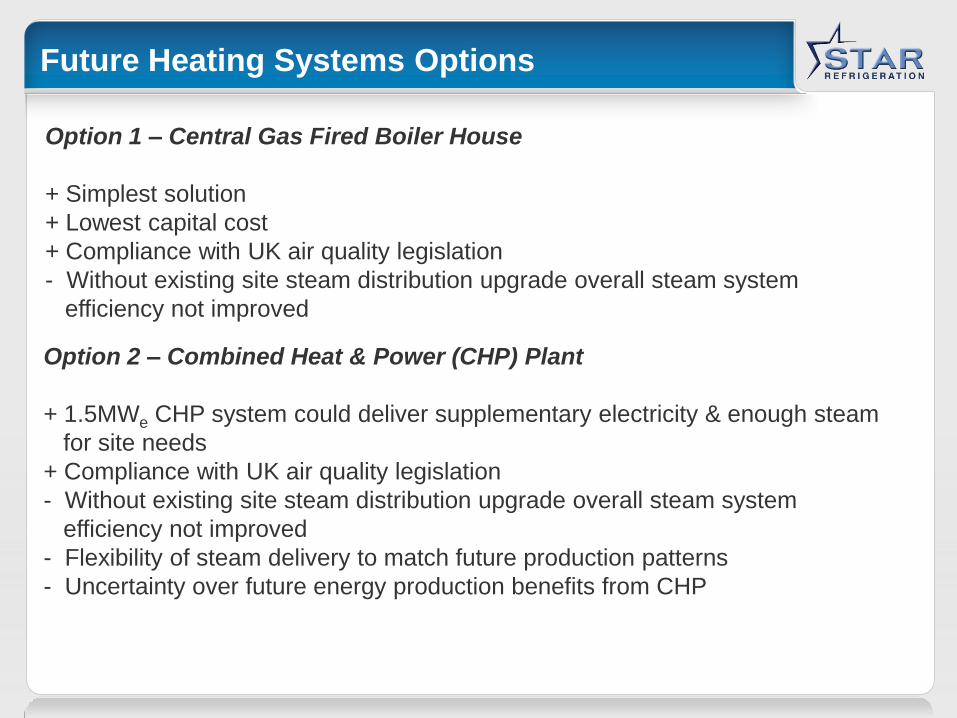
Option 1 – Central Gas Fired Boiler House
+ Simplest solution
+ Lowest capital cost
+ Compliance with UK air quality legislation
- Without existing site steam distribution upgrade overall steam system
efficiency not improved
Option 2 – Combined Heat & Power (CHP) Plant
+ 1.5MWe CHP system could deliver supplementary electricity & enough steam
for site needs
+ Compliance with UK air quality legislation
- Without existing site steam distribution upgrade overall steam system
efficiency not improved
- Flexibility of steam delivery to match future production patterns
- Uncertainty over future energy production benefits from CHP
Future Heating Systems Options
Future Heating Systems Options
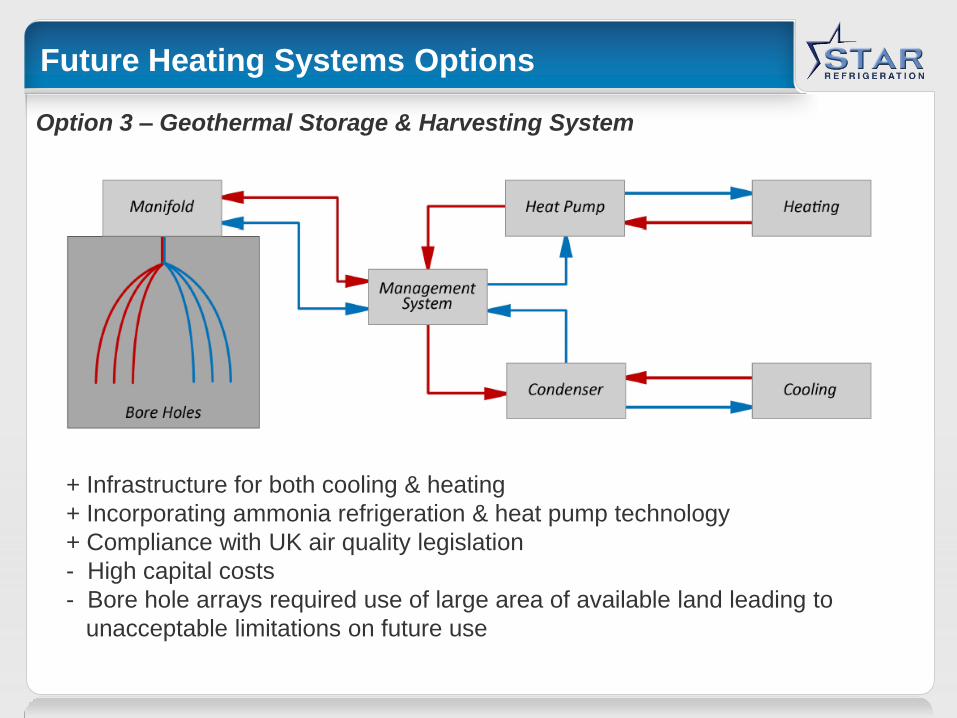
Option 3 – Geothermal Storage & Harvesting System
+ Infrastructure for both cooling & heating
+ Incorporating ammonia refrigeration & heat pump technology
+ Compliance with UK air quality legislation
- High capital costs
- Bore hole arrays required use of large area of available land leading to
unacceptable limitations on future use
Future Heating Systems Options
Option 4 – Steam Migration & Thermo Coupling
Steam Migration – moving from a single high grade steam generation source
to multi-temperature generation systems suited to end
user specific applications
Thermo Coupling – tying heat extracted at relative low temperature from site
cooling demand to high temperature needs via heat pump
technology

Future Heating Systems Options
Option 4 – Steam Migration & Thermo Coupling
Heat Load Duty Load % Temp. °C Temp L/M/H
Calorifiers
(823 kW) 33% 60- 90 M
Domestic
Hot Water (89 kW) 3% 50 - 60 L
CIP
Calorifiers (131 kW) 5% 80 – 90 M
Cookers (813 kW) 32% 120 – 125 H
Bowl
Washers (252 kW) 10% 60 – 90 M
Other (151 kW) 6% 60 – 90 M
Losses (277kW) 11% All LMH
TOTAL (2536 kW) 100% LMH

Assessment of Cooling & Heating Options
Technology Energy PVC
(15years) Qualitative Score
Central Gas Fired & R717
Chillers
5.26GJ/tonne £23,368k
15
CHP & R717 Chillers
7.87GJ/tonne £22,045k
19
Geothermal & Packaged
R717 Chillers
2.13GJ/tonne £17,197k
23
Migration & Thermal
Coupling
3.93GJ/tonne £20,243k
13

Old and New
Old Plant
Installed 1988
Cooling Capacity 18,435MBtu/hr @ +32oF
5.4MW @ 0oC
12off R22 DX packaged air cooled chillers
4off Fixed Speed Primary Glycol Pump
16off Fixed speed Secondary Pumps
Glycol +5degC to 0degC
COP Summer: 2.82
COP Winter: 3.8
New Plant
Installed 2010
Cooling Capacity 10,242MBtu/hr @ +32oF
3.0MW @ 0oC
Heating Capacity 4,267MBtu/hr @ 140oF
1.25MW @ +60C
1off Common Low Charge NH3 system
4x Screw Compressor PU’s incl x2 HP Units
VSD Primary and Secondary Pumps
4x Flat bed Air Cooled Condensers
1x Flat bed Air Cooled Oil Cooler
1x CIP and CL Waste Heat Recover PU
COP Cooling only: 4.0
COP Heating and Cooling: 6.38

Ammonia System P-H Diagram

Ammonia System Key Features
• Compressors matched to their primary function – cooling & heating or cooling
only
• Separate high grade heat recovery packaged units for „once through total
loss‟ loads and the „closed loop circuit‟ loads
• Ammonia screw compressors operating at high pressure
Circuit design developed with three levels of system allowable pressure:
1. 500psi (35bar) – heat pump compressors & heat recovery packages
2. 360psi (25bar) – cooling only compressors, condensers, economiser
3. 250psi (17bar) – PHE evaporators & surge drum set
• The compressor control strategy
• Low refrigerant charge
• Air-cooled condensers operating with VSD fans

Screw Compressor Packaged Units

New Ammonia Cooling and Heating Plantroom
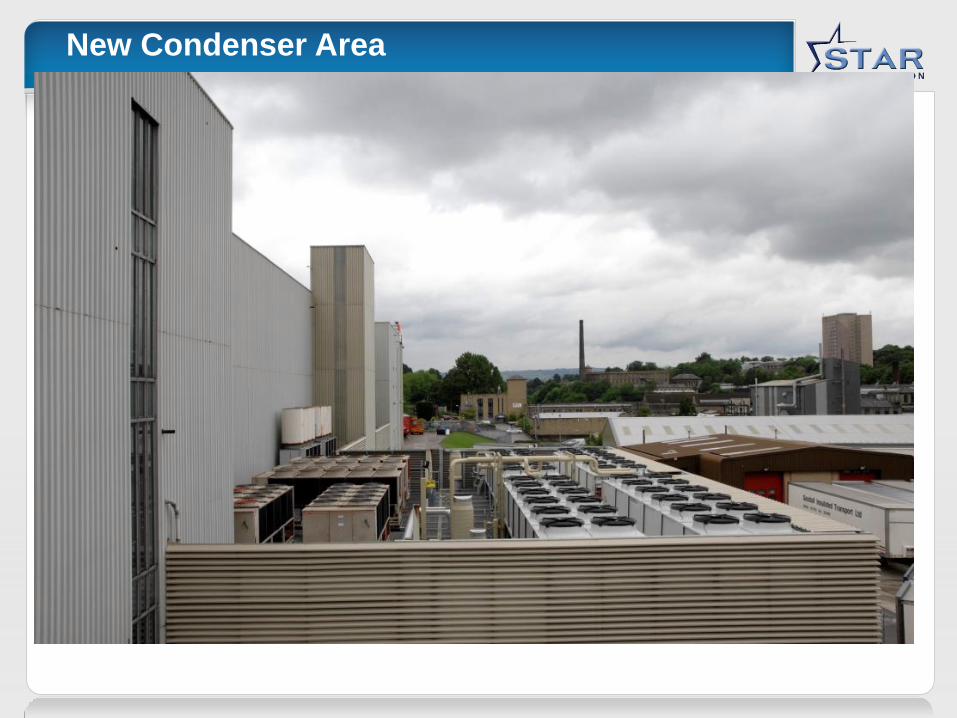
New Condenser Area

Food Factory Heating System
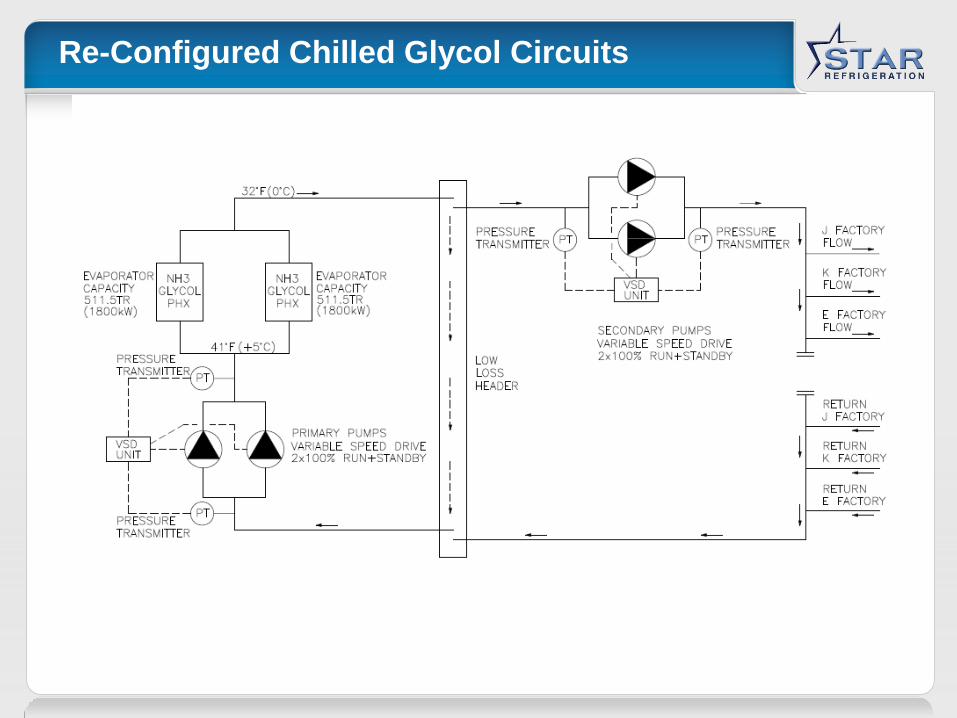
Re-Configured Chilled Glycol Circuits

The Heated Water Process Streams

CIP Hot Water Storage Tanks

Overall Operating Cost Benefit
2008 2011 Annual Reduction
Capital Investment $6,300,000
£4,200,000
Energy $2,700,000
£1,800,000
$1,290,000
£860,000
$1,410,000
£940,000
Operational Cost $570,000
£380,000
$120,000
£80,000
$450,000
£300,000
CO2 - CCL $495,000
£330,000
$247,500
£165,000
$247,500
£165,000
Water $108,000
£72,000
$70,500
£47,000
$37,500
£25,000
Total $3,765,000
£2,510,000
$1,657,500
£1,105,000
$2,145,000
£1,430,000
Exchange Rate assumed $1 = £1.50

Overall Environmental Benefits
2008 2011 Annual
Reduction
Annual
Reduction
%
Production Volume 31,900 tons (US)
29,000 tonnes
31,900 tons (US)
29,000 tonnes
Energy
per unit of
Production
5.422 MBtu/ton
5.20 GJ/tonne
3.013 MBtu/ton
2.89 GJ/tonne
2.429 MBtu/ton
2.33 GJ/tonne 45%
CO2 22,000 tons (US)
20,000 tonnes
10,615 tons (US)
9,650 tonnes
11,385 tons (US)
10,350 tonnes 52%
HCFC 2,605 lb
1,184 kg
304 lb
138 kg
2,301 lb
1046 kg 88%
Particulates 3,872 lb
1,760 kg
0 lb
0 kg
3,872 lb
1,760 kg 100%
Water 13,825,970 gal (US)
52,337 m3
9,094,385 gal (US)
34,426 m3
4,731,585 gal (US)
17,911 m3 34%

Post Installation Performance
The Ammonia plant is now providing 750kW of waste heat to pre-
heat towns water to the factory at +60degC whilst meeting the sites
process cooling demand
The new refrigeration plant showed a 39% reduction in power
consumption over the same 15 week calendar period between July and
October for 2009 and 2010.
In November 2010 site commissioned the Closed-Loop heating
circuits. More waste heat from the Ammonia plant is being utilised. It is
estimated the 250kW currently utilised is set to double in line with design
The site is on target to achieve the level of savings identified in the
cost benefit analysis
The capital cost of the project will be recovered within 4 years

UK Energy consumption
Figures from DECC, “UK Energy in brief, 2010”

UK uses of energy
Split out fuel used to
generate electricity
and remove the oil
used for transport
Then convert the fuel
to electricity………
30.5% of all energy use is
fossil fuel for heating, 18%
is electricity (some of which
is used for heating too!) Figures from DECC, “Digest of United Kingdom Energy Statistics, 2010”

Heating vs Cooling
About 1/9 of the electricity used is for refrigeration
and air-conditioning, including chillers. If we take
an average CoP of 2 for all systems then the heat
load is twice the electrical input.
All of the remaining fossil fuel and some of the
electricity is used for heating

Heating vs Cooling
It looks as if the demand for heating is about nine
times higher than the demand for cooling. The
market for heat pumps is huge!
At present heat pumps are being designed and sold
by refrigeration people – we need a bigger vision!
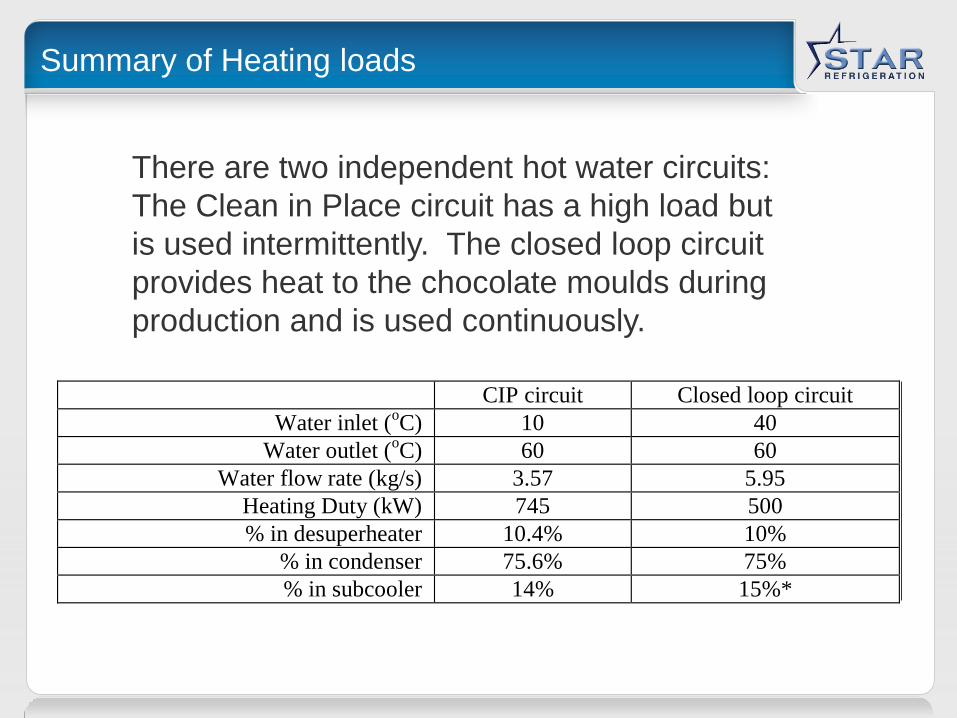
Summary of Heating loads
CIP circuit Closed loop circuit
Water inlet (oC) 10 40
Water outlet (oC) 60 60
Water flow rate (kg/s) 3.57 5.95
Heating Duty (kW) 745 500
% in desuperheater 10.4% 10%
% in condenser 75.6% 75%
% in subcooler 14% 15%*
There are two independent hot water circuits:
The Clean in Place circuit has a high load but
is used intermittently. The closed loop circuit
provides heat to the chocolate moulds during
production and is used continuously.
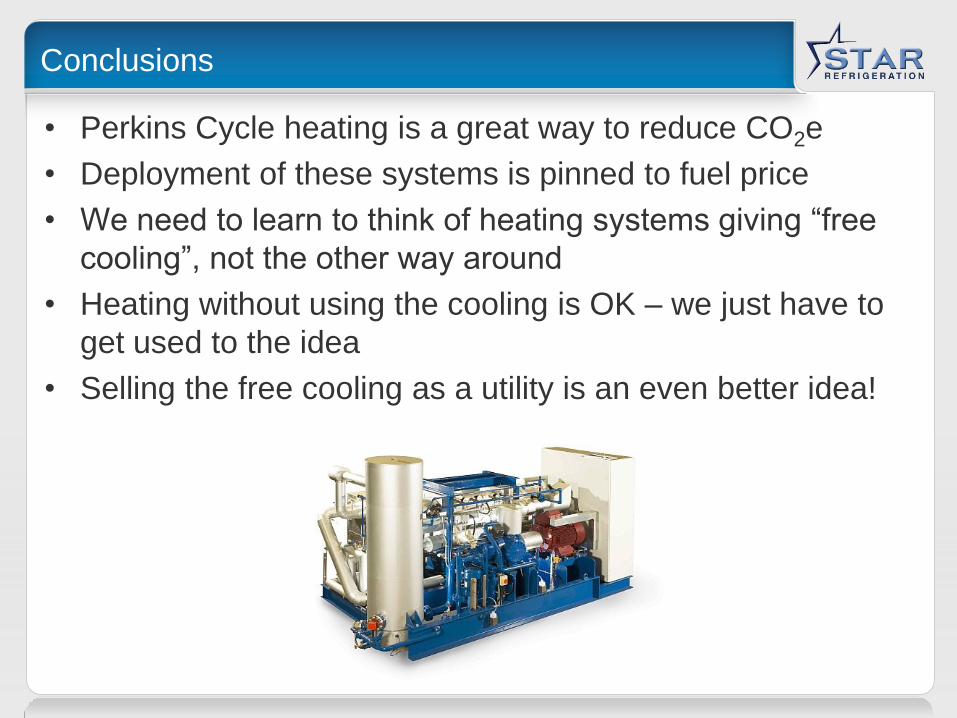
Conclusions
• Perkins Cycle heating is a great way to reduce CO2e
• Deployment of these systems is pinned to fuel price
• We need to learn to think of heating systems giving “free
cooling”, not the other way around
• Heating without using the cooling is OK – we just have to
get used to the idea
• Selling the free cooling as a utility is an even better idea!

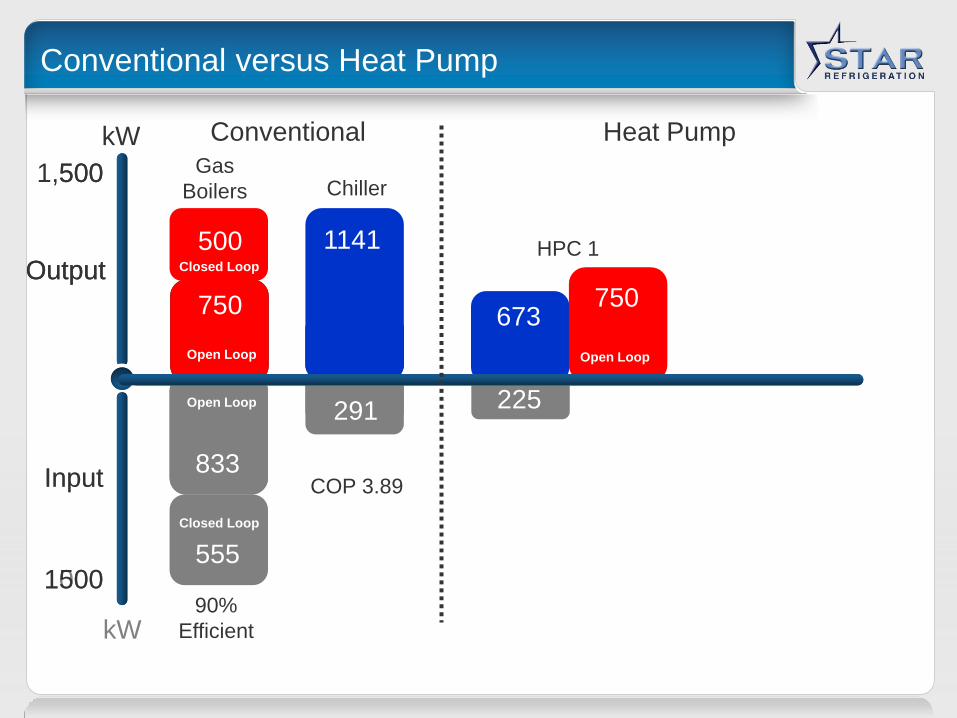
Conventional versus Heat Pump
500
Output
Input
1000
715
715
1xx
kW
kW
1,500
Input
1500
Open Loop
750
Gas
Boilers
Output

Conventional versus Heat Pump
500
Output
Input
1000
833 715
715
1xx
kW
kW
1,500
Input
1500
Open Loop
750
Gas
Boilers
Output

Conventional versus Heat Pump
500
Output
Input
1000
833
715
1xx
kW
kW
1,500
Output
Input
1500
Open Loop
750
500 Closed Loop
Gas
Boilers

Conventional versus Heat Pump
500
Output
Input
1000
833 715
715
1xx
kW
833
90%
Efficient
555
Open Loop
Open Loop
Closed Loop
kW
1,500
Output
Input
1500
750
500 Closed Loop
Gas
Boilers

Conventional versus Heat Pump
500
Output
Input
1000
833 715
715
8x 1xx
kW
833
90%
Efficient
555
Open Loop
Open Loop
Closed Loop
kW
1,500
Output
Input
1500
1141
Chiller
750
500 Closed Loop
Gas
Boilers

Conventional versus Heat Pump
500
Output
Input
1000
833 715
715
8x
1xx
1xx
kW
715 COP 3.89
291
833
90%
Efficient
555
Open Loop
Open Loop
Closed Loop
kW
1,500
Output
Input
1500
1141
Chiller
750
500 Closed Loop
Gas
Boilers

Conventional versus Heat Pump
kW
500
Output
Input
1000
833 715
715
8x
1xx
1xx
kW
715 COP 3.89
291
833
90%
Efficient
555
750
500 Closed Loop
Open Loop
Open Loop
Closed Loop
Gas
Boilers 1,500
Output
Input
1500
1141
Chiller
Conventional kW

Conventional versus Heat Pump
kW
500
Output
Input
1000
833 715
715
8x
1xx
1xx
kW
673
Heat Pump
715 COP 3.89
291
833
90%
Efficient
555
750
500 Closed Loop
Open Loop
Open Loop
Closed Loop
Gas
Boilers 1,500
Output
Input
1500
1141
Chiller
Conventional
HPC 1
kW

Conventional versus Heat Pump
500
Output
Input
1000
833 715
715
8x
1xx
1xx
kW
673
225
Heat Pump
715 COP 3.89
291
833
90%
Efficient
555
750
500 Closed Loop
Open Loop
Open Loop
Closed Loop
Gas
Boilers
kW
1,500
Output
Input
1500
1141
Chiller
Conventional
HPC 1
Conventional versus Heat Pump
500
Output
Input
1000
833 715
715
8x
1xx
1xx
kW
673
225
Heat Pump
750
715 COP 3.89
291
833
90%
Efficient
555
750
500 Closed Loop
Open Loop
Open Loop
Closed Loop
Gas
Boilers
kW
1,500
Output
Input
1500
1141
Chiller
Conventional
Open Loop
HPC 1

Conventional versus Heat Pump
500
Output
Input
1000
833 715
715
8x
1xx
1xx
kW
443
186
673
225
Heat Pump
750
715 COP 3.89
291
833
90%
Efficient
555
750
500 Closed Loop
Open Loop
Open Loop
Closed Loop
Gas
Boilers
kW
1,500
Output
Input
1500
1141
Chiller
Conventional
Open Loop
HPC 1
HPC 2

Conventional versus Heat Pump
500
Output
Input
1000
833 715
1xx
715
8x
1xx
1xx
kW
186 225
443 500 673
Heat Pump
750
715 COP 3.89
291
833
90%
Efficient
555
750
500 Closed Loop
Open Loop
Open Loop
Closed Loop
Gas
Boilers
kW
1,500
Output
Input
1500
1141
Chiller
Conventional
Closed Loop Open Loop
HPC 1
HPC 2
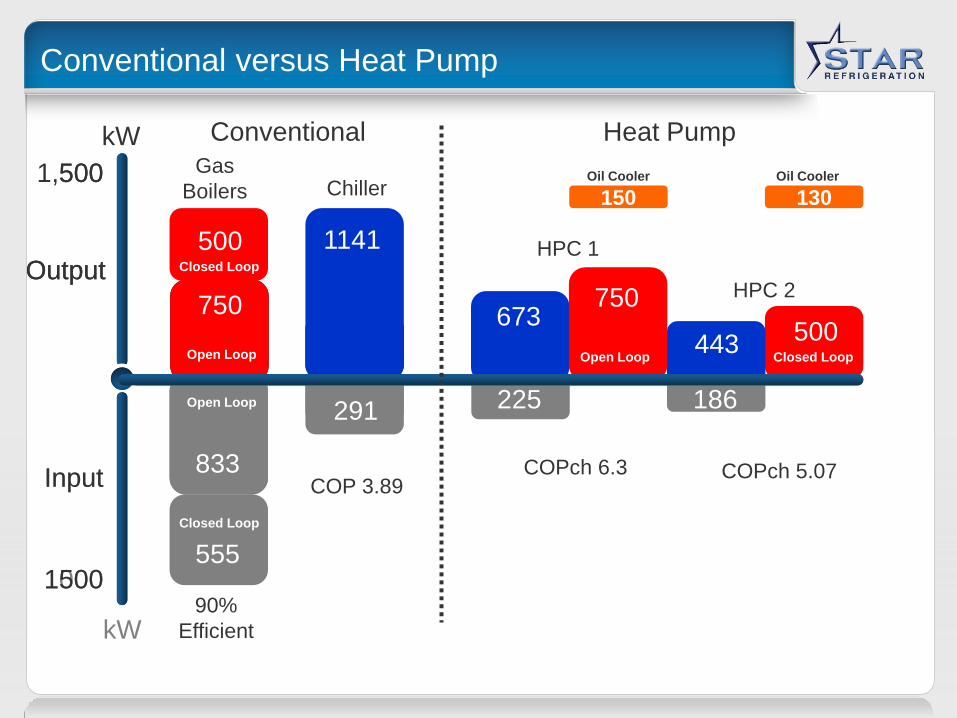
Conventional versus Heat Pump
500
Output
Input
1000
833 715
1xx
715
8x
1xx
1xx
kW
186 225
443 500 673
Heat Pump
750
715 COP 3.89
291
833
90%
Efficient
555
750
500 Closed Loop
Open Loop
Open Loop
Closed Loop
Gas
Boilers
kW
1,500
Output
Input
1500
1141
Chiller
Conventional
Closed Loop Open Loop
HPC 1
HPC 2
130 150 Oil Cooler Oil Cooler
COPch 6.3 COPch 5.07

Conventional versus Heat Pump
500
Output
Input
1000
833 715
1xx
715
8x
1xx
1xx
kW
£380 £459
443 500 673
Heat Pump
750
715 COP 3.89
£597
£600
90%
Efficient
£400
750
500 Closed Loop
Open Loop
Open Loop
Closed Loop
Gas
Boilers
kW
1,500
Input
1500
1141
Chiller
Conventional
Closed Loop Open Loop
HPC 1
HPC 2
130 150 Oil Cooler Oil Cooler
COPch 6.3 COPch 5.07
Output

Conventional versus Heat Pump
500
Output
Input
1000
715
1xx
715
8x 1xx
kW
443
£839
500 673
Heat Pump
750
£1594
750
500 Closed Loop
Open Loop
Gas
Boilers
kW
1,500
Output
Input
1500
1141
Chiller
Conventional
Closed Loop Open Loop
HPC 1
HPC 2
130 150 Oil Cooler Oil Cooler
Heat Pump
SAVES
£758day
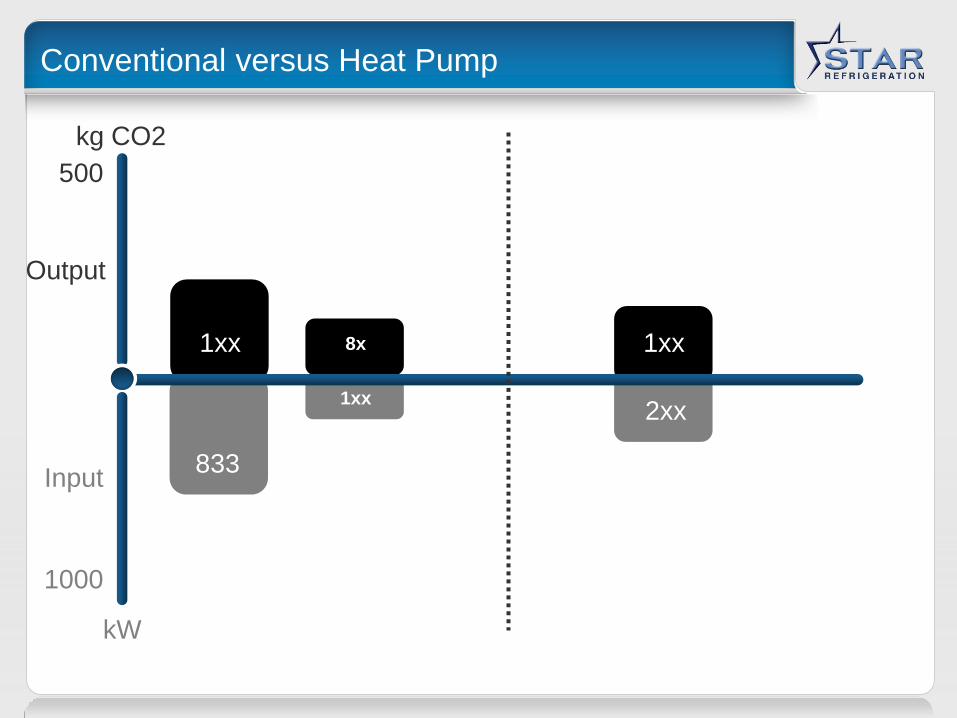
Conventional versus Heat Pump
kg CO2
500
Output
Input
1000
833 715
1xx
715
2xx
8x
1xx
1xx
kW

So what does the future of Ammonia look like?
Air Water
Chilled water +4C
Glycol -10°C
235kW – 857kW 218kW – 784kW
Adiabatic

Applications to be embraced not ignored

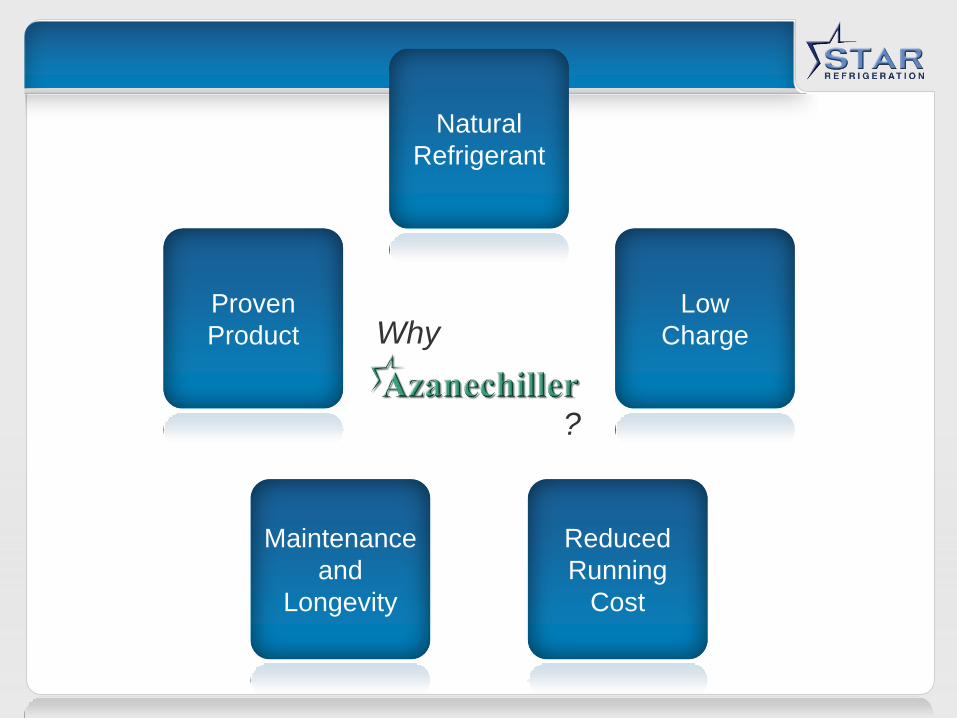
Natural
Refrigerant
Why Ammonia?
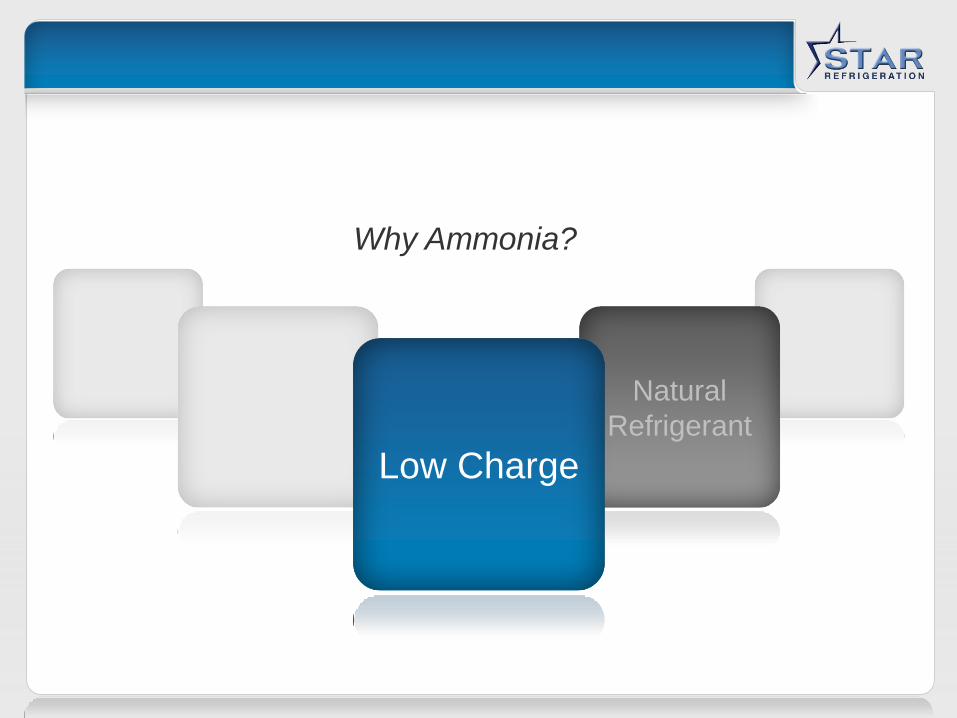
Natural
Refrigerant Natural
Refrigerant Low Charge
Why Ammonia?

Natural
Refrigerant
Natural
Refrigerant Low Charge
Low Charge Reduced
Running Cost
Why Ammonia?

Natural
Refrigerant
Natural
Refrigerant Low Charge
Low Charge Reduced
Running Cost Reduced
Running Cost
Maintenance
and Longevity
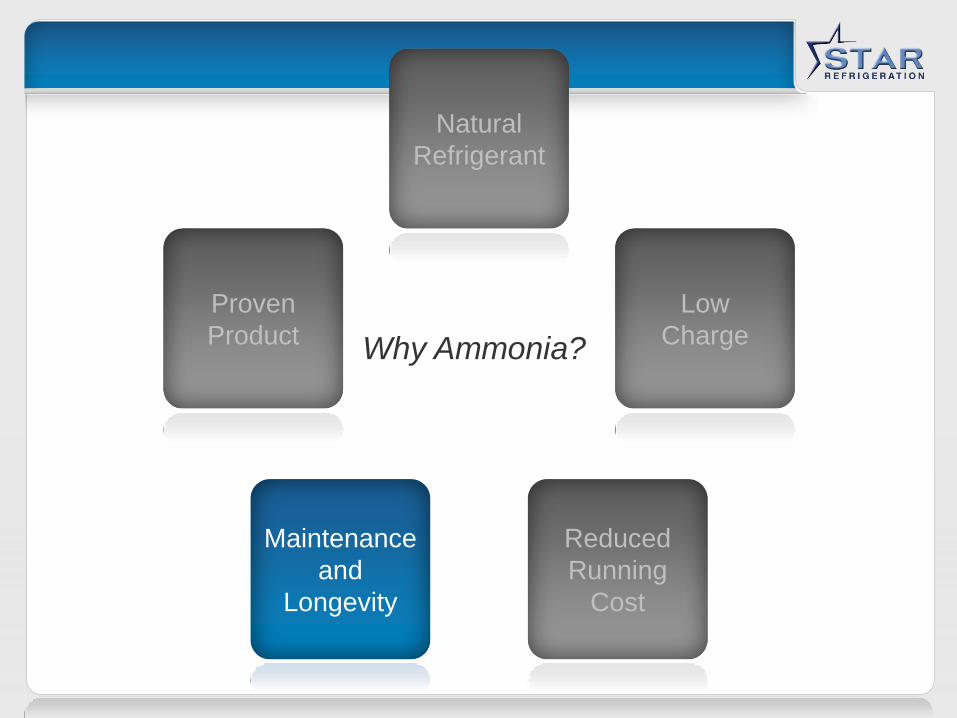
Why Ammonia?

Low Charge Reduced
Running Cost
Natural
Refrigerant Low Charge
Reduced
Running Cost
Maintenance
and Longevity
Natural
Refrigerant Maintenance
and Longevity
Proven
Product
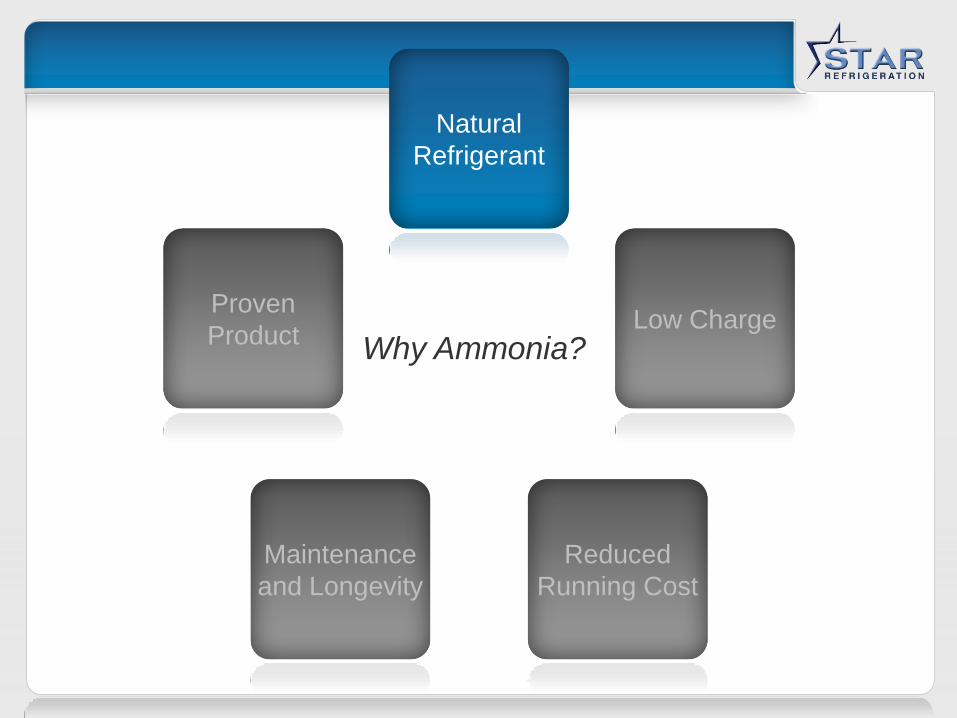
Why Ammonia?

Natural
Refrigerant
Proven
Product Low Charge
Maintenance
and Longevity
Reduced
Running Cost
Low Charge Reduced
Running Cost
Maintenance
and Longevity
Natural
Refrigerant Proven
Product

Maintenance
and Longevity
Reduced
Running Cost
Low Charge
Natural
Refrigerant
Proven
Product Why Ammonia?
Maintenance
and Longevity
Reduced
Running Cost
Low Charge
Natural
Refrigerant
Proven
Product Why Ammonia?
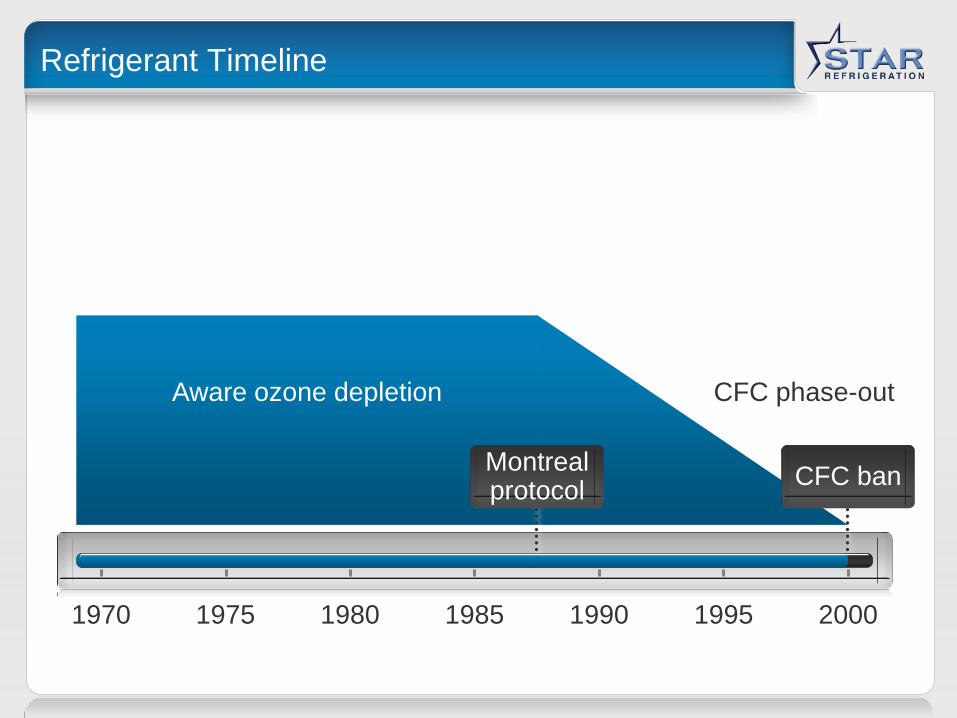
Refrigerant Timeline
1970 1975 1980 1985 1990 2000 1995
Aware ozone depletion CFC phase-out
Montreal protocol
CFC ban

1970 1975 1980 1985 1990 2000 1995
HCFCs
Aware ozone depletion
Montreal protocol
CFC ban
2005

HCFCs
1990 1995 2000 2005 2010 2020 2015
Montreal protocol
CFC ban
HCFCs
HCFC new systems
ban
HCFC ban
Virgin HCFC ban
£

HFCs
1990 1995 2000 2005 2010 2020 2015
Montreal protocol
CFC ban
HCFCs HFCs
Leakage
HCFC ban
R717 EU F-Gas
regs
" HFCs will only be used if other environmentally friendly alternatives
are not available“ - UK

Global Warming Potentials
GWP
R22 R134a R407C R410A
2000
0
1500
1000
500
R717

Ammonia Experience
6 x 550kW 2 x 1400kW 2 x 430kW 2 x 500kW
6 x 500kW 6 x 418kW
2 x 940kW 2 x 1250kW 2 x 670kW
2 x 3500kW
2 x 840kW 3 x 300kW 2 x 200kW
Whitehall
Place

Proven Product

Maintenance
and
Longevity
Reduced
Running
Cost
Natural
Refrigerant
Proven
Product
Low
Charge Why Ammonia?
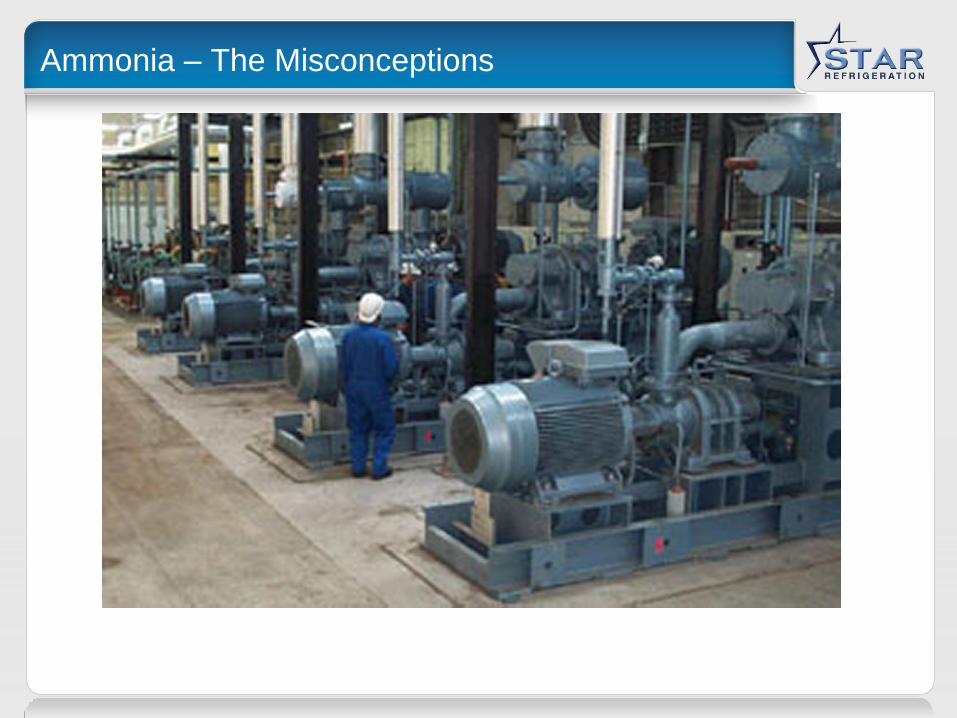
Ammonia – The Misconceptions
Ammonia?

Ammonia – The Reality

Low Charge
kg refrigerant
per kW
Other R717
systems
Azanechiller
Water-cooled
4
0.1
0.5

Low Charge
LPR
Short pipe run
PHE Evaporator
No HPR

Safety and Compliance
LPR
Short pipe run
PHE Evaporator
No HPR

Maintenance
and
Longevity
Reduced
Running
Cost
Natural
Refrigerant
Proven
Product
Low
Charge Why Ammonia?

Coefficient of System Performance
CoSP
200 300 400 550
5
4.5
4
3.5
650 750
kW
Azanechiller
HFC Chillers
19% 21% 22%
9% 8%
28%

Increased Efficiency
CoSP
5
4.5
4
3.5
750
Azanechiller
HFC Chillers
198.4kW
155.6kW
Azanechiller

Reduced Running Costs
kWhr (,000)
1,500
1,250
1,000
250
750
500
0
281,267kwhr
£19,689/yr
Azanechiller
HFC Chillers

High Efficiency
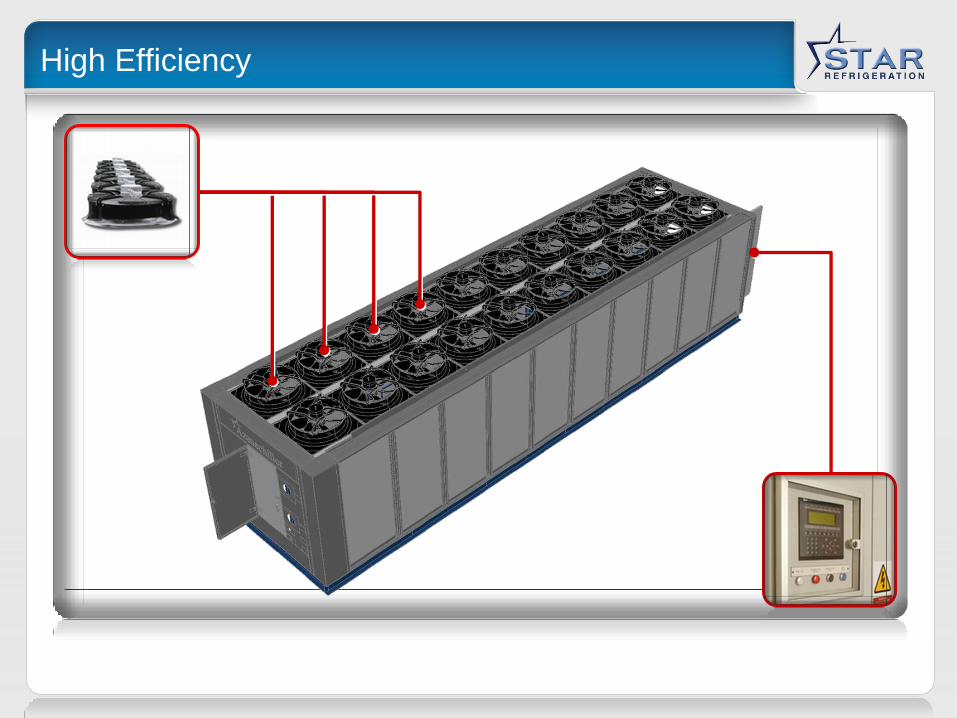
High Efficiency
Maintenance
and
Longevity
Reduced
Running
Cost
Natural
Refrigerant
Proven
Product
Low
Charge Why Ammonia?

Maintenance
and
Longevity
Reduced
Running
Cost
Natural
Refrigerant
Proven
Product
Low
Charge Why Ammonia?

Proven Product
Manufacture Commission Testing Ready
Extended Warranties
Whitehall
Place
Maintenance
and
Longevity
Reduced
Running
Cost
Natural
Refrigerant
Proven
Product Why
?
Low
Charge

Think Differently-District Cooling and Desalination