operator sequence alters gene expression independently of
TRANSCRIPT
Operator Sequence Alters Gene Expression Independentlyof Transcription Factor Occupancy in Bacteria
The MIT Faculty has made this article openly available. Please share how this access benefits you. Your story matters.
Citation Garcia, Hernan G., Alvaro Sanchez, James Q. Boedicker, MelisaOsborne, Jeff Gelles, Jane Kondev, and Rob Phillips. “OperatorSequence Alters Gene Expression Independently of TranscriptionFactor Occupancy in Bacteria.” Cell Reports 2, no. 1 (July 2012):150–161.
As Published http://dx.doi.org/10.1016/j.celrep.2012.06.004
Publisher Elsevier
Version Final published version
Citable link http://hdl.handle.net/1721.1/91648
Terms of Use Creative Commons Attribution
Detailed Terms http://creativecommons.org/licenses/by-nc-nd/3.0/
Cell Reports
Article
Operator Sequence Alters Gene ExpressionIndependently of Transcription FactorOccupancy in BacteriaHernan G. Garcia,1,6,9 Alvaro Sanchez,3,7,9 James Q. Boedicker,2,9 Melisa Osborne,4,8 Jeff Gelles,4,* Jane Kondev,5,*and Rob Phillips2,*1Department of Physics2Department of Applied Physics
California Institute of Technology, Pasadena, CA 91125, USA3Graduate Program in Biophysics and Structural Biology4Department of Biochemistry5Department of Physics
Brandeis University, Waltham, MA 02453, USA6Department of Physics, Princeton University, Princeton, NJ 08540, USA7Department of Physics, Massachusetts Institute of Technology, Cambridge, MA 02139, USA8Harvard University School of Medicine and Children’s Hospital, Boston, MA 02115, USA9These authors contributed equally to this work*Correspondence: [email protected] (J.G.), [email protected] (J.K.), [email protected] (R.P.)
http://dx.doi.org/10.1016/j.celrep.2012.06.004
SUMMARY
A canonical quantitative view of transcriptional regu-lation holds that the only role of operator sequence isto set the probability of transcription factor binding,with operator occupancy determining the level ofgene expression. In this work, we test this idea bycharacterizing repression in vivo and the bindingof RNA polymerase in vitro in experiments whereoperators of various sequences were placed eitherupstream or downstream from the promoter inEscherichia coli. Surprisingly, we find that operatorswith a weaker binding affinity can yield higher re-pression levels than stronger operators. Repressorbound to upstream operators modulates promoterescape, and the magnitude of this modulation isnot correlated with the repressor-operator bindingaffinity. This suggests that operator sequences maymodulate transcription by altering the nature ofthe interaction of the bound transcription factorwith the transcriptional machinery, implying a newlayer of sequence dependence that must be con-fronted in the quantitative understanding of geneexpression.
INTRODUCTION
Cells control how much, when and where to express a gene in
response to changes in their intracellular and extracellular envi-
ronments. A variety of mechanisms are employed to exert this
control at each of the steps along the path from DNA to active
protein (Alberts, 2008). An important mechanism of gene regula-
tion in bacteria acts through transcription factors that bind to
specific sites in the promoter region, the sequence of DNA
immediately upstream of genes, where RNA polymerase binds.
As a result of interactions or steric interference between tran-
scription factors bound to these sites and RNA polymerase,
activation or repression of transcription ensues (Bintu et al.,
2005b; Ptashne and Gann, 2002). Indeed, an important activity
of modern genome science is finding transcription factor binding
sites and determining the rules by which promoter architecture,
i.e., the position and sequence of these binding sites, dictates
the level of the gene expression (Buchler et al., 2003; Segal
and Widom, 2009).
It is often assumed that that the role of operators is simply to
act as docking sites for transcription factors, recruiting them to
the promoter region (Meijsing et al., 2009). In this view, which
we here term the ‘‘occupancy hypothesis’’ the sequence of
the operator simply determines its binding affinity for its target
transcription factor. This binding affinity, together with the con-
centration of active transcription factors and the interactions
with other DNA-binding proteins, determines the occupancy of
the operator which, in turn, is thought to influence the level of
transcriptional regulation exerted by the transcription factor
(Alberts, 2008; Bintu et al., 2005b; Buchler et al., 2003; Davidson,
2006). For example, in Figure 1A we consider promoters pre-
senting binding sites of different affinities for a repressor. Given
these binding affinities the intracellular number of active repres-
sors will determine the probability of finding the repressor bound
to each one of the operators. As a result, the shape of the input-
output function, that is, the level of output gene expression as
a function of the input concentration of repressors, will reach
the same level of repression at different repressor concentra-
tions, which are determined by the binding affinities of the oper-
ators. A promoter that contains a strong operator, a site on the
DNA that binds the transcription factor tightly, is expected to
require a lower intracellular concentration of the transcription
factor to reach the same level of repression (or activation) as
150 Cell Reports 2, 150–161, July 26, 2012 ª2012 The Authors
a promoter that has a weaker operator (Bintu et al., 2005a,
2005b; Buchler et al., 2003; Vilar and Leibler, 2003). Quantita-
tively, this can be expressed by saying that the level of tran-
scription is determined by the binding probabilities of these
transcription factors to the DNA, as shown in Figure 1A. As
a result, a key prediction of the occupancy hypothesis is that
when plotting the level of gene expression as a function of the
operator occupancy the curves corresponding to different oper-
ators, regardless of their affinity, will all collapse onto a master
curve as shown in Figure 1A.
The effect of themodulation of the affinity of an operator as the
surrounding sequence context is kept constant is not to be
confused with the effect of moving a given operator with respect
to the promoter while leaving its affinity constant, shown dia-
grammatically in Figure 1B. Because the affinity is kept constant
one would, in principle, expect the probability of finding the tran-
scription factor bound to the operator in each of the constructs
exemplified in Figure 1B to be the same as a function of the
transcription factor concentration. However, we expect the rela-
tive positioning of the operator and promoter to modulate the
nature of the interaction between the transcription factor and
the transcriptional machinery. As a result, the shape of the
input-output function of each regulatory architecture will, in
principle, differ.
From the point of view of transcriptional regulation described
above it follows that once the occupancy of binding sites by
A
B
- -
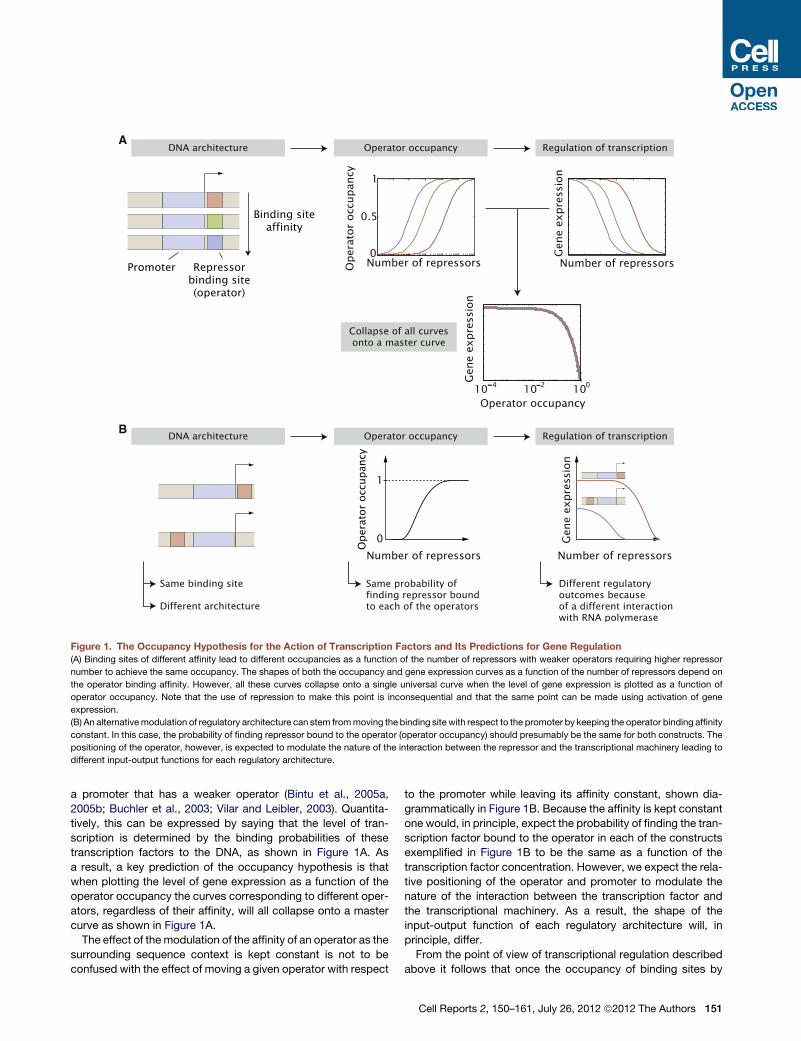
Figure 1. The Occupancy Hypothesis for the Action of Transcription Factors and Its Predictions for Gene Regulation
(A) Binding sites of different affinity lead to different occupancies as a function of the number of repressors with weaker operators requiring higher repressor
number to achieve the same occupancy. The shapes of both the occupancy and gene expression curves as a function of the number of repressors depend on
the operator binding affinity. However, all these curves collapse onto a single universal curve when the level of gene expression is plotted as a function of
operator occupancy. Note that the use of repression to make this point is inconsequential and that the same point can be made using activation of gene
expression.
(B) An alternativemodulation of regulatory architecture can stem frommoving the binding site with respect to the promoter by keeping the operator binding affinity
constant. In this case, the probability of finding repressor bound to the operator (operator occupancy) should presumably be the same for both constructs. The
positioning of the operator, however, is expected to modulate the nature of the interaction between the repressor and the transcriptional machinery leading to
different input-output functions for each regulatory architecture.
Cell Reports 2, 150–161, July 26, 2012 ª2012 The Authors 151

transcription factors within a regulatory region is determined
and the effect of the bound transcription factor on the tran-
scriptional machinery is known, the resulting level of gene
expression can be calculated (Bintu et al., 2005b; Buchler
et al., 2003; Segal et al., 2008; Vilar and Leibler, 2003). This
view of transcriptional regulation has been challenged by
recent results in eukaryotic cells that demonstrated that the
affinity of transcription factors for different cofactors can be
modulated by the sequence of the transcription factor binding
site (Lefstin and Yamamoto, 1998; Meijsing et al., 2009). This
suggests that in order to fully understand the function of a regu-
latory region, the effect of operators on the nature of the inter-
action between transcription factors and the transcriptional
machinery may have to be considered in addition to finding
their position in the genome and their affinity for transcription
factors.
Despite this recent evidence, many quantitative studies
both in the bacterial and eukaryotic context, make explicit or
implicit use of the occupancy hypothesis in order to describe
the action of transcription factors on the level of gene expression
(Ackers et al., 1982; Amit et al., 2011; Davidson, 2006; Garcia
and Phillips, 2011; Gertz et al., 2009; Ptashne and Gann, 2002;
Segal et al., 2008; Zinzen et al., 2009). Indeed, every time that
the rate of protein production is written in terms of Hill functions,
for example, this occupancy hypothesis has been made implic-
itly (Ca�gatay et al., 2009; Elowitz and Leibler, 2000; Fowlkes
et al., 2008; Gardner et al., 2000; Klumpp et al., 2009; Kuhlman
et al., 2007; Novak and Tyson, 2008; Tsai et al., 2008). As
a result, such quantitative descriptions of transcriptional regula-
tion are at least potentially incomplete and not on par with our
current qualitative knowledge of the nuanced role of operator
sequence beyond that of determining binding affinity.
In the remainder of the study, we demonstrate a form of
modulation in transcriptional regulation that is at odds with
the traditional operator occupancy viewpoint, suggesting that
the canonical picture is incomplete. We do this by adopting
a synthetic biology approach, in which we deliberately tune
operator position, operator strength and transcription factor
copy number in order to systematically traverse the parameter
space of the simple repression architecture (i.e., the case in
which a repressor regulates a promoter through the presence
of a single binding site in its vicinity) by Lac repressor. This
repressor is one of the best understood transcription factors
(Muller-Hill, 1996). Through systematic in vivo gene expression
measurements, in vitro single molecule experiments, and theo-
retical modeling we show that when the repressor binds
upstream from the promoter the choice of the sequence of its
operator binding site influences the rate of synthesis of
mRNA, but that the extent of repression does not respect the
rank ordering of the strength of the different operators in the
way predicted by the occupancy-based model of regulation
(Figure 1A). As a result, we expand the quantitative view for
the role of operator sequence in the context of the paradig-
matic Lac repressor-operator interaction. In this context, oper-
ator sequence acts not only to determine the occupancy of
DNA binding proteins, but also affects the nature of the interac-
tions between the transcription factors and the transcriptional
machinery.
RESULTS
Operator Position Leads to Different RepressionBehaviorsIn Escherichia coli, genome-wide studies have resulted in an
atlas of binding sites for both repressors and activators that
give a picture of the diversity of binding site arrangements
even in the case of simple repression. For example, in Figure 2A
we show a histogram of the positions of repressor binding sites
that regulate promoters through simple repression in E. coli
(Gama-Castro et al., 2008; Madan Babu and Teichmann,
2003). As can be seen from this histogram the simple repression
motif may be able to act over a wide range of positions relative to
the polymerase start site.
In order to investigate the effects of lac operator position rela-
tive to the polymerase binding site, we carried out systematic
gene expressionmeasurements for different operators as a func-
tion of their position relative to the transcription start site with
single base pair resolution. Examples of the parameters varied
in the construct library used to assay the effect of operator
positioning on repression are shown schematically in Figure 2B,
whereas a more detailed version including the sequences is
shown in Figures S1A–S1C. We used the lacUV5 promoter,
which is a mutant of the lac promoter that does not require
activation by CRP (Muller-Hill, 1996). This promoter controls
the expression of the YFP or lacZ gene, which we use to quantify
the level of gene expression.Wemeasure the regulatory effect of
Lac repressor as repression, which is defined as
Repression=ExpressionðR= 0ÞExpressionðRs0Þ; (Equation 1)
where R is the intracellular number of repressors. When the
operator is moved downstream from the transcriptional initiation
site, the level of repression is relatively independent of position
until the center of the operator reaches +16 as shown in Fig-
ure 2C. At these downstream positions, Lac repressor might
be acting by the same mechanism as it does at +11, where it
blocks open complex formation or an earlier step in initiation
(Sanchez et al., 2011; Schlax et al., 1995). However, it is also
possible that as the repressor is moved from its wild-type posi-
tion repression might be realized through different mechanisms,
as has already been shown for a variety of transcription factors
(Hochschild and Dove, 1998; Pavco and Steege, 1990, 1991;
Rojo, 1999), possibly affecting any of the various steps in tran-
scription initiation or elongation as shown schematically in
Figures S2A and S2B (Elledge and Davis, 1989; Lopez et al.,
1998).
By way of contrast, when the operator is moved to positions
upstream from the initiation site, the level of repression strongly
depends on the location of the operator and the variation in
repression is substantial, with at least a 15-fold effect between
the peaks and valleys and with the valleys corresponding to no
repression (Figure 2C). Interestingly, the repression profile
shows two peaks, with a separation between them of �10–
11 bp, intriguingly close to the helical period of the double
stranded DNA helix (Amit et al., 2011; Becker et al., 2005; Lee
and Schleif, 1989; Muller et al., 1996). We find a maximum
152 Cell Reports 2, 150–161, July 26, 2012 ª2012 The Authors
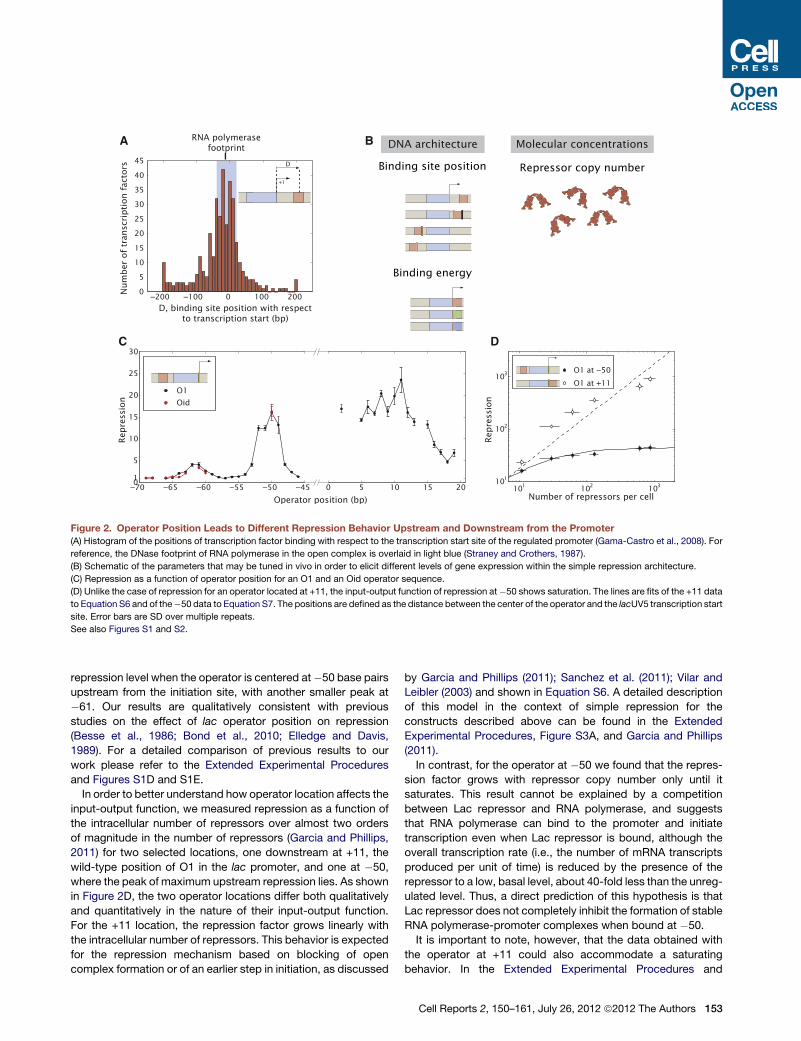
repression level when the operator is centered at�50 base pairs
upstream from the initiation site, with another smaller peak at
�61. Our results are qualitatively consistent with previous
studies on the effect of lac operator position on repression
(Besse et al., 1986; Bond et al., 2010; Elledge and Davis,
1989). For a detailed comparison of previous results to our
work please refer to the Extended Experimental Procedures
and Figures S1D and S1E.
In order to better understand how operator location affects the
input-output function, we measured repression as a function of
the intracellular number of repressors over almost two orders
of magnitude in the number of repressors (Garcia and Phillips,
2011) for two selected locations, one downstream at +11, the
wild-type position of O1 in the lac promoter, and one at �50,
where the peak of maximum upstream repression lies. As shown
in Figure 2D, the two operator locations differ both qualitatively
and quantitatively in the nature of their input-output function.
For the +11 location, the repression factor grows linearly with
the intracellular number of repressors. This behavior is expected
for the repression mechanism based on blocking of open
complex formation or of an earlier step in initiation, as discussed
by Garcia and Phillips (2011); Sanchez et al. (2011); Vilar and
Leibler (2003) and shown in Equation S6. A detailed description
of this model in the context of simple repression for the
constructs described above can be found in the Extended
Experimental Procedures, Figure S3A, and Garcia and Phillips
(2011).
In contrast, for the operator at �50 we found that the repres-
sion factor grows with repressor copy number only until it
saturates. This result cannot be explained by a competition
between Lac repressor and RNA polymerase, and suggests
that RNA polymerase can bind to the promoter and initiate
transcription even when Lac repressor is bound, although the
overall transcription rate (i.e., the number of mRNA transcripts
produced per unit of time) is reduced by the presence of the
repressor to a low, basal level, about 40-fold less than the unreg-
ulated level. Thus, a direct prediction of this hypothesis is that
Lac repressor does not completely inhibit the formation of stable
RNA polymerase-promoter complexes when bound at �50.
It is important to note, however, that the data obtained with
the operator at +11 could also accommodate a saturating
behavior. In the Extended Experimental Procedures and
C
A B
D
Figure 2. Operator Position Leads to Different Repression Behavior Upstream and Downstream from the Promoter
(A) Histogram of the positions of transcription factor binding with respect to the transcription start site of the regulated promoter (Gama-Castro et al., 2008). For
reference, the DNase footprint of RNA polymerase in the open complex is overlaid in light blue (Straney and Crothers, 1987).
(B) Schematic of the parameters that may be tuned in vivo in order to elicit different levels of gene expression within the simple repression architecture.
(C) Repression as a function of operator position for an O1 and an Oid operator sequence.
(D) Unlike the case of repression for an operator located at +11, the input-output function of repression at�50 shows saturation. The lines are fits of the +11 data
to Equation S6 and of the�50 data to Equation S7. The positions are defined as the distance between the center of the operator and the lacUV5 transcription start
site. Error bars are SD over multiple repeats.
See also Figures S1 and S2.
Cell Reports 2, 150–161, July 26, 2012 ª2012 The Authors 153
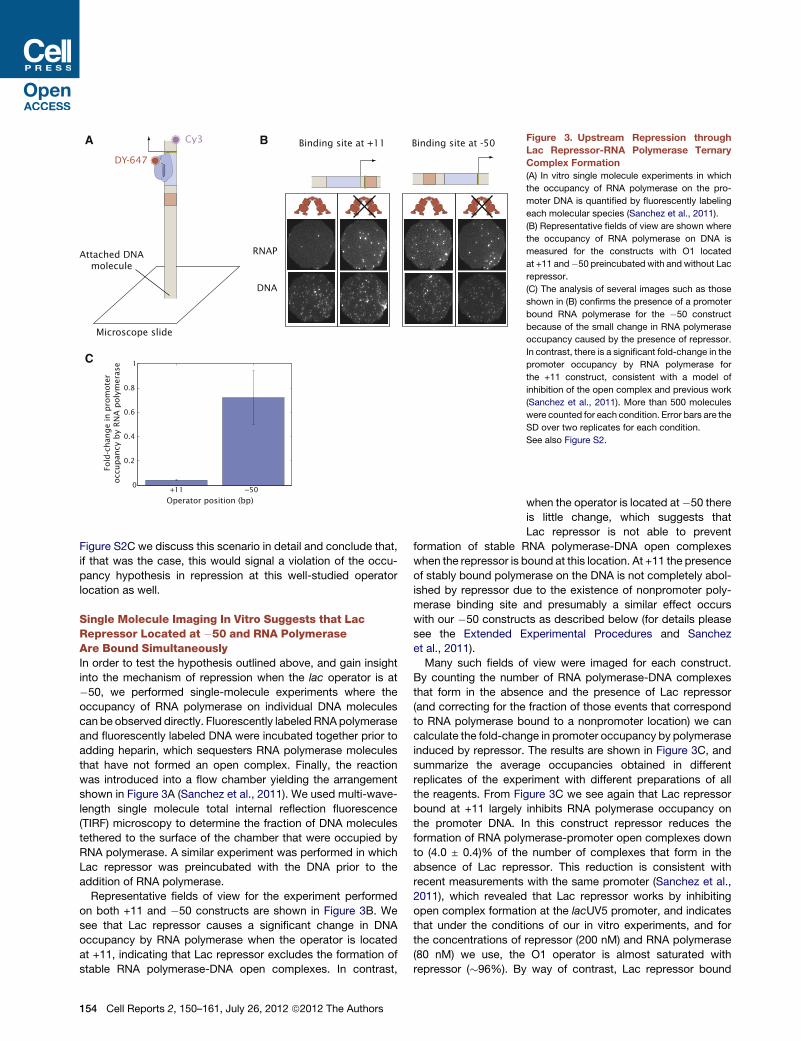
Figure S2C we discuss this scenario in detail and conclude that,
if that was the case, this would signal a violation of the occu-
pancy hypothesis in repression at this well-studied operator
location as well.
Single Molecule Imaging In Vitro Suggests that LacRepressor Located at �50 and RNA PolymeraseAre Bound SimultaneouslyIn order to test the hypothesis outlined above, and gain insight
into the mechanism of repression when the lac operator is at
�50, we performed single-molecule experiments where the
occupancy of RNA polymerase on individual DNA molecules
can be observed directly. Fluorescently labeled RNApolymerase
and fluorescently labeled DNA were incubated together prior to
adding heparin, which sequesters RNA polymerase molecules
that have not formed an open complex. Finally, the reaction
was introduced into a flow chamber yielding the arrangement
shown in Figure 3A (Sanchez et al., 2011). We used multi-wave-
length single molecule total internal reflection fluorescence
(TIRF) microscopy to determine the fraction of DNA molecules
tethered to the surface of the chamber that were occupied by
RNA polymerase. A similar experiment was performed in which
Lac repressor was preincubated with the DNA prior to the
addition of RNA polymerase.
Representative fields of view for the experiment performed
on both +11 and �50 constructs are shown in Figure 3B. We
see that Lac repressor causes a significant change in DNA
occupancy by RNA polymerase when the operator is located
at +11, indicating that Lac repressor excludes the formation of
stable RNA polymerase-DNA open complexes. In contrast,
Cy3
DY-647
Microscope slide
Attached DNAmolecule
DNA
RNAP
Binding site at +11 Binding site at -50
Fold
-chan
ge
in p
rom
ote
rocc
upan
cy b
y R
NA
poly
mer
ase
A B
C
Operator position (bp)+11 −50
0
0.2
0.4
0.6
0.8
1
Figure 3. Upstream Repression through
Lac Repressor-RNA Polymerase Ternary
Complex Formation
(A) In vitro single molecule experiments in which
the occupancy of RNA polymerase on the pro-
moter DNA is quantified by fluorescently labeling
each molecular species (Sanchez et al., 2011).
(B) Representative fields of view are shown where
the occupancy of RNA polymerase on DNA is
measured for the constructs with O1 located
at +11 and�50 preincubated with and without Lac
repressor.
(C) The analysis of several images such as those
shown in (B) confirms the presence of a promoter
bound RNA polymerase for the �50 construct
because of the small change in RNA polymerase
occupancy caused by the presence of repressor.
In contrast, there is a significant fold-change in the
promoter occupancy by RNA polymerase for
the +11 construct, consistent with a model of
inhibition of the open complex and previous work
(Sanchez et al., 2011). More than 500 molecules
were counted for each condition. Error bars are the
SD over two replicates for each condition.
See also Figure S2.
when the operator is located at�50 there
is little change, which suggests that
Lac repressor is not able to prevent
formation of stable RNA polymerase-DNA open complexes
when the repressor is bound at this location. At +11 the presence
of stably bound polymerase on the DNA is not completely abol-
ished by repressor due to the existence of nonpromoter poly-
merase binding site and presumably a similar effect occurs
with our �50 constructs as described below (for details please
see the Extended Experimental Procedures and Sanchez
et al., 2011).
Many such fields of view were imaged for each construct.
By counting the number of RNA polymerase-DNA complexes
that form in the absence and the presence of Lac repressor
(and correcting for the fraction of those events that correspond
to RNA polymerase bound to a nonpromoter location) we can
calculate the fold-change in promoter occupancy by polymerase
induced by repressor. The results are shown in Figure 3C, and
summarize the average occupancies obtained in different
replicates of the experiment with different preparations of all
the reagents. From Figure 3C we see again that Lac repressor
bound at +11 largely inhibits RNA polymerase occupancy on
the promoter DNA. In this construct repressor reduces the
formation of RNA polymerase-promoter open complexes down
to (4.0 ± 0.4)% of the number of complexes that form in the
absence of Lac repressor. This reduction is consistent with
recent measurements with the same promoter (Sanchez et al.,
2011), which revealed that Lac repressor works by inhibiting
open complex formation at the lacUV5 promoter, and indicates
that under the conditions of our in vitro experiments, and for
the concentrations of repressor (200 nM) and RNA polymerase
(80 nM) we use, the O1 operator is almost saturated with
repressor (�96%). By way of contrast, Lac repressor bound
154 Cell Reports 2, 150–161, July 26, 2012 ª2012 The Authors

at�50 reduces open complex formation only modestly, down to
(72 ± 22)% of that in the absence of repressor.
These quantitative results indicate that RNA polymerase occu-
pancy on the promoter is affected only slightly by repressor
bound at �50. If Lac repressor at �50 reduces open complex
formation by <2-fold in vitro, how can we observe a 40-fold
reduction of gene expression in vivo? Because our results
suggest that Lac repressor bound at�50 allows stable formation
of open complexes by RNA polymerase at the promoter, they
imply that the regulation of the level of gene expression comes
from a substantial effect of repressor on steps occurring after
open complex formation in the transcription initiation pathway.
In light of these results, we hypothesize that at �50 the
repressor is directly affecting the overall rate of promoter
escape, rather than just the occupancy of RNA polymerase on
the promoter as an open complex. As a result we propose a
thermodynamic model for in vivo upstream simple repression
by Lac repressor that is schematized in Figure 4A and tested
systematically in the following section.
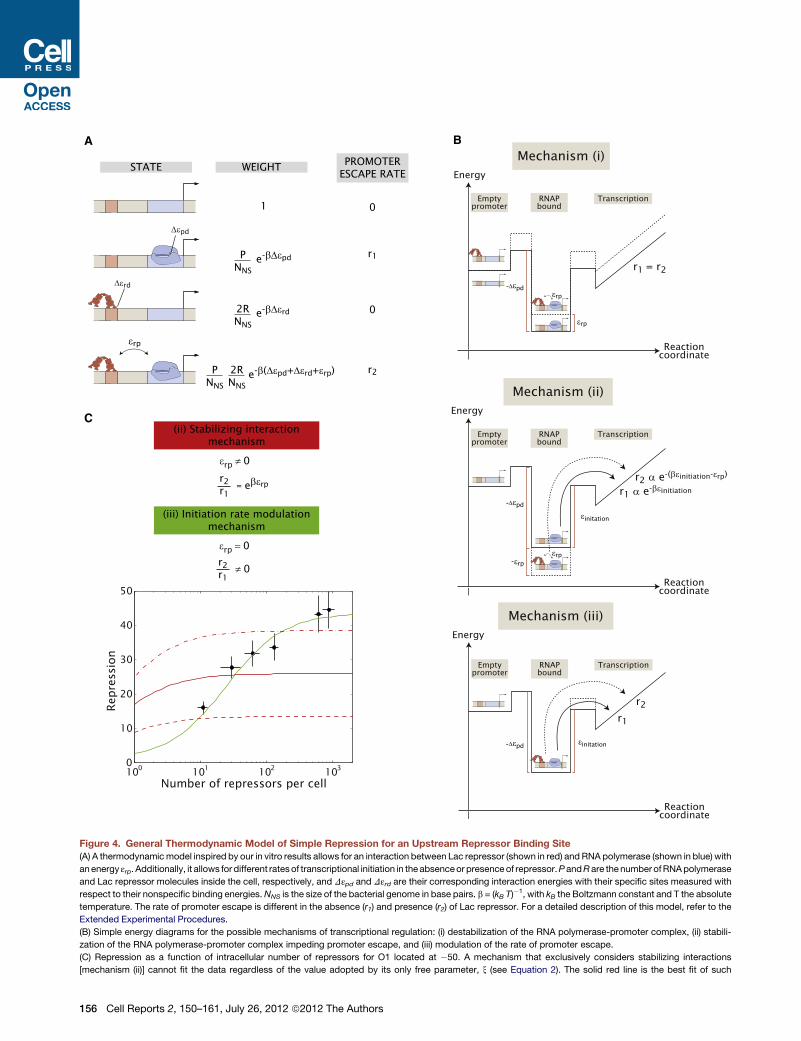
The Input-Output Function of Simple Repression fromUpstream Positions Involves Modulation of thePromoter Escape Rate by the RepressorThe general model for upstream repression proposed based on
our experimental results and shown in Figure 4A covers three
different mechanisms of regulation: (i) a direct, destabilizing
interaction between RNA polymerase and Lac repressor that
decreases occupancy of polymerase at the promoter when
repressor is present, (ii) a direct, attractive interaction between
RNA polymerase and Lac repressor in the closed and/or open
complex that, by lowering the energy of the complex, effectively
increases the amount of energy required for RNA polymerase to
move forward on the pathway to transcription, and (iii) an
increase in the activation energy for promoter escape, without
any stabilization of RNA polymerase when Lac repressor is
bound to the DNA. In the last case, Lac repressor does not affect
the occupancy of the states, but only the kinetics of RNA poly-
merase escaping the promoter. These mechanisms are not
mutually exclusive, but can act together to exert regulation de-
pending on the values of the different parameters of the model.
The different reaction diagrams corresponding to each one of
these mechanisms are shown schematically in Figure 4B. In
the followingwe explore these three cases through a quantitative
comparison between theoretical predictions and expression
data.
We start by considering mechanism (i). Qualitatively, this
mechanism predicts a mutual destabilization between Lac
repressor and RNA polymerase such that the occupancy of
RNA polymerase on the promoter would be affected in the
presence of repressor. However, our in vitro results shown in
Figure 3C suggest that promoter occupancy is not affected
significantly. We conclude that this effect, if present, will be of
a small magnitude. As a result we do not consider this mecha-
nism any further in this work. Further discussion of this point
can be found in the Extended Experimental Procedures.
Next, we consider mechanism (ii), which leads to the following
expression for the repression as a function of repressor copy
number
RepressionðiiÞ =1+
2R
NNS
e�bDεrd x
1+2R
NNS
e�bDεrd
= 1+ ðx� 1Þ2R
NNS
e�bDεrd
1+2R
NNS
e�bDεrd
;
(Equation 2)
where x is a function of the interaction parameter εrp, of the
binding energy of polymerase to the promoter, and of the copy
number of polymerases. Notice that the parameter x can only
determine the maximum level of expression. However, it does
not have an effect on the half-point, the repressor copy number
at which the repression has reached half of its maximum value
(this half-point is analogous to a dissociation constant, see
Extended Experimental Procedures and Figures S3B and S3C
for further details).
Finally, if we take mechanism (iii), where there is no stabilizing
interaction between repressor and polymerase, but there is
a change in the rate of promoter escape, we get the expression
RepressionðiiiÞ =1+
2R
NNS
e�bDεrd
1+r2r1
2R
NNS
e�bDεrd
= 1+
�1� r2
r1
� 2R
NNS
e�bDεrd
1+r2r1
2R
NNS
e�bDεrd
:
(Equation 3)
This mechanism gives us a new parameter to consider: the
ratio of the RNA polymerase escape rate in the presence of
repressor to the rate in its absence, r2/r1, as shown in Figure 4A.
However, unlike x in mechanism (ii), this parameter sets the
value of both the half-point of the repression curve (notice the
presence of r2/r1 in the denominator) as well as the maximum
level of repression (see Extended Experimental Procedures
and Figures S3B and S3C).
Continuing with the strategy employed in Figure 2D, we
dissected simple repression upstream from the promoter in
order to test the predictions of the different regulatory mecha-
nisms posited by the model shown in Figure 4A. We created
DNA constructs bearing all four lac operators (Oid, O1, O2,
and O3, in order of high to low affinity) at �50 and we placed
them in strains containing different intracellular numbers of Lac
repressor that spanned nearly two orders of magnitude (Garcia
and Phillips, 2011).
Figure 4C shows repression as a function of repressor number
for O1 located at �50. As shown previously in Figure 2D, one
of the surprising outcomes when comparing repression at �50
to repression at +11 is that repression at +11 grows with the
number of repressors as called for by Equation S6 (see Fig-
ure S3A and Garcia and Phillips [2011]) whereas there is a satu-
ration of repression at�50. This saturation is not consistent with
the model embodied in Equation S6.
Given our previous knowledge of the in vivo binding energies
of Lac repressor to the various operators (see Extended Experi-
mental Procedures andGarcia and Phillips [2011]) the repression
formulas for mechanisms (ii) and (iii) discussed above only have
one free parameter each: x for mechanism (ii) and the ratio r2/r1for mechanism (iii). In Figure 4C we show a fit of both mecha-
nisms to our experimental data with O1 located at �50 shown
in Figure 2D (for considerations on data fitting, please refer to
Cell Reports 2, 150–161, July 26, 2012 ª2012 The Authors 155
A B
C
Figure 4. General Thermodynamic Model of Simple Repression for an Upstream Repressor Binding Site
(A) A thermodynamicmodel inspired by our in vitro results allows for an interaction between Lac repressor (shown in red) and RNA polymerase (shown in blue) with
anenergy εrp. Additionally, it allows for different ratesof transcriptional initiation in theabsenceor presenceof repressor.PandRare thenumberofRNApolymerase
and Lac repressor molecules inside the cell, respectively, and Dεpd and Dεrd are their corresponding interaction energies with their specific sites measured with
respect to their nonspecific binding energies.NNS is the size of the bacterial genome in base pairs. b = (kB T)�1, with kB the Boltzmann constant and T the absolute
temperature. The rate of promoter escape is different in the absence (r1) and presence (r2) of Lac repressor. For a detailed description of this model, refer to the
Extended Experimental Procedures.
(B) Simple energy diagrams for the possible mechanisms of transcriptional regulation: (i) destabilization of the RNA polymerase-promoter complex, (ii) stabili-
zation of the RNA polymerase-promoter complex impeding promoter escape, and (iii) modulation of the rate of promoter escape.
(C) Repression as a function of intracellular number of repressors for O1 located at �50. A mechanism that exclusively considers stabilizing interactions
[mechanism (ii)] cannot fit the data regardless of the value adopted by its only free parameter, x (see Equation 2). The solid red line is the best fit of such
156 Cell Reports 2, 150–161, July 26, 2012 ª2012 The Authors

the Extended Experimental Procedures). As indicated by the
various red lines in that figure, mechanism (ii) shown in Equation
2 produces curves of the wrong shape and thus cannot fit
the data regardless of the choice of parameter x. On the other
hand, mechanism (iii), which leads to Equation 3, can fit the
data as shown by the green line in Figure 4C.
Based on the analysis above we propose that the main
mode of regulation by repressor is the modulation of promoter
escape rate by RNA polymerase. This does not rule out a con-
tribution from a stabilizing interaction between repressor and
polymerase. In fact, a combination of both regulatory strategies
can also fit the data as shown in Figure S3B. However, regulation
of the escape rate constitutes a minimal mechanism that is
sufficient to explain the data. We will assume this mechanism
to further explore repressionwhen the operator is located at�50.
Operator Strength Is Not Sufficient to Explainthe Level of RepressionGiven our knowledge of the modulation of the escape rate by
Lac repressor obtained from the O1 data, we predict the shapes
of the input-output functions for the remaining lac operators
in Figure 5A. Under the occupancy hypothesis the model
corresponding to this mechanism (mechanism (iii), shown in
Equation 3) predicts that repression saturates at the same level
regardless of the choice of operator because different operator
sequences only change the affinity of Lac repressor to operator
DNA. However, the operator choice determines the half-point of
repression in a way that follows a clear rank-ordering based
on the repressor binding affinity of the various operators
considered.
In Figure 5A we also show the corresponding experimental
data. It is clear from this plot that the model cannot describe
the data. In particular, it is both intriguing and surprising that
the data for different operators saturates at different levels and
that this saturation does not follow the rank ordering of the in vivo
and in vitro binding affinity of the operators. For example, Lac
repressor binds to Oid �20 times more strongly than O2, with
the Kd for Oid at�170 pM and the Kd for O2 at�4 nM. Yet, these
two operators have a comparable level of repression at a high
number of repressors of �900. On the other hand, Oid is also
bound �5 times stronger than O1, with O1 having a Kd of
�1 nM. Still, O1 presents a higher level of repression than Oid
at the same intracellular number of repressors of 900. Perhaps
even more interesting, if we replace the O1 binding site by its
reverse complement, which should leave its binding affinity
unaltered, we see a qualitatively different behavior from wild-
type O1 suggesting that binding affinity alone is not sufficient
to determine the different saturation levels.
If we abandon the view that the only role of the operator
sequence is to set the binding affinity of Lac repressor to DNA,
andadopt a viewwhere it canmodulate the transcription initiation
rate in a sequence-dependent way (with a different choice of the
parameter r2/r1) our model can account for all of the experimental
data. For example, the choice of operator might modulate the
nature of the interaction between repressor and RNA poly-
merase. Figure 5B shows that when we allow the parameter
r2/r1 to change with operator sequence the model now accounts
for theexperimental data. Thus, theobserveddifference inmodu-
lation of initiation rate for the different constructs is at odds with
the interpretation that the role of binding sites is exclusively to
a mechanism to the data whereas the dashed and dashed-dotted lines correspond to varying that parameter by a factor of two. On the other hand, a mechanism
that just considers a modulation in the promoter escape rate [mechanism (iii)], also having only one free parameter, can fit the data. Details of these two
mechanisms are given in the main text and the Extended Experimental Procedures. Error bars are SD over multiple repeats.
See also Figure S3.
101 102 103 104 105100
101
102
Rep
ress
ion
r2r1
O3 0.059 ± 0.006
O2 0.076 ± 0.003
O1 0.023 ± 0.001
Oid 0.065 ± 0.003
O1Flip 0.047 ± 0.002
Number of repressors per cellNumber of repressors per cell101 102 103 104 105
100
101
10 2
Rep
ress
ion
A B
Oper
ator
stre
ngth
O3O2
O1Oid
O1Flip
Figure 5. Repression at �50 by Lac Repressor as a Function of Repressor Copy Number and Operator Affinity Is Inconsistent with the
Occupancy Hypothesis
(A) Given themodulation in transcription rate obtained from the fit to theO1 data shown in Figure 4C and our previous knowledge of the in vivo binding energies we
predict the shape of the input-output function for constructs where the different operators are used (lines). The measured repression (circles) is systematically
inconsistent with the model predictions.
(B) By letting the modulation in transcription rate (r2/r1) be different for each operator we can successfully fit the data. Notice that the modulation does not bear
a correlation with operator strength.
O1Flip is the reverse complement of O1 and the dashed green line corresponds to a fit to its resulting experimental data. Error bars are SD over multiple repeats.
See also Figures S4, S5, and S6.
Cell Reports 2, 150–161, July 26, 2012 ª2012 The Authors 157

determine the probability of finding the repressor bound to the
DNA, but is consistent with models where operator sequence
can alter the nature of the repressor-polymerase interaction in
a way that modulates the polymerase escape rate.
An alternative hypothesis is that the modification of the oper-
ator sequence leads to a change in the unregulated level of
gene expression. In this case the differences in the observed
r2/r1 ratios could be purely due to a change in r1 for each oper-
ator. In Figure S4 we show that there is no significant correlation
between the unregulated levels of expression and the fitted r2/r1values. We conclude that the observed effect of operator
sequences cannot be explained by the change in the unregu-
lated levels of expression.
An alternative way to examine the effect of operator sequence
on the level of repression is to replot the data for repression as
a function of operator occupancy. As described in the introduc-
tion, the occupancy hypothesis implies that all data should fall
on the same curve, as shown in Figure 1A. In Figure S5 and
the Extended Experimental Procedures we show that although
the data for the +11 constructs collapses as expected from Fig-
ure 1A, the data corresponding to the �50 constructs does not,
suggesting again that repressor occupancy is not sufficient to
determine the level of repression.
The model used so far represents a simplified view of tran-
scription initiation that combines both closed and open com-
plexes into one effective complex. However, the exact same
conclusions, without any loss of generality, can be reached
when both complexes are considered independently (see
Extended Experimental Procedures and Figure S6). Further-
more, the thermodynamic model used assumes quasi-equilib-
rium between states leading up to promoter escape. If we
consider a full kinetic model in which no assumptions about
equilibrium are made we nevertheless reach the same conclu-
sions (see Extended Experimental Procedures): the different
levels of repression observed for different operator sequences
placed at the �50 location cannot be explained in the context
of the occupancy hypothesis.
DISCUSSION
The occupancy hypothesis states that the role of operator
sequence is to determine its occupancy by its target tran-
scription factor. The nature of the interaction between the bound
transcription factor and the transcriptional machinery is then
determined by the spatial arrangements of binding sites and
the DNA sequence context, i.e., the presence of DNA binding
sites for other proteins in the vicinity, the particular mechanical
properties of the surrounding DNA, etc. (Davidson, 2006;
Ptashne and Gann, 2002). For example, the relative positioning
between binding sites and the mechanical properties of the
intervening DNA can have drastic effects on gene regulatory
input-output functions (Aki et al., 1996; Amit et al., 2011;
Belyaeva et al., 1998; Browning and Busby, 2004; Busby et al.,
1994; Choy et al., 1995, 1997; Gaston et al., 1990; Hogan and
Austin, 1987; Joung et al., 1994; Joung et al., 1993; Lilja et al.,
2004; Mao et al., 1994; Ryu et al., 1998). Additionally, the nature
of the promoter can modulate how a transcription factor will
interact with its bound RNA polymerase (Monsalve et al., 1996,
1997). The majority of the current models of action of the diverse
known interactions between transcription factors and the tran-
scriptional machinery are based on assuming the applicability
of the occupancy hypothesis (Bintu et al., 2005b; Buchler
et al., 2003; Segal and Widom, 2009; Vilar and Leibler, 2003).
Several recent works have suggested that this canonical
picture of transcriptional regulation is incomplete (see Haugen
et al., 2008 and Voss et al., 2011 for two specific examples).
More directly related to this work, the occupancy hypothesis
has been suggested to be insufficient to describe regulation by
MarA in bacteria (Martin et al., 2008; Wall et al., 2009) and exam-
ples where the occupancy hypothesis falls short have been
found in the context of the regulation of cofactors by transcrip-
tion factors in eukaryotes, as we describe below (Meijsing
et al., 2009; Scully et al., 2000).
In this study, we quantitatively expanded our understanding of
the paradigmatic Lac repressor and showed that the sequence
of an operator located upstream from the promoter can dictate
different gene regulatory input-output functions leading to
different maximum repression values that cannot be explained
by the occupancy of repressor on DNA. We used theoretical
models of transcriptional regulation in order to qualitatively and
quantitatively frame these conclusions. Whether thermodynamic
models are used or a kinetic one in which no equilibrium
assumption is invoked (see Figure S6), the conclusions are
independent of the particular theoretical framework used to
analyze the experimental results. As a result, in clear violation
of the occupancy hypothesis, we conclude that the lac operator
sequences encodemore than just repressor binding affinity: they
can also determine the nature of the ‘‘effective’’ interaction
between repressor and RNA polymerase. We emphasize the
word ‘‘effective’’ to make clear that our model cannot determine
if the effect is due to a direct contact between repressor and
RNA polymerase, due to information being transferred through
the DNA in some ‘‘allosteric’’ way or due to some other, unknown
mechanism.
What is the mechanistic nature of the effective interaction
between Lac repressor and RNA polymerase? The�50 position,
where we carried out our most detailed characterization of
upstream repression, is within the footprint of the RNA poly-
merase alpha C-terminal domain (aCTD) subunit (Newlands
et al., 1991). This suggests that aCTD might be involved in
the repression mechanism through a direct contact with the
repressor in a fashion analogous to class I activators (Busby
and Ebright, 1999). A prediction of this direct contact hypothesis
is that if we introduce mutations or deletions in aCTD the repres-
sion should be abolished. By way of contrast, in the allosteric
hypothesis, such mutations should have little effect because
the repression is mediated by binding to the DNA, not by
protein-protein contacts. Previous experiments by Adhya and
co-workers shed light on this issue (Choy et al., 1995, 1997;
Roy et al., 2004). They found that Lac repressor (and also Gal
repressor) bound at an operator at �60 (the position of the
secondary peak of repression in Figure 2C) represses transcrip-
tion of the galP1 promoter, and that deletion of the aCTD
completely alleviates repression at �60 (Choy et al., 1995). In
addition, mutations in the aCTD also abolished repression
(Choy et al., 1997). Both of these experiments support the direct
158 Cell Reports 2, 150–161, July 26, 2012 ª2012 The Authors

contact hypothesis. Furthermore, a mutant with a single point
mutation in GalR was found to be able to bind to the operator
at �60, but not to repress transcription (Roy et al., 2004). It is
worth noting that all of these experiments were done for
a different promoter than the one we have characterized here.
However, their results support a mechanism based on direct
contact between repressor and RNA polymerase.
None of the different mechanistic hypotheses discussed
above can explain why different operator sequences determine
the level of repression in a way that does not correlate with
operator occupancy by repressor, which results in a violation
of the occupancy hypothesis. One possible explanation is that
these different regulatory outcomes result from subtle differ-
ences in the three-dimensional structures of the protein-DNA
complexes or in the dynamics of these molecules. These differ-
ences could lead to altered interactions with RNA polymerase
or the promoter region and result in the modulation of gene
expression. In fact, differences in structure have been observed
for the Lac repressor binding domain bound to its different
operators as well as for the structural parameters of the inter-
vening DNA such as twist, roll and base pair stacking, but
their correlation with any phenotypic effects is unclear (Kalodi-
mos et al., 2002, 2004; Romanuka et al., 2009). It is then also
possible to speculate that the information about which operator
is present is transferred through the DNA itself. However,
because these studies resolved only the DNA binding-domain
it remains unclear whether the conformation of the remaining
protein was altered in any relevant way. Despite uncertainties
about the detailed sequence-dependent molecular mechanism,
the work reported here is a further step toward a more detailed
understanding of the molecular interactions exerted by tran-
scription factors.
A few studies in eukaryotic cells had previously found that
DNAmay act as more than simply a docking site for transcription
factors; in addition, it may act as an allosteric ligand that conveys
information about the mode of gene regulation (Geserick et al.,
2005; Ma et al., 2010). These studies found that the specific
sequence of a transcription factor binding site determined the
affinity of the bound transcription factor for a different set of
corepressors or coactivators. These changes in affinity may
have profound physiological effects as has been suggested for
the Pit-1 factor, the glucocorticoid receptor, and NF-kB (Lefstin
and Yamamoto, 1998; Leung et al., 2004; Meijsing et al., 2009;
Scully et al., 2000).
Our study demonstrates that modulation of transcription
factor activity by the DNA sequence of its binding site may well
be a much more general phenomenon, occurring as shown
here in bacteria as well as in eukaryotes, despite the differences
between transcriptional mechanisms in these two domains of
life. Our study was performed in E. coli, where transcriptional
regulation is thought to be much simpler than in eukaryotes,
and we used a promoter that does not involve any cofactors.
This simplicity has allowed us to find a direct mechanistic link
between the DNA sequence of an operator and the transcrip-
tional output. These results suggest that a similar effect of
operator sequence on the modulation of promoter escape could
arise in other bacterial transcription factors that either halt or
enhance transcription at the same step as has recently been
suggested for activation by MarA (Martin et al., 2008; Wall
et al., 2009). Thus, MarA regulated promoters may be good
candidate systems to further investigate the generality of our
findings in bacterial gene regulation.
Much work that has focused on the dissection of gene regula-
tory regions has been based on assuming the applicability of
the occupancy hypothesis (Ackers et al., 1982; Amit et al.,
2011; Bintu et al., 2005a; Davidson, 2006; Gertz et al., 2009;
Ptashne and Gann, 2002; Raveh-Sadka et al., 2012; Segal
et al., 2008; Segal and Widom, 2009; Zinzen et al., 2009). This
study gives further evidence for the existence of an additional
layer of complexity to consider in transcriptional regulation given
by the nature of the interaction between transcription factors and
the transcriptional machinery imposed by transcription factor
binding site sequence. Given the fact that a large number of
repressors act on promoters by binding to a single site located
upstream from the promoter region in E. coli (see Figure 2A
and Gama-Castro et al., 2008) it is possible that this mechanism
of repression might be widespread. Thus, knowing the list of
operators and their strengths is not sufficient to predict the
input-output function of a promoter. A detailed analysis of
specific repressors will be necessary to determine how wide-
spread the effects observed here may be.
EXPERIMENTAL PROCEDURES
Plasmids, Strains, and In Vivo Measurements
The construction of all plasmids and strains is described in the Extended
Experimental Procedures. In short, we placed a YFP or lacZ reporter gene
under the control of a lacUV5 promoter and the regulation of one of four lac
operators at different positions with respect to the transcription start site.
The different constructs used throughout the paper are shown schematically
in Figures S1A–S1C. These constructs were integrated in the chromosome
of E. coli strains bearing different intracellular numbers of Lac repressor (Gar-
cia and Phillips, 2011).
Gene expression measurements were performed using a plate reader as
described in the Extended Experimental Procedures and (Garcia et al., 2011).
Single Molecule Experiments
Single molecule experiments were performed as described in the Extended
Experimental Procedures and (Sanchez et al., 2011). In short, fluorescently-
and biotin-labeled DNA containing a promoter and a repressor binding site
was incubated in the presence of RNA polymerase labeled with a second,
spectrally distinct fluorophore. The DNA molecules were bound to a streptavi-
din coated glass slide and the fraction of RNA polymerase-bound DNA mole-
cules was quantified. In order to assay the effect of repressor on the formation
of RNA polymerase-bound complexes the DNA was pre-incubated with
repressor before the addition of RNA polymerase and the resulting reaction
was again imaged. As reported previously (Sanchez et al., 2011), not all RNA
polymerase-bound DNA molecules correspond to stable, open complexes.
This was taken into account in our analysis. Details pertaining to this point
can be found in the Extended Experimental Procedures.
SUPPLEMENTAL INFORMATION
Supplemental Information includes Extended Experimental Procedures and
six figures and can be found with this article online at http://dx.doi.org/
10.1016/j.celrep.2012.06.004.
LICENSING INFORMATION
This is an open-access article distributed under the terms of the Creative
Commons Attribution-Noncommercial-No Derivative Works 3.0 Unported
Cell Reports 2, 150–161, July 26, 2012 ª2012 The Authors 159
License (CC-BY-NC-ND; http://creativecommons.org/licenses/by-nc-nd/3.0/
legalcode).
ACKNOWLEDGMENTS
We are grateful to Jon Widom, Tom Kuhlman, Justin Kinney, Stephanie
Johnson, Daniel Jones and Rob Brewster for helpful discussions. We dedicate
this work to Prof. Widom who recently passed away unexpectedly. We
would like to thank Larry Friedman for technical assistance with the single
molecule experiments and for useful discussions. We thank Robert Landick,
Rachel Mooney and Abbey Vangeloff for the generous gifts of purified
SNAP-tagged core RNA polymerase and s70. This work was supported by
National Institutes of Health Pioneer award DP1 OD000217 (H.G.G., R.P.)
and grants R01 GM085286 and R01 GM085286-01S (H.G.G., J.Q.B., R.P.),
GM81648 and GM43369 (J.G., A.S., M.L.O.), La Fondation Pierre Gilles de
Gennes (R.P.), and National Science Foundation award DMR-0706458 (J.K.)
and MRSEC-0820492 (J.K., J.G.).
Received: April 9, 2012
Revised: May 14, 2012
Accepted: June 6, 2012
Published online: July 12, 2012
REFERENCES
Ackers, G.K., Johnson, A.D., and Shea, M.A. (1982). Quantitative model for
gene regulation by lambda phage repressor. Proc. Natl. Acad. Sci. USA 79,
1129–1133.
Aki, T., Choy, H.E., and Adhya, S. (1996). Histone-like protein HU as a specific
transcriptional regulator: co-factor role in repression of gal transcription by
GAL repressor. Genes Cells 1, 179–188.
Alberts, B. (2008). Molecular Biology of the Cell, Fifth Edition (New York:
Garland Science).
Amit, R., Garcia, H.G., Phillips, R., and Fraser, S.E. (2011). Building enhancers
from the ground up: a synthetic biology approach. Cell 146, 105–118.
Becker, N.A., Kahn, J.D., and Maher, L.J., 3rd. (2005). Bacterial repression
loops require enhanced DNA flexibility. J. Mol. Biol. 349, 716–730.
Belyaeva, T.A., Rhodius, V.A., Webster, C.L., and Busby, S.J. (1998).
Transcription activation at promoters carrying tandem DNA sites for the
Escherichia coli cyclic AMP receptor protein: organisation of the RNA poly-
merase alpha subunits. J. Mol. Biol. 277, 789–804.
Besse, M., vonWilcken-Bergmann, B., and Muller-Hill, B. (1986). Synthetic lac
operator mediates repression through lac repressor when introduced
upstream and downstream from lac promoter. EMBO J. 5, 1377–1381.
Bintu, L., Buchler, N.E., Garcia, H.G., Gerland, U., Hwa, T., Kondev, J., Kuhl-
man, T., and Phillips, R. (2005a). Transcriptional regulation by the numbers:
applications. Curr. Opin. Genet. Dev. 15, 125–135.
Bintu, L., Buchler, N.E., Garcia, H.G., Gerland, U., Hwa, T., Kondev, J., and
Phillips, R. (2005b). Transcriptional regulation by the numbers: models. Curr.
Opin. Genet. Dev. 15, 116–124.
Bond, L.M., Peters, J.P., Becker, N.A., Kahn, J.D., andMaher, L.J., 3rd. (2010).
Gene repression by minimal lac loops in vivo. Nucleic Acids Res. 38, 8072–
8082.
Browning, D.F., and Busby, S.J. (2004). The regulation of bacterial transcrip-
tion initiation. Nat. Rev. Microbiol. 2, 57–65.
Buchler, N.E., Gerland, U., and Hwa, T. (2003). On schemes of combinatorial
transcription logic. Proc. Natl. Acad. Sci. USA 100, 5136–5141.
Busby, S., and Ebright, R.H. (1999). Transcription activation by catabolite acti-
vator protein (CAP). J. Mol. Biol. 293, 199–213.
Busby, S., West, D., Lawes, M., Webster, C., Ishihama, A., and Kolb, A. (1994).
Transcription activation by the Escherichia coli cyclic AMP receptor protein.
Receptors bound in tandem at promoters can interact synergistically. J. Mol.
Biol. 241, 341–352.
Ca�gatay, T., Turcotte, M., Elowitz, M.B., Garcia-Ojalvo, J., and Suel, G.M.
(2009). Architecture-dependent noise discriminates functionally analogous
differentiation circuits. Cell 139, 512–522.
Choy, H.E., Park, S.W., Aki, T., Parrack, P., Fujita, N., Ishihama, A., and Adhya,
S. (1995). Repression and activation of transcription by Gal and Lac repres-
sors: involvement of alpha subunit of RNA polymerase. EMBO J. 14, 4523–
4529.
Choy, H.E., Hanger, R.R., Aki, T., Mahoney, M., Murakami, K., Ishihama, A.,
and Adhya, S. (1997). Repression and activation of promoter-bound RNA
polymerase activity by Gal repressor. J. Mol. Biol. 272, 293–300.
Davidson, E.H. (2006). The Regulatory Genome: Gene Regulatory Networks in
Development and Evolution (Burlington, MA; San Diego, CA: Academic).
Elledge, S.J., and Davis, R.W. (1989). Position and density effects on repres-
sion by stationary and mobile DNA-binding proteins. Genes Dev. 3, 185–197.
Elowitz, M.B., and Leibler, S. (2000). A synthetic oscillatory network of tran-
scriptional regulators. Nature 403, 335–338.
Fowlkes, C.C., Hendriks, C.L., Keranen, S.V., Weber, G.H., Rubel, O., Huang,
M.Y., Chatoor, S., DePace, A.H., Simirenko, L., Henriquez, C., et al. (2008). A
quantitative spatiotemporal atlas of gene expression in the Drosophila blasto-
derm. Cell 133, 364–374.
Gama-Castro, S., Jimenez-Jacinto, V., Peralta-Gil, M., Santos-Zavaleta, A.,
Penaloza-Spinola, M.I., Contreras-Moreira, B., Segura-Salazar, J., Muniz-
Rascado, L., Martınez-Flores, I., Salgado, H., et al. (2008). RegulonDB (version
6.0): gene regulation model of Escherichia coli K-12 beyond transcription,
active (experimental) annotated promoters and Textpresso navigation. Nucleic
Acids Res. 36(Database issue), D120–D124.
Garcia, H.G., and Phillips, R. (2011). Quantitative dissection of the simple
repression input-output function. Proc. Natl. Acad. Sci. USA 108, 12173–
12178.
Garcia, H.G., Lee, H.J., Boedicker, J.Q., and Phillips, R. (2011). Comparison
and calibration of different reporters for quantitative analysis of gene expres-
sion. Biophys. J. 101, 535–544.
Gardner, T.S., Cantor, C.R., and Collins, J.J. (2000). Construction of a genetic
toggle switch in Escherichia coli. Nature 403, 339–342.
Gaston, K., Bell, A., Kolb, A., Buc, H., and Busby, S. (1990). Stringent spacing
requirements for transcription activation by CRP. Cell 62, 733–743.
Gertz, J., Siggia, E.D., and Cohen, B.A. (2009). Analysis of combinatorial cis-
regulation in synthetic and genomic promoters. Nature 457, 215–218.
Geserick, C., Meyer, H.A., and Haendler, B. (2005). The role of DNA response
elements as allosteric modulators of steroid receptor function. Mol. Cell.
Endocrinol. 236, 1–7.
Haugen, S.P., Ross, W., and Gourse, R.L. (2008). Advances in bacterial
promoter recognition and its control by factors that do not bind DNA. Nat.
Rev. Microbiol. 6, 507–519.
Hochschild, A., and Dove, S.L. (1998). Protein-protein contacts that activate
and repress prokaryotic transcription. Cell 92, 597–600.
Hogan, M.E., and Austin, R.H. (1987). Importance of DNA stiffness in protein-
DNA binding specificity. Nature 329, 263–266.
Joung, J.K., Le, L.U., and Hochschild, A. (1993). Synergistic activation of
transcription by Escherichia coli cAMP receptor protein. Proc. Natl. Acad.
Sci. USA 90, 3083–3087.
Joung, J.K., Koepp, D.M., and Hochschild, A. (1994). Synergistic activation of
transcription by bacteriophage lambda cI protein and E. coli cAMP receptor
protein. Science 265, 1863–1866.
Kalodimos, C.G., Bonvin, A.M., Salinas, R.K., Wechselberger, R., Boelens, R.,
and Kaptein, R. (2002). Plasticity in protein-DNA recognition: lac repressor
interacts with its natural operator 01 through alternative conformations of its
DNA-binding domain. EMBO J. 21, 2866–2876.
Kalodimos, C.G., Boelens, R., and Kaptein, R. (2004). Toward an integrated
model of protein-DNA recognition as inferred from NMR studies on the Lac
repressor system. Chem. Rev. 104, 3567–3586.
160 Cell Reports 2, 150–161, July 26, 2012 ª2012 The Authors
Klumpp, S., Zhang, Z., and Hwa, T. (2009). Growth rate-dependent global
effects on gene expression in bacteria. Cell 139, 1366–1375.
Kuhlman, T., Zhang, Z., Saier, M.H., Jr., and Hwa, T. (2007). Combinatorial
transcriptional control of the lactose operon of Escherichia coli. Proc. Natl.
Acad. Sci. USA 104, 6043–6048.
Lee, D.H., and Schleif, R.F. (1989). In vivo DNA loops in araCBAD: size limits
and helical repeat. Proc. Natl. Acad. Sci. USA 86, 476–480.
Lefstin, J.A., and Yamamoto, K.R. (1998). Allosteric effects of DNA on tran-
scriptional regulators. Nature 392, 885–888.
Leung, T.H., Hoffmann, A., and Baltimore, D. (2004). One nucleotide in
a kappaB site can determine cofactor specificity for NF-kappaB dimers. Cell
118, 453–464.
Lilja, A.E., Jenssen, J.R., and Kahn, J.D. (2004). Geometric and dynamic
requirements for DNA looping, wrapping and unwrapping in the activation of
E. coli glnAp2 transcription by NtrC. J. Mol. Biol. 342, 467–478.
Lopez, P.J., Guillerez, J., Sousa, R., andDreyfus, M. (1998). On themechanism
of inhibition of phage T7 RNA polymerase by lac repressor. J. Mol. Biol. 276,
861–875.
Ma, B., Tsai, C.J., Pan, Y., and Nussinov, R. (2010). Why does binding of
proteins to DNA or proteins to proteins not necessarily spell function? ACS
Chem. Biol. 5, 265–272.
Madan Babu, M., and Teichmann, S.A. (2003). Functional determinants of
transcription factors in Escherichia coli: protein families and binding sites.
Trends Genet. 19, 75–79.
Mao, C., Carlson, N.G., and Little, J.W. (1994). Cooperative DNA-protein
interactions. Effects of changing the spacing between adjacent binding sites.
J. Mol. Biol. 235, 532–544.
Martin, R.G., Bartlett, E.S., Rosner, J.L., and Wall, M.E. (2008). Activation of
the Escherichia coli marA/soxS/rob regulon in response to transcriptional
activator concentration. J. Mol. Biol. 380, 278–284.
Meijsing, S.H., Pufall, M.A., So, A.Y., Bates, D.L., Chen, L., and Yamamoto,
K.R. (2009). DNA binding site sequence directs glucocorticoid receptor
structure and activity. Science 324, 407–410.
Monsalve, M., Calles, B., Mencıa, M., Salas, M., and Rojo, F. (1997). Transcrip-
tion activation or repression by phage psi 29 protein p4 depends on the
strength of the RNA polymerase-promoter interactions. Mol. Cell 1, 99–107.
Monsalve, M., Mencıa, M., Salas, M., and Rojo, F. (1996). Protein p4 represses
phage phi 29 A2c promoter by interacting with the alpha subunit of Bacillus
subtilis RNA polymerase. Proc. Natl. Acad. Sci. USA 93, 8913–8918.
Muller-Hill, B. (1996). The lac Operon: A Short History of a Genetic Paradigm
(Berlin, New York: Walter de Gruyter).
Muller, J., Oehler, S., and Muller-Hill, B. (1996). Repression of lac promoter as
a function of distance, phase and quality of an auxiliary lac operator. J. Mol.
Biol. 257, 21–29.
Newlands, J.T., Ross, W., Gosink, K.K., and Gourse, R.L. (1991). Factor-inde-
pendent activation of Escherichia coli rRNA transcription. II. characterization
of complexes of rrnB P1 promoters containing or lacking the upstream acti-
vator region with Escherichia coli RNA polymerase. J. Mol. Biol. 220, 569–583.
Novak, B., and Tyson, J.J. (2008). Design principles of biochemical oscillators.
Nat. Rev. Mol. Cell Biol. 9, 981–991.
Pavco, P.A., and Steege, D.A. (1990). Elongation by Escherichia coli RNA
polymerase is blocked in vitro by a site-specific DNA binding protein. J. Biol.
Chem. 265, 9960–9969.
Pavco, P.A., and Steege, D.A. (1991). Characterization of elongating T7 and
SP6 RNA polymerases and their response to a roadblock generated by
a site-specific DNA binding protein. Nucleic Acids Res. 19, 4639–4646.
Ptashne, M., and Gann, A. (2002). Genes and Signals (New York: Cold Spring
Harbor Laboratory Press).
Raveh-Sadka, T., Levo,M., Shabi, U., Shany, B., Keren, L., Lotan-Pompan,M.,
Zeevi, D., Sharon, E., Weinberger, A., and Segal, E. (2012). Tuning expression
in a predictable manner by manipulating nucleosomes disfavoring sequences.
Nat. Rev. Genet. http://dx.doi.org/10.1038/ng.2305
Rojo, F. (1999). Repression of transcription initiation in bacteria. J. Bacteriol.
181, 2987–2991.
Romanuka, J., Folkers, G.E., Biris, N., Tishchenko, E., Wienk, H., Bonvin, A.M.,
Kaptein, R., and Boelens, R. (2009). Specificity and affinity of Lac repressor for
the auxiliary operators O2 and O3 are explained by the structures of their
protein-DNA complexes. J. Mol. Biol. 390, 478–489.
Roy, S., Semsey, S., Liu, M., Gussin, G.N., and Adhya, S. (2004). GalR
represses galP1 by inhibiting the rate-determining open complex formation
through RNA polymerase contact: a GalR negative control mutant. J. Mol.
Biol. 344, 609–618.
Ryu, S., Fujita, N., Ishihama, A., and Adhya, S. (1998). GalR-mediated repres-
sion and activation of hybrid lacUV5 promoter: differential contacts with RNA
polymerase. Gene 223, 235–245.
Sanchez, A., Osborne, M.L., Friedman, L.J., Kondev, J., and Gelles, J. (2011).
Mechanism of transcriptional repression at a bacterial promoter by analysis of
single molecules. EMBO J. 30, 3940–3946.
Schlax, P.J., Capp, M.W., and Record, M.T., Jr. (1995). Inhibition of transcrip-
tion initiation by lac repressor. J. Mol. Biol. 245, 331–350.
Scully, K.M., Jacobson, E.M., Jepsen, K., Lunyak, V., Viadiu, H., Carriere, C.,
Rose, D.W., Hooshmand, F., Aggarwal, A.K., and Rosenfeld, M.G. (2000).
Allosteric effects of Pit-1 DNA sites on long-term repression in cell type spec-
ification. Science 290, 1127–1131.
Segal, E., and Widom, J. (2009). From DNA sequence to transcriptional
behaviour: a quantitative approach. Nat. Rev. Genet. 10, 443–456.
Segal, E., Raveh-Sadka, T., Schroeder, M., Unnerstall, U., and Gaul, U. (2008).
Predicting expression patterns from regulatory sequence in Drosophila
segmentation. Nature 451, 535–540.
Straney, S.B., and Crothers, D.M. (1987). Lac repressor is a transient gene-
activating protein. Cell 51, 699–707.
Tsai, T.Y., Choi, Y.S., Ma, W., Pomerening, J.R., Tang, C., and Ferrell, J.E., Jr.
(2008). Robust, tunable biological oscillations from interlinked positive and
negative feedback loops. Science 321, 126–129.
Vilar, J.M., and Leibler, S. (2003). DNA looping and physical constraints on
transcription regulation. J. Mol. Biol. 331, 981–989.
Voss, T.C., Schiltz, R.L., Sung, M.H., Yen, P.M., Stamatoyannopoulos, J.A.,
Biddie, S.C., Johnson, T.A., Miranda, T.B., John, S., and Hager, G.L. (2011).
Dynamic exchange at regulatory elements during chromatin remodeling
underlies assisted loading mechanism. Cell 146, 544–554.
Wall, M.E., Markowitz, D.A., Rosner, J.L., and Martin, R.G. (2009). Model of
transcriptional activation by MarA in Escherichia coli. PLoS Comput. Biol. 5,
e1000614.
Zinzen, R.P., Girardot, C., Gagneur, J., Braun, M., and Furlong, E.E. (2009).
Combinatorial binding predicts spatio-temporal cis-regulatory activity. Nature
462, 65–70.
Cell Reports 2, 150–161, July 26, 2012 ª2012 The Authors 161