operational risk assessment of chemical industries by
TRANSCRIPT
University of Pennsylvania University of Pennsylvania
ScholarlyCommons ScholarlyCommons
Departmental Papers (CBE) Department of Chemical & Biomolecular Engineering
March 2007
Operational risk assessment of chemical industries by exploiting Operational risk assessment of chemical industries by exploiting
accident databases accident databases
A. Meel University of Pennsylvania
L. M. O'Neill University of Pennsylvania
J. H. Levin University of Pennsylvania
Warren D. Seider University of Pennsylvania, [email protected]
U. Oktem University of Pennsylvania
See next page for additional authors
Follow this and additional works at: https://repository.upenn.edu/cbe_papers
Recommended Citation Recommended Citation Meel, A., O'Neill, L. M., Levin, J. H., Seider, W. D., Oktem, U., & Karen, N. (2007). Operational risk assessment of chemical industries by exploiting accident databases. Retrieved from https://repository.upenn.edu/cbe_papers/90
Postprint version. Published in Journal of Loss Prevention in the Process Industries, Volume 20, Issue 2, March 2007, pages 113-127. Publisher URL: http://dx.doi.org/10.1016/j.jlp.2006.10.003
This paper is posted at ScholarlyCommons. https://repository.upenn.edu/cbe_papers/90 For more information, please contact [email protected].

Operational risk assessment of chemical industries by exploiting accident Operational risk assessment of chemical industries by exploiting accident databases databases
Abstract Abstract Accident databases (NRC, RMP, and others) contain records of incidents (e.g., releases and spills) that have occurred in the USA chemical plants during recent years. For various chemical industries, [Kleindorfer, P. R., Belke, J. C., Elliott, M. R., Lee, K., Lowe, R. A., & Feldman, H. I. (2003). Accident epidemiology and the US chemical industry: Accident history and worst-case data from RMP*Info. Risk Analysis, 23(5), 865–881.] summarize the accident frequencies and severities in the RMP*Info database. Also, [Anand, S., Keren, N., Tretter, M. J., Wang, Y., O’Connor, T. M., & Mannan, M. S. (2006). Harnessing data mining to explore incident databases, the Journal of Hazardous Material, 130, 33–41.] use data mining to analyze the NRC database for Harris County, Texas.
Classical statistical approaches are ineffective for low frequency, high consequence events because of their rarity. Given this information limitation, this paper uses Bayesian theory to forecast incident frequencies, their relevant causes, equipment involved, and their consequences, in specific chemical plants. Systematic analyses of the databases also help to avoid future accidents, thereby reducing the risk.
More specifically, this paper presents dynamic analyses of incidents in the NRC database. The NRC database is exploited to model the rate of occurrence of incidents in various chemical and petrochemical companies using Bayesian theory. Probability density distributions are formulated for their causes (e.g., equipment failures, operator errors, etc.), and associated equipment items utilized within a particular industry. Bayesian techniques provide posterior estimates of the cause and equipment-failure probabilities. Cross-validation techniques are used for checking the modeling, validation, and prediction accuracies. Differences in the plant- and chemical-specific predictions with the overall predictions are demonstrated. Furthermore, extreme value theory is used for consequence modeling of rare events by formulating distributions for events over a threshold value. Finally, the fast-Fourier transform is used to estimate the capital at risk within an industry utilizing the frequency and loss-severity distributions.
Keywords Keywords risk, frequency modeling, consequence modeling, abnormal events, chemical plants
Comments Comments Postprint version. Published in Journal of Loss Prevention in the Process Industries, Volume 20, Issue 2, March 2007, pages 113-127. Publisher URL: http://dx.doi.org/10.1016/j.jlp.2006.10.003
Author(s) Author(s) A. Meel, L. M. O'Neill, J. H. Levin, Warren D. Seider, U. Oktem, and N. Karen
This journal article is available at ScholarlyCommons: https://repository.upenn.edu/cbe_papers/90
UNCORRECTED PROOF
Journal of Loss Prevention in the Process Industries ] (]]]]) ]]]–]]]
Operational risk assessment of chemical industries by exploitingaccident databases
A. Meela, L.M. O’Neilla, J.H. Levina, W.D. Seidera,�, U. Oktemb, N. Kerenc
aDepartment of Chemical and Biomolecular Engineering, University of Pennsylvania, Philadelphia, PA 19104-6393, USAbRisk Management and Decision Center, Wharton School, University of Pennsylvania, Philadelphia, PA 19104-6340, USA
cDepartment of Agricultural and Biosystems Engineering, Iowa State University, Ames, IA 50011-3080, USA
Received 11 June 2006; received in revised form 17 October 2006; accepted 18 October 2006
Abstract
Accident databases (NRC, RMP, and others) contain records of incidents (e.g., releases and spills) that have occurred in the USA chemical
plants during recent years. For various chemical industries, [Kleindorfer, P. R., Belke, J. C., Elliott, M. R., Lee, K., Lowe, R. A., & Feldman,
H. I. (2003). Accident epidemiology and the US chemical industry: Accident history and worst-case data from RMP*Info. Risk Analysis,
23(5), 865–881.] summarize the accident frequencies and severities in the RMP*Info database. Also, [Anand, S., Keren, N., Tretter, M. J.,
Wang, Y., O’Connor, T. M., & Mannan, M. S. (2006). Harnessing data mining to explore incident databases. Journal of Hazardous Material,
130, 33–41.] use data mining to analyze the NRC database for Harris County, Texas.
Classical statistical approaches are ineffective for low frequency, high consequence events because of their rarity. Given this information
limitation, this paper uses Bayesian theory to forecast incident frequencies, their relevant causes, equipment involved, and their consequences,
in specific chemical plants. Systematic analyses of the databases also help to avoid future accidents, thereby reducing the risk.
More specifically, this paper presents dynamic analyses of incidents in the NRC database. The NRC database is exploited to model the
rate of occurrence of incidents in various chemical and petrochemical companies using Bayesian theory. Probability density distributions
are formulated for their causes (e.g., equipment failures, operator errors, etc.), and associated equipment items utilized within a
particular industry. Bayesian techniques provide posterior estimates of the cause and equipment-failure probabilities. Cross-validation
techniques are used for checking the modeling, validation, and prediction accuracies. Differences in the plant- and chemical-specific
predictions with the overall predictions are demonstrated. Furthermore, extreme value theory is used for consequence modeling of rare
events by formulating distributions for events over a threshold value. Finally, the fast-Fourier transform is used to estimate the capital at
risk within an industry utilizing the frequency and loss-severity distributions.
r 2006 Published by Elsevier Ltd.
Keywords: Risk; Frequency modeling; Consequence modeling; Abnormal events; Chemical plants
1. Introduction
Since the accidents at Flixborough, Seveso, and Bhopal,the reporting of abnormal events in the chemical industrieshas been encouraged to collect accident precursors. Effortsto increase the reporting of near-misses, with near-missmanagement audits, have been initiated by the WhartonRisk Management Center (Phimister, Oktem, Kleindorfer,& Kunreuther, 2003). In addition, the AIChE center forchemical process safety (CCPS) has facilitated the devel-opment of a process safety incident database (PSID) tocollect and share incident information, permitting indus-
ARTICLE IN PRESS
www.elsevier.com/locate/jlp
1
3
5
7
9
11
13
15
17
19
21
23
25
27
29
31
33
35
37
39
41
43
45
47
49
51
53
55
57
59
61
63
65
67
69
71
73
8:07f=WðJul162004Þþmodel
JLPP : 1830 Prod:Type:FTPpp:1215ðcol:fig::NILÞ
ED:ShruthiHJPAGN:vs SCAN:
0950-4230/$ - see front matter r 2006 Published by Elsevier Ltd.
doi:10.1016/j.jlp.2006.10.003
Abbreviations: Companies A, B, C, D, E, F, G, A, B, C, D, E, F, G;
Basic indicator approach, BIA; Capital at risk, CaR; Center for chemical
process safety (AIChE), CCPS; Equipment failure, EF; Environmental
protection agency, EPA; Extreme value theory, EVT; Fast-Fourier
transform, FFT; Heat transfer units, HT; Inverse fast-Fourier transform,
IFFT; Internal measurement approach, IMA; Loss distribution approach,
LDA; Markov-chain Monte Carlo, MCMC; Major accident reporting
system, MARS; National response center, NRC; Others, O; Operator
error, OE; Occupational safety and health administration, OSHA; Process
safety incident database, PSID; Process safety management, PSM; Process
units, PU; Process vessels, PV; Quantile-quantile, Q-Q; Risk management
plan, RMP; Standardized approach, SA; Storage vessel, SV; Transfer line,
TL�Corresponding author. Tel.: +1215 898 7953.
E-mail address: [email protected] (W.D. Seider).
Please cite this article as: Meel, A., et al. Operational risk assessment of chemical industries by exploiting accident databases. Journal of Loss Prevention
in the Process Industries, (2006), doi:10.1016/j.jlp.2006.10.003

UNCORRECTED PROOF
ARTICLE IN PRESS
JLPP : 1830
1
3
5
7
9
11
13
15
17
19
21
23
25
27
29
31
33
35
37
39
41
43
45
47
49
51
53
55
57
59
61
63
65
67
69
71
73
75
77
79
81
83
85
87
89
91
93
95
97
99
101
103
105
107
109
111
113
Nomenclature
a,b parameters of Beta prior probability distribu-tion
ai, bi parameters of prior probability distribution ofcause i for an incident
d1, d2, d3 cumulative number of incidents of causes EF,OE, and O at the end of each year
ei probability of involvement of equipment type i
E(m|Data) expected posterior mean of mE(q|Data) expected posterior mean of q
E(y) expected value of number of incidents in a yearE[Yi|Y�i] expected value of prediction of incident in
year i based on incidents in Y�i
f(ei) prior probability distribution of involvement ofequipment i for an incident
f(xi|Data) posterior probability distribution of involve-ment of equipment i conditional upon Data
f(xi) prior probability distribution of cause i for anincident
f(xi|Data) posterior probability distribution of cause i
conditional upon Data
fl discrete loss-severity distribution functionfz(Z) discrete probability distribution function of
total lossFu(y) cumulative probability distribution for distri-
bution of losses, l, over threshold u
G(l) Generalized Pareto distribution of lossesl loss associated with an incidentMi+Ni+Oi cumulative number of incidents associated
with equipment i at the end of each yearnp number of points desired in total loss distribu-
tionNC/P number of incidents associated with compres-
sors and pumpsNd amount of damage, $Ne number of evacuationsNEF number of incidents associated with equipment
failuresNf number of fatalitiesNh number of hospitalizationsNHT number of incidents associated with heat-
transfer equipment itemsNi number of injuriesNOE number of incidents associated with operator
errorsNPU number of incidents associated with process
unitsNSV number of incidents associated with storage
vesselsNt number of yearsNTL number of incidents associated with transfer-
line equipment
Ntotal total number of incidentsNU number of incidents associated with unknown
causesp(l) prior distribution of lp(l|Data) posterior distribution of l given Data
p(q|Data) marginal posterior distribution of q givenData
p(m|Data) marginal posterior distribution of m givenData
PN probability generating function of the fre-quency of events, N
pi, qi parameters of prior probability distribution ofinvolvement of equipment i in an incident
q parameter of the Negative Binomial distributions total number of incidents in Nt yearsu threshold value of l for loss-severity distributionV(y) variance of number of incidents per yearwd dimensionless damage measurewe dollar amount per evacuation, $wf dollar amount per fatality, $wh dollar amount per hospitalization, $wi dollar amount per injury, $x1, x2, x3 probabilities of causes EF, OE, and O for an
incidentyi number of incidents in year i
zi predictive score for incidents in year i
Z total annual loss for a company
Greek
a, b parameters for Gamma density distributionfunction
b(a, b) Beta density distribution with parameters a andb
fl characteristic function of the loss-severity dis-tribution
fZ characteristic function of total loss distributionl average annual number of incidentslB average annual number of incidents for com-
pany B with losses greater than u
lF average annual number of incidents for com-pany F with losses greater than u
m parameter of the Negative Binomial distributionx, b parameters of the generalized Pareto distribu-
tiong(a, b) Gamma distribution with parameters a and b
Subscript
i year countern year vector
A. Meel et al. / Journal of Loss Prevention in the Process Industries ] (]]]]) ]]]–]]]2
Please cite this article as: Meel, A., et al. Operational risk assessment of chemical industries by exploiting accident databases. Journal of Loss Prevention
in the Process Industries, (2006), doi:10.1016/j.jlp.2006.10.003
UNCORRECTED PROOF
trial participants access to the database, while sharing theircollective experiences (CCPS, 1995). Finally, the Mary KaySafety Center at Texas A&M University (TAMU) has beengathering incident data in the chemical industries (Anandet al., 2006; Mannan, O’Connor, & West, 1999).
An incident database, involving oil, chemical, andbiological discharges into the environment in the USAand its territories, is maintained by the national responsecenter (NRC) (NRC, 1990). While companies participatevoluntarily, raising reliability concerns, the NRC databasefor Harris County, Texas, is acknowledged to be reliablethanks to the conscientious efforts of many chemicalcompanies in reporting incidents. Moreover, the Mary KaySafety Center has concentrated time and resources towardrefining the Harris County database to increase itsreliability and consistency.
To record accidents, European industries submit theirdata to the major accident-reporting system (MARS)(Rasmussen, 1996), while a database for chemical compa-nies in the USA is created from risk management plans(RMP) submitted by facilities subject to Environmentalprotection agency’s (EPA) chemical accidental releaseprevention and response regulations (Kleindorfer et al.,2003; RMP, 2000).
Several researchers have been analyzing and investigat-ing incident databases to identify common trends and toestimate risks. For example, Chung and Jefferson (1998)have developed an approach to integrate accident data-bases with computer tools used by chemical plantdesigners, operators, and maintenance engineers, permit-ting accident reports to be easily accessed and analyzed. Inaddition, Sonnemans, Korvers, Brombacher, van Beek,and Reinders (2003) have investigated 17 accidents thathave occurred in the Netherlands petrochemical industriesand have demonstrated qualitatively that had accidentprecursor information been recorded, with proper mea-sures to control future occurrences, these accidents couldhave been foreseen and possibly prevented. Furthermore,Sonnemans and Korvers (2006) observed that even afterrecognizing accident precursors and disruptions, theoperating systems inside companies often fail to preventaccidents. The results of yet another analysis feature thelessons learned from the major accident and near-missevents in Germany from 1993 to 1996 (Uth, 1999; Uth &Wiese, 2004). Finally, Elliott, Wang, Lowe, and Kleindor-fer (2004) analyzed the frequency and severity of accidentsin the RMP database with respect to socioeconomic factorsand found that larger chemically intensive companies arelocated in counties with larger African-American popula-tions and with both higher median incomes and higherlevels of income inequality. Note that accident precursorshave been studied also in railways, nuclear plants, healthscience centers, aviation, finance companies, and bankingsystems.
On the risk estimation frontier, Kirchsteiger (1997)discussed the strengths and weaknesses of probabilisticand deterministic methods in risk analysis using illustra-
tions associated with nuclear and chemical plants. It isargued that probabilistic methods are more cost-effective,giving results that are easier to communicate to decisionand policy makers. In addition, Goossens and Cooke(1997) described the application of two risk assessmenttechniques involving: (i) formal expert judgment toestablish quantitative subjective assessments of designand model parameters, and (ii) system failure analysis,with accident precursors, using operational evidence ofsystem failures to derive the failure probability of thesystem. Furthermore, a human and organizational relia-bility analysis in accident management (HORAAM)method was introduced to quantify human and organiza-tional factors in accident management using decision trees(Baumont, Menage, Schneiter, Spurgin, & Vogel, 2000).In this work, statistical methods are introduced to
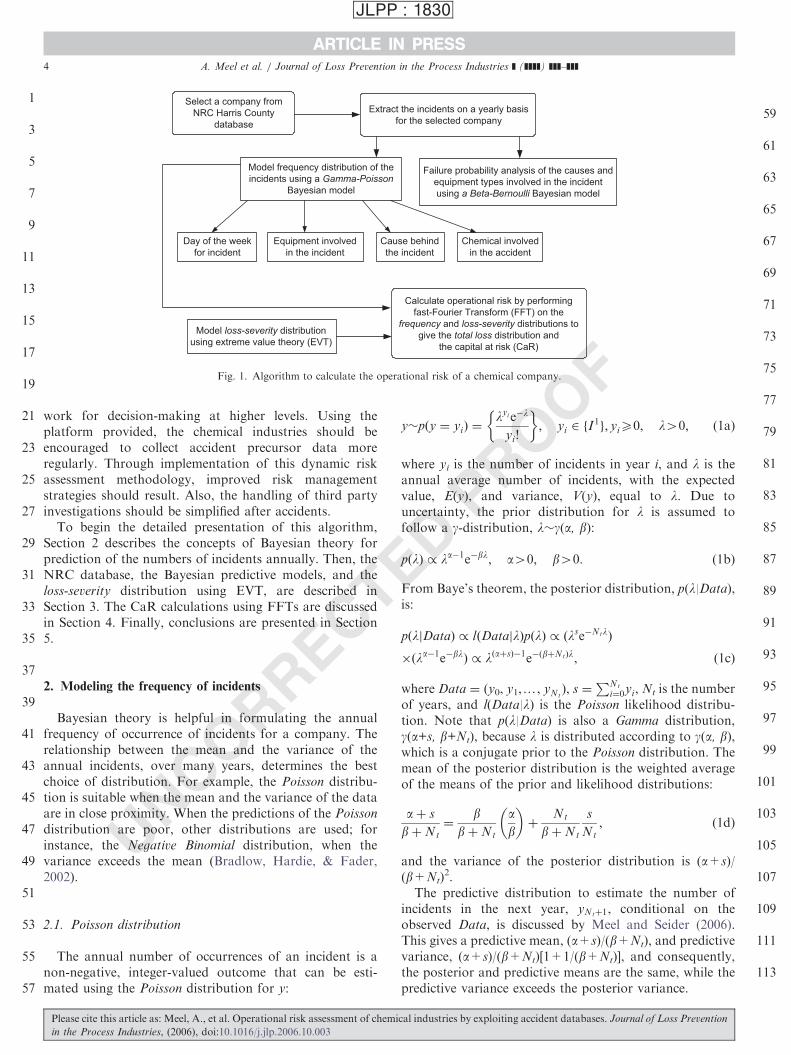
estimate the operational risk for seven companies, includ-ing petrochemical and specialty chemical manufacturers,using the NRC database for Harris County, with the riskestimated as the product of the frequency and conse-quences of the incidents. Fig. 1 shows the algorithm forcalculating the operational risk of a chemical company.For a company in the database, the incidents are extractedon a yearly basis. Then, the frequency distribution of theincidents is estimated using a g-Poisson Bayesian model.Note that significant differences in the prediction ofincidents are observed for the individual companies, ascompared with predictions obtained when the incidentsfrom all of the companies are lumped together. TheBayesian theory upgrades prior information available, ifany, using data to increase the confidence level in modelingthe frequency of incidents, decreasing the uncertainty indecision-making with annual information upgrades (Ro-bert, 2001).Additional g-Poisson Bayesian models are developed to
provide the frequency distribution of the day of the weekon which the incidents occur, the equipment typesinvolved, the causes behind the incidents, and the chemicalsinvolved. In parallel, the failure probabilities of the processunits, as well as the causes of the incidents, are predictedusing a b-Bernoulli Bayesian model.Later, a loss-severity distribution of the incidents is
modeled using extreme value theory (EVT) by formulatinga quantitative index for the loss as a weighted sum of thedifferent types of consequences. Through EVT, bothextreme and unusually rare events, which characterizeincidents reported in the chemical industries, are modeledeffectively. Note that EVT has been applied in structural,aerospace, ocean, and hydraulic engineering (Embrechts,Kluppelberg, & Mikosch, 1997). Herein, EVT is introducedto measure the operational risk in the chemical industries.Finally, the operational risk of the individual chemical
industries is computed by performing fast-Fourier trans-forms (FFT) of the product of the frequency and loss-
severity distributions to obtain the total loss distributionand the capital at risk (CaR). This approach to measuringrisks in specific companies provides a quantitative frame-
ARTICLE IN PRESS
JLPP : 1830
1
3
5
7
9
11
13
15
17
19
21
23
25
27
29
31
33
35
37
39
41
43
45
47
49
51
53
55
57
59
61
63
65
67
69
71
73
75
77
79
81
83
85
87
89
91
93
95
97
99
101
103
105
107
109
111
113
A. Meel et al. / Journal of Loss Prevention in the Process Industries ] (]]]]) ]]]–]]] 3
Please cite this article as: Meel, A., et al. Operational risk assessment of chemical industries by exploiting accident databases. Journal of Loss Prevention
in the Process Industries, (2006), doi:10.1016/j.jlp.2006.10.003
UNCORRECTED PROOF
work for decision-making at higher levels. Using theplatform provided, the chemical industries should beencouraged to collect accident precursor data moreregularly. Through implementation of this dynamic riskassessment methodology, improved risk managementstrategies should result. Also, the handling of third partyinvestigations should be simplified after accidents.
To begin the detailed presentation of this algorithm,Section 2 describes the concepts of Bayesian theory forprediction of the numbers of incidents annually. Then, theNRC database, the Bayesian predictive models, and theloss-severity distribution using EVT, are described inSection 3. The CaR calculations using FFTs are discussedin Section 4. Finally, conclusions are presented in Section5.
2. Modeling the frequency of incidents
Bayesian theory is helpful in formulating the annualfrequency of occurrence of incidents for a company. Therelationship between the mean and the variance of theannual incidents, over many years, determines the bestchoice of distribution. For example, the Poisson distribu-tion is suitable when the mean and the variance of the dataare in close proximity. When the predictions of the Poisson
distribution are poor, other distributions are used; forinstance, the Negative Binomial distribution, when thevariance exceeds the mean (Bradlow, Hardie, & Fader,2002).
2.1. Poisson distribution
The annual number of occurrences of an incident is anon-negative, integer-valued outcome that can be esti-mated using the Poisson distribution for y:
y�pðy ¼ yiÞ ¼lyie�l
yi!
� �; yi 2 fI
1g; yiX0; l40; (1a)
where yi is the number of incidents in year i, and l is theannual average number of incidents, with the expectedvalue, E(y), and variance, V(y), equal to l. Due touncertainty, the prior distribution for l is assumed tofollow a g-distribution, l�g(a, b):
pðlÞ / la�1e�bl; a40; b40: (1b)
From Baye’s theorem, the posterior distribution, p(l|Data),is:
pðljDataÞ / lðDatajlÞpðlÞ / ðlse�NtlÞ
�ðla�1e�blÞ / lðaþsÞ�1e�ðbþNtÞl, ð1cÞ
where Data ¼ (y0, y1,y, yNt), s ¼
PNt
i¼0yi, Nt is the numberof years, and l(Data|l) is the Poisson likelihood distribu-tion. Note that p(l|Data) is also a Gamma distribution,g(a+s, b+Nt), because l is distributed according to g(a, b),which is a conjugate prior to the Poisson distribution. Themean of the posterior distribution is the weighted averageof the means of the prior and likelihood distributions:
aþ s
bþNt
¼b
bþNt
ab
� �þ
Nt
bþNt
s
Nt
; (1d)
and the variance of the posterior distribution is (a+s)/(b+Nt)
2.The predictive distribution to estimate the number of
incidents in the next year, yNtþ1, conditional on theobserved Data, is discussed by Meel and Seider (2006).This gives a predictive mean, (a+s)/(b+Nt), and predictivevariance, (a+s)/(b+Nt)[1+1/(b+Nt)], and consequently,the posterior and predictive means are the same, while thepredictive variance exceeds the posterior variance.
ARTICLE IN PRESS
JLPP : 1830
1
3
5
7
9
11
13
15
17
19
21
23
25
27
29
31
33
35
37
39
41
43
45
47
49
51
53
55
57
59
61
63
65
67
69
71
73
75
77
79
81
83
85
87
89
91
93
95
97
99
101
103
105
107
109
111
113
Select a company fromNRC Harris County
database
Extract the incidents on a yearly basisfor the selected company
Model frequency distribution of theincidents using a Gamma-Poisson
Bayesian model
Day of the weekfor incident
Cause behindthe incident
Equipment involvedin the incident
Chemical involvedin the accident
Failure probability analysis of the causes andequipment types involved in the incidentusing a Beta-Bernoulli Bayesian model
Model loss-severity distributionusing extreme value theory (EVT)
Calculate operational risk by performingfast-Fourier Transform (FFT) on the
frequency and loss-severity distributions togive the total loss distribution and
the capital at risk (CaR)
Fig. 1. Algorithm to calculate the operational risk of a chemical company.
A. Meel et al. / Journal of Loss Prevention in the Process Industries ] (]]]]) ]]]–]]]4
Please cite this article as: Meel, A., et al. Operational risk assessment of chemical industries by exploiting accident databases. Journal of Loss Prevention
in the Process Industries, (2006), doi:10.1016/j.jlp.2006.10.003

UNCORRECTED PROOF
2.2. Negative binomial distribution
The annual number of occurrences of an incident is anon-negative, integer-valued outcome that can be esti-mated using the Negative Binomial distribution for y:
y�ðqÞmð1� qÞyi yi 2 fI1g; yiX0; m40; qX0; (1e)
where yi is the number of incidents in year i, and m(1�q)/qis the expected annual (mean) number of incidents, E(y),and m(1�q)/q2 is the expected variance, V(y). Due touncertainty, the prior distribution for m is assumed tofollow a Gamma distribution, m�g(a, b):
pðmÞ / ma�1e�bm; a40; b40, (1f)
and that for q is assumed to follow a Beta distribution,q�b(a, b):
pðqÞ / qa�1ð1� qÞb�1; a40; b40. (1g)
From Baye’s theorem, the posterior distribution, p(m,q|Da-
ta), is
pðm; qjDataÞ / lðDatajm; qÞpðmÞpðqÞ
/ qnmð1� qÞsðma�1e�bmÞqa�1ð1� qÞb�1
/ qnmþa�1ð1� qÞsþb�1ðma�1e�bmÞ,
ð1hÞ
where Data ¼ (y0, y1,y, yNt), s ¼
PNt
i¼0yi, Nt is the numberof years, and l(Data|m,q) is the Negative Binomial like-lihood distribution. The marginal posterior distributions,p(m|Data) and p(q|Data), and the posterior means E(m|Da-
ta) and E(q|Data) are obtained using the Markov ChainMonte-Carlo (MCMC) method in the WINBUGS soft-ware (Spiegelhalter et al., 2003). These added calculationsare not needed for the Poisson distribution, in which theexpected value, E(l|Data), is computed easily using Eq.(1d).
2.3. Model-checking
To check the accuracy of the model, the number ofincidents in year i, yi, is removed, leaving the data,y�i ¼ (y0,y, yi�1, yi+1,y,yNt
), over Nt�1 years. Then, aBayesian model applied to y�i is used to predict yi. Finally,yi and E[yi|y�i] are compared, and predictive z-scores areused to measure their proximity:
zi ¼yi � E½yijy�i�ffiffiffiffiffiffiffiffiffiffiffiffiffiffiffiffiffiffi
V ½yijy�i�p . (2)
For a good model, the mean and standard deviation ofz ¼ (z0,y,zNt
) should approach zero and one, respectively.
3. Analysis of the NRC database
The NRC database contains reports on the oil, chemical,radiological, biological, and etiological discharges into theenvironment in the USA and its territories (NRC, 1990). Atypical incident report includes the date of the incident, the
chemical involved, the cause of the incident, the equipmentinvolved, the volume of the chemical release, and the extentof the consequences. Herein, the incidents reported forHarris County, Texas, for seven specific facilities duringthe years 1990–2002, are analyzed to determine theirfrequencies and consequences (loss-severities). This datasetwas obtained from the Mary Kay Safety Center at TAMU,which filtered the NRC database for Harris County, takingcare to eliminate duplications of incidents when theyoccurred. More specifically, the filtered dataset by Anandet al. (2006), comprised of 7265 records, is used for furtherprocessing.The equipment is classified into 13 major categories:
electrical equipment (E1), pumps/compressors (E2), flarestacks (E3), heat-transfer equipment (E4), hoses (flexiblepipes) (E5), process units (E6), process vessels (PV) (E7),separation equipment (E8), storage vessels (E9), pipes andfittings (E10), unclassified equipment (E11), relief equipment(E12), and unknowns (E13). The Harris County databaseincludes several causes of the incidents, including equip-ment failures (EF), operator errors (OE), unknown causes(U), dumping (intentional and illegal deposition of materialon the ground), and others, with the EF and OE causesbeing the most significant. Herein, the unknown causes(U), dumping, and others are combined and referred to asothers (O).
3.1. Prediction of incidents at chemical companies
Table 1 shows the number of incidents extracted fromthe NRC database for the seven companies. The totalnumber of incidents, Ntotal, and the number of incidents ofEF, NEF, OE, NOE, and due to unknown causes, NU, arelisted during the years 1990–2002. In addition, from the 13equipment categories, the number of incidents of processunits, NPU, storage vessels, NSV, compressors/pumps, NC/P,heat-transfer equipment, NHT, and transfer-line equipment,NTL, are included. Note that the large excess of EFcompared with the numbers of OE was unanticipated.Perhaps this is due to cost-saving measures that havereduced maintenance budgets, with major repairs post-poned until they are deemed to be urgent. Also, becauseautomated equipment often experiences fewer failures thanthose related to the inconsistencies of the operators, it islikely that many reported EF are indirectly a result of OE.For each of the seven companies, the numbers of
incidents were predicted for future years utilizing datafrom previous years. Included are the total number ofincidents, Ntotal, the number of incidents associated witheach equipment type, and the number of incidentsassociated with each cause. In the remainder of thissection, selected results are presented and discussed.Figs. 2(a) and (b) show the predictions of the number of
incidents for companies B and F using Poisson distribu-tions which are chosen arbitrarily to illustrate the varia-tions in the predictive power of the models. In these figures,the number of incidents for the year n are forecasted using
ARTICLE IN PRESS
JLPP : 1830
1
3
5
7
9
11
13
15
17
19
21
23
25
27
29
31
33
35
37
39
41
43
45
47
49
51
53
55
57
59
61
63
65
67
69
71
73
75
77
79
81
83
85
87
89
91
93
95
97
99
101
103
105
107
109
111
113
A. Meel et al. / Journal of Loss Prevention in the Process Industries ] (]]]]) ]]]–]]] 5
Please cite this article as: Meel, A., et al. Operational risk assessment of chemical industries by exploiting accident databases. Journal of Loss Prevention
in the Process Industries, (2006), doi:10.1016/j.jlp.2006.10.003

UNCORRECTED PROOF
the Gamma-Poisson Bayesian techniques based on thenumber of incidents from 1990 to n�1, where n ¼ 1991,1992, y, 2002. These are compared to the number ofincidents that occurred in year n for companies B and F,respectively.
In the absence of information to model the priordistribution for the year 1990, a and b are assumed to be0.001, providing a relatively flat distribution in the regionof interest; that is, a non-informative prior distribution.Note that information upon which to base the priorparameters would enhance the early predictions of themodels. This has been illustrated for a Beta-Bernoulli
Bayesian model, using informative and non-informativeprior distributions, showing the sensitivity of the predic-tions to the prior values (Meel & Seider, 2006). Forcompany B, using non-informative prior distributions,either the numbers of incidents are close to the predictednumbers or higher than those predicted. However, forcompany F, the numbers of incidents are close to or lessthan those predicted.
When examining the results for the seven companies, thesizable variations in the number of incidents observed in aparticular year are attributed to several factors includingmanagement and planning efforts to control the incidents,it being assumed that no significant differences occurred toaffect the reporting of the incidents from 1990 to 2002—
although OSHA’s PSM standard and EPA’s RMP rulewere introduced in 1992 and 1996, respectively. Therefore,when the number of incidents is less than those predicted, itseems clear that good incident-control strategies wereimplemented within the company. Similarly, when thenumber of incidents is higher than those predicted, theprecursor data yields a warning to consider enhancing themeasures to reduce the number of incidents in the future.A good agreement between the numbers of incidents
predicted and observed indicates that a stable equilibrium isachieved with respect to the predictive power of the model.Such a state is achieved when the numbers of incidents andtheir causes do not change significantly from year-to-year.Note, however, that even as stable equilibrium is ap-proached, efforts to reduce the number of incidents shouldcontinue. This is because, even when successful measuresare taken year after year (that reduce the number ofincidents), the predictive values are usually conservative,lagging behind until the incidence rates converge over a fewyears.Next, the results of the Bayesian model checking using
the R software package (Gentleman et al., 2005) tocompute predictive distributions are presented in quanti-le–quantile (Q–Q) plots. For company F, Fig. 3(a) showsthe density profile of incidents, while Fig. 3(b) shows thenormal Q–Q plot, which compares the distribution of z
ARTICLE IN PRESS
JLPP : 1830
1
3
5
7
9
11
13
15
17
19
21
23
25
27
29
31
33
35
37
39
41
43
45
47
49
51
53
55
57
59
61
63
65
67
69
71
73
75
77
79
81
83
85
87
89
91
93
95
97
99
101
103
105
107
109
111
113
Table 1
Number of incidents for seven companies in the NRC database
Companies Type Ntotal NEF NOE NU NPU NSV NC/P NHT NTL
A Petrochemical 688 443 56 101 59 101 86 58 121
B Petrochemical 568 387 48 88 110 69 127 47 56
C Specialty chemical 401 281 35 46 45 61 10 28 77
D Petrochemical 220 122 24 16 25 16 36 27 15
E Specialty chemical 119 77 21 8 13 22 11 12 23
F Specialty chemical 83 57 14 7 6 21 8 10 18
G Specialty chemical 18 9 2 5 1 1 1 3 2
Company B
01 3 5 7 9 11
10
20
30
40
50
60
70
80
Year (1991-2002)
Company F
Year (1991-2002)
Num
ber
of in
cid
ents
01 3 5 7 9 11
2
4
6
8
10
12
14
Num
ber
of in
cid
ents
No. of incidents Predicted no. of incidents
a b
Fig. 2. Total number of incidents: (a) company B, (b) company F.
A. Meel et al. / Journal of Loss Prevention in the Process Industries ] (]]]]) ]]]–]]]6
Please cite this article as: Meel, A., et al. Operational risk assessment of chemical industries by exploiting accident databases. Journal of Loss Prevention
in the Process Industries, (2006), doi:10.1016/j.jlp.2006.10.003

UNCORRECTED PROOF
(Eq. (2)) to the normal distribution (represented by thestraight line), where the elements of z are represented bycircles. The sample quantiles of z (ordered values of z,where the elements, zi, are called quantiles) are close to thetheoretical quantiles (equally-spaced data from a normaldistribution), confirming the accuracy of the modelpredictions. Most of the values are in good agreement,except for two outliers at the theoretical quantiles, 1.0 and1.5.
Figs. 4(a) and (b) show the density profile of incidentsand the Q–Q plot for company B. Comparing Figs. 4(a)and 3(a), the number of incidents at company B is muchhigher than at company F. In addition, the variation in thenumber of incidents in different years is higher at companyB (between �25 and 65) than at company F (between �0and 15). Note that the circles on the Q–Q plot in Fig. 4(b)depart more significantly from the straight line, possiblydue to the larger year-to-year variation in the number ofincidents as well as the appropriateness of the of Gamma-
Poisson distribution. The circles below the straight linecorrespond to the safe situation where the number ofincidents is less than higher than predicted, provide awarning.The predictions in Fig. 4(b) are improved by using a
Negative Binomial likelihood distribution with Gamma andBeta prior distributions. The prior distribution for 1990 isobtained using a ¼ b ¼ 0.001, and a ¼ b ¼ 1.0, providing arelatively flat distribution in the region of interest; that is, anon-informative prior distribution. The Negative Binomial
distribution provides better agreement for company B,while the Poisson distribution is preferred for company F.
3.2. Statistical analysis of incident causes and equipment
types
In this analysis, for each company, Bayesian models areformulated for each cause and equipment type. Because ofthe large variations in the number of incidents observed
ARTICLE IN PRESS
JLPP : 1830
1
3
5
7
9
11
13
15
17
19
21
23
25
27
29
31
33
35
37
39
41
43
45
47
49
51
53
55
57
59
61
63
65
67
69
71
73
75
77
79
81
83
85
87
89
91
93
95
97
99
101
103
105
107
109
111
113
Density
0.00
5 10
Number of incidents
15 20 -1.5 -1.0
Theoretical quantiles
Normal Q-Q Plot
-0.5 0.0 0.5 1.0 1.5
0.05
0.10
0.15
Sam
ple
quantile
s
-1
0
1
2
a b
Fig. 3. Company F: (a) density of incidents, (b) Q–Q plot.
ba
6
4
2
0
-2
-6
-4
Sam
ple
quantile
0.06
0.05
0.04
0.03
0.02
0.01
21.510.50-0.5
45 degree lineNegative BinomialPoisson
Normal Q-Q Plot
Theoretical quantile
-1-2 -1.5806040
Number of incidents
200
0.00
Density
Fig. 4. Company B: (a) density of incidents, (b) Q–Q plot.
A. Meel et al. / Journal of Loss Prevention in the Process Industries ] (]]]]) ]]]–]]] 7
Please cite this article as: Meel, A., et al. Operational risk assessment of chemical industries by exploiting accident databases. Journal of Loss Prevention
in the Process Industries, (2006), doi:10.1016/j.jlp.2006.10.003
UNCORRECTED PROOF
over the years, the performance of the Gamma-Poisson
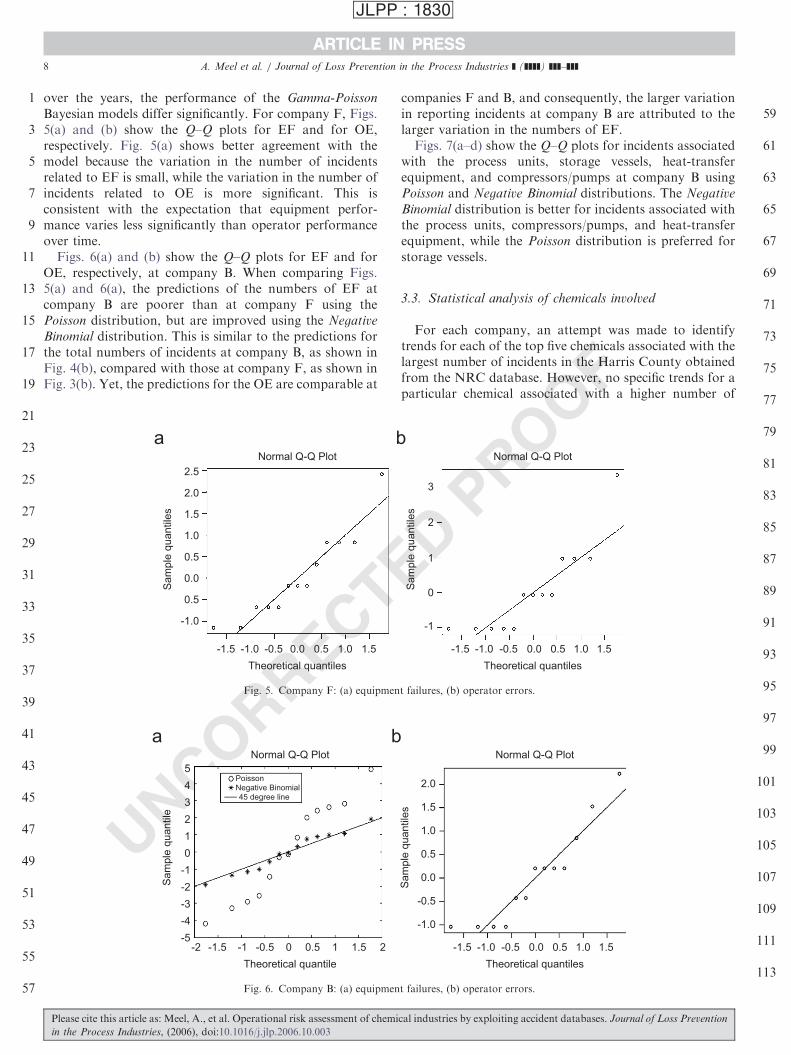
Bayesian models differ significantly. For company F, Figs.5(a) and (b) show the Q–Q plots for EF and for OE,respectively. Fig. 5(a) shows better agreement with themodel because the variation in the number of incidentsrelated to EF is small, while the variation in the number ofincidents related to OE is more significant. This isconsistent with the expectation that equipment perfor-mance varies less significantly than operator performanceover time.
Figs. 6(a) and (b) show the Q–Q plots for EF and forOE, respectively, at company B. When comparing Figs.5(a) and 6(a), the predictions of the numbers of EF atcompany B are poorer than at company F using thePoisson distribution, but are improved using the Negative
Binomial distribution. This is similar to the predictions forthe total numbers of incidents at company B, as shown inFig. 4(b), compared with those at company F, as shown inFig. 3(b). Yet, the predictions for the OE are comparable at
companies F and B, and consequently, the larger variationin reporting incidents at company B are attributed to thelarger variation in the numbers of EF.Figs. 7(a–d) show the Q–Q plots for incidents associated
with the process units, storage vessels, heat-transferequipment, and compressors/pumps at company B usingPoisson and Negative Binomial distributions. The Negative
Binomial distribution is better for incidents associated withthe process units, compressors/pumps, and heat-transferequipment, while the Poisson distribution is preferred forstorage vessels.
3.3. Statistical analysis of chemicals involved
For each company, an attempt was made to identifytrends for each of the top five chemicals associated with thelargest number of incidents in the Harris County obtainedfrom the NRC database. However, no specific trends for aparticular chemical associated with a higher number of
ARTICLE IN PRESS
JLPP : 1830
1
3
5
7
9
11
13
15
17
19
21
23
25
27
29
31
33
35
37
39
41
43
45
47
49
51
53
55
57
59
61
63
65
67
69
71
73
75
77
79
81
83
85
87
89
91
93
95
97
99
101
103
105
107
109
111
113
ba
3
2
1
0
-1
Sam
ple
quantile
s
2.5
2.0
1.5
1.0
0.5
0.0
1.51.00.50.0-0.5
Normal Q-Q PlotNormal Q-Q Plot
Theoretical quantiles
-1.0-1.50.5 1.0 1.50.0-0.5
Theoretical quantiles
-1.0-1.5
0.5
-1.0
Sam
ple
quantile
s
Fig. 5. Company F: (a) equipment failures, (b) operator errors.
ba
2.0
1.5
1.0
0.5
0.0
-0.5
-1.0
Sam
ple
quantile
s
5
4
3
2
1
0
1.51.00.50.0-0.5
Normal Q-Q PlotNormal Q-Q Plot
Theoretical quantiles
-1.0-1.50.5 1 1.5 20-0.5
Theoretical quantile
-1-1.5-2
-1
-2
-3
-4
-5
Sam
ple
quantile
45 degree lineNegative BinomialPoisson
Fig. 6. Company B: (a) equipment failures, (b) operator errors.
A. Meel et al. / Journal of Loss Prevention in the Process Industries ] (]]]]) ]]]–]]]8
Please cite this article as: Meel, A., et al. Operational risk assessment of chemical industries by exploiting accident databases. Journal of Loss Prevention
in the Process Industries, (2006), doi:10.1016/j.jlp.2006.10.003

UNCORRECTED PROOF
incidents in all of the companies were observed. This couldbe because different products are produced in varyingamounts by different companies. It might be preferable tocarry out the analysis for a company that manufacturessimilar chemicals at different locations or for differentcompanies that produce similar products.
3.4. Statistical analysis of the day of the week
For each of the seven companies, Table 2 summarizesthe model checking of the Bayesian predictive distributionsof the days of the week, with the mean, E, and variance, V,of z tabulated. Again, the predictions improve with thetotal number of incidents observed for a company. As seen,the mean and variance of z indicate that higher deviationsare observed on Wednesdays and Thursdays for all of thecompanies, except company G. Lower deviations occur atthe beginning of the week and over the weekends. Tounderstand this observation, more information appears tobe necessary; for example, (1) defining the operator shiftand maintenance schedules, (2) carrying out operatorsurveys, (3) determining operator work loads, and (4)relating the data on the causes of the incidents to the daysof the week, identifying more specific patterns. Further-more, the higher means and variances for company G on
Friday and Saturday suggest that additional data areneeded to generate a reliable Bayesian model.
3.5. Rates of EF and OE
In this section, for an incident, the probabilities of theinvolvement of each of the 13 equipment types and theprobabilities of their causes (EF, OE and O) are modeled.The tree in Fig. 8 shows, for each incident, the possiblecauses, and for each cause, the possible equipment types.Note that alternatively the tree could show, for eachincident, the possible equipment types followed by thepossible causes. x1, x2, x3 are the probabilities of causesEF, OE, and O for an incident, and d1, d2, d3 are thecumulative numbers of incidents at the end of each year. e1,e2, e3, y, e13 are the probabilities of the involvement ofequipment types, E1, E2, y, E13, in an incident throughdifferent causes, where M1+N1+O1, M2+N2+O2,M3+N3+O3, y, M13+N13+O13 are the cumulativenumber of incidents associated with each equipment type.The prior distributions of the probability of xi are
modeled using Beta distributions with parameters ai and bi:
f ðxiÞ / ðxiÞai�1ð1� xiÞ
bi�1; i ¼ 1; . . . ; 3, (3)
having means ¼ ai/(ai+bi) and variances ¼ aibi/(ai+-bi)
2(ai+bi+1). These conjugate Beta prior distributions
ARTICLE IN PRESS
JLPP : 1830
1
3
5
7
9
11
13
15
17
19
21
23
25
27
29
31
33
35
37
39
41
43
45
47
49
51
53
55
57
59
61
63
65
67
69
71
73
75
77
79
81
83
85
87
89
91
93
95
97
99
101
103
105
107
109
111
113
PoissonNegative Binomial45 degree line
PoissonNegative Binomial45 degree line
Sam
ple
quantities
Theoretical quantile
21.510.50-0.5-1-1.5-2
Theoretical quantities
21.510.50-0.5-1-1.5-2-4
-2
0
2
4
6
8
10
-2
-1
0
1
2
3
4
Normal Q-Q Plot Normal Q-Q Plot
Sam
ple
quantile
c d
PoissonNegative Binomial45 degree linePoisson
Negative Binomial45 degree line
Sam
ple
quantile
Theoretical quantile
21.510.50-0.5-1-1.5-2-3
-2.5
-2
-1.5
-1
-0.5
0
0.5
1
1.52
Theoretical quantile
21.510.50-0.5-1-1.5-2-3
-2
-1
0
1
2
3
4
5
67
Normal Q-Q Plot Normal Q-Q Plot
Sam
ple
quantile
a b
Fig. 7. Company B: (a) process units, (b) storage vessels, (c) Heat-transfer equipment, and (d) compressors/pumps.
A. Meel et al. / Journal of Loss Prevention in the Process Industries ] (]]]]) ]]]–]]] 9
Please cite this article as: Meel, A., et al. Operational risk assessment of chemical industries by exploiting accident databases. Journal of Loss Prevention
in the Process Industries, (2006), doi:10.1016/j.jlp.2006.10.003

UNCORRECTED PROOF
are updated using Bernoulli’s likelihood distribution toobtain the posterior distribution of the probability of xi:
f ðxijDataÞ / ðxiÞai�1þdi ð1� xiÞ
bi�1þP3
k¼1;aidk f ðxiÞ: (4)
The posterior distributions, which are also Beta distribu-tions having parameters, ai+di, and bi þ
P3k¼1;aidk,
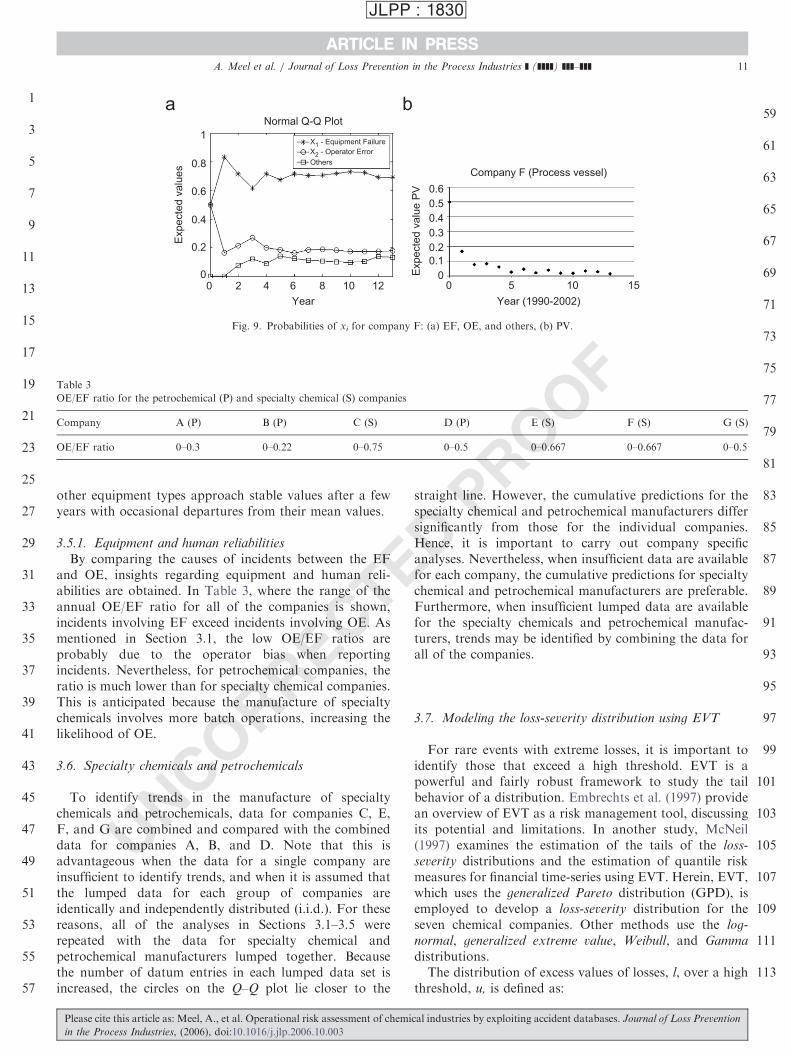
change at the end of each year as di change. a1 and b1are assumed to be 1.0 to give a flat, non-informative, priordistribution; a2 and b2 are assumed to be 0.998 and 1.002 togive a nearly flat, non-informative, prior distribution; anda3 and b3 are 0.001 and 0.999. Consequently, the meanprior probabilities of EF, OE, and O are 0.5, 0.499, and0.001, respectively, as shown in Fig. 9(a).
The posterior means and variances are obtained over theyears 1990–2002 for each of the seven companies. Fig. 9(a)shows the probabilities, x1, x2, and x3, of the causes EF,OE, and O for an incident at company F. Using the data atthe end of each year, the probabilities increase from 0.5 forthe EF, decrease from 0.499 for the OE, and increase from0.001 for the others, with the OE approaching slightlyhigher values than those for the others.
Similarly, analyses for the probabilities of the equipmenttypes, e1, e2, y, e13, are carried out using Beta distribu-
tions, f(ei) and f (ei|Data), with the Data, M1+N1+O1,M2+N2+O2, M3+N3+O3, y, M13+N13+O13. Theprior distributions of the probabilities of ei are modeledusing Beta distributions with parameters pi and qi:
f ðeiÞ / ðeiÞpi�1ð1� eiÞ
qi�1; i ¼ 1; . . . ; 13, (5)
having means ¼ pi/(pi+qi) and variances ¼ piqi/(pi+qi)2(-
pi+qi+1). These conjugate Beta prior distributions areupdated using Bernoulli’s likelihood distribution to obtainthe posterior distributions of the probabilities of ei:
f ðeijDataÞ / ðeiÞpi�1þMiþNiþOi
� ð1� eiÞqi�1þ
P13k¼1;ai
MkþNkþOk
f ðeiÞ: ð6Þ
The posterior distributions, which are also Beta distribu-tions having parameters, pi+Mi+Ni+Oi, andqi þ
P3k¼1;aiMk þNk þOk, change at the end of each
year as Mi+Ni+Oi change. The parameters, pi and qi, arechosen to give flat, non-informative, prior distributions.The posterior means and variances are obtained over the
years 1990–2002 for each of the thirteen equipment types ateach of the seven companies. Fig. 9(b) shows, for anincident, that the probability of the involvement of the PVdecreases over time. Similarly, the probabilities for the
ARTICLE IN PRESS
JLPP : 1830
1
3
5
7
9
11
13
15
17
19
21
23
25
27
29
31
33
35
37
39
41
43
45
47
49
51
53
55
57
59
61
63
65
67
69
71
73
75
77
79
81
83
85
87
89
91
93
95
97
99
101
103
105
107
109
111
113
Table 2
Q–Q plot properties for day of the week analysis of incidents
Mon Tue Wed Thru Fri Sat Sun
A 0.027, 1.5 0.015, 1.06 0.032, 1.55 0.046, 1.9 0.023, 1.31 0.022, 1.23 0.055, 1.93
B 0.032, 1.53 0.047, 1.8 0.06, 2.12 0.058, 2.05 0.035, 1.55 0.027, 1.25 0.033, 1.46
C 0.027, 1.28 0.024, 1.21 0.047, 1.67 0.048, 1.62 0.031, 1.33 0.019, 1.002 0.039, 1.48
D 0.15, 2.3 0.165, 2.7 0.2, 2.96 0.2, 3.22 0.13, 2.44 0.126, 2.22 0.27, 3.4
E 0.038, 1.06 0.037, 1.19 0.086, 1.66 0.078, 1.64 0.11, 1.89 0.07, 1.46 0.036, 0.96
F 0.034, 1.06 0.06, 1.27 0.04, 1.08 0.87, 0.05 0.035, 0.98 0.043, 1.01 0.07, 1.22
G 0.06, 1.09 0.14, 1.29 0.14, 1.29 0.14, 1.29 7.84, 29.26 15.82, 58.48 0.23, 1.96
Entry in each cell–E(z), V(z)
Incident
Equipment failure(EF)
Operator error(OE)
Others(O)
E1
E2 E
3E
4E
13 E1
E2 E
3E
4E
13E
1E
2 E3
E4
E13
x1
x2
x3
d1
d2
d3
e1
e2
e3
e13
e1
e2
e3 e
13e
1e
2e
3e
13
M1
M2
M3 M
4M
13 N1
N2
N3 N
4N
13 O1
O2 O
3O
4O
13
Fig. 8. Tree of causes and equipment types involved in an incident.
A. Meel et al. / Journal of Loss Prevention in the Process Industries ] (]]]]) ]]]–]]]10
Please cite this article as: Meel, A., et al. Operational risk assessment of chemical industries by exploiting accident databases. Journal of Loss Prevention
in the Process Industries, (2006), doi:10.1016/j.jlp.2006.10.003
UNCORRECTED PROOF
other equipment types approach stable values after a fewyears with occasional departures from their mean values.
3.5.1. Equipment and human reliabilities
By comparing the causes of incidents between the EFand OE, insights regarding equipment and human reli-abilities are obtained. In Table 3, where the range of theannual OE/EF ratio for all of the companies is shown,incidents involving EF exceed incidents involving OE. Asmentioned in Section 3.1, the low OE/EF ratios areprobably due to the operator bias when reportingincidents. Nevertheless, for petrochemical companies, theratio is much lower than for specialty chemical companies.This is anticipated because the manufacture of specialtychemicals involves more batch operations, increasing thelikelihood of OE.
3.6. Specialty chemicals and petrochemicals
To identify trends in the manufacture of specialtychemicals and petrochemicals, data for companies C, E,F, and G are combined and compared with the combineddata for companies A, B, and D. Note that this isadvantageous when the data for a single company areinsufficient to identify trends, and when it is assumed thatthe lumped data for each group of companies areidentically and independently distributed (i.i.d.). For thesereasons, all of the analyses in Sections 3.1–3.5 wererepeated with the data for specialty chemical andpetrochemical manufacturers lumped together. Becausethe number of datum entries in each lumped data set isincreased, the circles on the Q–Q plot lie closer to the
straight line. However, the cumulative predictions for thespecialty chemical and petrochemical manufacturers differsignificantly from those for the individual companies.Hence, it is important to carry out company specificanalyses. Nevertheless, when insufficient data are availablefor each company, the cumulative predictions for specialtychemical and petrochemical manufacturers are preferable.Furthermore, when insufficient lumped data are availablefor the specialty chemicals and petrochemical manufac-turers, trends may be identified by combining the data forall of the companies.
3.7. Modeling the loss-severity distribution using EVT
For rare events with extreme losses, it is important toidentify those that exceed a high threshold. EVT is apowerful and fairly robust framework to study the tailbehavior of a distribution. Embrechts et al. (1997) providean overview of EVT as a risk management tool, discussingits potential and limitations. In another study, McNeil(1997) examines the estimation of the tails of the loss-
severity distributions and the estimation of quantile riskmeasures for financial time-series using EVT. Herein, EVT,which uses the generalized Pareto distribution (GPD), isemployed to develop a loss-severity distribution for theseven chemical companies. Other methods use the log-
normal, generalized extreme value, Weibull, and Gamma
distributions.The distribution of excess values of losses, l, over a high
threshold, u, is defined as:
ARTICLE IN PRESS
JLPP : 1830
1
3
5
7
9
11
13
15
17
19
21
23
25
27
29
31
33
35
37
39
41
43
45
47
49
51
53
55
57
59
61
63
65
67
69
71
73
75
77
79
81
83
85
87
89
91
93
95
97
99
101
103
105
107
109
111
113
Others
X2 - Operator Error
X1 - Equipment Failure
Expecte
d v
alu
es
0
0.2
0 12108642
Year
151050
Year (1990-2002)
Normal Q-Q Plot
Company F (Process vessel)
0.4
0.6
0.8
1
Expecte
d v
alu
e P
V 0.6
0.5
0.4
0.3
0.2
0.1
0
a b
Fig. 9. Probabilities of xi for company F: (a) EF, OE, and others, (b) PV.
Table 3
OE/EF ratio for the petrochemical (P) and specialty chemical (S) companies
Company A (P) B (P) C (S) D (P) E (S) F (S) G (S)
OE/EF ratio 0–0.3 0–0.22 0–0.75 0–0.5 0–0.667 0–0.667 0–0.5
A. Meel et al. / Journal of Loss Prevention in the Process Industries ] (]]]]) ]]]–]]] 11
Please cite this article as: Meel, A., et al. Operational risk assessment of chemical industries by exploiting accident databases. Journal of Loss Prevention
in the Process Industries, (2006), doi:10.1016/j.jlp.2006.10.003

UNCORRECTED PROOF
FuðyÞ ¼ Pr l � upyjl4u� �
¼F ðyþ uÞ � F ðuÞ
1� F ðuÞ; l 2 L,
(7)
which represents the probability that the value of l exceedsthe threshold, u, by less than or equal to y, given that l
exceeds the threshold, u, where F is the cumulativeprobability distribution, and L is the set of losses. This isthe so-called loss-severity distribution. Note that, for theNRC database, l is defined in Section 3.7.1. For sufficientlyhigh threshold, u, the distribution function of the excessmay be approximated by the GPD, G(l), and consequently,Fu(y) converges to the GPD as the threshold becomes large.The GPD is
GðlÞ ¼1� 1þ x l�u
b
�1=xif xa0
1� e�l=b if x ¼ 0
8<:
9=;, (8)
where b is the scale parameter, x is the shape parameter,and the tail index is x�1. Note that the GPD reduces todifferent distributions depending on x. The distribution ofexcesses may be approximated by the GPD by choosing xand b and setting a high threshold, u. The parameters ofthe GPD can be estimated using various techniques; forexample, the maximum likelihood method and the methodof probability-weighted moments.
3.7.1. Loss-severity distribution of the NRC database
Because few incidents have high severity levels, theincidents analyzed for the seven companies are assumed tobe i.i.d. Consequently, the incidents for a specific company(internal data) are combined with those for the othercompanies (external data) to obtain a common loss-severity
distribution for the seven companies. The loss associatedwith an incident, l, is calculated as a weighted sum of thenumbers of evacuations, Ne; injuries, Ni; hospitalizations,Nh; fatalities, Nf; and damages, Nd:
l ¼ weNe þ wiN i þ whNh þ wfN f þ wdNd, (9)
where we ¼ $100, wi ¼ $10,000, wh ¼ $50,000,wf ¼ $2,000,000, and wd ¼ 1, with Nd reported in dollars.Note the weighting factors were adjusted to align with thecompany performance histories.
For the NRC database, the threshold value, u, waschosen to be $10,000. As expected, the NRC database hasfew incidents that have a sizable loss. Only 157 incidentsamong those reported had monetary loss (l40), 64exceeded the threshold, and 108 exceeded or equaled thethreshold. A software package, Extreme Value Analysis inMATLAB (EVIM) Gencay et al. (2001), obtained theparameters of the GPD, x ¼ 0.8688 and b ¼ 1.7183� 104,for the NRC database using the maximum likelihoodmethod. Fig. 10 shows the predictions of Fu(y), thecumulative probability of the losses, l, that exceed or equalthe threshold, u. Note that while the cumulative distribu-tion of the losses could be improved with data from more
companies in Harris County, the predictions in Fig. 10 areconsidered to be satisfactory.By graphing log(1–Fu(y)), Fig. 11 emphasizes the tail of
the loss-severity distribution, with the value at risk (VaR)defined at 99.5% (1–Fu(y) ¼ 0.005) cumulative probabilityequal to $1.97� 106 and the lower and upper bounds onthe 95% confidence interval equal to $7.9� 105 and$6.0� 106, respectively. The VaR is a forecast of a specifiedpercentile (e.g., 99.5%), usually in the right tail, of the loss-
severity distribution over some period (e.g., annually).
4. Operational risk
Several types of risks, for example, credit, market, andoperational risks are encountered by chemical companies.In this work, the primary focus is on calculating the
ARTICLE IN PRESS
JLPP : 1830
1
3
5
7
9
11
13
15
17
19
21
23
25
27
29
31
33
35
37
39
41
43
45
47
49
51
53
55
57
59
61
63
65
67
69
71
73
75
77
79
81
83
85
87
89
91
93
95
97
99
101
103
105
107
109
111
113
1
0.9
0.8
0.7
0.6
0.5
0.4
0.3
0.2
0.1
NRC Data (108 incidents with / ≥ $10000)
Empirical GPD (ζ=0.8688, β=1.7183x10⁴)0104 105 106
LOSS /
Fu(y
)
107 108
Fig. 10. Loss-severity distribution of the NRC database.
1
0.1
0.01
0.001
0.0001104 105 106
LOSS /
790476.4
1
6000000
VaR
=1973761.0
Fu(y
)
107 108
Fig. 11. Tail behavior of the loss-severity distribution for companies A–G.
A. Meel et al. / Journal of Loss Prevention in the Process Industries ] (]]]]) ]]]–]]]12
Please cite this article as: Meel, A., et al. Operational risk assessment of chemical industries by exploiting accident databases. Journal of Loss Prevention
in the Process Industries, (2006), doi:10.1016/j.jlp.2006.10.003

UNCORRECTED PROOF
operational risk associated with a chemical company,which is defined as the risk of direct or indirect lossesresulting from inadequate or failed internal resources,people, and systems, or from external events.
Capital charge (that is, CaR) of a company due tooperational risk is calculated herein. Capital charge isobtained from the total loss distribution (to be definedbelow) using the VaR. Computation of the total loss
distribution is a common statistical approach in theactuarial sciences. This paper applies this approach to riskanalysis in the chemical industries. There are four methodsfor obtaining capital charge associated with operationalrisk: (i) the basic indicator approach (BIA), (ii) thestandardized approach (SA), (iii) the internal measurementapproach (IMA), and (iv) the loss distribution approach(LDA). The LDA (Klugman, Panjer, & Willmot, 1998) isconsidered to be the most sophisticated, and is used herein.
In the LDA, the annual frequency distribution ofincidents is obtained using internal data, while the loss-
severity distribution of an incident is obtained usinginternal and external data, as discussed in Section 3.7.1.By multiplying these two distributions, the total loss
distribution is obtained.Fig. 12 shows a schematic of the total loss distribution
for a chemical company. The expected loss corresponds tothe mean (expected) value and the unexpected loss is thevalue of the loss for a specified percentile (e.g., 99.5%)minus the expected loss. Note that, in some circles, the CaRis defined as the unexpected loss. However, herein, inagreement with other institutions, the CaR is the sum ofthe expected and unexpected losses, at the 99.5 percentile ofthe total loss distribution.
Highly accurate estimates of the CaR are difficult tocompute due to the scarcity of internal data for the extremeevents at most companies. Also, internal data are biasedtowards low-severity losses while external data are biasedtowards high-severity losses. Consequently, a mix ofinternal and external data is needed to enhance thestatistical significance. Furthermore, it is important tobalance the cost of recording very low-severity data and thetruncation bias or accuracy loss resulting from the use ofunduly high thresholds.
As when estimating the frequency of incidents (Section2), a frequency distribution is obtained initially usingBayesian theory for events with losses that exceed athreshold, u. Because operational risks are difficult toestimate shortly after operations begin, conservativeestimates of the parameters of the Poisson distributionmay be obtained. In these cases, the sensitivity of the CaRto the frequency parameter should be examined. After thefrequency distribution is obtained, it is multiplied with theloss-severity distribution and the FFT is used to calculatethe total loss distribution.
4.1. FFT algorithm
The algorithm for computing the total loss distributionusing the FFT is described in this section. Aggregate lossesare represented as the sum, Z, of a random number, N, ofindividual losses, l1, l2, y, lN. The characteristic functionof the total loss, fz(t), is:
fzðtÞ ¼ E½eitðZÞ� ¼ EN ½E½eitðl1þl2þ...þlN ÞjN��
¼ EN ½flðtÞN� ¼ PN ðflðtÞÞ, ð10Þ
where PN is the probability generating function of thefrequency of incidents, N, and fl is the characteristicfunction of the loss-severity distribution. The FFT pro-duces an approximation of fz and, using fz, the inversefast-Fourier transform (IFFT) gives fz(Z), the discreteprobability distribution of the total (aggregate) loss. Thedetails of the FFT, IFFT, and the characteristics functionare found elsewhere (Klugman et al., 1998).First, np ¼ 2r for some integer r is chosen, where np is the
desired number of points in the distribution of total losses,such that the total loss distribution has negligible prob-ability outside the range [0, np]. Herein, r ¼ 13 provides asufficiently broad range. It can be adjusted according to thenumber of incidents in a company. The next steps in thealgorithm are:
1. The loss-severity distribution is transformed fromcontinuous to discrete using the method of rounding(Klugman et al., 1998). The span is assumed to be$20,000 in line with the threshold for the GPD. Thediscrete loss-severity vector is represented as fl ¼ [fl(0),fl(1), y, fl(np-1)].
2. The FFT of the discrete loss-severity vector is carriedout to obtain the characteristic function of the loss-
severity distribution: fl ¼ FFT(fl).3. The probability generating function of the frequency,
PN(t) ¼ el(t–1), is applied, element-by-element, to theFFT of the discrete loss-severity vector to obtain thecharacteristic function of the total loss distribution:fz ¼ PN(fl).
4. The IFFT is applied to fz to recover the discretedistribution of the total losses: fz ¼ IFFT(fz).
ARTICLE IN PRESS
JLPP : 1830
1
3
5
7
9
11
13
15
17
19
21
23
25
27
29
31
33
35
37
39
41
43
45
47
49
51
53
55
57
59
61
63
65
67
69
71
73
75
77
79
81
83
85
87
89
91
93
95
97
99
101
103
105
107
109
111
113
Pro
babili
ty
Mean
Annual total (aggregate) loss ($)
Expected Unexpected
99.5th percentile
Fig. 12. Schematic of total loss distribution for a chemical company.
A. Meel et al. / Journal of Loss Prevention in the Process Industries ] (]]]]) ]]]–]]] 13
Please cite this article as: Meel, A., et al. Operational risk assessment of chemical industries by exploiting accident databases. Journal of Loss Prevention
in the Process Industries, (2006), doi:10.1016/j.jlp.2006.10.003

UNCORRECTED PROOF
4.2. Total loss distribution for companies B and F
The Poisson frequency parameters for companies B andF, obtained using internal data for each company, arelB ¼ 0.8461 and lF ¼ 0.0769. These are obtained usingBayesian theory for their incident data through the years 1to n�1 (1990–2001) for incidents having losses that exceedor equal the threshold, $10,000. The low lF indicates thelow probability of incidents having significant losses incompany F. For company B, lB indicates that about oneevent, with l4$10,000, is anticipated in the next year. Notethat the loss-severity distributions in Figs. 10 and 11 areobtained using both internal and external data.
Fig. 13(a) shows the tail of the cumulative plot of thetotal loss distribution for company B. The total loss at the99.5th percentile is $3.76� 106 and at the 99.9th percentileis $14.1� 106. When lBb1, a much higher value of CaR isexpected. Similarly, Fig. 13(b) shows the tail for companyF. The total loss at the 99.5th percentile is $0.43� 106 andat the 99.9th percentile is $1.78� 106. As expected, the CaRfor company F is lower than for company B by an order ofmagnitude.
Hence, this method provides plant-specific estimates ofthe CaR. Such calculations should be performed bychemical companies to provide better estimates forinsurance premiums and to add quantitative support forsafety audits.
5. Conclusions
Statistical models to analyze accident precursors in theNRC database have been developed. They:
1. Provide Bayesian models that facilitate improvedcompany-specific estimates, as compared with lumpedestimates involving all of the specialty chemical andpetrochemical manufacturers.
2. Identify Wednesday and Thursday as days of the weekin which higher variations in incidents are observed.
3. Are effective for testing equipment and human reliabil-ities, indicating that the OE/EF ratio is lower for
petrochemical than specialty chemical companies.4. Are beneficial for obtaining the value at risk (VaR) from
the loss-severity distribution using EVT and the capitalat risk (CaR) from the total loss distribution.
Consistent reporting of incidents is crucial for thereliability of this analysis. In addition, the predictive errorsare reduced when: (i) sufficient incidents are available for aspecific company to provide reliable means, and (ii) lessvariation occurs in the number of incidents from year-to-year. Furthermore, to obtain better predictions, it helps toselect distributions that better represent the data, properlymodeling the functionality between the mean and varianceof the data.
Acknowledgment
The interactions and advice of Professor Paul Kleindor-fer of the Wharton Risk Management and DecisionCenter, Wharton School, University of Pennsylvania, andProfessor Sam Mannan of the Mary Kay O’ConnorProcess Safety Center, Texas A&M University, areappreciated. Partial support for this research from theNational Science Foundation through grant CTS-0553941is gratefully acknowledged.
References
Anand, S., Keren, N., Tretter, M. J., Wang, Y., O’Connor, T. M., &
Mannan, M. S. (2006). Harnessing data mining to explore incident
databases. Journal of Hazardous Material, 130, 33–41.
Baumont, G., Menage, F., Schneiter, J. R., Spurgin, A., & Vogel, A.
(2000). Quantifying human and organizational factors in accident
management using decision trees: The HORAAM method. Reliability
Engineering System Safety, 70(2), 113–124.
Bradlow, E. T., Hardie, B. G. S., & Fader, P. S. (2002). Bayesian inference
for the negative binomial distribution via polynomial expansions.
Journal of Computational and Graphical Statistics, 11(1), 189–201.
CCPS (1995). Process Safety Incident Database (PSID). /http://www.ai-
che.org/CCPS/ActiveProjects/PSID/index.aspxS.
Chung, P. W. H., & Jefferson, M. (1998). The integration of accident
databases with computer tools in the chemical industry. Computers and
Chemical Engineering, 22, S729–S732.
ARTICLE IN PRESS
JLPP : 1830
1
3
5
7
9
11
13
15
17
19
21
23
25
27
29
31
33
35
37
39
41
43
45
47
49
51
53
55
57
59
61
63
65
67
69
71
73
75
77
79
81
83
85
87
89
91
93
95
97
99
101
103
105
107
109
111
113
ba100
10-1
10-2
10-3
10-4
10-5
104 105 106 107 108 109
1-F
Z(Z
)
10-1
10-2
10-3
10-4
10-5
10-6
104 105 106 107
Z, Aggregate LossZ, Aggregate Loss
99.5th
Percentile
99.9th
Percentile
99.5th
Percentile
99.9th
Percentile
108 109
1-F
Z(Z
)
Fig. 13. Total loss distribution for: (a) company B, (b) company F.
A. Meel et al. / Journal of Loss Prevention in the Process Industries ] (]]]]) ]]]–]]]14
Please cite this article as: Meel, A., et al. Operational risk assessment of chemical industries by exploiting accident databases. Journal of Loss Prevention
in the Process Industries, (2006), doi:10.1016/j.jlp.2006.10.003

UNCORRECTED PROOF
Elliott, M. R., Wang, Y., Lowe, R. A., & Kleindorfer, P. R. (2004).
Environmental justice: Frequency and severity of US chemical
industry accidents and the socioeconomic status of surrounding
communities. Journal of Epidemiology and Community Health, 58(1),
24–30.
Embrechts, P., Kluppelberg, C., & Mikosch, T. (1997). Modelling external
events. Berlin: Springer.
Gencay, R., Selcuk, F., & Ulugulyagci, A. (2001). EVIM: A software
package for extreme value analysis in MATLAB. Studies in Nonlinear
Dynamics and Econometrics, 5(3), 213–239.
Gentleman, R., Ihaka, R., Bates, D., Chambers, J., Dalgaard, J., &
Hornik, K. (2005). The R project for Statistical Computing. /http://
www.r-project.org/S.
Goossens, L. H. J., & Cooke, R. M. (1997). Applications of some risk
assessment techniques: Formal expert judgement and accident
sequence precursors. Safety Science, 26(1–2), 35–47.
Kirchsteiger, C. (1997). Impact of accident precursors on risk estimates
from accident databases. Journal of Loss Prevention in the Process
Industries, 10(3), 159–167.
Kleindorfer, P. R., Belke, J. C., Elliott, M. R., Lee, K., Lowe, R. A., &
Feldman, H. I. (2003). Accident epidemiology and the US chemical
industry: Accident history and worst-case data from RMP*Info. Risk
Analysis, 23(5), 865–881.
Klugman, S. A., Panjer, H. H., & Willmot, G. E. (1998). Loss Models:
From data to decisions. Wiley series in probability and statistics. Inc.
John Wiley & Sons.
Mannan, M. S., O’Connor, T. M., & West, H. H. (1999). Accident history
database: An opportunity. Environmental Progress, 18(1), 1–6.
McNeil, A. J. (1997). Estimating the tails of loss severity distributions
using extreme value theory. ASTIN Bulletin, 27, 117–137.
Meel, A., & Seider, W. D. (2006). Plant-specific dynamic failure
assessment using Bayesian theory. Chemical Engineering Science, 61,
7036–7056.
NRC (1990). National Response Center. /http://www.nrc.uscg.mil/
nrchp.htmlS.
Phimister, J. R., Oktem, U., Kleindorfer, P. R., & Kunreuther, H. (2003).
Near-miss incident management in the chemical process industry. Risk
Analysis, 23(3), 445–459.
Rasmussen, K. (1996). The experience with Major Accident Reporting
System from 1984 to 1993. European Commission, Joint Research
Center, EUR 16341 EN.
RMP (2000). 40 CFR Chapter IV, Accidental Release Prevention
Requirements; Risk Management Programs Under the Clean Air
Act Section 112(r)(7); Distribution of Off-Site Consequence Analysis
Information. Final Rule, 65 FR 48108.
Robert, C. P. (2001). The Bayesian choice. New York: Springer-Verlag.
Sonnemans, P. J. M., & Korvers, P. M. W. (2006). Accidents in the
chemical industry: Are they foreseeable? Journal of Loss Prevention in
the Process Industries, 19(1), 1–12.
Sonnemans, P. J. M., Korvers, P. M. W., Brombacher, A. C., van Beek, P.
C., & Reinders, J. E. A. (2003). Accidents, often the result of an
‘uncontrolled business process’—a study in the (Dutch) chemical
industry. Quality and Reliability Engineering International, 19(3),
183–196.
Spiegelhalter, D., Thomas, A., Best, N., & Lunn, D. (2003). Bayesian
inference Using Gibbs Samping (BUGS). /http://www.mrc-bsu.ca-
m.ac.uk/bugs/welcome.shtmlS.
Uth, H. J. (1999). Trends in major industrial accidents in Germany.
Journal of Loss Prevention in the Process Industries, 12(1), 69–73.
Uth, H. J., & Wiese, N. (2004). Central collecting and evaluating of major
accidents and near-miss-events in the Federal Republic of Germany—
results, experiences, perspectives. Journal of Hazardous Materials,
111(1–3), 139–145.
ARTICLE IN PRESS
JLPP : 1830
1
3
5
7
9
11
13
15
17
19
21
23
25
27
29
31
33
35
37
39
41
43
45
47
49
51
A. Meel et al. / Journal of Loss Prevention in the Process Industries ] (]]]]) ]]]–]]] 15
Please cite this article as: Meel, A., et al. Operational risk assessment of chemical industries by exploiting accident databases. Journal of Loss Prevention
in the Process Industries, (2006), doi:10.1016/j.jlp.2006.10.003