operational performance may’12 monthcarried tonnagemonthly traffic projection based on atp...
TRANSCRIPT
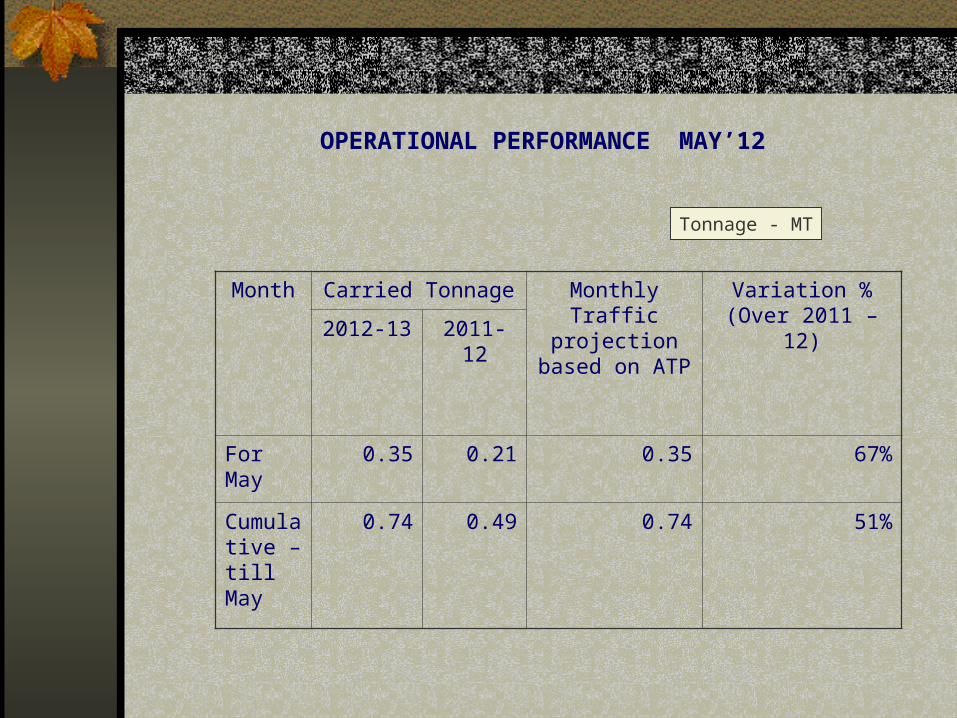
OPERATIONAL PERFORMANCE MAY’12
Month Carried Tonnage Monthly Traffic projection based
on ATP
Variation % (Over 2011 – 12)2012-13 2011-12
For May
0.35 0.21 0.35 67%
Cumulative – till May
0.74 0.49 0.74 51%
Tonnage - MT
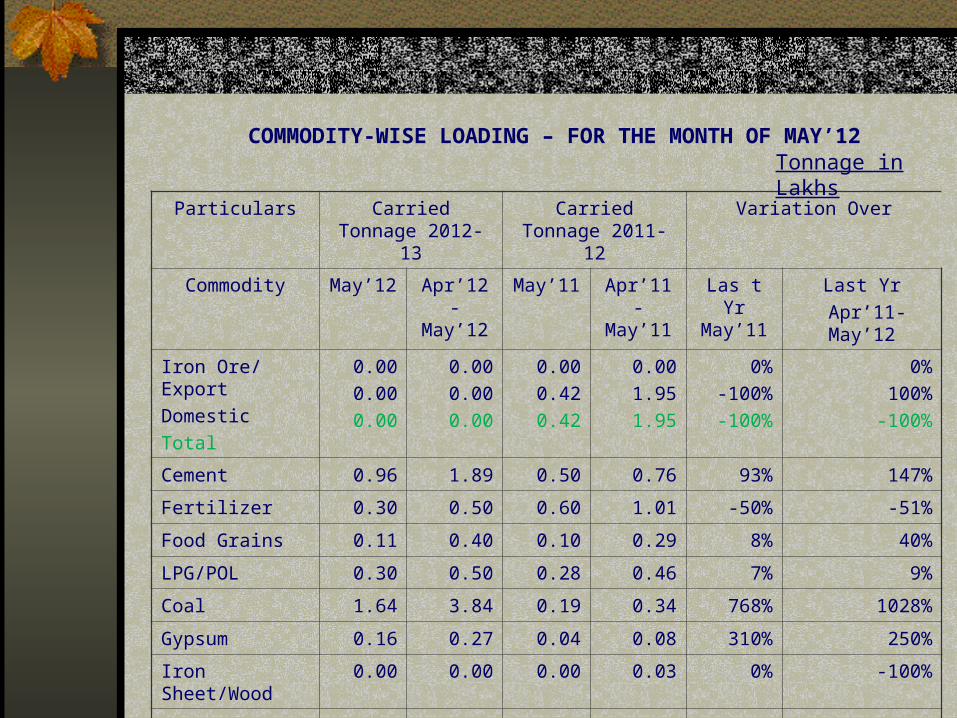
COMMODITY-WISE LOADING – FOR THE MONTH OF MAY’12
Particulars Carried Tonnage 2012-13
Carried Tonnage 2011-12
Variation Over
Commodity May’12 Apr’12-May’12
May’11 Apr’11- May’11
Las t Yr May’11
Last Yr
Apr’11-May’12
Iron Ore/ Export
Domestic
Total
0.00
0.00
0.00
0.00
0.00
0.00
0.00
0.42
0.42
0.00
1.95
1.95
0%
-100%
-100%
0%
100%
-100%
Cement 0.96 1.89 0.50 0.76 93% 147%
Fertilizer 0.30 0.50 0.60 1.01 -50% -51%
Food Grains 0.11 0.40 0.10 0.29 8% 40%
LPG/POL 0.30 0.50 0.28 0.46 7% 9%
Coal 1.64 3.84 0.19 0.34 768% 1028%
Gypsum 0.16 0.27 0.04 0.08 310% 250%
Iron Sheet/Wood 0.00 0.00 0.00 0.03 0% -100%
Auto/Cont 0.00 0.00 0.00 0.00 0% 0%
Total 3.48 7.41 2.13 4.92
Tonnage in Lakhs

COMMODITY-WISE REVENUE – FOR THE MONTH OF MAY’12
Particulars Gross Revenue
2012-13
Gross Revenue
2011-12
Variation % Over
Commodity May’12 Apr’12-May’12
May’11 Apr’11- May’11
Las t Yr May’11
Last Yr
Apr’11-May’12
Iron Ore/ Export
Domestic
Total
0.00
0.00
0.00
0.00
0.00
0.00
0.00
1.08
1.08
0.00
5.02
5.02
0%
-100%
-100%
0%
-100%
-100%
Cement 2.73 5.34 1.10 1.65 149% 223%
Fertilizer 0.68 1.10 0.99 1.73 -31% -36%
Food Grains 0.23 0.72 0.15 0.40 51% 82%
LPG/POL 1.11 1.81 1.04 1.75 7% 4%
Coal 4.35 10.17 0.37 0.66 1085% 1436%
Gypsum 0.43 0.75 0.08 0.17 419% 351%
Iron Sheet/Wood 0.00 0.00 0.00 0.07 0% -100%
Auto/Cont 0.01 0.04 0.00 0.01 0% 279%
TOTAL 9.53 19.93 4.80 11.45
` - Crores
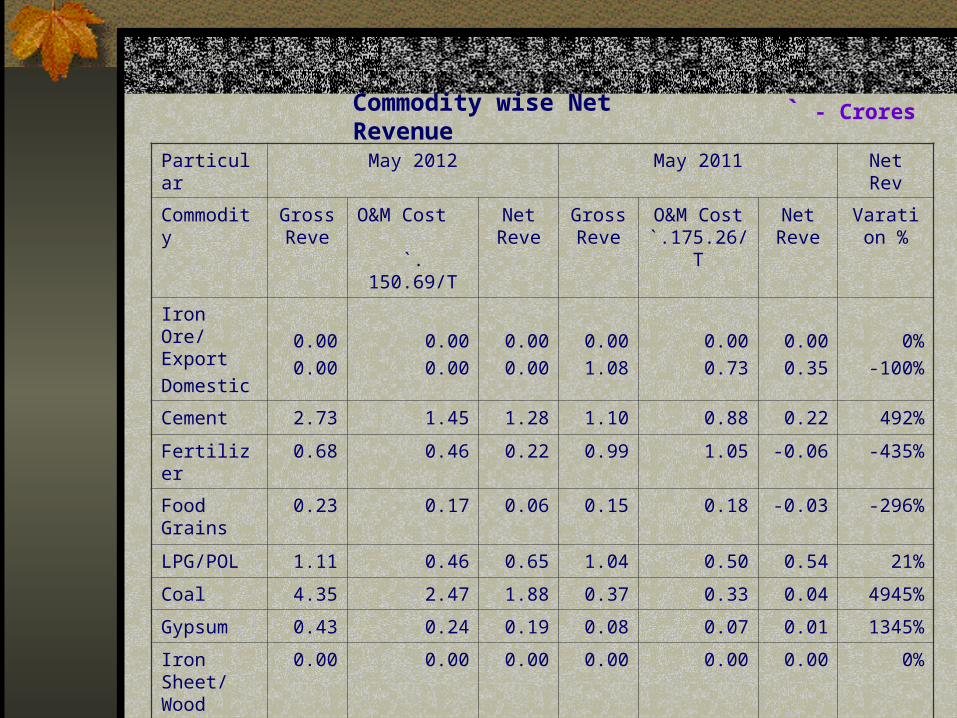
Commodity wise Net Revenue
Particular May 2012 May 2011 Net Rev
Commodity Gross Reve
O&M Cost `.
150.69/T
Net Reve
Gross Reve
O&M Cost `.175.26/T
Net Reve
Varation %
Iron Ore/ Export
Domestic0.00
0.00
0.00
0.00
0.00
0.00
0.00
1.08
0.00
0.73
0.00
0.35
0%
-100%
Cement 2.73 1.45 1.28 1.10 0.88 0.22 492%
Fertilizer 0.68 0.46 0.22 0.99 1.05 -0.06 -435%
Food Grains
0.23 0.17 0.06 0.15 0.18 -0.03 -296%
LPG/POL 1.11 0.46 0.65 1.04 0.50 0.54 21%
Coal 4.35 2.47 1.88 0.37 0.33 0.04 4945%
Gypsum 0.43 0.24 0.19 0.08 0.07 0.01 1345%
Iron Sheet/ Wood
0.00 0.00 0.00 0.00 0.00 0.00 0%
Auto/Cont 0.01 0.00 0.01 0.00 0.00 0.00 0%
TOTAL 9.53 5.25 4.28 4.80 3.74 1.06
` - Crores
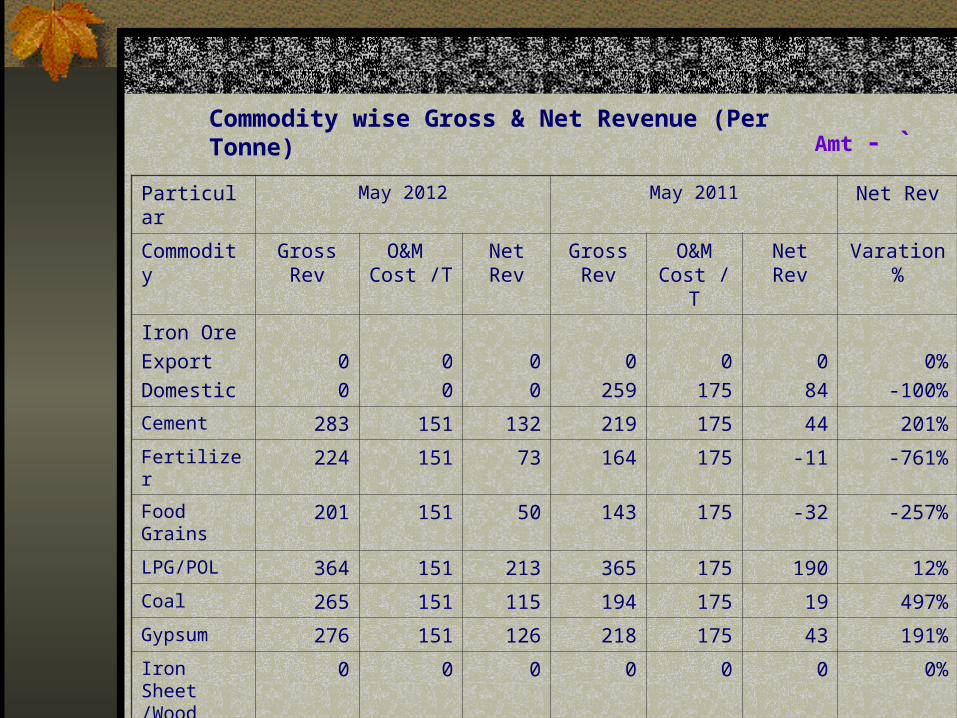
Commodity wise Gross & Net Revenue (Per Tonne)
Particular May 2012 May 2011 Net Rev
Commodity Gross Rev
O&M Cost /T
Net Rev
Gross Rev
O&M Cost /T
Net Rev Varation %
Iron Ore
Export
Domestic
0
0
0
0
0
0
0
259
0
175
0
84
0%
-100%
Cement 283 151 132 219 175 44 201%
Fertilizer 224 151 73 164 175 -11 -761%
Food Grains 201 151 50 143 175 -32 -257%
LPG/POL 364 151 213 365 175 190 12%
Coal 265 151 115 194 175 19 497%
Gypsum 276 151 126 218 175 43 191%
Iron Sheet /Wood
0 0 0 0 0 0 0%
Auto/Cont 680 151 529 0 0 0 0%
Amt - `
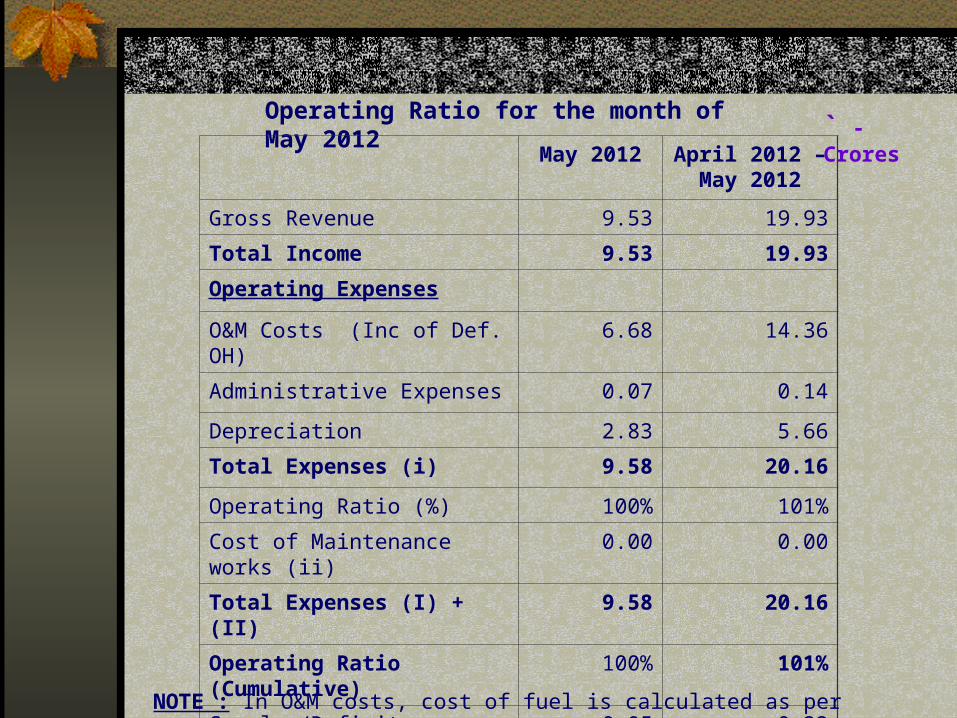
Operating Ratio for the month of May 2012May 2012 April 2012 –
May 2012
Gross Revenue 9.53 19.93
Total Income 9.53 19.93
Operating Expenses
O&M Costs (Inc of Def. OH) 6.68 14.36
Administrative Expenses 0.07 0.14
Depreciation 2.83 5.66
Total Expenses (i) 9.58 20.16
Operating Ratio (%) 100% 101%
Cost of Maintenance works (ii) 0.00 0.00
Total Expenses (I) + (II) 9.58 20.16
Operating Ratio (Cumulative) 100% 101%
Surplus/Deficit -0.05 -0.22
Surplus % -0.53% -1.13%
` - Crores
NOTE : In O&M costs, cost of fuel is calculated as per service & direction wise
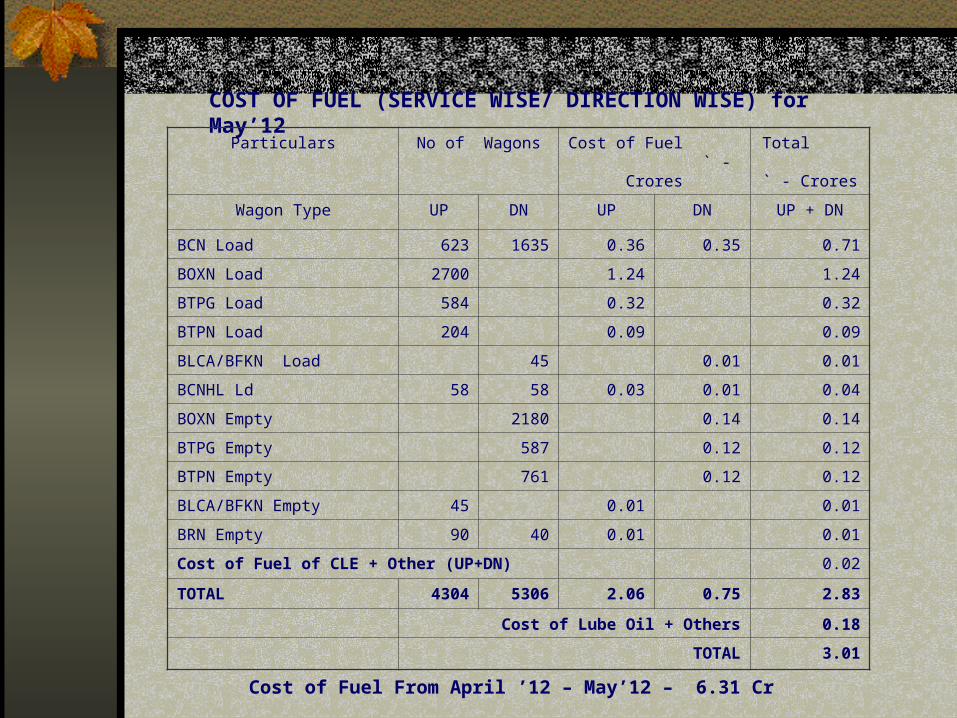
COST OF FUEL (SERVICE WISE/ DIRECTION WISE) for May’12
Cost of Fuel From April ’12 – May’12 – 6.31 Cr
Particulars No of Wagons Cost of Fuel ` - Crores
Total ` - Crores
Wagon Type UP DN UP DN UP + DN
BCN Load 623 1635 0.36 0.35 0.71
BOXN Load 2700 1.24 1.24
BTPG Load 584 0.32 0.32
BTPN Load 204 0.09 0.09
BLCA/BFKN Load 45 0.01 0.01
BCNHL Ld 58 58 0.03 0.01 0.04
BOXN Empty 2180 0.14 0.14
BTPG Empty 587 0.12 0.12
BTPN Empty 761 0.12 0.12
BLCA/BFKN Empty 45 0.01 0.01
BRN Empty 90 40 0.01 0.01
Cost of Fuel of CLE + Other (UP+DN) 0.02
TOTAL 4304 5306 2.06 0.75 2.83
Cost of Lube Oil + Others 0.18
TOTAL 3.01

Line Capacity Utilization for the month of May’12 :
Direction Loaded Empties Total No of Trains
*CLE *Others Total
UP Trains 85 3 88 57
(77)
7
(18)
267
Down Trains 44 71 115
129 74 203 57 7 267
Permissible Capacity : 240
Utilized : 267
Percentage of Utilization : 111%
Percentage of Utilization Loaded : 54%
Engine Hour Cost : 52.32 Lakhs
NOTE:
* Moved between SKLR-SBHR-SKLR
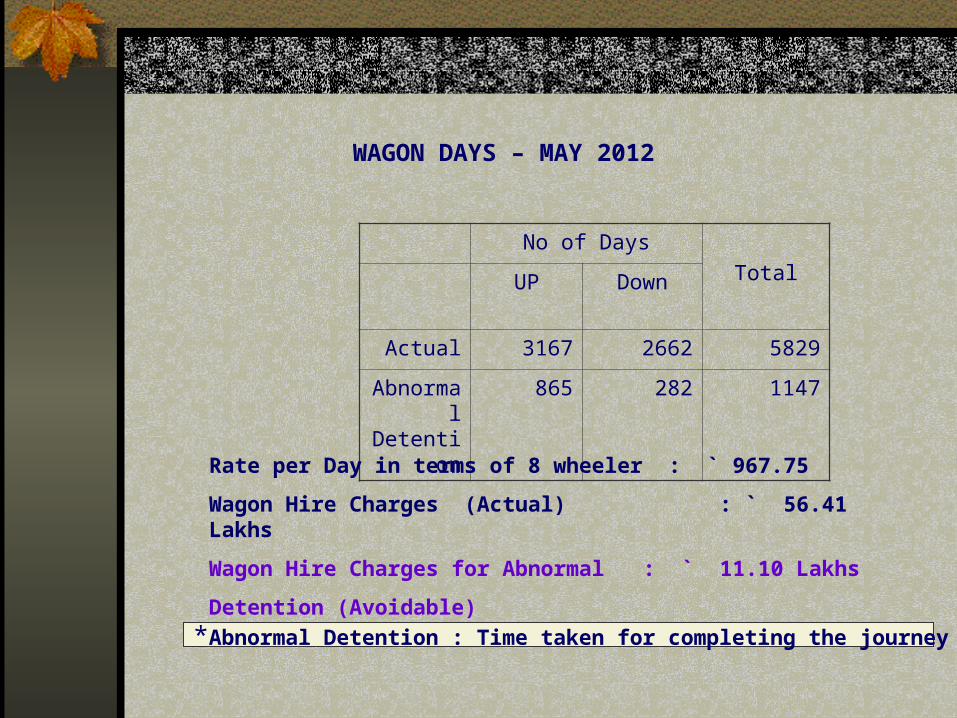
WAGON DAYS – MAY 2012
No of Days
TotalUP Down
Actual 3167 2662 5829
Abnormal Detention
865 282 1147
Rate per Day in terms of 8 wheeler : ` 967.75
Wagon Hire Charges (Actual) : ` 56.41 Lakhs
Wagon Hire Charges for Abnormal : ` 11.10 Lakhs
Detention (Avoidable)
*Abnormal Detention : Time taken for completing the journey > 15 Hrs

Details of Payments Received from Mysore Division after adjusting O&M Costs
Months Due Date Actual date of Receipt
Amount Rs - Cr
Prov. Pay Final Pay (Prov Pay)
April ’12 05.05.12 31.05.12 02.06.12 4.22
May ’12 05.06.12 30.06.12
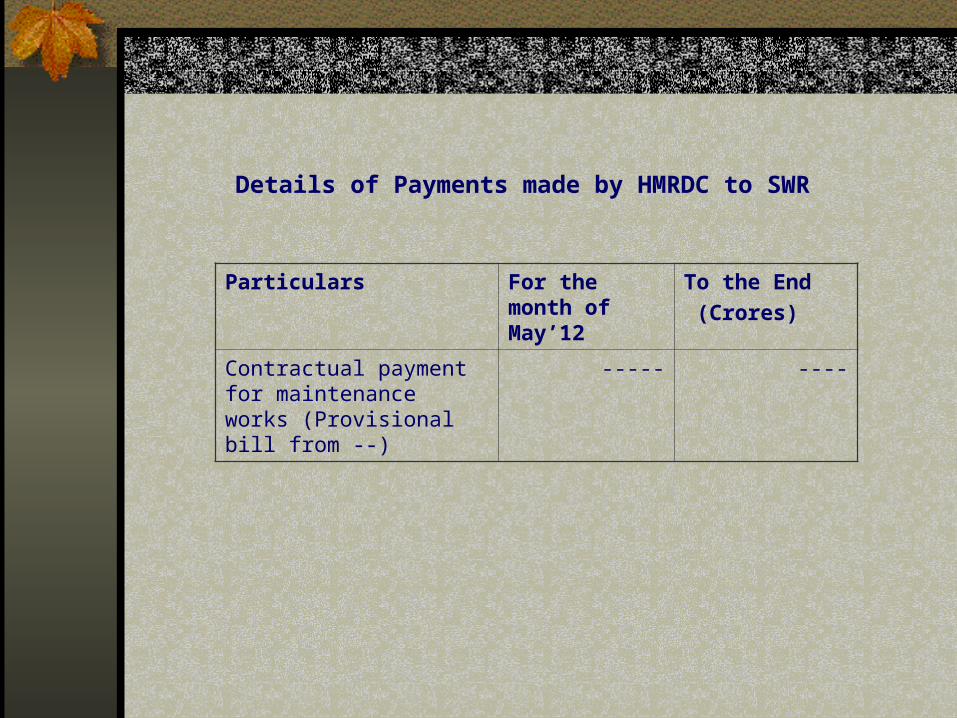
Details of Payments made by HMRDC to SWR
Particulars For the month of May’12
To the End
(Crores)
Contractual payment for maintenance works (Provisional bill from --)
----- ----