operational performance 2017 - har performance maintaining and growing our margins as efficiently as...
TRANSCRIPT

1 Harmony Gold Mining Company Limited Integrated Annual Report 2017
OPERATIONAL PERFORMANCE
Maintaining and growing our margins as efficiently as we can is essential to sustaining our business and meeting our strategic objectives.
Achievements FY17 Challenges FY17
• Safety performance improved in terms of fatality frequency rate
• Produced 1.088Moz of gold, exceeding guidance of 1.05Moz
• Focus on improving efficiencies, asset management and maintenance result in a reduction in the average number of unplanned stoppages
• Tshepong and Doornkop achieved 3 million and 2 million fatality free shift respectively
• Projects deliver increased grade at Phakisa, Joel and Tshepong and mining Kusasalethu’s higher grade areas contribute to the increase in underground recovered grade for the fifth consecutive year, to 5.07g/t
• Increased margins and profitability at Kusasalethu following the decision to shorten the life-of-mine plan and focus on higher grade areas
• Phoenix tailings retreatment operation performed well and delivered a 14% increase in production and improved operating free cash flow margin from 24% in FY16 to 28% in FY17
• Hidden Valley stage 5 and stage 6 investment on budget and on schedule
• Lost-time injury frequency rate regressed year on year – the Live Longer safety campaign will focus on this
• At Target 1, unstable ground conditions in planned areas and lack of flexibility resulted in having to focus on lower-grade massives
• Unisel’s ageing infrastructure and challenging operating conditions impacted on the profitability of the operation in FY17
• Increased unit costs – the operational excellence initiatives will address this challenge
WHY OUR OPERATIONAL PERFORMANCE IS MATERIALMaintaining and growing our margins as safely and efficiently as we can is essential to sustaining our business and meeting our strategic objectives. This includes delivering safely on our operational plans, reducing unit costs, improving productivity and maximising revenue.
Our approach takes into consideration the long-term sustainability of the company as a whole. We aim to mine those areas which will return a positive cash flow.
We are price takers and have no influence on the gold price or exchange rates, and as a result need to continuously focus on factors within our control such as costs and production. Our hedging strategy has provided a degree of cash certainty over the short term.
OPERATING PERFORMANCE FY17Operational excellence in FY17 was key in attaining the decrease in the fatality frequency rate year on year and achieving a fatality free quarter during the June 2017 quarter, achieving our annual production guidance for a second consecutive year and increasing underground grade for a fifth consecutive year. In FY17, Harmony produced 1.088Moz of gold (FY16: 1.082Moz) and achieved an underground grade of 5.07g/t (FY16: 5.02g/t).
Refer to the Financial director’s report for a discussion on Harmony’s financial performance during FY17.
Harmony acquired full ownership of Hidden Valley in October 2016 and made the decision to invest in the stage 5 and 6 cut-back with a net investment of US$180 million (of which US$68 million was incurred in FY17). Good progress was made on the stages 5 and 6 cutback project which was on budget and on schedule in FY17. Management is fully committed to the success of this investment which is expected to deliver 180 000oz of gold and 3Moz of silver annually at an average all-in sustaining cost of less than US$950/oz by FY19.
Following the successful conclusion of the study to investigate their integration, Tshepong and Phakisa have been consolidated as a single entity, Tshepong operations. The integration and consolidation of these two mines will enable Harmony to optimise existing synergies – given the proximity of their orebodies – to reduce unit costs and to make better use of Tshepong’s underutilised infrastructure. This integration will also alleviate bottlenecks and operating constraints at Phakisa. Ore from Phakisa will be trammed and hoisted at Tshepong.

Harmony Gold Mining Company Limited Integrated Annual Report 2017 2
The Central Plant conversion to tailings retreatment began and was successfully completed in FY17. Expenditure was within budget. The tailings operation, which is expected to produce 15 000oz annually from FY18, is an additional low-risk, low operating cost asset in our surface operation portfolio.
Notable operating performances in FY17 included:
• Kusasalethu: FY17 was a fatal-free and profitable year. Following the decision to shorten the life of mine and to focus mining on higher grade areas, gold produced increased by 14% to 4 394kg (141 270oz) as a result of a 25% increase in recovered grade to 7.24g/t.
• Masimong: Mining of the high-grade B Reef contributed to a 4% increase in production. Good cost control supported increased profitability.
• Phoenix: Production improved by 14% owing to a 10% rise in the recovered grade and a 4% increase in volumes processed as a result of good operating momentum and plant efficiencies.
The following operations reported lower gold production during the year:
• Target 1: Unfavourable ground conditions in the higher grade areas and a lack of flexibility significantly impacted operating performance in FY17. Production declined by 21% to 2 669kg (85 809oz) as grade fell by 22% to 3.58g/t. Production improved in the second half of FY17 and grades are expected to pick up in FY18. Geological drilling will be conducted in FY18 to inform the extent of future project capital expenditure.
• Unisel: Production declined by 6% to 1 595kg on the back of a 7% decrease in volumes milled (394 000t), a result of ageing infrastructure and engineering-related stoppages. A decision was made to begin mining the higher-grade areas in the shaft pillar in the next few years
Average annual gold price received
R000/kg $/oz
0100200300400500600
02004006008001 0001 2001 4001 6001 800
FY17FY16FY15FY14FY13
R000/kg US$/oz
Contribution to group production by operation
%Tshepong
Kusasalethu
Phakisa
Hidden Valley
Bambanani
Doornkop
Target 1
Masimong
Joel
Unisel
Kalgold
Surface dumps
Phoenix
13
12
988
8
8
74
4 32
14
Annual all-in-sustaining costs
R000/kg
R000/kg US$/oz
US$/oz
0100200300400500600
02004006008001 0001 2001 4001 600
FY17FY16FY15FY14FY13
(g/t)
FY15FY14FY13 FY16
Annual underground grade recovered
4.2
4.4
4.6
4.8
5.0
5.2
FY17
4.754.77
4.54
5.02 5.07

3 Harmony Gold Mining Company Limited Integrated Annual Report 2017
OPERATIONAL EXCELLENCEThe fundamentals of mining underpin operational excellence at Harmony. Disciplined mining is integral to ensuring the safety of our employees, improving productivity and efficiencies and achieving our targets.
Operational excellence is key to creating an enabling environment. Safety is considered at all times, teams are motivated, and the workplace environment is conducive to productivity.
OPERATIONAL PERFORMANCE CONTINUED
SAFETY AND HEALTHINFRASTRUCTURE
MANAGEMENTGRADE
MANAGEMENTCAPITAL ALLOCATION
AND COST REDUCTIONSREALISTIC
PRODUCTION PLANS
Pro-active, risk-based approach
Optimising asset utilisation
Grade discipline is key
Focused capital allocation and prioritisation
Consistent predictable production
• Encourage safe behaviour at all times
• On-site healthcare enable us to better monitor employee health and treatment programmes
• Reducing unplanned stoppages and improving equipment use and efficiencies through dedicated asset management teams and planning
• No mining below cut-off
• Mining to average reserve grade
• Cost management is key
• Capital allocation is driven by and prioritised to projects that will generate free cash flows
• Planning is realistic and focused on generating and maximising positive returns and cash flows
• The cost structure of the mine is built to fit the production plan and flexibility is catered for – leading to targets that are achievable
Managing operational risks: Operational risk management is integral to our business, and to optimise the gold mining value chain, it is essential to have in place a risk management plan to ensure that all supporting systems are functioning efficiently. Managing risks effectively while working safely and being proactive are core to our success. Safety hazards and operational business risks are identified and dealt with continuously at each of our operations.
OUTLOOK FOR FY18Relevant Global Reporting Initiative indicators: G4-EC7 and G4-EC8
Our approach towards our FY18 operational planning:
Annual production guidance for FY18 is in line with our strategy to produce safe, profitable ounces and increase margins through operational excellence. Our target for FY18 is to produce 1.1Moz at an all-in sustaining cost of R520 000/kg (US$1 180/oz). Planned capital expenditure of R4.4 billion (US$319 million) for FY18 is prioritised at Hidden Valley, for the stage 5 and 6 investment, and at the Tshepong operation, for ongoing development capital, the sub-75 decline project and ventilation improvements at the Tshepong section.
Highlights of what we expect for FY18:
• Improved safety focus and performance at all operations
• All operations to be profitable and generate operational free cash flow
• An increase in total production to 1.1Moz and increase in the
underground recovered grade to 5.18g/t
• Greater focus on cost management and unit cost reductions
• Hidden Valley to reach commercial levels of production in the
June quarter of FY18 and deliver the stage 5 and 6 investment on
schedule and on budget
• Tshepong operations production to increase on higher volumes
and a higher recovered grade following the integration of
Tshepong and Phakisa
• Masimong to build on the momentum achieved in FY17 and
generate free cash
• Target 1 to turnaround its FY17 performance as higher grade
massives are accessed
• Kusasalethu to remain profitable, focusing on higher grade areas
and benefiting from maintenance and engineering improvements
conducted in FY17
• Central Plant tailings project to achieve or exceed guidance in the
first year of tailings retreatment
• Unisel to return to profitability following the decision to mine the
shaft pillars
Harmony’s production guidance is based on a gold price of
R520 000/kg (or US$1 180/oz) and an exchange rate of R13.74/US$
for FY18. Our guidance per operation for FY18 is provided below:

Harmony Gold Mining Company Limited Integrated Annual Report 2017 4
FY18 forecast and guidance
Operation Production Capital expenditure1,2 Life of mine
(oz) (Rm) (US$m) (years)
Tshepong operations 303 000 1 150 84 17
Bambanani 83 000 73 5 5
Target 1 92 000 386 28 7
Doornkop 94 500 285 21 18
Joel 66 500 231 17 9
Kusasalethu 143 000 321 23 5
Masimong 72 000 116 8 4
Unisel 55 000 112 8 5
Underground operations – total3 909 000 2 674 194
South Africa surface operations (including Kalgold) 96 500 39 3 14+
Hidden Valley2 94 500 1 676 122 6
Total ~1.1Moz 4 389 3191 Excludes Golpu2 At an exchange rate of R13.74/US$3 At a grade of ~5.18g/t
Phakisa

5 Harmony Gold Mining Company Limited Integrated Annual Report 2017
SOUTH AFRICATshepong
FY17 FY16 FY15
Number of employees
– Permanent 4 304 4 232 4 218
– Contractors 283 250 210
Total 4 587 4 482 4 428
Operational
Volumes milled (000t) (metric) 1 027 1 088 992
(000t) (imperial) 1 132 1 200 1 095
Gold produced (kg) 4 819 5 031 4 278
(oz) 154 934 161 751 137 540
Gold sold (kg) 4 817 5 029 4 337
(oz) 154 869 161 685 139 437
Grade (g/t) 4.69 4.62 4.31
(oz/t) 0.137 0.135 0.126
Productivity (g/TEC) 95.55 100.52 86.05
Development results
Total metres 11 460 12 077 13 053
Reef metres 1 735 1 745 1 822
Capital metres 383 0 0
Financial
Revenue (Rm) 2 760 2 756 1 948
(US$m) 203 190 170
Average gold price received (R/kg) 572 921 547 967 449 211
(US$/oz) 1 311 1 176 1 221
Cash operating cost (Rm) 2 032 1 845 1 588
(US$m) 149 127 139
Production profit/(loss) (Rm) 731 912 337
(US$m) 54 63 29
Capital expenditure (Rm) 387 307 313
(US$m) 28 21 27
Cash operating cost (R/kg) 421 573 366 767 371 149
(US$/oz) 964 787 1 008
All-in sustaining cost (R/kg) 506 969 438 401 454 512
(US$/oz) 1 160 940 1 235
Safety
Number of fatalities 0 0 1
Lost-time injury frequency rate per million hours worked 7.34 6.40 5.72
Environment
Electricity consumption (GWh) 287 301 307
Water consumption – primary activities (ML) 1 229 1 230 1 110
Greenhouse gas emissions (000t CO2e) 286 306 316
Intensity data per tonne treated
– energy 0.28 0.27 0.31
– water 1.19 1.13 1.12
– greenhouse gas emissions 0.28 0.27 0.32
Number of reportable environmental incidents 0 0 0
Community
Local economic development* (Rm) 6 7 33
Training and development (Rm) 37 37 33
* Included in the total for FY15 is an amount of R24 million that was capitalised as part of the hostel upgrades (FY16: R0 million, FY17: R0 million)
OPERATIONAL PERFORMANCE
Harmony Gold Mining Company Limited Integrated Annual Report 2017 6
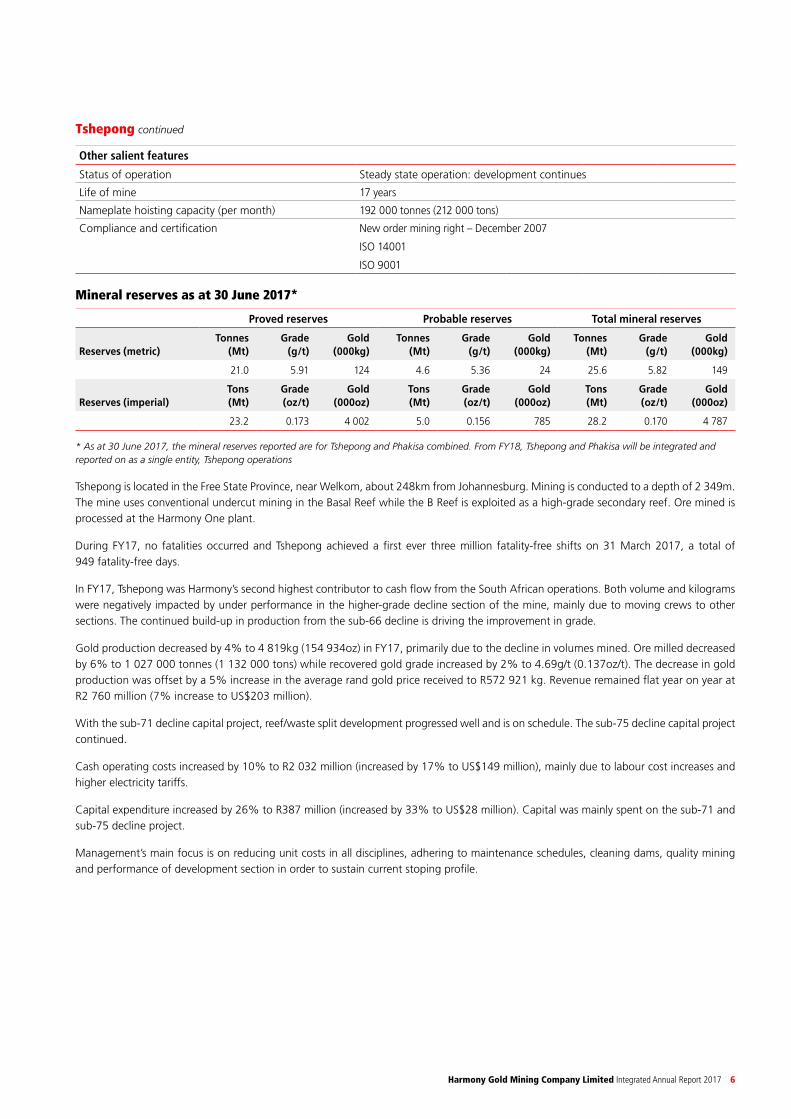
Other salient features
Status of operation Steady state operation: development continues
Life of mine 17 years
Nameplate hoisting capacity (per month) 192 000 tonnes (212 000 tons)
Compliance and certification New order mining right – December 2007
ISO 14001
ISO 9001
Mineral reserves as at 30 June 2017*
Proved reserves Probable reserves Total mineral reserves
Reserves (metric)Tonnes
(Mt)Grade
(g/t)Gold
(000kg)Tonnes
(Mt)Grade
(g/t)Gold
(000kg)Tonnes
(Mt)Grade
(g/t)Gold
(000kg)
21.0 5.91 124 4.6 5.36 24 25.6 5.82 149
Reserves (imperial)Tons(Mt)
Grade(oz/t)
Gold(000oz)
Tons(Mt)
Grade(oz/t)
Gold(000oz)
Tons(Mt)
Grade(oz/t)
Gold(000oz)
23.2 0.173 4 002 5.0 0.156 785 28.2 0.170 4 787
* As at 30 June 2017, the mineral reserves reported are for Tshepong and Phakisa combined. From FY18, Tshepong and Phakisa will be integrated and reported on as a single entity, Tshepong operations
Tshepong is located in the Free State Province, near Welkom, about 248km from Johannesburg. Mining is conducted to a depth of 2 349m.
The mine uses conventional undercut mining in the Basal Reef while the B Reef is exploited as a high-grade secondary reef. Ore mined is
processed at the Harmony One plant.
During FY17, no fatalities occurred and Tshepong achieved a first ever three million fatality-free shifts on 31 March 2017, a total of
949 fatality-free days.
In FY17, Tshepong was Harmony’s second highest contributor to cash flow from the South African operations. Both volume and kilograms
were negatively impacted by under performance in the higher-grade decline section of the mine, mainly due to moving crews to other
sections. The continued build-up in production from the sub-66 decline is driving the improvement in grade.
Gold production decreased by 4% to 4 819kg (154 934oz) in FY17, primarily due to the decline in volumes mined. Ore milled decreased
by 6% to 1 027 000 tonnes (1 132 000 tons) while recovered gold grade increased by 2% to 4.69g/t (0.137oz/t). The decrease in gold
production was offset by a 5% increase in the average rand gold price received to R572 921 kg. Revenue remained flat year on year at
R2 760 million (7% increase to US$203 million).
With the sub-71 decline capital project, reef/waste split development progressed well and is on schedule. The sub-75 decline capital project
continued.
Cash operating costs increased by 10% to R2 032 million (increased by 17% to US$149 million), mainly due to labour cost increases and
higher electricity tariffs.
Capital expenditure increased by 26% to R387 million (increased by 33% to US$28 million). Capital was mainly spent on the sub-71 and
sub-75 decline project.
Management’s main focus is on reducing unit costs in all disciplines, adhering to maintenance schedules, cleaning dams, quality mining
and performance of development section in order to sustain current stoping profile.
Tshepong continued
7 Harmony Gold Mining Company Limited Integrated Annual Report 2017
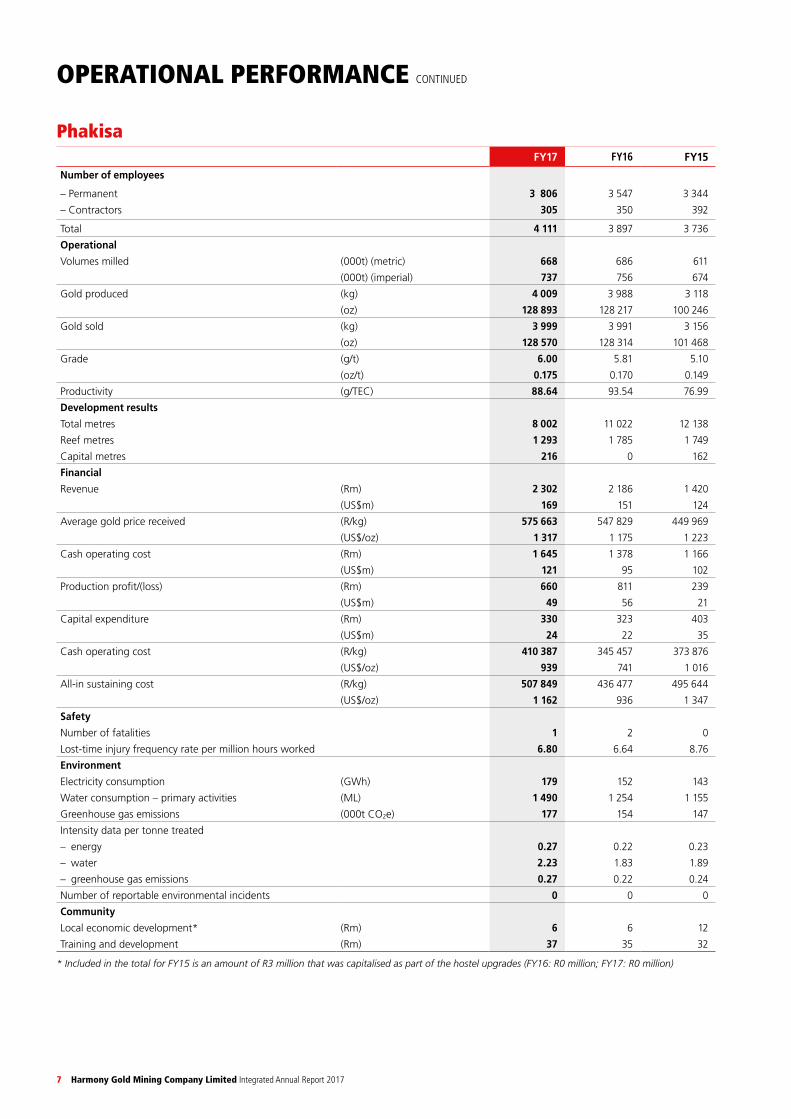
PhakisaFY17 FY16 FY15
Number of employees
– Permanent 3 806 3 547 3 344
– Contractors 305 350 392
Total 4 111 3 897 3 736
Operational
Volumes milled (000t) (metric) 668 686 611
(000t) (imperial) 737 756 674
Gold produced (kg) 4 009 3 988 3 118
(oz) 128 893 128 217 100 246
Gold sold (kg) 3 999 3 991 3 156
(oz) 128 570 128 314 101 468
Grade (g/t) 6.00 5.81 5.10
(oz/t) 0.175 0.170 0.149
Productivity (g/TEC) 88.64 93.54 76.99
Development results
Total metres 8 002 11 022 12 138
Reef metres 1 293 1 785 1 749
Capital metres 216 0 162
Financial
Revenue (Rm) 2 302 2 186 1 420
(US$m) 169 151 124
Average gold price received (R/kg) 575 663 547 829 449 969
(US$/oz) 1 317 1 175 1 223
Cash operating cost (Rm) 1 645 1 378 1 166
(US$m) 121 95 102
Production profit/(loss) (Rm) 660 811 239
(US$m) 49 56 21
Capital expenditure (Rm) 330 323 403
(US$m) 24 22 35
Cash operating cost (R/kg) 410 387 345 457 373 876
(US$/oz) 939 741 1 016
All-in sustaining cost (R/kg) 507 849 436 477 495 644
(US$/oz) 1 162 936 1 347
Safety
Number of fatalities 1 2 0
Lost-time injury frequency rate per million hours worked 6.80 6.64 8.76
Environment
Electricity consumption (GWh) 179 152 143
Water consumption – primary activities (ML) 1 490 1 254 1 155
Greenhouse gas emissions (000t CO2e) 177 154 147
Intensity data per tonne treated
– energy 0.27 0.22 0.23
– water 2.23 1.83 1.89
– greenhouse gas emissions 0.27 0.22 0.24
Number of reportable environmental incidents 0 0 0
Community
Local economic development* (Rm) 6 6 12
Training and development (Rm) 37 35 32
* Included in the total for FY15 is an amount of R3 million that was capitalised as part of the hostel upgrades (FY16: R0 million; FY17: R0 million)
OPERATIONAL PERFORMANCE CONTINUED

Harmony Gold Mining Company Limited Integrated Annual Report 2017 8
Other salient features
Status of operation Production ramp up continues
Life of mine 9 years
Nameplate hoisting capacity (per month) 91 000 tonnes (101 000 imperial tons)
Compliance and certification New order mining right – December 2007
ISO 14001
ISO 9001
OHSAS 18001
Mineral reserves as at 30 June 2017See Tshepong. As at 30 June 2017, Phakisa’s mineral reserves are included with those of Tshepong. From FY18, Phakisa and Tshepong will
be integrated and reported on as a single entity, Tshepong operations.
Phakisa is located in the Free State Province, some 252km from Johannesburg. The mine has two shafts, the main Phakisa shaft and the
Nyala shaft. The latter is used to hoist rock and serves as a second escape route. Phakisa exploits the Basal Reef. Mining is conducted to a
depth of 2 426m. Ore mined is processed at the Harmony One plant. Phakisa continues to build up to full production, which is expected
within the next two years.
Regrettably there was one fatality in FY17.
In line with the planned build-up at Phakisa, the recovered grade increased by 3% to 6.00g/t, offsetting the 3% decrease in ore milled (to
668 000 tonnes or 737 000 tons) resulting in a slight increase in gold produced by 0.5% to 4 009kg (128 893oz).
The integration between Tshepong and Phakisa mines involves the cross-tramming of ore from Phakisa to Tshepong which will de-
bottleneck constraints on the over-utilised Phakisa infrastructure. Accelerated development was conducted in FY17 to facilitate the holing
between the mines on 73 level.
Cash operating costs increased by 19% to R1 645 million (increased by 27% to US$121 million) due to increased production crews to
accelerate the production build up, increased expenditure on consumable as production ramps up and annual wage and electricity tariff
increases.
Capital expenditure increased by 2% to R330 million (by 9% to US$24 million), primarily spent on ongoing capital development.
Key deliverables include safe production, achieving volume and development targets, and increased ledging to improve flexibility. Ventilation
change-overs were completed on 69 and 71 levels so that ventilation at Tshepong could be utilised at Phakisa.
Phakisa continued

9 Harmony Gold Mining Company Limited Integrated Annual Report 2017
BambananiFY17 FY16 FY15
Number of employees
– Permanent 1 464 1 491 1 517
– Contractors 205 321 330
Total 1 669 1 812 1 847
Operational
Volumes milled (000t) (metric) 231 232 229
(000t) (imperial) 254 256 253
Gold produced (kg) 2 750 3 013 2 908
(oz) 88 415 96 870 93 495
Gold sold (kg) 2 745 3 015 2 947
(oz) 88 253 96 934 94 748
Grade (g/t) 11.90 12.99 12.70
(oz/t) 0.348 0.378 0.370
Productivity (g/TEC) 148.42 156.54 153.08
Development results
Total metres 1 591 1 743 1 150
Reef metres 130 105 15
Capital metres 0 0 0
Financial
Revenue (Rm) 1 576 1 617 1 330
(US$m) 116 112 116
Average gold price received (R/kg) 574 227 536 410 451 200
(US$/oz) 1 314 1 151 1 226
Cash operating cost (Rm) 874 808 697
(US$m) 64 56 61
Production profit/(loss) (Rm) 705 806 625
(US$m) 52 56 55
Capital expenditure (Rm) 77 106 110
(US$m) 6 7 10
Cash operating cost (R/kg) 317 833 268 305 239 552
(US$/oz) 727 576 651
All-in sustaining cost (R/kg) 357 025 304 634 270 623
(US$/oz) 817 654 735
Safety
Number of fatalities 1 0 1
Lost-time injury frequency rate per million hours worked 5.23 3.59 4.63
Environment
Electricity consumption (GWh) 143 140 133
Water consumption – primary activities (ML) 1 200 1 434 1 731
Greenhouse gas emissions (000t CO2e) 141 142 137
Intensity data per tonne treated
– energy 0.64 0.60 0.59
– water 5.19 6.18 7.57
– greenhouse gas emissions 0.64 0.60 0.61
Number of reportable environmental incidents 0 0 0
Community
Local economic development (Rm) 14 9 3
Training and development (Rm) 20 25 17
OPERATIONAL PERFORMANCE CONTINUED

Harmony Gold Mining Company Limited Integrated Annual Report 2017 10
Other salient featuresStatus of operation Mature operation with focus on mining of the shaft pillar for the next few
years after which it will be at the end of its operating life
Life of mine 5 years
Nameplate hoisting capacity (per month) 32 000 tonnes (35 000 tons)
Compliance and certification New order mining right – December 2007
ISO 14001 – not certified but operates according to standards requirements
ISO 9001
OHSAS 18001
Mineral reserves as at 30 June 2017
Proved reserves Probable reserves Total mineral reserves
Reserves (metric)Tonnes
(Mt)Grade
(g/t)Gold
(000kg)Tonnes
(Mt)Grade
(g/t)Gold
(000kg)Tonnes
(Mt)Grade
(g/t)Gold
(000kg)
1.1 11.54 12 – – – 1.1 11.54 12
Reserves (imperial)Tons(Mt)
Grade(oz/t)
Gold(000oz)
Tons(Mt)
Grade(oz/t)
Gold(000oz)
Tons(Mt)
Grade(oz/t)
Gold(000oz)
1.2 0.337 401 – – – 1.2 0.337 401
Bambanani, located in the Free State Province, near Welkom and about 262km from Johannesburg, has two surface shafts (the East and
West shafts). Mining is conducted to a depth of 2 365m. Activities at the mine focus on the Basal Reef and are limited to shaft pillar
extraction. The ore mined is sent to Harmony One Plant for processing. Given the high risk of seismicity at Bambanani, efforts are focused
on managing support systems and the rehabilitation of areas with challenging ground conditions.
Regrettably, one fatality occurred at Bambanani in FY17. Focus on safety and fatal risk management has further intensified as we strive
for zero harm.
Bambanani is Harmony’s most profitable mine despite gold production decreasing by 9% to 2 750kg (88 415oz) in FY17. This was primarily
due to decline in the recovered grade by 8% to 11.90g/t after an exceptional grade performance in FY16 remained flat year on year at
231 000 tonnes (254 000 tons) in FY17.
Revenue was down by 3% to R1 576 million (4% increase to US$116 million) mainly due to lower production in FY17.
Cash operating costs increased by 8% to R874 million (or 14% to US$64 million), mainly due to the increase in annual wages and
electricity tariffs.
Capital expenditure decreased by 27% to R77 million (a decrease of 14% to US$6 million). The decrease was due reduced capital spending
as the Bambanani shaft pillar major capital project was completed at the end of FY17.
Bambanani continued

11 Harmony Gold Mining Company Limited Integrated Annual Report 2017
Target 1FY17 FY16 FY15
Number of employees
– Permanent 1 689 1 653 1 683
– Contractors 222 272 266
Total 1 911 1 925 1 949
Operational
Volumes milled (000t) (metric) 745 739 749
(000t) (imperial) 822 814 826
Gold produced (kg) 2 669 3 387 3 824
(oz) 85 809 108 895 122 944
Gold sold (kg) 2 642 3 419 3 868
(oz) 84 942 109 923 124 358
Grade (g/t) 3.58 4.58 5.11
(oz/t) 0.104 0.134 0.149
Productivity (g/TEC) 126.66 155.77 172.25
Development results
Total metres 3 656 3 459 4 174
Reef metres 104 182 290
Financial
Revenue (Rm) 1 506 1 833 1 738
(US$m) 111 126 152
Average gold price received (R/kg) 570 091 536 196 449 319
(US$/oz) 1 304 1 150 1 221
Cash operating cost (Rm) 1 356 1 242 1 178
(US$m) 100 86 103
Production profit/(loss) (Rm) 161 583 547
(US$m) 12 40 48
Capital expenditure (Rm) 324 322 296
(US$m) 24 22 26
Cash operating cost (R/kg) 508 082 366 814 308 156
(US$/oz) 1 162 787 837
All-in sustaining cost (R/kg) 651 833 471 876 395 669
(US$/oz) 1 491 1 012 1 075
Safety
Number of fatalities 0 2 0
Lost-time injury frequency rate per million hours worked 11.80 4.91 4.51
Environment
Electricity consumption (GWh) 186 247 242
Water consumption – primary activities (ML) 678 808 808
Greenhouse gas emissions (000t CO2e) 184 251 249
Intensity data per tonne treated
– energy 0.25 0.33 0.32
– water 0.91 1.09 1.22
– greenhouse gas emissions 0.25 0.33 0.33
Number of reportable environmental incidents 0 0 0
Community
Local economic development (Rm) 5 4 4
Training and development (Rm) 36 34 30
OPERATIONAL PERFORMANCE CONTINUED
Harmony Gold Mining Company Limited Integrated Annual Report 2017 12
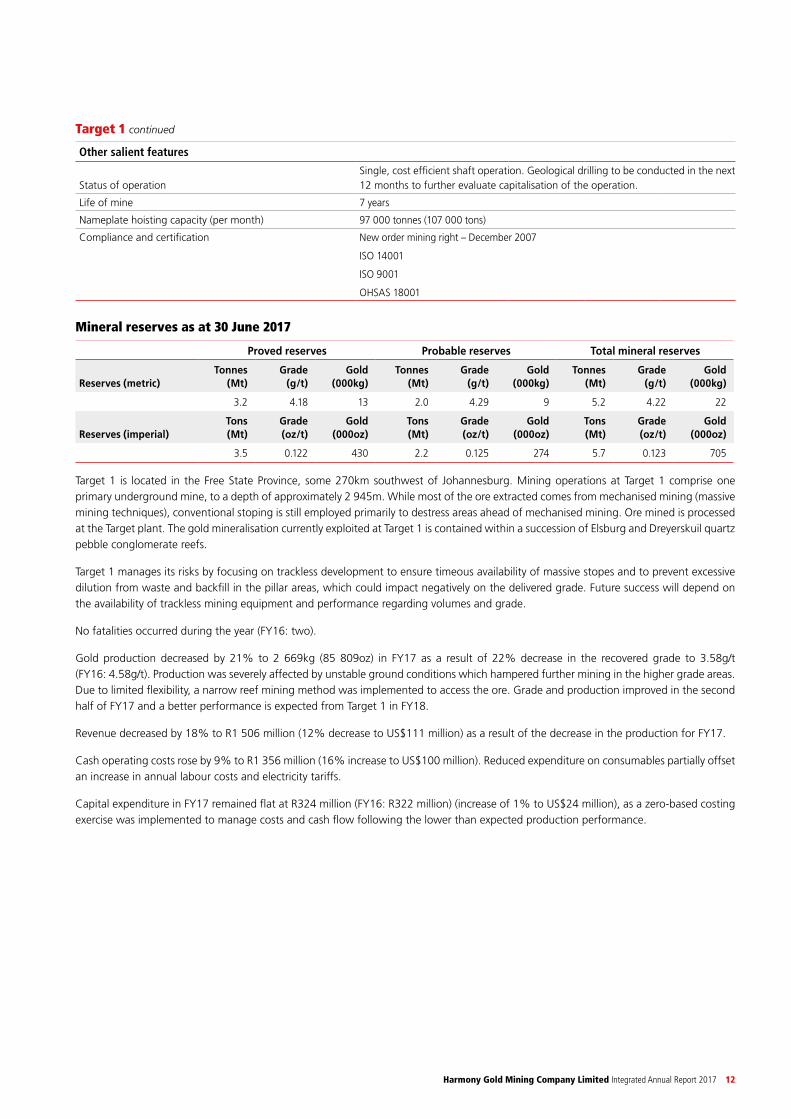
Other salient features
Status of operationSingle, cost efficient shaft operation. Geological drilling to be conducted in the next 12 months to further evaluate capitalisation of the operation.
Life of mine 7 years
Nameplate hoisting capacity (per month) 97 000 tonnes (107 000 tons)
Compliance and certification New order mining right – December 2007
ISO 14001
ISO 9001
OHSAS 18001
Mineral reserves as at 30 June 2017
Proved reserves Probable reserves Total mineral reserves
Reserves (metric)Tonnes
(Mt)Grade
(g/t)Gold
(000kg)Tonnes
(Mt)Grade
(g/t)Gold
(000kg)Tonnes
(Mt)Grade
(g/t)Gold
(000kg)
3.2 4.18 13 2.0 4.29 9 5.2 4.22 22
Reserves (imperial)Tons(Mt)
Grade(oz/t)
Gold(000oz)
Tons(Mt)
Grade(oz/t)
Gold(000oz)
Tons(Mt)
Grade(oz/t)
Gold(000oz)
3.5 0.122 430 2.2 0.125 274 5.7 0.123 705
Target 1 is located in the Free State Province, some 270km southwest of Johannesburg. Mining operations at Target 1 comprise one
primary underground mine, to a depth of approximately 2 945m. While most of the ore extracted comes from mechanised mining (massive
mining techniques), conventional stoping is still employed primarily to destress areas ahead of mechanised mining. Ore mined is processed
at the Target plant. The gold mineralisation currently exploited at Target 1 is contained within a succession of Elsburg and Dreyerskuil quartz
pebble conglomerate reefs.
Target 1 manages its risks by focusing on trackless development to ensure timeous availability of massive stopes and to prevent excessive
dilution from waste and backfill in the pillar areas, which could impact negatively on the delivered grade. Future success will depend on
the availability of trackless mining equipment and performance regarding volumes and grade.
No fatalities occurred during the year (FY16: two).
Gold production decreased by 21% to 2 669kg (85 809oz) in FY17 as a result of 22% decrease in the recovered grade to 3.58g/t
(FY16: 4.58g/t). Production was severely affected by unstable ground conditions which hampered further mining in the higher grade areas.
Due to limited flexibility, a narrow reef mining method was implemented to access the ore. Grade and production improved in the second
half of FY17 and a better performance is expected from Target 1 in FY18.
Revenue decreased by 18% to R1 506 million (12% decrease to US$111 million) as a result of the decrease in the production for FY17.
Cash operating costs rose by 9% to R1 356 million (16% increase to US$100 million). Reduced expenditure on consumables partially offset
an increase in annual labour costs and electricity tariffs.
Capital expenditure in FY17 remained flat at R324 million (FY16: R322 million) (increase of 1% to US$24 million), as a zero-based costing
exercise was implemented to manage costs and cash flow following the lower than expected production performance.
Target 1 continued

13 Harmony Gold Mining Company Limited Integrated Annual Report 2017
DoornkopFY17 FY16 FY15
Number of employees
– Permanent 2 847 2 471 2 977
– Contractors 645 443 493
Total 3 492 2 914 3 470
Operational
Volumes milled (000t) (metric) 641 630 603
(000t) (imperial) 706 695 665
Gold produced (kg) 2 673 2 730 2 663
(oz) 85 939 87 772 85 618
Gold sold (kg) 2 712 2 712 2 711
(oz) 87 193 87 193 87 160
Grade (g/t) 4.17 4.33 4.42
(oz/t) 0.122 0.126 0.129
Productivity (g/TEC) 77.08 83.49 68.47
Development results
Total metres (excl. capital metres) 9 961 7 766 8 919
Reef metres 1 337 1 688 1 701
Capital metres 1 316 0 0
Financial
Revenue (Rm) 1 553 1 480 1 220
(US$m) 114 102 107
Average gold price received (R/kg) 572 494 545 770 449 857
(US$/oz) 1 310 1 171 1 222
Cash operating cost (Rm) 1 224 1 058 1 071
(US$m) 90 73 94
Production profit/(loss) (Rm) 312 433 128
(US$m) 23 30 12
Capital expenditure (Rm) 243 208 245
(US$m) 18 14 21
Cash operating cost (R/kg) 457 752 387 585 402 065
(US$/oz) 1 047 831 1 092
All-in sustaining cost (R/kg) 562 907 473 562 501 151
(US$/oz) 1 288 1 016 1 362
Safety
Number of fatalities 0 0 1
Lost-time injury frequency rate per million hours worked 7.50 12.27 7.14
Environment
Electricity consumption (GWh) 188 203 205
Water consumption – primary activities (ML) 947 1 135 733
Greenhouse gas emissions (000t CO2e) 186 206 211
Intensity data per tonne treated
– energy 0.30 0.32 0.34
– water 1.48 1.80 1.26
– greenhouse gas emissions 0.30 0.32 0.35
Number of reportable environmental incidents 0 0 0
Community
Local economic development* (Rm) 8 4 37
Training and development (Rm) 42 30 35
* Included in the total for FY16 is an amount of R1 million that was capitalised as part of the hostel upgrades (FY15: R28 million, FY17: R0 million)
OPERATIONAL PERFORMANCE CONTINUED
Harmony Gold Mining Company Limited Integrated Annual Report 2017 14
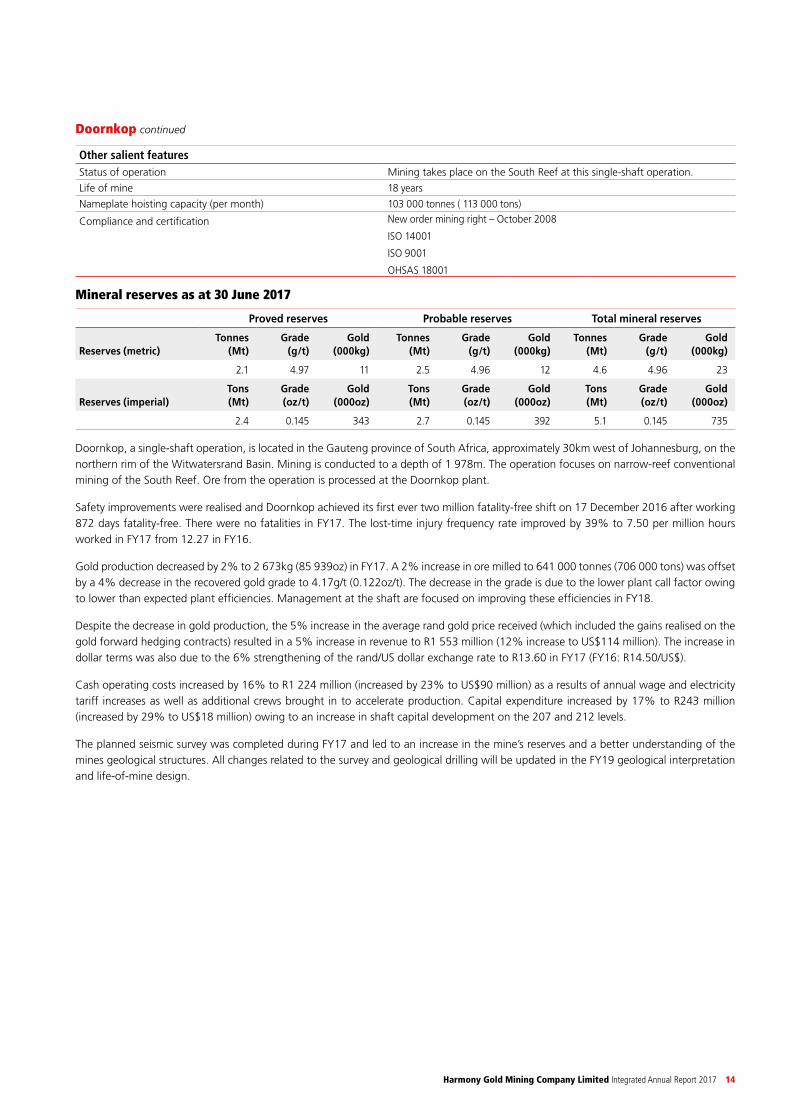
Other salient featuresStatus of operation Mining takes place on the South Reef at this single-shaft operation.
Life of mine 18 years
Nameplate hoisting capacity (per month) 103 000 tonnes ( 113 000 tons)
Compliance and certification New order mining right – October 2008
ISO 14001
ISO 9001
OHSAS 18001
Mineral reserves as at 30 June 2017
Proved reserves Probable reserves Total mineral reserves
Reserves (metric)Tonnes
(Mt)Grade
(g/t)Gold
(000kg)Tonnes
(Mt)Grade
(g/t)Gold
(000kg)Tonnes
(Mt)Grade
(g/t)Gold
(000kg)
2.1 4.97 11 2.5 4.96 12 4.6 4.96 23
Reserves (imperial)Tons(Mt)
Grade(oz/t)
Gold(000oz)
Tons(Mt)
Grade(oz/t)
Gold(000oz)
Tons(Mt)
Grade(oz/t)
Gold(000oz)
2.4 0.145 343 2.7 0.145 392 5.1 0.145 735
Doornkop, a single-shaft operation, is located in the Gauteng province of South Africa, approximately 30km west of Johannesburg, on the
northern rim of the Witwatersrand Basin. Mining is conducted to a depth of 1 978m. The operation focuses on narrow-reef conventional
mining of the South Reef. Ore from the operation is processed at the Doornkop plant.
Safety improvements were realised and Doornkop achieved its first ever two million fatality-free shift on 17 December 2016 after working
872 days fatality-free. There were no fatalities in FY17. The lost-time injury frequency rate improved by 39% to 7.50 per million hours
worked in FY17 from 12.27 in FY16.
Gold production decreased by 2% to 2 673kg (85 939oz) in FY17. A 2% increase in ore milled to 641 000 tonnes (706 000 tons) was offset
by a 4% decrease in the recovered gold grade to 4.17g/t (0.122oz/t). The decrease in the grade is due to the lower plant call factor owing
to lower than expected plant efficiencies. Management at the shaft are focused on improving these efficiencies in FY18.
Despite the decrease in gold production, the 5% increase in the average rand gold price received (which included the gains realised on the
gold forward hedging contracts) resulted in a 5% increase in revenue to R1 553 million (12% increase to US$114 million). The increase in
dollar terms was also due to the 6% strengthening of the rand/US dollar exchange rate to R13.60 in FY17 (FY16: R14.50/US$).
Cash operating costs increased by 16% to R1 224 million (increased by 23% to US$90 million) as a results of annual wage and electricity
tariff increases as well as additional crews brought in to accelerate production. Capital expenditure increased by 17% to R243 million
(increased by 29% to US$18 million) owing to an increase in shaft capital development on the 207 and 212 levels.
The planned seismic survey was completed during FY17 and led to an increase in the mine’s reserves and a better understanding of the
mines geological structures. All changes related to the survey and geological drilling will be updated in the FY19 geological interpretation
and life-of-mine design.
Doornkop continued

15 Harmony Gold Mining Company Limited Integrated Annual Report 2017
JoelFY17 FY16 FY15
Number of employees
– Permanent 1 962 1 796 1 818
– Contractors 171 97 81
Total 2 133 1 893 1 899
Operational
Volumes milled (000t) (metric) 514 542 551
(000t) (imperial) 567 597 607
Gold produced (kg) 2 246 2 278 2 258
(oz) 72 211 73 239 72 596
Gold sold (kg) 2 280 2 245 2 330
(oz) 73 303 72 179 74 911
Grade (g/t) 4.37 4.20 4.10
(oz/t) 0.127 0.123 0.119
Productivity (g/TEC) 113.57 117.33 115.65
Development results
Total metres 3 477 3 541 3 200
Reef metres 1 596 2 315 1 037
Capital metres 532 485 338
Financial
Revenue (Rm) 1 309 1 220 1 046
(US$m) 96 84 91
Average gold price received (R/kg) 573 986 543 442 449 026
(US$/oz) 1 313 1 166 1 220
Cash operating cost (Rm) 928 845 755
(US$m) 68 58 66
Production profit/(loss) (Rm) 373 389 276
(US$m) 27 27 24
Capital expenditure (Rm) 243 215 182
(US$m) 18 15 16
Cash operating cost (R/kg) 413 088 371 080 334 168
(US$/oz) 945 796 908
All-in sustaining cost (R/kg) 477 484 424 617 384 022
(US$/oz) 1 092 911 1 043
Safety
Number of fatalities 1 1 0
Lost-time injury frequency rate per million hours worked 2.54 3.49 3.72
Environment
Electricity consumption (GWh) 85 108 101
Water consumption – primary activities (ML) 922 816 671
Greenhouse gas emissions (000t CO2e) 84 109 104
Intensity data per tonne treated
– energy 1.17 0.19 0.18
– water 1.79 1.50 1.22
– greenhouse gas emissions 0.16 0.19 0.19
Number of reportable environmental incidents 0 0 0
Community
Local economic development (Rm) 7 3 3
Training and development (Rm) 20 15 15
OPERATIONAL PERFORMANCE CONTINUED
Harmony Gold Mining Company Limited Integrated Annual Report 2017 16
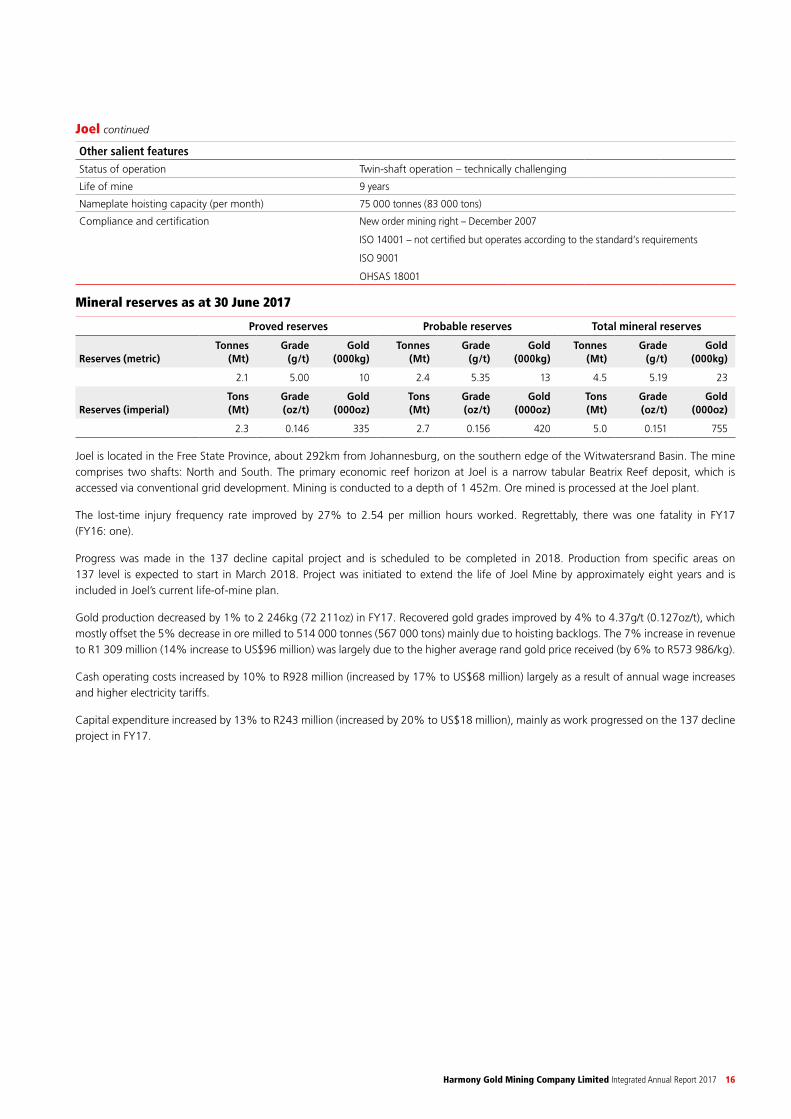
Other salient featuresStatus of operation Twin-shaft operation – technically challenging
Life of mine 9 years
Nameplate hoisting capacity (per month) 75 000 tonnes (83 000 tons)
Compliance and certification New order mining right – December 2007
ISO 14001 – not certified but operates according to the standard’s requirements
ISO 9001
OHSAS 18001
Mineral reserves as at 30 June 2017
Proved reserves Probable reserves Total mineral reserves
Reserves (metric)Tonnes
(Mt)Grade
(g/t)Gold
(000kg)Tonnes
(Mt)Grade
(g/t)Gold
(000kg)Tonnes
(Mt)Grade
(g/t)Gold
(000kg)
2.1 5.00 10 2.4 5.35 13 4.5 5.19 23
Reserves (imperial)Tons(Mt)
Grade(oz/t)
Gold(000oz)
Tons(Mt)
Grade(oz/t)
Gold(000oz)
Tons(Mt)
Grade(oz/t)
Gold(000oz)
2.3 0.146 335 2.7 0.156 420 5.0 0.151 755
Joel is located in the Free State Province, about 292km from Johannesburg, on the southern edge of the Witwatersrand Basin. The mine
comprises two shafts: North and South. The primary economic reef horizon at Joel is a narrow tabular Beatrix Reef deposit, which is
accessed via conventional grid development. Mining is conducted to a depth of 1 452m. Ore mined is processed at the Joel plant.
The lost-time injury frequency rate improved by 27% to 2.54 per million hours worked. Regrettably, there was one fatality in FY17
(FY16: one).
Progress was made in the 137 decline capital project and is scheduled to be completed in 2018. Production from specific areas on
137 level is expected to start in March 2018. Project was initiated to extend the life of Joel Mine by approximately eight years and is
included in Joel’s current life-of-mine plan.
Gold production decreased by 1% to 2 246kg (72 211oz) in FY17. Recovered gold grades improved by 4% to 4.37g/t (0.127oz/t), which
mostly offset the 5% decrease in ore milled to 514 000 tonnes (567 000 tons) mainly due to hoisting backlogs. The 7% increase in revenue
to R1 309 million (14% increase to US$96 million) was largely due to the higher average rand gold price received (by 6% to R573 986/kg).
Cash operating costs increased by 10% to R928 million (increased by 17% to US$68 million) largely as a result of annual wage increases
and higher electricity tariffs.
Capital expenditure increased by 13% to R243 million (increased by 20% to US$18 million), mainly as work progressed on the 137 decline
project in FY17.
Joel continued

17 Harmony Gold Mining Company Limited Integrated Annual Report 2017
KusasalethuFY17 FY16 FY15
Number of employees
– Permanent 4 050 3 944 3 898
– Contractors 538 539 1 020
Total 4 588 4 483 4 918
Operational
Volumes milled (000t) (metric) 607 668 908
(000t) (imperial) 670 736 1 001
Gold produced (kg) 4 394 3 863 3 953
(oz) 141 270 124 198 127 092
Gold sold (kg) 4 498 3 822 4 297
(oz) 144 614 122 880 138 151
Grade (g/t) 7.24 5.78 4.35
(oz/t) 0.211 0.169 0.127
Productivity (g/TEC) 89.05 77.80 65.59
Development results
Total metres 5 101 7 183 13 777
Reef metres 1 185 1 517 2 436
Capital metres 0 0 59
Financial
Revenue (Rm) 2 575 2 078 1 939
(US$m) 189 143 169
Average gold price received (R/kg) 572 376 543 633 451 211
(US$/oz) 1 309 1 166 1 226
Cash operating cost (Rm) 2 019 1 848 1 866
(US$m) 148 127 163
Production profit/(loss) (Rm) 494 262 (57)
(US$m) 36 18 (5)
Capital expenditure (Rm) 289 360 463
(US$m) 21 25 40
Cash operating cost (R/kg) 459 422 478 277 472 112
(US$/oz) 1 051 1 026 1 283
All-in sustaining cost (R/kg) 541 247 584 498 587 406
(US$/oz) 1 238 1 254 1 596
Safety
Number of fatalities 0 2 1
Lost-time injury frequency rate per million hours worked 10.29 7.06 25.80
Environment
Electricity consumption (GWh) 616 611 682
Water consumption – primary activities (ML) 613 1 671 1 342
Greenhouse gas emissions (000t CO2e) 610 620 702
Intensity data per tonne treated
– energy 1.01 0.91 0.75
– water 1.00 2.50 1.48
– greenhouse gas emissions 0.10 0.91 0.77
Number of reportable environmental incidents 3 1 1
Community
Local economic development* (Rm) 5 5 30
Training and development (Rm) 45 26 50
* Included in the total for FY15 is an amount of R18 million that was capitalised as part of the hostel upgrades (FY16: R0 million, FY17: R0 million)
OPERATIONAL PERFORMANCE CONTINUED
Harmony Gold Mining Company Limited Integrated Annual Report 2017 18
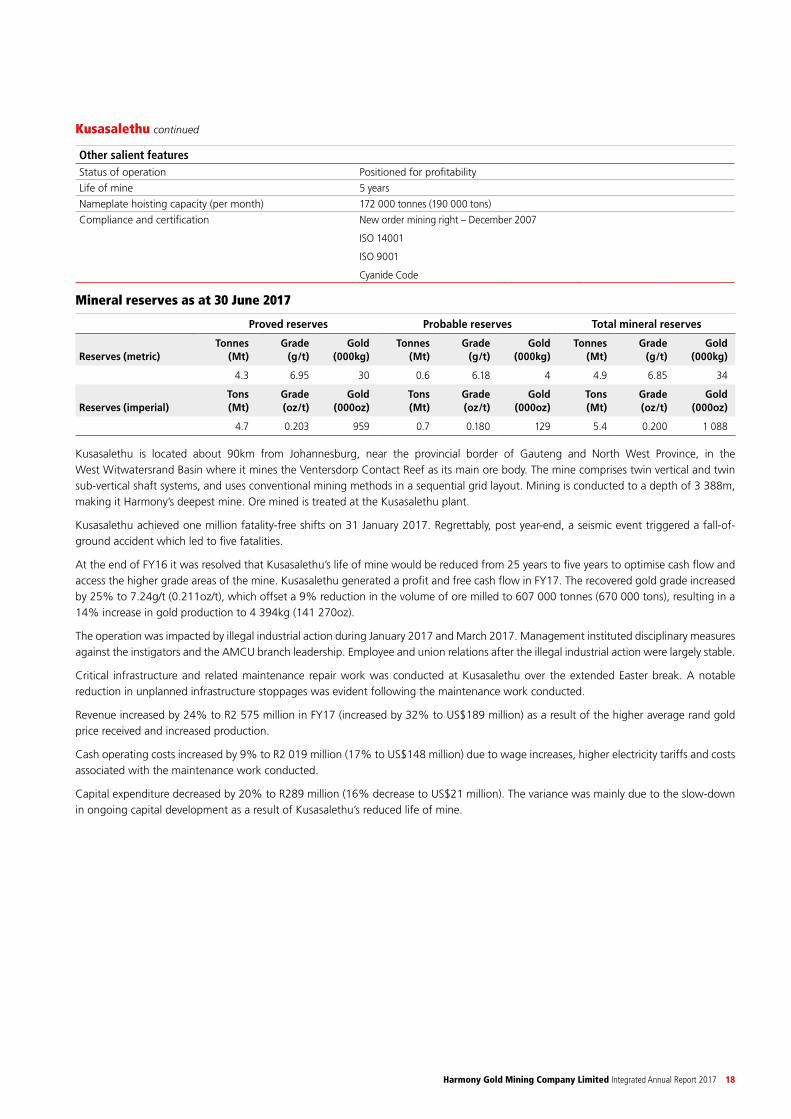
Other salient featuresStatus of operation Positioned for profitability
Life of mine 5 years
Nameplate hoisting capacity (per month) 172 000 tonnes (190 000 tons)
Compliance and certification New order mining right – December 2007
ISO 14001
ISO 9001
Cyanide Code
Mineral reserves as at 30 June 2017
Proved reserves Probable reserves Total mineral reserves
Reserves (metric)Tonnes
(Mt)Grade
(g/t)Gold
(000kg)Tonnes
(Mt)Grade
(g/t)Gold
(000kg)Tonnes
(Mt)Grade
(g/t)Gold
(000kg)
4.3 6.95 30 0.6 6.18 4 4.9 6.85 34
Reserves (imperial)Tons(Mt)
Grade(oz/t)
Gold(000oz)
Tons(Mt)
Grade(oz/t)
Gold(000oz)
Tons(Mt)
Grade(oz/t)
Gold(000oz)
4.7 0.203 959 0.7 0.180 129 5.4 0.200 1 088
Kusasalethu is located about 90km from Johannesburg, near the provincial border of Gauteng and North West Province, in the
West Witwatersrand Basin where it mines the Ventersdorp Contact Reef as its main ore body. The mine comprises twin vertical and twin
sub-vertical shaft systems, and uses conventional mining methods in a sequential grid layout. Mining is conducted to a depth of 3 388m,
making it Harmony’s deepest mine. Ore mined is treated at the Kusasalethu plant.
Kusasalethu achieved one million fatality-free shifts on 31 January 2017. Regrettably, post year-end, a seismic event triggered a fall-of-
ground accident which led to five fatalities.
At the end of FY16 it was resolved that Kusasalethu’s life of mine would be reduced from 25 years to five years to optimise cash flow and
access the higher grade areas of the mine. Kusasalethu generated a profit and free cash flow in FY17. The recovered gold grade increased
by 25% to 7.24g/t (0.211oz/t), which offset a 9% reduction in the volume of ore milled to 607 000 tonnes (670 000 tons), resulting in a
14% increase in gold production to 4 394kg (141 270oz).
The operation was impacted by illegal industrial action during January 2017 and March 2017. Management instituted disciplinary measures
against the instigators and the AMCU branch leadership. Employee and union relations after the illegal industrial action were largely stable.
Critical infrastructure and related maintenance repair work was conducted at Kusasalethu over the extended Easter break. A notable
reduction in unplanned infrastructure stoppages was evident following the maintenance work conducted.
Revenue increased by 24% to R2 575 million in FY17 (increased by 32% to US$189 million) as a result of the higher average rand gold
price received and increased production.
Cash operating costs increased by 9% to R2 019 million (17% to US$148 million) due to wage increases, higher electricity tariffs and costs
associated with the maintenance work conducted.
Capital expenditure decreased by 20% to R289 million (16% decrease to US$21 million). The variance was mainly due to the slow-down
in ongoing capital development as a result of Kusasalethu’s reduced life of mine.
Kusasalethu continued

19 Harmony Gold Mining Company Limited Integrated Annual Report 2017
MasimongFY17 FY16 FY15
Number of employees
– Permanent 2 437 2 478 2 470
– Contractors 107 112 99
Total 2 544 2 590 2 569
Operational
Volumes milled (000t) (metric) 640 650 670
(000t) (imperial) 706 716 739
Gold produced (kg) 2 538 2 432 2 463
(oz) 81 599 78 190 79 187
Gold sold (kg) 2 539 2 432 2 491
(oz) 81 631 78 191 80 087
Grade (g/t) 3.97 3.74 3.68
(oz/t) 0.116 0.109 0.107
Productivity (g/TEC) 89.73 83.85 75.27
Development results
Total metres 4 754 4 755 9 855
Reef metres 1 054 1 549 2 376
Financial
Revenue (Rm) 1 452 1 318 1 118
(US$m) 107 91 98
Average gold price received (R/kg) 571 870 541 806 448 867
(US$/oz) 1 308 1 162 1 220
Cash operating cost (Rm) 1 115 1 038 979
(US$m) 82 72 86
Production profit/(loss) (Rm) 339 280 127
(US$m) 25 19 11
Capital expenditure (Rm) 119 110 166
(US$m) 9 8 15
Cash operating cost (R/kg) 439 457 426 904 397 380
(US$/oz) 1 005 916 1 080
All-in sustaining cost (R/kg) 500 938 493 527 479 096
(US$/oz) 1 146 1 059 1 302
Safety
Number of fatalities 1 2 1
Lost-time injury frequency rate per million hours worked 10.54 10.05 12.09
Environment
Electricity consumption (GWh) 170 172 184
Water consumption – primary activities (ML) 825 715 859
Greenhouse gas emissions (000t CO2e) 169 175 190
Intensity data per tonne treated
– energy 0.27 0.26 0.28
– water 1.29 1.10 1.28
– greenhouse gas emissions 0.27 0.26 0.29
Number of reportable environmental incidents 0 0 0
Community
Local economic development (Rm) 7 6 6
Training and development (Rm) 23 22 25
OPERATIONAL PERFORMANCE CONTINUED

Harmony Gold Mining Company Limited Integrated Annual Report 2017 20
Other salient features
Status of operation Mature, single shaft operation nearing the end of its life of mine
Life of mine 4 years
Nameplate hoisting capacity (per month) 112 000 tonnes (124 000 tons)
Compliance and certification New order mining right – December 2007
ISO 14001
ISO 9001
OHSAS 18001
Mineral reserves as at 30 June 2017
Proved reserves Probable reserves Total mineral reserves
Reserves (metric)Tonnes
(Mt)Grade
(g/t)Gold
(000kg)Tonnes
(Mt)Grade
(g/t)Gold
(000kg)Tonnes
(Mt)Grade
(g/t)Gold
(000kg)
2.1 4.19 9 0.3 3.23 1 2.4 4.07 10
Reserves (imperial)Tons(Mt)
Grade(oz/t)
Gold(000oz)
Tons(Mt)
Grade(oz/t)
Gold(000oz)
Tons(Mt)
Grade(oz/t)
Gold(000oz)
2.3 0.122 281 0.3 0.094 31 2.6 0.119 312
Masimong is located in the Free State Province, near Welkom, about 260km from Johannesburg. The Masimong complex comprises an
operating shaft (5 shaft) and 4 shaft, which, although closed for mining, is used for ventilation, pumping and as a second escape outlet.
Masimong exploits the Basal Reef and the secondary B Reef. Mining is conducted to a depth of 2 050m. Ore mined is processed at the
Harmony One plant.
Sadly, there was one fatality at Masimong in FY17. Management is committed to improving the safety at this operation.
Masimong delivered an improved performance in FY17 as a result of accessing higher grade B-reef areas and improved mining discipline.
The recovered gold grade increased by 6% to 3.97g/t (0.116oz/t). Ore milled decreased by 2% to 640 000 tonnes (706 000 tons). Gold
produced increased by 4% to 2 538kg (81 599oz).
The increase in gold production and 6% increase in the average rand gold price received in FY17 (to R571 870/kg) contributed to a 10%
increase in revenue to R1 452 million (18% increase to US$107 million, due to increased production and the strengthening of the average
rand/US dollar exchange rate by 6% from R14.50 in FY16 to R13.60 in FY17).
Cash operating costs increased by 7% to R1 115 million (14% increase to US$82 million) mainly due to wage and electricity tariff increases.
Capital expenditure increased by 8% to R119 million (increased by 13% to US$9 million). Capital was spent mainly on ongoing development.
Masimong continued

21 Harmony Gold Mining Company Limited Integrated Annual Report 2017
UniselFY17 FY16 FY15
Number of employees
– Permanent 1 839 1 817 1 809
– Contractors 152 128 114
Total 1 991 1 945 1 923
Operational
Volumes milled (000t) (metric) 394 424 417
(000t) (imperial) 436 467 460
Gold produced (kg) 1 595 1 704 1 695
(oz) 51 280 54 785 54 495
Gold sold (kg) 1 590 1 705 1 715
(oz) 51 120 54 817 55 138
Grade (g/t) 4.05 4.02 4.06
(oz/t) 0.118 0.117 0.118
Productivity (g/TEC) 73.56 77.43 77.82
Development results
Total metres 3 647 3 145 5 177
Reef metres 1 575 1 917 2 816
Financial
Revenue (Rm) 915 925 770
(US$m) 67 64 67
Average gold price received (R/kg) 575 650 542 487 449 082
(US$/oz) 1 317 1 164 1 220
Cash operating cost (Rm) 839 754 674
(US$m) 62 52 59
Production profit/(loss) (Rm) 77 171 88
(US$m) 6 12 7
Capital expenditure (Rm) 78 62 99
(US$m) 6 4 9
Cash operating cost (R/kg) 525 732 442 359 397 615
(US$/oz) 1 203 949 1 080
All-in sustaining cost (R/kg) 591 913 496 099 469 246
(US$/oz) 1 354 1 064 1 275
Safety
Number of fatalities 0 0 1
Lost-time injury frequency rate per million hours worked 13.57 9.61 8.74
Environment
Electricity consumption (GWh) 112 112 109
Water consumption – primary activities (ML) 441 563 519
Greenhouse gas emissions (000t CO2e) 112 113 112
Intensity data per tonne treated
– energy 0.28 0.26 0.26
– water 1.12 1.33 1.25
– greenhouse gas emissions 0.28 0.26 0.27
Number of reportable environmental incidents 0 0 0
Community
Local economic development* (Rm) 5 4 19
Training and development (Rm) 24 23 21
* Included in the total for FY15 is an amount of R15 million that was capitalised as part of the hostel upgrades (FY16: R0 million, FY17: R0 million)
OPERATIONAL PERFORMANCE CONTINUED

Harmony Gold Mining Company Limited Integrated Annual Report 2017 22
Other salient features
Status of operation Mature operation reaching the end of its life of mine. Mining of safety pillars to begin in FY18
Life of mine 5 years
Nameplate hoisting capacity (per month) 63 000 tonnes (69 000 tons)
Compliance and certification New order mining right – December 2007
ISO 9001
Mineral reserves as at 30 June 2017
Proved reserves Probable reserves Total mineral reserves
Reserves (metric)Tonnes
(Mt)Grade
(g/t)Gold
(000kg)Tonnes
(Mt)Grade
(g/t)Gold
(000kg)Tonnes
(Mt)Grade
(g/t)Gold
(000kg)
1.2 4.56 5 0.9 4.60 4 2.0 4.58 9
Reserves (imperial)Tons(Mt)
Grade(oz/t)
Gold(000oz)
Tons(Mt)
Grade(oz/t)
Gold(000oz)
Tons(Mt)
Grade(oz/t)
Gold(000oz)
1.3 0.133 170 1.0 0.134 131 2.3 0.134 302
Unisel is located in the Free State Province, near Virginia, about 270km from Johannesburg. Mining is conducted to a depth of 2 153m
below surface. Conventional scattered mining and pillar reclamation take place to access the Basal, Leader and, to a lesser extent, the
Middle reefs. Ore mined is processed at Harmony One plant.
Unisel is nearing the end of its operating life and is Harmony’s oldest operating mine. Unisel’s ageing infrastructure presents significant
challenges to the mine’s operational flexibility and to the maintenance of production. From FY18 mining will focus on targeted areas of the
shaft pillar and continue for an estimated three years.
In May 2017, Unisel achieved one million fatality-free shifts, with FY17 being the second consecutive year without a fatality.
Gold production declined by 6% to 1 595kg (51 280oz) in FY17 mainly as ore milled decreased by 7% to 394 000 tonnes (436 000 tons).
While the recovered gold grade increased by 1% to 4.05g/t (0.118oz/t). The decrease in gold production offset the 6% increase in
the average rand gold price received (to R575 650/kg), which resulted in a 1% decrease in revenue to R915 million (5% increase to
US$67 million). Unplanned infrastructure disruptions in the main shaft and decline sections affected production.
Cash operating costs increased by 11% to R839 million (increased by 19% to US$62 million), mainly due to increased labour costs related
to wage increases and once-off special bonuses, increased repair and maintenance expenditure and associated overtime.
Capital expenditure increased by 26% to R78 million (increased by 50% to US$6 million) mainly due to the purchase and installation of a
replacement of the man winder motor and capital repairs to the replaced unit which is available as a spare unit.
Unisel continued

23 Harmony Gold Mining Company Limited Integrated Annual Report 2017
SOUTH AFRICA – SURFACE OPERATIONSKalgold
FY17 FY16 FY15
Number of employees
– Permanent 241 235 240
– Contractors 395 377 465
Total 636 612 705
Operational
Volumes milled (000t) (metric) 1 506 1 479 1 472
(000t) (imperial) 1 660 1 630 1 623
Gold produced (kg) 1 205 1 103 1 198
(oz) 38 742 35 463 38 517
Gold sold (kg) 1 213 1 086 1 230
(oz) 38 999 34 916 39 545
Grade (g/t) 0.80 0.75 0.81
(oz/t) 0.023 0.022 0.024
Productivity (g/TEC) 123.82 116.79 183.86
Financial
Revenue (Rm) 695 595 551
(US$m) 51 41 48
Average gold price received (R/kg) 573 010 548 072 448 230
(US$/oz) 1 311 1 176 1 218
Cash operating cost (Rm) 557 548 452
(US$m) 41 38 40
Production profit/(loss) (Rm) 131 55 88
(US$m) 10 4 8
Capital expenditure* (Rm) 96 39 48
(US$m) 7 3 4
Cash operating cost (R/kg) 462 037 496 991 377 547
(US$/oz) 1 057 1 066 1 026
All-in sustaining cost* (R/kg) 558 731 549 590 427 902
(US$/oz) 1 278 1 179 1 163
Safety
Number of fatalities 0 0 0
Lost-time injury frequency rate per million hours worked 2.19 0 2.25
Environment
Electricity consumption (GWh) 54 49 40
Water consumption – primary activities (ML) 392 375 1 795
Greenhouse gas emissions (000t CO2e) 53 50 41
Intensity data per tonne treated
– energy 0.04 0.03 0.03
– water 0.26 0.25 1.22
– greenhouse gas emissions 0.36 0.03 0.03
Number of reportable environmental incidents 0 0 1
Community
Local economic development (Rm) 2 2 2
Training and development (Rm) 7 5 4
OPERATIONAL PERFORMANCE CONTINUED
* Figures for FY15 and FY16 restated to include capitalised stripping activities

Harmony Gold Mining Company Limited Integrated Annual Report 2017 24
Other salient features
Status of operation Open-pit mining operation
Life of mine 21 years
Compliance and certification New order mining right – August 2008
ISO 14001
ISO 9001
Mineral reserves as at 30 June 2017
Proved reserves Probable reserves Total mineral reserves
Reserves (metric)Tonnes
(Mt)Grade
(g/t)Gold
(000kg)Tonnes
(Mt)Grade
(g/t)Gold
(000kg)Tonnes
(Mt)Grade
(g/t)Gold
(000kg)
4.5 0.96 4 22.1 1.12 25 26.6 1.09 29
Reserves (imperial)Tons(Mt)
Grade(oz/t)
Gold(000oz)
Tons(Mt)
Grade(oz/t)
Gold(000oz)
Tons(Mt)
Grade(oz/t)
Gold(000oz)
4.9 0.028 138 24.4 0.033 796 29.3 0.032 934
Kalgold is an open-pit mine situated 55km southwest of Mahikeng in North West Province and located within the Kraaipan Greenstone
Belt. Mining takes place from the A-Zone pit. Ore mined is processed at a carbon-in-leach plant located at Kalgold.
There were no fatalities during the year under review.
The A-Zone and Watertank pits are to be merged into one pit which is expected to expose higher grade ore. Plant refurbishment and
crusher upgrades were completed during FY17. These improvements delivered improved plant efficiencies and recoveries while the
crushers delivered finer and increased volumes of ore throughput to the plant mills.
Gold production improved by 9% to 1 205kg (38 742oz), which was due to an increase in the recovered grade by 7% to 0.80g/t
(0.023oz/t), and increase in ore milled by 2% to 1 506 000 tonnes (1 660 000 tons). Revenue increased by 17% to R695 million (a 24%
increase to US$51 million) as a result of increased production and the higher average gold price received.
Cash operating costs increased by 2% to R557 million (8% increase to US$41 million). Refer to capital expenditure discussion below.
Capital expenditure increased by 146% to R96 million (increased by 133% to US$7 million), mainly due to the increase from capitalised
stripping activities of R77 million (US$5.7 million) from the A-zone pit and Watertank pit merger as the ore to waste ratio takes into
account a larger merged pit and increased expenditure related to the plant refurbishment and crusher upgrades.
Kalgold continued

25 Harmony Gold Mining Company Limited Integrated Annual Report 2017
Phoenix (Tailings retreatment)FY17 FY16 FY15
Number of employees
– Permanent 82 82 83
– Contractors 261 296 312
Total 343 378 395
Operational
Volumes milled (000t) (metric) 6 729 6 465 6 245
(000t) (imperial) 7 420 7 129 6 887
Gold produced (kg) 918 804 867
(oz) 29 515 25 849 27 875
Gold sold (kg) 932 788 881
(oz) 29 964 25 335 28 324
Grade (g/t) 0.136 0.124 0.139
(oz/t) 0.004 0.004 0.004
Productivity (g/TEC) 187.96 177.72 185.73
Financial
Revenue (Rm) 512 429 396
(US$m) 38 30 35
Average gold price received (R/kg) 549 777 544 390 449 941
(US$/oz) 1 258 1 168 1 223
Cash operating cost (Rm) 364 320 295
(US$m) 27 22 26
Production profit/(loss) (Rm) 140 117 97
(US$m) 10 8 8
Capital expenditure (Rm) 5 5 4
(US$m) – – –
Cash operating cost (R/kg) 396 486 398 122 339 896
(US$/oz) 907 854 924
All-in sustaining cost (R/kg) 404 685 403 907 344 319
(US$/oz) 926 866 936
Safety
Number of fatalities 0 0 0
Lost-time injury frequency rate per million hours worked 0 2.06 0.00
Environment
Electricity consumption (GWh) 42 40 41
Water consumption – primary activities (ML) 249 267 277
Greenhouse gas emissions (000t CO2e) 42 41 42
Intensity data per tonne treated
– energy 0.006 0.006 0.007
– water 0.04 0.04 0.04
– greenhouse gas emissions 0.006 0.006 0.007
Number of reportable environmental incidents 0 0 0
OPERATIONAL PERFORMANCE CONTINUED
Harmony Gold Mining Company Limited Integrated Annual Report 2017 26
Other salient features
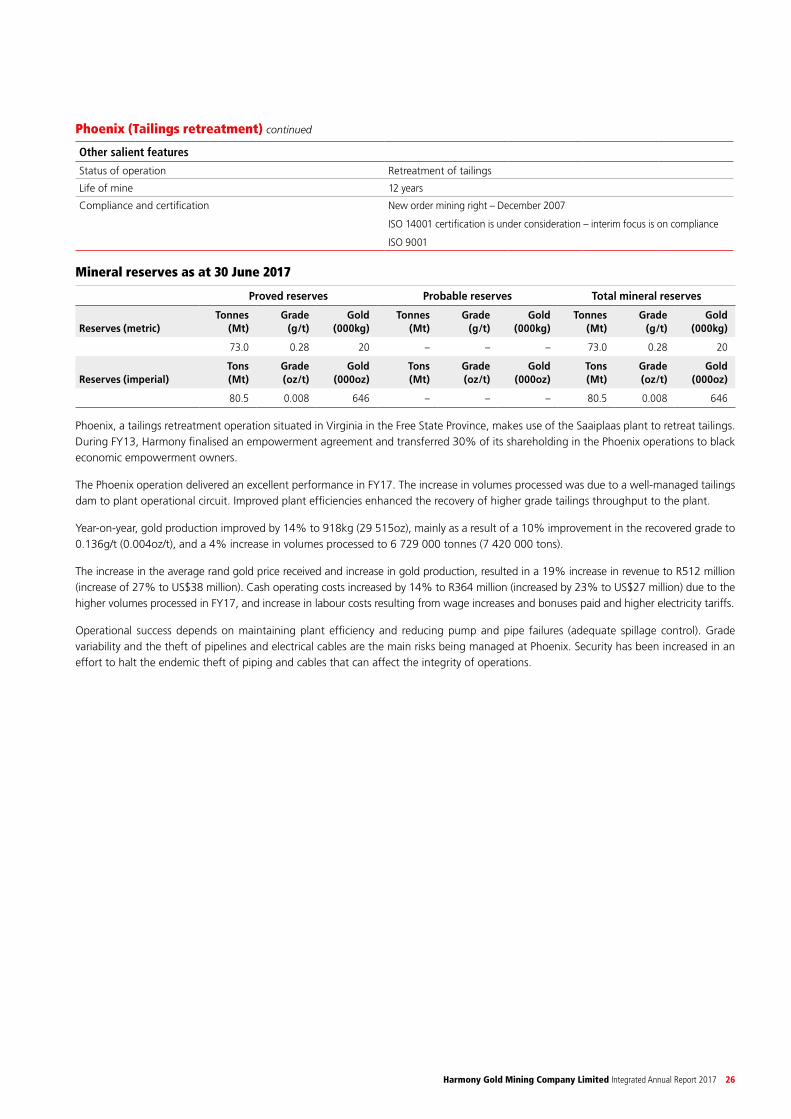
Status of operation Retreatment of tailings
Life of mine 12 years
Compliance and certification New order mining right – December 2007
ISO 14001 certification is under consideration – interim focus is on compliance
ISO 9001
Mineral reserves as at 30 June 2017
Proved reserves Probable reserves Total mineral reserves
Reserves (metric)Tonnes
(Mt)Grade
(g/t)Gold
(000kg)Tonnes
(Mt)Grade
(g/t)Gold
(000kg)Tonnes
(Mt)Grade
(g/t)Gold
(000kg)
73.0 0.28 20 – – – 73.0 0.28 20
Reserves (imperial)Tons(Mt)
Grade(oz/t)
Gold(000oz)
Tons(Mt)
Grade(oz/t)
Gold(000oz)
Tons(Mt)
Grade(oz/t)
Gold(000oz)
80.5 0.008 646 – – – 80.5 0.008 646
Phoenix, a tailings retreatment operation situated in Virginia in the Free State Province, makes use of the Saaiplaas plant to retreat tailings.
During FY13, Harmony finalised an empowerment agreement and transferred 30% of its shareholding in the Phoenix operations to black
economic empowerment owners.
The Phoenix operation delivered an excellent performance in FY17. The increase in volumes processed was due to a well-managed tailings
dam to plant operational circuit. Improved plant efficiencies enhanced the recovery of higher grade tailings throughput to the plant.
Year-on-year, gold production improved by 14% to 918kg (29 515oz), mainly as a result of a 10% improvement in the recovered grade to
0.136g/t (0.004oz/t), and a 4% increase in volumes processed to 6 729 000 tonnes (7 420 000 tons).
The increase in the average rand gold price received and increase in gold production, resulted in a 19% increase in revenue to R512 million
(increase of 27% to US$38 million). Cash operating costs increased by 14% to R364 million (increased by 23% to US$27 million) due to the
higher volumes processed in FY17, and increase in labour costs resulting from wage increases and bonuses paid and higher electricity tariffs.
Operational success depends on maintaining plant efficiency and reducing pump and pipe failures (adequate spillage control). Grade
variability and the theft of pipelines and electrical cables are the main risks being managed at Phoenix. Security has been increased in an
effort to halt the endemic theft of piping and cables that can affect the integrity of operations.
Phoenix (Tailings retreatment) continued

27 Harmony Gold Mining Company Limited Integrated Annual Report 2017
Surface dumpsFY17 FY16 FY15
Number of employees
– Permanent 10 10 10
– Contractors 107 190 174
Total 117 200 184
Operational
Volumes milled (000t) (metric) 2 810 3 041 2 701
(000t) (imperial) 3 099 3 353 2 978
Gold produced (kg) 1 055 1 065 862
(oz) 33 918 34 241 27 713
Grade (g/t) 0.375 0.350 0.319
(oz/t) 0.011 0.010 0.009
Financial
Revenue (Rm) 609 577 389
(US$m) 45 40 34
Average gold price received (R/kg) 572 172 544 996 450 420
(US$/oz) 1 309 1 169 1 224
Cash operating cost (Rm) 459 427 330
(US$m) 34 29 29
Production profit/(loss) (Rm) 142 158 58
(US$m) 10 11 5
Capital expenditure (Rm) 163 18 6
(US$m) 12 1 1
Cash operating cost (R/kg) 434 715 401 033 382 959
(US$/oz) 995 860 1 041
All-in sustaining cost (R/kg) 445 451 422 205 403 906
(US$/oz) 1 019 906 1 097
Safety
Number of fatalities 0 0 0
Lost-time injury frequency rate per million hours worked 0 0 2.48
Environment
Electricity consumption (GWh) 52 66 64
Water consumption – primary activities (ML) 234 394 480
Greenhouse gas emissions (000t CO2e) 51 67 66
Intensity data per tonne treated
– energy 0.02 0.02 0.02
– water 0.08 0.12 0.18
– greenhouse gas emissions 0.02 0.02 0.02
Number of reportable environmental incidents 0 0 0
Community
Local economic development (Rm) 0 0 0
OPERATIONAL PERFORMANCE CONTINUED

Harmony Gold Mining Company Limited Integrated Annual Report 2017 28
Other salient features
Status of operation Following the conversion of the Central Plant to process tailings, the processing of waste rock dumps will be substantially reduced over the next few years.
Life of mine ± 1 year (depending on availability of spare plant capacity)
Compliance and certification Certification depends on the future of these operations
ISO 9001
Mineral reserves as at 30 June 2017
Proved reserves Probable reserves Total mineral reserves
Reserves (metric)Tonnes
(Mt)Grade
(g/t)Gold
(000kg)Tonnes
(Mt)Grade
(g/t)Gold
(000kg)Tonnes
(Mt)Grade
(g/t)Gold
(000kg)
– – – 3.9 0.51 2 3.9 0.51 2
Reserves (imperial)Tons(Mt)
Grade(oz/t)
Gold(000oz)
Tons(Mt)
Grade(oz/t)
Gold(000oz)
Tons(Mt)
Grade(oz/t)
Gold(000oz)
– – – 4.3 0.015 64 4.3 0.015 64
Production from the processing of surface rock dumps situated in the Free State province of South Africa depends entirely on the availability
of spare mill capacity at the Harmony One and Target plants, which in turn depends on the availability of underground ore delivered for
milling. Waste and waste rock dump deliveries to Kusasalethu Plant (situated near the border of Gauteng and North West Province)
supplement mining volumes in order to secure sufficient backfill to use as support in stoping areas.
The tailings retreatment conversion of the Central Plant in FY17 reduced capacity to process waste rock volumes and resulted in an 8%
decrease in volumes milled to 2 810 000 tonnes (3 099 000 tons). Waste rock dumps will no longer be processed at the Central Plant in
FY18 following the completion of the conversion of this plant to treat tailings.
Gold production from the processing of material from the surface dumps reduced by 1% as the decrease in volumes processed was largely
offset by the increase in the recovered grade of 7% to 0.375g/t (0.011oz/t) as higher grade waste rock material was processed in FY17.
Included in the capital expenditure for FY17 is R156 million (US$11.5 million) related to the Central Plant tailings conversion project which
was completed on time and below budget.
Surface dumps continued

29 Harmony Gold Mining Company Limited Integrated Annual Report 2017
PAPUA NEW GUINEAHidden Valley
FY17* FY16* FY15*
Number of employees
– Permanent 1 192
– Contractors 881
Total 2 073 1 1 618 1 2 157
Operational
Volumes milled (000t) (metric) 2 889 1 729 1 825
(000t) (imperial) 3 186 1 906 2 012
Gold produced 2 (kg) 2 965 2 257 2 943
(oz) 95 327 72 565 94 619
Gold sold 2 (kg) 3 119 2 340 3 003
(oz) 100 278 75 233 96 548
Grade (g/t) 1.07 1.31 1.61
(oz/t) 0.035 0.038 0.047
Financial
Revenue (Rm) 1 500 1 320 1 346
(US$m) 110 91 118
Average gold price received (R/kg) 544 442 564 272 448 322
(US$/oz) 1 246 1 210 1 218
Cash operating cost (Rm) 1 214 1 082 1 153
(US$m) 89 75 101
Production profit/(loss) (Rm) 186 108 203
(US$m) 14 7 18
Capital expenditure 3 (Rm) 1 335 121 357
(US$m) 98 8 31
Cash operating cost (R/kg) 466 847 479 196 391 774
(US$/oz) 1 068 1 028 1 065
All-in sustaining cost (R/kg) 543 186 597 398 514 690
(US$/oz) 1 241 1 282 1 395
Safety
Number of fatalities 0 1 1
Lost-time injury frequency rate per million hours worked 0.52 1.39 0.28
Environment
Electricity consumption (GWh) 53 54 48
Water consumption – primary activities (ML) 1 309 715 722
Greenhouse gas emissions (000t CO2e) 53 55 0
Intensity data per tonne treated
– energy 0.02 0.03 0.03
– water 0.45 0.41 0.39
– greenhouse gas emissions 0.07 0.03 0
Number of reportable environmental incidents 0 0 1
OPERATIONAL PERFORMANCE CONTINUED
* The FY16 and FY15 key statistics in the table above represent Harmony’s 50% interest in the Hidden Valley mine and are not comparable to the FY17 results.Following Harmony’s acquisition of the remaining 50% of Hidden Valley in October 2016, Hidden Valley has been accounted for at 100% from the end
of October 2016
1 Employees of the Hidden Valley joint venture2 FY17 gold produced and gold sold includes 364kg (11 713oz) capitalised as part of pre-stripping of stages 5 and 6 (FY16:nil), (FY15:nil). Revenue of
R195 million (US$14 million) and the associated costs were capitalised3 Figures for FY15 restated to include capitalised stripping activities

Harmony Gold Mining Company Limited Integrated Annual Report 2017 30
Other salient featuresStatus of operation Open-pit mining operation producing gold and silver. Post the acquisition in full,
the stage 5 and 6 cutback investment is underway; commercial levels of production scheduled for the last quarter of FY18
Life of mine 6 years
Compliance and certification Mining lease approved by Papua New Guinea authorities
Mineral reserves as at 30 June 2017 (including Hamata)
Gold Proved reserves Probable reserves Total mineral reserves
Reserves (metric)Tonnes
(Mt)Grade
(g/t)Gold
(000kg)Tonnes
(Mt)Grade
(g/t)Gold
(000kg)Tonnes
(Mt)Grade
(g/t)Gold
(000kg)
0.5 1.04 0.4 25.7 1.65 43 26.2 1.63 43
Reserves (imperial)Tons(Mt)
Grade(oz/t)
Gold(000oz)
Tons(Mt)
Grade(oz/t)
Gold(000oz)
Tons(Mt)
Grade(oz/t)
Gold(000oz)
0.6 0.030 17 28.4 0.048 1 370 29.0 0.048 1 387
The Hidden Valley mine is an open pit gold and silver mine, situated in the highly prospective area of the Morobe Province in Papua New
Guinea, some 210km northwest of Port Moresby. Harmony increased its interest in Hidden Valley to 100% by acquiring the remaining
50% in October 2016.
The major gold and silver deposits of the Morobe goldfield and Hidden Valley are hosted in the Wau Graben. The operational pits are
Hidden Valley-Kaveroi and Hamata, located approximately 6km apart. Ore mined is treated at the Hidden Valley processing plant.
The acquisition of full ownership of Hidden Valley followed the decision to invest primarily in the development of the Hidden Valley-
Kaveroi stage 5 and 6 cutbacks. The investment in Hidden Valley has the potential to contribute approximately 180 000oz gold per
annum to Harmony’s production profile, at an all-in sustaining cost of less than US$950/oz. The total investment capital will be net
US$180 million, of which US$68 million was spent in FY17 with expenditure of an estimated US$110 million planned for FY18. Commercial
levels of production are expected to be achieved in the June quarter of FY18.
A planned major four-month shutdown commenced in August 2017. Depleted ore stockpiles and a lack of mined ore to feed the plant
have necessitated the shutdown, during which extensive upgrades and maintenance will be undertaken.
During FY17, the mine processed ore from the Hamata pit and stockpiles until June 2017 which resulted in the 18% decrease in grade
year on year to 1.07g/t (0.035oz/t).
The lost-time injury frequency rate improved significantly in FY17 to 0.52 per million hours worked from 1.39 in FY16. There were no
fatalities in FY17 (FY16: one). A culture of safe behaviour and the use of critical control equipment are driving improved safety performance.
Ore milled in the process plant increased by 67% to 2.9 million tonnes (3.2 million tons), gold production rose by 31% year-on-year to
2 965kg (95 327oz), resulting in an increase in revenue of 14% to R1 500 million (an increase of 21% to US$110 million). Cash operating
costs increased by 12% to R1 214 million (19% increase to US$89 million). These increases are mainly attributable to Harmony’s increased
stake in Hidden Valley.
Capital expenditure increased by 1 003% in FY17 to R1 335 million (increased by 1 125% to US$98 million). In order to support waste strip
mining and improve production, a significant investment was made in additional and replacement mining equipment.
Hidden Valley continued