operational modal analysis of a helicopter rotor blade ... · as helicopter rotor blades and wind...
TRANSCRIPT

Experimental Mechanics (2017) 57:367–375DOI 10.1007/s11340-016-0230-6
Operational Modal Analysis of a Helicopter Rotor BladeUsing Digital Image Correlation
S. Rizo-Patron1 · J. Sirohi1
Received: 12 May 2016 / Accepted: 10 October 2016 / Published online: 24 October 2016© Society for Experimental Mechanics 2016
Abstract A novel procedure to perform operational modalanalysis on a reduced-scale, 2 m diameter helicopter rotorblade is described. Images of the rotor blade rotating at 900RPM are captured by a pair of high-speed digital camerasat a sampling rate of 1000 frames per second. From theseimages, the out-of-plane bending deformation of the rotorblade is measured using Digital Image Correlation, with aspatial resolution of 7.2 mm and an accuracy of 60 μm,or 0.006 % of the rotor radius. Modal parameters includ-ing natural frequencies and mode shapes are determinedfrom the bending deformation through application of theIbrahim Time Domain method. The first three out-of-planebending modes were identified at each rotational speed andcompared to an analytical finite element model of the rotorblade. The experimental and analytical natural frequenciesagreed to within 0.2 % in the best case and 10.0 % in theworst case. The experimental mode shapes were also foundto closely match the analytical predictions. The results ofthis study demonstrate the ability of this procedure to accu-rately determine the modal parameters of rotating helicopterrotor blades.
Keywords Digital image correlation · Helicopter bladedeformation · Modal analysis · Rotating naturalfrequency · Rotating mode shape
� Jayant [email protected]
1 Department of Aerospace Engineering and EngineeringMechanics, The University of Texas at Austin,210 E. 24th street, Austin, TX 78712, USA
Introduction
The dynamic response of typical rotating structures suchas helicopter rotor blades and wind turbine blades is dom-inated by centrifugal force, which stiffens the rotor bladesin flap (out of the rotor plane) bending, lead-lag bending(in the rotor plane) and torsion. This is especially importantin cases where the structural flexural stiffness EI (E is theYoung’s modulus and I is the sectional moment of inertia)is comparable to the centrifugal stiffening mo�
2R4 (mo andR are the mass per unit length and radius of the rotor bladerespectively, and � is the speed of rotation). As the rota-tional speed increases, the natural frequencies of the rotorblade increase. To validate analytical models, or for appli-cations such as health monitoring, it is desirable to measurethe natural frequencies and mode shapes of the rotor bladeunder rotation.
Modal analysis of rotating structures is a challengingarea of research in structural analysis. The experimentaldetermination of modal properties of a structure typicallyinvolves three steps (a) providing a known excitation, (b)measuring the resulting response and (c) extraction of modalproperties from the measured response. Bucher and Ewins[1] present an overview of several techniques commonlyused in experimental modal analysis of rotating structures.The primary difficulty in the case of a rotating structureis applying a known excitation to the system, which isrequired for frequency domain modal analyses. Anotherdifficulty is installing sufficient sensors (such as straingages) on the rotating blades to properly characterize thesystem. This installation is complicated by slip-rings totransmit electrical signals between the rotating and non-rotating frames. As a result, there are a limited number

368 Exp Mech (2017) 57:367–375
of experimental modal analyses of rotating blades underoperating conditions. Wilkie et al. [2] measured some nat-ural frequencies of a 110 inch diameter model helicopterrotor blade at speeds ranging from 0 to 660 RPM, usingstrain gages bonded on the rotor blade at three spanwiselocations. In this study, the mode shapes were not deter-mined due to the limited spatial resolution of the mea-surements. Other sensing techniques have also been usedto measure the blade deformation. Schroeder et al. [3]describe Fiber Bragg Gratings embedded in the blades ofa 4.5 MW horizontal axis wind turbine to measure strain.Molenaar [4] describes the measurement of natural fre-quency on a non-rotating blade of a 750 kW horizontalaxis wind turbine using accelerometers. These type of sen-sors also require some sort of interface, for electronics orfor optics, between the non-rotating and rotating referenceframes.
Recently, several researchers have used optical meth-ods to measure the deformation of rotating wind turbineand helicopter rotor blades. Optical methods are attrac-tive to measure deformation because they do not requireelectrical wiring and slip-rings, and they can be easilyreconfigured to measure larger test articles. Abrego et al.[5] measured the displacement of the rotor blades of a full-scale UH-60A helicopter in a wind tunnel over a rangeof flight conditions using multi-camera photogrammetry.In this technique, high reflectance targets are attached tothe test article. The position of the targets in the cameraimages is related to physical coordinates using a cali-bration. Ozbek et al. [6] used photogrammetry to mea-sure the time history of blade deflection on a 2.5 MWhorizontal axis wind turbine with a 80m diameter rotor.The advantage of optical techniques is that they are non-contact, they do not require expensive instrumentation tobe installed on the blade, and they give very good accu-racy, on the order of 1/5000 of the field of view forout-of-plane displacements. Digital Image Correlation isanother optical technique that can measure displacementsat a much higher spatial resolution. Baqersad et al. [7]reviewed several studies that used optical methods suchas three-dimensional dynamic point tracking, stereopho-togrammetry and Digital Image Correlation to measure thedisplacement of wind turbine blades, helicopter rotor bladesand aircraft propeller blades. For example, Lundstromet al. [8] performed an operational modal analysis onthe rotor blade of a Robinson R44 helicopter in hoverusing stereophotogrammetry. In most of the studies onhelicopter rotor blades, the measured deformation wasused to extract natural frequencies and operating deflectionshapes.
The present study describes operational modal analysisof the flap bending deformation of a blade from a 2.032
m diameter helicopter rotor at different rotational speeds.A jet of air is used to provide a forcing to the bladeand the resulting flap bending free response is measuredusing Digital Image Correlation. The natural frequenciesand mode shapes are extracted from these measurementsusing the Ibrahim Time Domain method. Previous studieson the modal analysis of rotating blades have involved pho-togrammetry and extraction of operating deflection shapes.In contrast, the present study combines a novel excitationtechnique, a high spatial resolution deformation measure-ment and time-domain modal analysis to extract naturalfrequencies and mode shapes of a rotating blade.
Methods
Digital Image Correlation
Digital image correlation (DIC) is an optical deformationmeasurement technique that can be used to measure thethree-dimensional (3D), whole-field deformation of a body.Kahn-Jetter and Chu [9] describe the theory and applicationof 3D DIC. In this technique, a high-contrast speckle patternis applied to the test article, and a pair of high-resolutioncameras separated by a fixed distance captures images ofthe undeformed and deformed surface. A mapping functiondetermined through a calibration procedure translates imagecoordinates into 3D physical coordinates. Cross-correlationof the undeformed and deformed images, in conjunctionwith the mapping function yields a deformation map of thesurface.
This technique has been used for measuring the defor-mation of moving objects such as flapping wings [10–12]and rotating structures. For example, Ha et al. [12] usedDIC to measure the natural frequencies, damping ratios andmode shapes of a flapping wing that was excited at its nat-ural frequency using a shaker. Sirohi and Lawson [13] andSicard and Sirohi [14] used DIC to measure the flap, lead-lag, and torsional deformation of rotating helicopter bladeswith diameters ranging from 7.6 cm to 61 cm rotating at1500 RPM. It was found that out-of-plane deformations upto 10 mm could be measured with an accuracy of 97 μm, or0.04 % of the rotor radius.
These studies on helicopter rotor blades validated theDIC measurement technique and established the achievableaccuracy. However, in these studies, images were cap-tured by low-speed digital cameras that were triggered atspecific instants (azimuthal positions of the rotor blade),and the deformation was calculated by averaging the DICresults over 100 rotor revolutions. In the present study, time-resolved DIC is performed on a sequence of images ofthe rotor blade captured using high-speed digital cameras.

Exp Mech (2017) 57:367–375 369
Modal analysis is then performed on the measured deforma-tion to extract the natural frequencies and mode shapes ofthe rotating blade.
Ibrahim Time Domain Method
The Ibrahim Time Domain (ITD) [15] method of modalanalysis was developed as an alternative to frequencydomain modal analyses. One of the primary benefits ofthis method is that it does not require measurements of theexcitation of the system under investigation. This makes itan ideal candidate for operational modal analysis of rotat-ing blades, where the excitation is generally unknown anddifficult to measure.
The ITD method requires measurement of the tempo-ral response of the system at n locations and over 2mtime instants (where m > n). These measurements can beassembled into a matrix Y of size n × 2m given by
Y = [y(t1)y(t2) . . . y(tm)] (1)
where the vectors y of size n × 1 are the responses of thesystem at each time instant. Similarly, the matrices Y and Y
can be assembled using measurements delayed in time bythe sampling interval �t as
Y = [y(t1 + �t)y(t2 + �t) . . . y(tm + �t)] (2)
Y = [y(t1 + 2�t)y(t2 + 2�t) . . . y(tm + 2�t)] (3)
These matrices can be combined into the response matri-ces � and � (each of size 2n × 2m) where
� =[
Y
Y
]� =
[Y
Y
](4)
An eigenvalue problem can be formulated from theseresponse matrices:
A�r = αr�r (5)
where the matrix A is calculated using a double leastsquares approximation as
A = 1
2
([��T ][��T ]−1 + [��T ][��T ]−1
)(6)
Ibrahim [16] recommends keeping m > 4n to ensure anaccurate least squares approximation. The 2m eigenvectors{�} correspond to the mode shapes of the system, whichappear as m complex conjugate pairs. The 2m eigenvaluesαr also appear as conjugate pairs and contain the corre-sponding natural frequencies and damping ratios. Thus,formulating these response matrices using the deformationmeasured at n locations will determine m modes.
Because of the overdetermined nature of the system,i.e., m > n, some of these modes are purely computa-tional. This is advantageous in accounting for noise in themeasured deformation. For example, if p < n modes con-tribute to the measured response above the noise floor, thenm − p computational modes containing the measurementnoise will be calculated. One method to separate the compu-tational modes from the actual structural modes is to solvethe eigenvalue problem for a different set of time instantsand compare the complex eigenvectors from both solu-tions using the Mode Shape Correlation Constant (MSCC).Ibrahim and Pappa [17] define the MSCC as,
MSCC =∣∣ {γ1}T {γ2}∗
∣∣2{γ1} {γ1}∗ {γ2}T {γ2}∗
(7)
where {γ1} is the first modal vector, {γ2} is the second modalvector, and * denotes the complex conjugate. If two modeshapes have an MSCC close to 1.00, then the modes arecorrelated. This can be used to separate actual modes fromcomputational modes, which will not be correlated betweenthe two solutions.
Experiments
Experiments were performed to determine the modalparameters of a 2.032 m diameter composite helicopter rotorblade at rotational speeds up to 900 RPM. The goal of theseexperiments was to explore the ability of the ITD method inconjunction with DIC measurements to extract the naturalfrequencies and mode shapes of a rotating blade.
Experimental Setup
The test article was a single blade of a 2.032 m diame-ter rotor that was developed by Cameron et al. [18] for areduced-scale counter-rotating coaxial helicopter rotor sys-tem. The rotor blade was mounted upside-down to a hub ata pitch angle of approximately 0 degrees to minimize rotorthrust and resultant bending of the rotor blade. A steel coun-terweight was mounted to the opposite side of the hub. Therotor blade has a chord length of 0.08 m and was spun by ahydraulic motor at rotational speeds up to 900 RPM, whichcorresponds to the test condition for the reduced-scale rotorsystem.
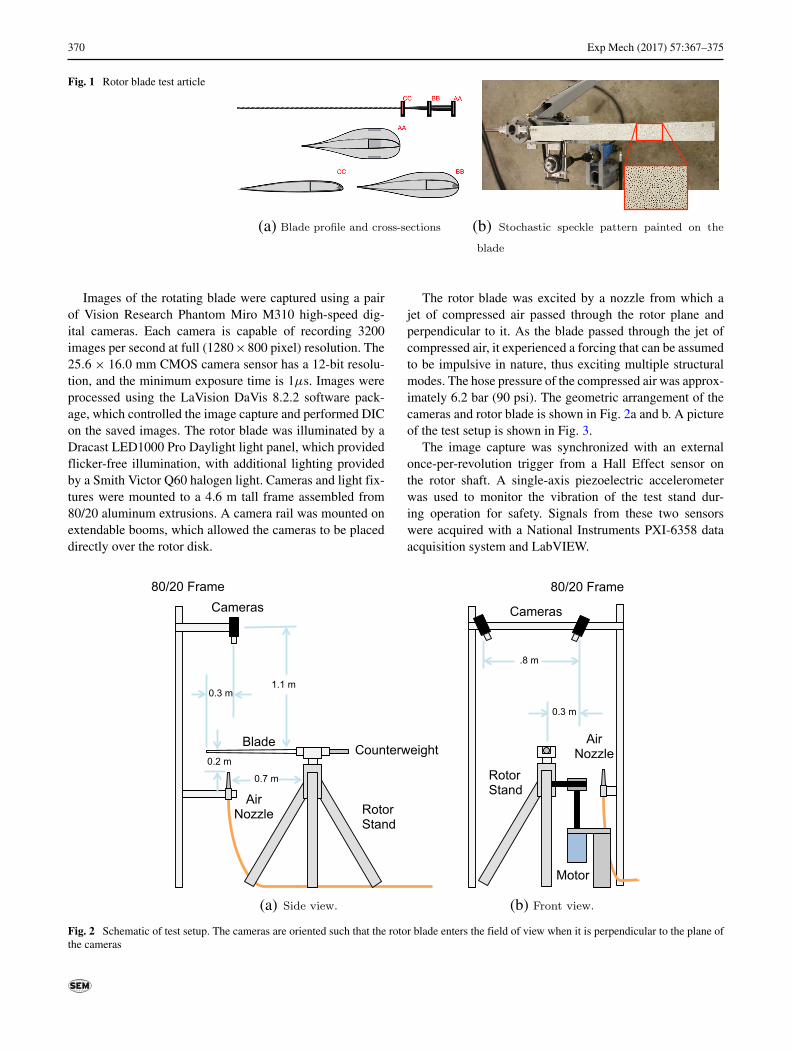
The composite rotor blade is composed of a foam corewrapped with several layers of carbon fiber composite, withan additional carbon fiber stiffening cuff near the root. Aschematic of the rotor blade along with cross-sections atseveral spanwise locations is shown in Fig. 1a. A stochasticpattern of black speckles on a white matte background wasapplied to the blade for the DIC measurements (Fig. 1b).
370 Exp Mech (2017) 57:367–375
Fig. 1 Rotor blade test article
(a) (b)
Images of the rotating blade were captured using a pairof Vision Research Phantom Miro M310 high-speed dig-ital cameras. Each camera is capable of recording 3200images per second at full (1280×800 pixel) resolution. The25.6 × 16.0 mm CMOS camera sensor has a 12-bit resolu-tion, and the minimum exposure time is 1μs. Images wereprocessed using the LaVision DaVis 8.2.2 software pack-age, which controlled the image capture and performed DICon the saved images. The rotor blade was illuminated by aDracast LED1000 Pro Daylight light panel, which providedflicker-free illumination, with additional lighting providedby a Smith Victor Q60 halogen light. Cameras and light fix-tures were mounted to a 4.6 m tall frame assembled from80/20 aluminum extrusions. A camera rail was mounted onextendable booms, which allowed the cameras to be placeddirectly over the rotor disk.
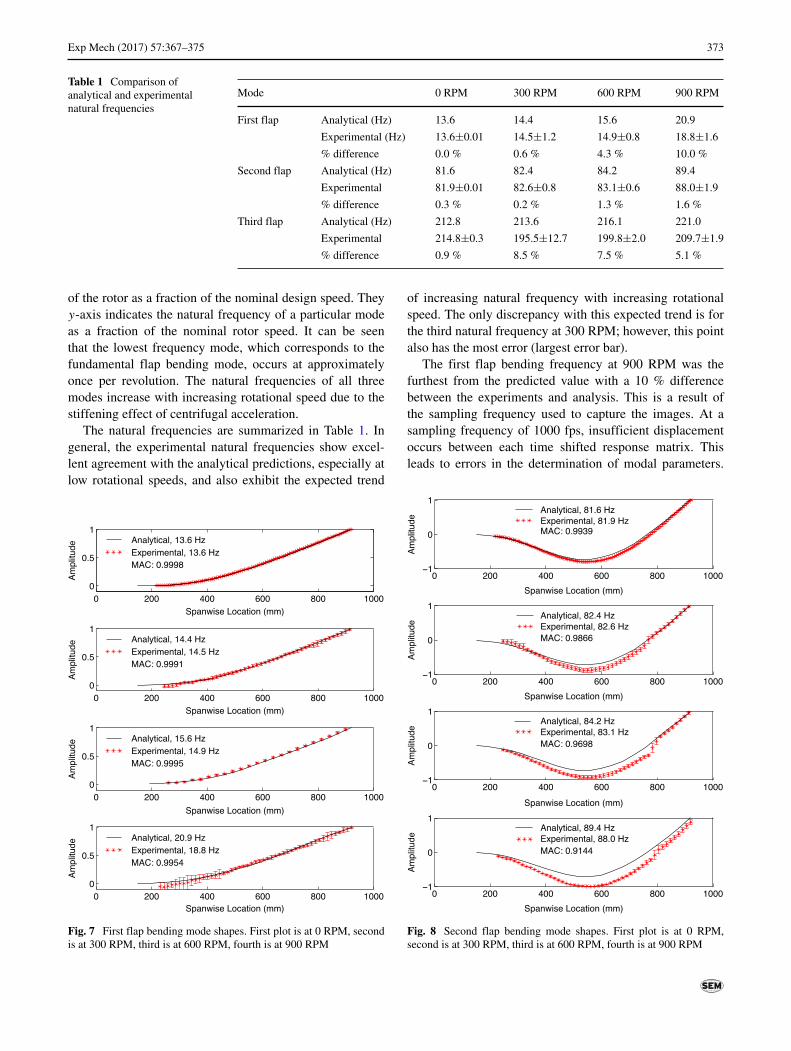
The rotor blade was excited by a nozzle from which ajet of compressed air passed through the rotor plane andperpendicular to it. As the blade passed through the jet ofcompressed air, it experienced a forcing that can be assumedto be impulsive in nature, thus exciting multiple structuralmodes. The hose pressure of the compressed air was approx-imately 6.2 bar (90 psi). The geometric arrangement of thecameras and rotor blade is shown in Fig. 2a and b. A pictureof the test setup is shown in Fig. 3.
The image capture was synchronized with an externalonce-per-revolution trigger from a Hall Effect sensor onthe rotor shaft. A single-axis piezoelectric accelerometerwas used to monitor the vibration of the test stand dur-ing operation for safety. Signals from these two sensorswere acquired with a National Instruments PXI-6358 dataacquisition system and LabVIEW.
(a) (b)
Fig. 2 Schematic of test setup. The cameras are oriented such that the rotor blade enters the field of view when it is perpendicular to the plane ofthe cameras

Exp Mech (2017) 57:367–375 371
Fig. 3 Picture of test setup
Settings and Test Procedure
The speckles painted on the rotor blade were approximately1 mm in diameter with 1 - 3 mm spacing between the speck-les. With a 35 mm camera lens at a distance of 1.1 m, thiscorresponded to a speckle diameter of 2 - 3 pixels.
Before each test, a calibration of the system was per-formed to determine the mapping function to convert imagecoordinates to physical coordinates. Three images of a Type1000 (0.8 m × 1 m) 2D calibration plate were averaged toproduce the calibration image. The resultant standard errorof fit was between 0.1 and 0.15 pixels.
First, a non-rotating test was performed by striking theblade at mid-span with an impulse hammer, and capturing1200 images of the blade as it vibrated. Then, rotating testswere performed at several rotational speeds up to 900 RPM.At each rotational speed, 100 blade passages were recordedwithout any external excitation, and 500 blade passageswere recorded with excitation provided by the air nozzle.
During each rotating test, images of the rotor blade werecaptured at fixed azimuthal positions for every revolution.The image capture was triggered once-per-revolution anda series of images were acquired starting when the rotorblade was approximately perpendicular to the plane con-taining the cameras. Thus, for a fixed rotational speed andimage acquisition rate, images of the rotor blade were cap-tured at the same azimuthal positions for every revolution.
The spacing of these azimuthal positions was determined bythe rotational speed and the image acquisition rate.
The number of images that could be captured per revo-lution was determined by the field of view of the cameras.The cameras were able to view an area on the rotor planeof approximately 50 × 75 cm, which corresponded to anazimuthal range of 30 degrees. The outer 70 cm of the bladewere contained in this field of view, including the outermostportion of the stiffening cuff.
At the maximum rotational speed of 900 RPM and at a1000 frames per second (fps) image capture rate, 5 imageswere captured during each revolution before the rotor bladewould move out of the field of view. A schematic of theimage capture sequence is shown in Fig. 4. The aperture ofthe camera lens was set to 5.6 f/D and the exposure time wasselected based on the maximum allowable blur at the tip ofthe blade, which was determined to be 1 mm (an exposuretime of 11 μs at 900 RPM).
Postprocessing and Error Estimation
For the non-rotating test, the deformation was calculatedrelative to an image of the blade before it was impacted.At each rotational speed, the deformation was calculated ateach azimuthal position, i.e., time instant, for both the unex-cited and excited blade passages by averaging over all therevolutions. Only flap bending deformations were analyzedin this study.
The subset size (interrogation window size) for perform-ing the DIC was set to 31 pixels. The step size was chosen tobe 12 pixels, which corresponds to a 61 % overlap betweenwindows. These settings produced a vector grid with a spa-tial resolution of 12 pixels, corresponding to a physicalspatial resolution of 7.2 mm.
The ITD method was used to extract the natural fre-quencies and mode shapes from deformation vectors alongspanwise strips (at constant chord locations of the rotor
Fig. 4 Schematic of image capture sequence. The camera field ofview is outlined in red

372 Exp Mech (2017) 57:367–375
blade) of the produced vector field. To generate a set ofmodal parameters that could be statistically analyzed, themodal parameters were extracted from multiple strips ofvectors at different chord locations. Additionally, the num-ber of locations along each strip, the starting azimuthalposition, and the ratio of time instants to measurement loca-tions were varied. Computational modes were separatedfrom structural modes by requiring modes from two differ-ent formulations to have an MSCC greater than 0.95 andfrequencies matching to within 5 %. The excitation of therotor blade by the jet of air inherently creates a once-per-revolution forcing that appears in the response as a modewith a frequency equal to the rotational frequency and adamping ratio equal to zero. The once-per-revolution fre-quency and zero damping ratio are used to eliminate thisforced mode from the results. Similarly, if any rotor har-monics appear in the response as integer multiples of therotational frequency, they are also eliminated. Note thatin most cases, the natural frequencies are not close to theoperating frequency, so the rotor harmonics are not excited.
The nominal accuracy of the DIC measurements forthese settings according to the LaVision user manual is3 μm. However, previous experiments performed in ourresearch group [14] determined an accuracy of 6 μm forin-plane deformation and 60 μm for out-of plane deforma-tion. Therefore, in the present study, a bias error of 60μm isused for the flap bending deformation. The precision erroris taken as the standard deviation over all measured rotorrevolutions (100 revolutions in the unexcited cases and 500revolutions in the excited cases). These two errors are com-bined (square root of the sum of the squares) to obtain thetotal experimental error, which is shown as error bars in theresults below. The error in the extracted modal frequencieswas determined based on a 95 % confidence interval of themean of the extracted frequencies over several numbers ofrotor revolutions.
Results and Discussion
The average deformation of the rotor blade at 600 RPM,with and without excitation from the compressed air jet,is shown in Fig. 5 along with associated uncertainty. Thebaseline deformation of the rotor blade (unexcited condi-tion) is due to a small amount of thrust produced by thecambered airfoil. The vibration resulting from the excita-tion is much smaller than the baseline bending deformation.For example, at the blade tip, the baseline deformation isapproximately 8 mm, and the jet of air blowing upwardsresults in an upward vibratory deformation of approxi-mately 2 mm. Some unusual deformation can be seen at aspanwise location around 550 mm; this is due to a region ofglare on the rotor blades.
Fig. 5 Excited and unexcited blade deformations at 600 RPM
From the measured vibratory deformation, the naturalfrequencies and mode shapes of the first three flap bend-ing modes of the blade were extracted using the ITDmethod. These were compared to an analytical model ofthe same rotor blade, developed by Schmaus and Chopra[19] using the University of Maryland Advanced RotorcraftCode (UMARC). The analytical solution was developed bymodeling the blade as a second-order, nonlinear, isotropicEuler-Bernoulli beam with flap, lead-lag, torsion, and axialmotion, and solving the equations of motion using the finiteelement method. The analysis was adjusted so that the non-rotating flap bending frequencies matched the non-rotatingfrequencies measured from the rap test; in this way, realisticboundary conditions were captured in the analysis.
A fan plot comparing the analytical (UMARC pre-dictions) and experimental (extracted from measurementsusing ITD method) natural frequencies as a function of rota-tional speed is shown in Fig. 6. The frequencies in the fanplot are normalized by 900 RPM, which is the design speedof the rotor. That is, the x-axis indicates the rotational speed
Fig. 6 Comparison of analytical and experimental flap bending natu-ral frequencies as a function of rotational speed
Exp Mech (2017) 57:367–375 373
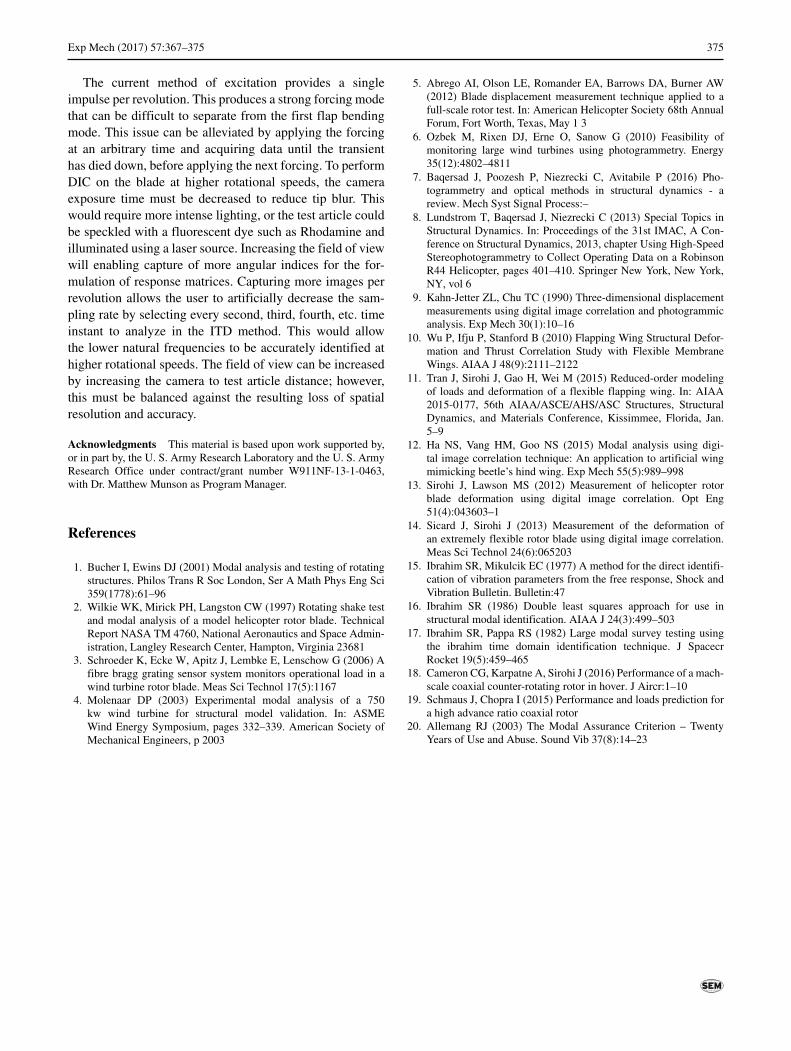
Table 1 Comparison ofanalytical and experimentalnatural frequencies
Mode 0 RPM 300 RPM 600 RPM 900 RPM
First flap Analytical (Hz) 13.6 14.4 15.6 20.9
Experimental (Hz) 13.6±0.01 14.5±1.2 14.9±0.8 18.8±1.6
% difference 0.0 % 0.6 % 4.3 % 10.0 %
Second flap Analytical (Hz) 81.6 82.4 84.2 89.4
Experimental 81.9±0.01 82.6±0.8 83.1±0.6 88.0±1.9
% difference 0.3 % 0.2 % 1.3 % 1.6 %
Third flap Analytical (Hz) 212.8 213.6 216.1 221.0
Experimental 214.8±0.3 195.5±12.7 199.8±2.0 209.7±1.9
% difference 0.9 % 8.5 % 7.5 % 5.1 %
of the rotor as a fraction of the nominal design speed. Theyy-axis indicates the natural frequency of a particular modeas a fraction of the nominal rotor speed. It can be seenthat the lowest frequency mode, which corresponds to thefundamental flap bending mode, occurs at approximatelyonce per revolution. The natural frequencies of all threemodes increase with increasing rotational speed due to thestiffening effect of centrifugal acceleration.
The natural frequencies are summarized in Table 1. Ingeneral, the experimental natural frequencies show excel-lent agreement with the analytical predictions, especially atlow rotational speeds, and also exhibit the expected trend
Fig. 7 First flap bending mode shapes. First plot is at 0 RPM, secondis at 300 RPM, third is at 600 RPM, fourth is at 900 RPM
of increasing natural frequency with increasing rotationalspeed. The only discrepancy with this expected trend is forthe third natural frequency at 300 RPM; however, this pointalso has the most error (largest error bar).
The first flap bending frequency at 900 RPM was thefurthest from the predicted value with a 10 % differencebetween the experiments and analysis. This is a result ofthe sampling frequency used to capture the images. At asampling frequency of 1000 fps, insufficient displacementoccurs between each time shifted response matrix. Thisleads to errors in the determination of modal parameters.
Fig. 8 Second flap bending mode shapes. First plot is at 0 RPM,second is at 300 RPM, third is at 600 RPM, fourth is at 900 RPM

374 Exp Mech (2017) 57:367–375
In general, the sampling frequency should be less than 100times the frequency of interest. However, if the samplingfrequency is too low, the blade will move out of the cam-era field of view before enough images can be captured toformulate the response matrices. Therefore, the images thatwere captured at 1000 fps were down-sampled as needed fordifferent test cases.
The jet of air was located near the tip of the rotor bladeand was therefore not as effective in exciting the third modeas the first two modes. As a result, the third mode was moredifficult to resolve accurately using the ITD analysis andthese results exhibit the most scatter.
The first flap bending mode shape at each rotationalspeed extracted from the experimental measurements (usingthe ITDmethod) is shown in Fig. 7, along with the analyticalprediction (from UMARC). There is excellent agreementbetween the experiment and the analysis at all rotationalspeeds. The experimental error increases with increasingrotational speed and is larger closer to the root of the blade,where deflections are smaller. The extracted mode shapesdo not have the same number of spanwise points, becausethe ITD method was run with different spatial resolutions(obtained by resampling the data) and the mode shape withthe highest MSCC was retained. The analytical and experi-mental mode shapes were quantitatively compared using the
Fig. 9 Third flap bending mode shapes. First plot is at 0 RPM, secondis at 300 RPM, third is at 600 RPM, fourth is at 900 RPM
Modal Assurance Criterion (MAC) [20], (which is the sameas the MSCC), and these values are also shown in each plot.It can be seen that the lowest MAC of 0.9954 occurs at thehighest rotational speed; note that any value of MAC greaterthan 0.9 is considered as a very good agreement between thecompared mode shapes.
The second flap bending mode shapes are shown inFig. 8. For every rotational speed, the second flap bend-ing mode was the best resolved and most repeatable modeshape. However, as the rotational speed increases, the dif-ference between the experiment and the analysis increases.The slight discontinuity in the mode shape at the node nearthe tip is an artifact of the spatial resolution and the methodof approximating real-valued mode shapes from complexmode shapes. The minimum MAC in the case of the secondmode is 0.9144 and occurs at the highest rotational speed.
The third flap bending mode shapes are shown in Fig. 9.There is good agreement between experiment and analy-sis even though the spanwise location of the jet of air didnot provide much excitation to the third bending mode. Thelowest MAC of 0.9423 occurs at the rotational speed of 600RPM.
Summary and Conclusions
The flap bending deformation of a rotating helicopter bladewas measured using DIC over a range of 0 RPM to 900RPM. The first three flap bending natural frequencies andmode shapes were extracted from these measurements usingthe ITD method, and were compared to an analytical modelof the system (finite element method). The analytical andexperimental natural frequencies showed excellent agree-ment, especially for the non-rotating test and the second flapbending mode for the rotating test. The non-rotating fre-quencies matched to within 0.9 %, and the rotating secondmode natural frequencies matched to within 1.6 %. The firstflap bending mode at 900 RPM had the largest deviation(10%) between the analytical and experimental frequen-cies. The uncertainty of the natural frequencies ranged from0.1 % for the third mode at 0 RPM to 8.5 % for the firstmode at 900 RPM. The average uncertainty of the modeshapes ranged from 0.09 % for the first mode at 0 RPM to5.6 % for the third mode at 600 RPM.
This study describes the first integration of DIC with ITDmethod for modal analysis of a rotating helicopter blade.The results suggest that this operational modal analysisprocedure is an effective method to experimentally deter-mine the modal parameters of helicopter rotor blades inthe operating condition. While the results from this studyare promising, there are several aspects of the experimentalprocedure that may be improved to increase the accuracy,repeatability, and functionality of the results.
Exp Mech (2017) 57:367–375 375
The current method of excitation provides a singleimpulse per revolution. This produces a strong forcing modethat can be difficult to separate from the first flap bendingmode. This issue can be alleviated by applying the forcingat an arbitrary time and acquiring data until the transienthas died down, before applying the next forcing. To performDIC on the blade at higher rotational speeds, the cameraexposure time must be decreased to reduce tip blur. Thiswould require more intense lighting, or the test article couldbe speckled with a fluorescent dye such as Rhodamine andilluminated using a laser source. Increasing the field of viewwill enabling capture of more angular indices for the for-mulation of response matrices. Capturing more images perrevolution allows the user to artificially decrease the sam-pling rate by selecting every second, third, fourth, etc. timeinstant to analyze in the ITD method. This would allowthe lower natural frequencies to be accurately identified athigher rotational speeds. The field of view can be increasedby increasing the camera to test article distance; however,this must be balanced against the resulting loss of spatialresolution and accuracy.
Acknowledgments This material is based upon work supported by,or in part by, the U. S. Army Research Laboratory and the U. S. ArmyResearch Office under contract/grant number W911NF-13-1-0463,with Dr. Matthew Munson as Program Manager.
References
1. Bucher I, Ewins DJ (2001) Modal analysis and testing of rotatingstructures. Philos Trans R Soc London, Ser A Math Phys Eng Sci359(1778):61–96
2. Wilkie WK, Mirick PH, Langston CW (1997) Rotating shake testand modal analysis of a model helicopter rotor blade. TechnicalReport NASA TM 4760, National Aeronautics and Space Admin-istration, Langley Research Center, Hampton, Virginia 23681
3. Schroeder K, Ecke W, Apitz J, Lembke E, Lenschow G (2006) Afibre bragg grating sensor system monitors operational load in awind turbine rotor blade. Meas Sci Technol 17(5):1167
4. Molenaar DP (2003) Experimental modal analysis of a 750kw wind turbine for structural model validation. In: ASMEWind Energy Symposium, pages 332–339. American Society ofMechanical Engineers, p 2003
5. Abrego AI, Olson LE, Romander EA, Barrows DA, Burner AW(2012) Blade displacement measurement technique applied to afull-scale rotor test. In: American Helicopter Society 68th AnnualForum, Fort Worth, Texas, May 1 3
6. Ozbek M, Rixen DJ, Erne O, Sanow G (2010) Feasibility ofmonitoring large wind turbines using photogrammetry. Energy35(12):4802–4811
7. Baqersad J, Poozesh P, Niezrecki C, Avitabile P (2016) Pho-togrammetry and optical methods in structural dynamics - areview. Mech Syst Signal Process:–
8. Lundstrom T, Baqersad J, Niezrecki C (2013) Special Topics inStructural Dynamics. In: Proceedings of the 31st IMAC, A Con-ference on Structural Dynamics, 2013, chapter Using High-SpeedStereophotogrammetry to Collect Operating Data on a RobinsonR44 Helicopter, pages 401–410. Springer New York, New York,NY, vol 6
9. Kahn-Jetter ZL, Chu TC (1990) Three-dimensional displacementmeasurements using digital image correlation and photogrammicanalysis. Exp Mech 30(1):10–16
10. Wu P, Ifju P, Stanford B (2010) Flapping Wing Structural Defor-mation and Thrust Correlation Study with Flexible MembraneWings. AIAA J 48(9):2111–2122
11. Tran J, Sirohi J, Gao H, Wei M (2015) Reduced-order modelingof loads and deformation of a flexible flapping wing. In: AIAA2015-0177, 56th AIAA/ASCE/AHS/ASC Structures, StructuralDynamics, and Materials Conference, Kissimmee, Florida, Jan.5–9
12. Ha NS, Vang HM, Goo NS (2015) Modal analysis using digi-tal image correlation technique: An application to artificial wingmimicking beetle’s hind wing. Exp Mech 55(5):989–998
13. Sirohi J, Lawson MS (2012) Measurement of helicopter rotorblade deformation using digital image correlation. Opt Eng51(4):043603–1
14. Sicard J, Sirohi J (2013) Measurement of the deformation ofan extremely flexible rotor blade using digital image correlation.Meas Sci Technol 24(6):065203
15. Ibrahim SR, Mikulcik EC (1977) A method for the direct identifi-cation of vibration parameters from the free response, Shock andVibration Bulletin. Bulletin:47
16. Ibrahim SR (1986) Double least squares approach for use instructural modal identification. AIAA J 24(3):499–503
17. Ibrahim SR, Pappa RS (1982) Large modal survey testing usingthe ibrahim time domain identification technique. J SpacecrRocket 19(5):459–465
18. Cameron CG, Karpatne A, Sirohi J (2016) Performance of a mach-scale coaxial counter-rotating rotor in hover. J Aircr:1–10
19. Schmaus J, Chopra I (2015) Performance and loads prediction fora high advance ratio coaxial rotor
20. Allemang RJ (2003) The Modal Assurance Criterion – TwentyYears of Use and Abuse. Sound Vib 37(8):14–23