operation jangle fallout dose rate build up graphs and improvised foxhole shelter shielding data
DESCRIPTION
Declassified 1951 Nevada surface burst fallout data. Operation Jangle fallout dose rate build up graphs, and improvised foxhole shelter shielding data.TRANSCRIPT

—S -V — — __~~ ~~~~
•5~~~~~
S ~~~~~~~~~~ _.,._••_
~~ -F - - .. -,. . - - ———~c~- , . -— — _______________________ - - ~~~~
— - -V. ~~~~~~~~- — - — — - .. - V
_ _ _ _ —- _ _ _
__ _ _
T1
e d ~~~~~nt oona 1Bts of 335 ;1ua4 page. (counting .11 pre1Fs4i~&r7
numbered bisnici)% pegea in all report. nd all ~m—
- I —
Copy Sot 243 copies, Series B
OPERATION JANGLE
- - GVA~~1A RADIATION MEASUREMENTS
3~Project 2.la Gamma Radiation as a Function of Time and Distano(-~T-329)
Project 2.lb Gamma Radiation as a Function of Time with Droppable~~~~~f~~~Telemeters (YT—392)
~~Proj ect 2.lc—l Aerial Survey of Distant Contaminated Terrain (v?r_3~J~~f/1)( Project 2.lc—2 Aerial Survey of Local Contaminated Terrain (Wr_3~i~~f
~~~~~~Project 2.ld Monitor Survey of Ground Contamination (WT—38lT4~~~ft ~&~b)(Proj ect 2.3—1 Total Gamma Radiation Dosage (WT ..331)~ ~~~~~~~~~ ~
‘- ,,
Project 2.3—2 Foxhole Shielding of Gamma Radiation (~Vr—39~~~~~1.. .t... V
~~~~~~~~~~
UNCLASSIflEDI
-
-_ _ _ _
-.‘ ~~~~~~~ SV- ~~~~~~~~~~~~~~ ~~~~~~~ ~~~~~~~~~~~~~~~~~~~~~~~~ ~~~~~~ ~ ~~~~~~~ ~~~~~~~~~~~~~~~ IL 4 ‘~~ ~~~~~~~~ ~~~~

-- --.5. 5 .-n - -—5 —.—— -V - —-V.-’ -~~~~~~~~~~ - — V - - --
— - - .
~ -V —V. —~~~~~~~~
-- -- - ~~~~T-~~~~--- ~~~~~~~~ _ _ _ _
Ic ’ I
_ _
-‘ ~~ ~-
~
.
UNCLASSIFIEDOPERATION JANGLE
PRO1JWr 2,la
GAMMA RADIAT ION AS A FUNCT ION
OF
T D~ AND DI~~ANCE
by
L. Coatreil
Radiation Physics Laboratory V
April l, 1952
National Bureau of Standards
Washington 25, D. C UNCLASSIHEDH ,
_ _ V

riT~~_~I ~~~~~~ ~
—
UNCLASSIH~~~;.
PRO3~~~CT 2 l e______
oo .. I~CCATE F~~D CET~~1V5 IN?. IICCAIE POP-LP D(T~~~~ UN?
~~ TA ~~ . PC~~ ATES 1-I-S MONI1~~ PONT
~*ISTA I3 “~ ~ Is 4000• 00
0000
IO’ _ _ _ _ _ r/Iw
_ _ _ _ _ _ _ _ _ _ _ _ _ _ _ _ _ _ _ _
\STA ~
~~~~~~~~~~
—— — —
= ~~~~~~~~~~
k~ ~~~~~~
-
~~~~~~~~ 7
-
•
_ _ _ _ _ _ _ _ _ _ _ _ _ _ _ _ _ _ _ _ _
.
-
~/ ,,‘
_ \ \ ,
_ _ _ _ _ _ _ _ _ _ >~~~s: r\ \
_‘
\ ~~~~xl
- - ~~~
~~ \ \ x.
0.0 1!
o•ooI I I I I iii ~ I I li i i i i i ii . i i ii ii . i i i liii I I~ I Ii i i i i I iii,OJ IC 10 00 000’ 10’ 0’ 0’• INE (SEC)
Fig 6.1 Sur face Bur st Dose Rat. and’Total Do.. vs T~~~(Dose reo.iv.& Lu first 0.1 second net included.See p.m 6.3. Station locations on Pig l.1.j
~~52

r~~ T ~T~~~i_- -
~~~~~~~~~
-~~ ~
-
—
~~~~ UNCLAS~~~~- —
PROJE~~ 2.la
10’
-~~~~~~~~~~~~~~~~~
~~~~~~~~~ \ ~ D~ ATES T-I -A MONITOR POET
- -~~~-. 1 -• I ,.,- 3 2000
STA 2I ~24 1000
000 ~~~~~- - - _ _ _ - _ _ _ - — - -
~~~~~~~~ —
~~~- -
• • STA 24 r/lw
— — 3
00 ‘
~~
‘ -
~ —4———
~~~~~~~~
——~~~~~~~~~~~~~~~
r/hr -~ -w Z - I —— l————— — ~- — — — — — 5
4
~-: IO — — - - ,-~~~- ~~~ _ - - - - —t-- - -- — ~~~
—
°~/c~~~ 4~/ 4)7 -~~~ -
- -/ - — —— - -— 2
10 —— - - - *
— __ .L-_ 24
0. -~
- — —-~~~ - - ‘ -
X 3
_ _
24 21
00001 1 I I 1111 ’ 1 I I I t I l f l I I I I i 1 I I I I I I ~ I I I I IIII~ I I I I I I Il l,
OJ 1.0 10 100 1000 iO~ 0’ 0’ •TIII( (SEC)
Fig 6.3 Surface Burst, Dose Rate and Total Dose vs Time(Dose received in first 0,1 second not included,See par s 6 3 Station locatio ns on Fig 1.1. )
— 5 4 —
UNCL.ASSI~~~,!~ ..- _
~~__ - ~~~~‘~~t ~~~ ~~~~~~~~~~~~~~~~~~~~~~~~~ ~~~~~~~~~~~~~~~~~~ — ~~~~~~~~~~ ~~~~~~ ,~~~~~~~ IIJIII ~

-~~~~~~~ -—
•tf’- —
~~ ~~~~
. ‘—7,,— ——-- - -— .- -“- •--_-- •-_ -._—- -
UNCLA~~~~1,
PROJECT 2.].aIO~
_______________________ __________
.
SO : —________ ____________ ____________ ____________ - - -
- STA 101 ~~• ~~~~~~ FIXED DETECTOR UNIT
:~~~~~—
~ ,,~, ~~~~~ fOCATE POP-UP DETECTOR I.NT
- x INDICATES T-I — B MONITOR POINT
$ 10’ Sm 107 00TAIICE~~~00
v/hr 101 2000- 107 3000
112 4000-
STA 11 3 Ill 6000—.-_.
~~~~~~~~ ‘N~ “I~
25 6000S O .
~~~~~~~~~~~~ I I 9
1.0 .
-
_ _
~~~~~~~~~~~~~~~~~~~~~~
/ j \ lot
/- ?-“ \_ 4~’ \. N’°~
°’
0.1 . \ ~L_ ~~~~~~~~~~~~~~~~~~~~
,i~• / \~~~~~~• \ \~~/ _ -— ‘ ~~~~ \ \~ S lOT—
K ISS- — - ~~. I 119
• 0.0$ --- - - ——- - - - - - - —~~~~-~~
-- — —-——— - —--—- — --- ‘ $25
- ! ~~~~~~xu,
000$ i ’ I II II Ill I I I] lIP I I i I II~ I I I I III I III 1 1 1 1 1 1 I I I l i i i II I I 1 1 1 1o~
to 500 5000 50’ 0’ $0’TIME (SEC)
Fig 6,7 Und.rp’ound Bur st, Dose Rate and Total Dose vs Time(Dose received in first 0,1 second not included.
•
S~• pars 6.3. Station locations on Fig 1.2.)
UNCLASSIFI ED _.~~~~~~~. - — ~~~~~~~~~~~~~~~~~~~~~~~~~~~~~~~~~~~~~~~~~~~~~~~~~~~~~~~~~~~~~~~~~~~~~~~ -
. -~~~~~ _____
- -~~

- — — --.w - — — —
~~~—--
~~-
~---- -— ~~~~~~~~~~~
._
,r • - -
~~~
--
~~~~—
- -
- - - - — --
~~~~~~~~~~~ - _
UNCUtSSW~~:.
FROJECT 2~la$07
-
-I
50’: s-I-A I02~~~~~~~ e ,a ,~ .. INDICATE FIXED DETECTOR UNIT
0 - v /hr INDICATE POP-UP DETECTOR UNIT-
~~~~~~~~ * IM)IGATES T- I — B MONITOR POINT
STA 108— -
~ r STAT10~ 167)• - - — lOS 2000
- lOS 3000STA 11 4 114 4000
• I50 3000k 23 I10
L ~~~~~~~~~ ‘~~~~\~
—
-~
\ ~~~~~~~~~~~~~~~~~~~~ —— — — — 102- A A ~~~~~~
— --5000 ~~~~~~~~~~~~~ 120 — -~p1 ’~~ --- ~~~
— _—~~~
--— ~20
~L~~: T~~~~~~~~~-
A / /~~~~~~~~~~~11__ _ I23
• i~~~ 4~”~~ _ _ _ _ _ _ _ _ _ _ _ _ _
_ _ _ _ _ _ _ _ _ _ _ _ _ _ _ _ _ _
-
-
•
- . STA~~~9 /~~~~~~~~~~~~~_
14/•
- O.!
~~~~~7~~~~~~~~~~~~~~~~~~~~~~~~~~K
~~~~~~~~//
i
,
_ _ _0.05 ~~~~~~~~~~~~~~~~~ ~~~~~~~~~~ ,
~ I•
- /
/ ~~~~~i__ !— ~ / 2 2
~
0001 I I I l i l t ’ I I I lI1I( I I I I ~~ I I I I Ill I I I 1 1 1 1 1 1 III ~ I I I 11111o.s to to $00 000 $0’ 0’ 10’
TIME (SEC)
Fig 6.8 Und.r~~bound Burst, Dose Rate and Total Do.. vs Time(Dose received in first 0.1 second not included.Se. pars 6.3. Station locations on Fig 1.2.)
a
-
---~~~~~
-~~~~~~~~~
• (JNCLRSSIFWF,- - -- - ~~~~~~~~~~~~~~~~~
—- - - — - -- --——-- — — — - - - -~~~~
- - -- - ~~~~~~~~~~~~~
-,~~~ - ~~~~~~~~~~~~~~~~~~~~~~~~~ t—
~~~~~~~_*_ - —•- —

~~~1~~~~~~1J~~~T~~~ ~~~ i~~~~~~~i~~ -~~~~~~~T
iiUNCLA1~~
-
- ~~OJ~CT 24].aI - I
__________________ ___________________ ___________________ ___________________ ___________________ ___________________ ______________1000
,-SURFACE DOWNWIND
~-• 10
-
~- SURFACE CROSSWIND
UNDERGROWD D~#,~NWI~D
1.0 1IDERGR tf4D CRQ SWtJD ~~ ______ ______ _____- -
•
-
• oj -
NH
ooi I I I I I I I2000 3000 4000 5000 6000 7000 8000
DISTANCE (Fl)
Fig 6,13 Surface and Underground Burst Total Dose at 10 Seconds(Dos. received in first 0.1 second not included,)
UNCLASSIF~DJ ___________
— - - •

i,.
-
~~~~~~ -.- -r-w - - - -
— •~_ _ • _s — _ __~ — —- - —•- — — . -
H UN .~BED
PROJECT 2•la
Li 24000
22000 X-’-$S4 /_____ ______ ______
I _____ / )
~~~~ I3O _____ _____ ______20000 / /
~~ _ _18000 —--— —h—
I / X~ 12O /I f%~~~~~/ X’~ I5I16000 -x ~-715
— XI—
I x ~.30/14000 /
,i7 _ _ _ _ _ _
12000 ,— — ____ ____ ____ ____ ____
— Iv 450~I— I _ _ _ _ _10000 I ~L5d~ _I_7~ 0 NBS DATA
z i I x/ I • BASED ON NRDL FILM DA1A8000 ____
I —
~~~~~~~~~~~~ ~~~~ x BASED ON_MONITOR_DATA
C I I i i ~—Teo x6000 _ i _ I (
~I—360I t
4000 — — ) I ~~~~~~~~~~~~~~ N~~~~~~~
____ ____
/‘.)‘I3 ? I ____ ____ ____ ____ ____2000 1
0
_ _ _ _2000
~\ ~~~~~~~~~~~~~~~~~~~~~~~~~
• ___ ___ ___
N., p—”
4000 ~— —~~~~~~~~
a eooo _______ SO UPS
J 8000 6000 4000 2000 0 2000 4000 6000 8000 10000DISTANCE (FT)
Fig 6.15 Surface Burst , Iso-Dose Conto urs at 1 Hour(Dose received in first 0.1 second not included ,)
jJ-
- --4 -
•~~- -
~~- - -~
--—-—— --~~
-
—— ~~~~~~~~~~~~~ . I I~~I~ ~~~~ ~~~~~~~~~~~~~~~ ~~~ --~~~~~-13.A

• PROJECT 2 ,la24000
22000 x -22
_ _ _ _ _ _ / _ _
/
_ _
- 220X / / _ _ _ _ _ _20000 j ¼ / 1 /
_ _ _ _ _ _ _ _
2°! ‘-... 2 4 0X/ /
_ _ _ _8000 i
—I-— N —~~~~
I X’ —200I —ii I’..-420 X—250 / /
_____ ______ _____16000 4X~~~2~~~ X— r /1 2 2 /
14000 1 ! -~~
_ _ _ _ _ _ ~~!t \ / / _ _ _ _ _ _ _ _(2000 ~—f x — -/-/-
~~ -(E
_ _ _ _ _ _ _ _ _ _ _ _ _ _ _ _ _ _ _ _I000C / )~ ~ NBS DATAI I i( U BASED ON NRDL FILM DATA
00.’ ( 1 -N~ °1 ____
x BASED ON_MON ITOR _DATA!~� 8000
( f ~~_29~ 2I ‘8~0XI
6000 j. i~I~1- ~~~~~~~~~
____ ____ ____
r ,.-,II0I s. .$~O02000 1 3~i uoo
L~70
0
_ _ _ _
• 1 _
--
_ _ _
_______ _______ _______ _______ _______ _______ _______ SO loll
• 8000 6000 4000 2000 0 2000 4000 6000 8000 (0000DIS1ANCE(FT)
Fig 6,16 Surface Burst , Iso-Dose Contours at 10 Hour .(Do.. received in first 0,1 second not included,)
I
- -~~~~ I ~~~~ — -.
~~~~~~~~~~~~~

-- - -r- ,- - -- - — —-- -r -r
F—- — -
— - —~~~~~~~~~~~~~~~~~~~~~~~ -- -- - — — - - • —
UNCUSSIFWD — -
PROJECT 2 11a- 24000 —
~~~ 7 7 j /I I i
_ _ _ _ _ _ _ _22000 1
—/-- /3/x/
x- ..-/s _ _ _ _ _ _
/ / _ _ _ _ _ _ _ _ _
- i 20000 ÷_ _ _ _ 1 _ _ _ _ _ _ _ _ _I 1 1 7 ~~2 0 7 N
.~i 1~’r _ _
‘
,~~~~~_ _ _ _ _ _(8000
~! ~/~r ~ . - -
g X ’ ~l2 ~ -
16000 -1---- 1-X”-% ~~~~~
-
•
Ix — Ia ~~ ‘ ‘ ~z~ 6
- -
~ 14000 L 2,j.x t~’~!~~~X —/25 I_ _ _ _ _ _ _
‘. 1- I / I _ _ _ _ _ _ _ _ _ _ _ _(2000 x—s o
- (0000 i[t1 I__ /
_ _ —
a
•
_ _ _ _ _ _ I ( ~~~~ __i //f
_ _ _ _ _ _ _ _8000 i—i- 5~bsC i i -eoxl /-
6000 —
~~ —~~~~~ —
0 NBS DATA
~ i~ I I X BASED ON MONITOR SURVEY
- I DATh ____ ____ ____
-
2000
__ ___ _ _
____ ____
\%,,~~~~ ~1 ~ t r/hr
• 4000
I ~~~~~~~~ — _______ a.,..
- I 8000 6000 4000 2000 0 2000 4000 6000 8000 (00001 DISTANC E(FT)
- Fig 6.17 Surface Burst, Iso—Rate Contours at 3. Hour
- UNCLASSiFIED -
• -
— —
I~~
__iii
-
- I~i~~
_ _ .. ~~~~~~ ~~~~~~~~~~~~~~

—~— — -~~~~~~~~~~~
—
-
~~~~~~~~ i~~
UNCLASSIFIED ~~ -
)
PROJEC’2 2,].a
20000
18000 N 0 NBS DATAI U BASED ON NRDL FILM DATA
16000 ____ X BASED ON_MON ITOR _DATA ____
14000 -~~~~~~~
p/j_~ / ~-~o /$2000 ——- ( I 7 Q _~~~~_ 4
~~~~~~~~~~ X— ’ 50”s~
10000 I —~~~~~~~ ) /
—. I / *-.lO0 /
_ _ _ _ _ _ _ _
/ ,I 2 ~~ /
//
_ _ _ _ _ _8000 / j~ ‘~Io— ••
\ / ,
/ / 1 i~ / /r._ / ~~~/
I (6000 - 2/-—— 0 720 — ____
04 /
I 490X ~~~~~~ -60 /
/ w150 it ~’ / X /
4000 ( x ~ / / f_—f-/8°~
/ ____ —— ____
8 / I\
70 (x ~~
4000
6000 - ____ ____ ____ ____ ____ ____ ____
8000 6000 4000 2000 0 2000 4000 6000 8000 10000DISTANCE (Fl )
Fig 6.19 Underground Burst , Iso-Dose Contours at 1 Hour(Dose received in first 0,1 second not included,)
I
aUNCLA SSIFI ED- - - - • -
____________________________ ~ ~~ - -- —-~~ - •-. ~~-•~~~ -~~~~
- - ~~~~~~~~~~~~~~~~~~~~~~~~~~~~~~~~~~~ ~~~~~~~ •- ----- -~~~
- -~~
-- -- ~~
---

-
-
UNCLASSIFIED-- -
PROJECT 25]a22000 -___
20000 - ___ ____ _ _ _ _ _ _ _ _ _ _ _ _ _ _ _ _ ____
N 0 NBS DATAU BASED ON NRDL FILM DATA
____ ____ ____ ____ x BASED ON_MONITOR_DATA
____
H - - I_____ _____ _____ _____
4.$6000-
‘
_ _ _ _ _ _ 1 _ _ _ _ _ _ _ _ _ _ _ _14000 / ~~32
—
~~~~~~~~ /X— ’--4512000 ~~~~~~~~~~~~ I
I ~~~ X.~-22O~~~’ ‘.-23 /
I,
~ —.23O$0000 /~~~~-çL
- I ii —‘120 X -I— ‘1 ‘-~250 1 080LI.
~ 1 •-~~~~~~~~~
—‘P.8000 I - -.-sso- j -
a / /4 0 X 0
_ _ _ _ _ _ 1 ‘ ~~~~~~~~~ 8 0 / _ _ _ _0 6000 -
~~~~~ -~~~~~~29C 1C r ‘—‘580 ( z~o /
4000 ____
--iso x (~ ,, —
/ -
::_
-~~~~~~~~~~~~~~~~~~~~~~~~~~~~
T
~~~~~~~~~~~~~~~~~~
I)
4000 ~~~~~---
~ - _ _ _ _ _ _
6000 ----~~-- - . - - -- _ _ _ __ _
______ _____ ____________________ _____________ ______ ______ _____ UDlOlI
• 8000 6000 4000 2000 0 2000 4000 6000 8000 $0000DISTANCE(FT)
Fig 6,20 Underground Burst , Iso-Dose Contours at 10 Hours(Dose received in first 0,1 second not included,)
- 71-
IJ NI~nS~IàD - i -.
- ~ ~~~~~~~~~~~~~~~~~~~~~~~~~~~~~~~~~~~~~~~~~~~~~~~~~~~~~~~~~ ~~~~~~~~~~~~~~~~~~~~~ ~~~~~~~~~~~~ I~-

i~~1~ _ _ _
H ~~~~~~. :~~~~~~~~~~~~~
‘ ~~~~
APPJRDIX DHWIND DA.~~
To aid. in analysis of the contou rs pr.s.nt.d. in the tixt, the fe].-• levi~g wind velocity bfoz~~ tioa is given.
TLBI1 D.l
Conditions at the Tine of the Surface ~~rst
I
Bsight (ft) Dirsction (Dsgr .es) %~s d (aph)
o 190 2.3- 6000 170 15.0
10000 200 36.8• 14000 210 46.0
TA3LI D.2
Conditions at the Ties of the Underp .nsd• 3urs t
fleight (ft) Dirsotisa (Dsgz ..s) Spesd. (aph)
1 0 210 4.6• 6000 190 5.8
•1 10000 230 24.214000 250 28.8
• ~~~.•
- I — 85— -
~~~~~~ ~~~~~~~~~~~~~~ ~~~~~~~~~~~~~~~~~~~~~
_ _ _
UNCLASSIFWD _ _ _ _ _ _ _ _ _ _ - -
. • . . •• . —~~ ••—-——---~ •-- .
~~~~~~ -~~~~~-.-~~--— ~~~~~~~~~~~ .—~— —- —
— ~~~~ ~~~~~~~~~~~~~~~~~~~ ~~~~~~~~~~~~~~~~~~~~~~ ~~~~~~ A

• ~~ . • - - -~~~~ • ,~ .~~~~~ ~~~~~~~~~~~~~~~ - —
:~~~~~~~~~
UNCLASSIFIED IP fr4
APPJNDII I
A~~~ A~~ ~~~~~~ CONTOURS
• ‘The areas included within iso- dose aM iso-rat, line. on the•
- van .,.. eentours are shove in th. tables below.
TA.BLJ L1
Surface 3unst, X is—Dose Contour s at 10 (m utes
ITam e of iso—dose line (roentgen. ) Includ ed area (si. aLli s)
400 greater than 0.6100 ~~~3.10 ‘4 .3 I
• ‘~~I2 L2
Surface ~~rst , Iso-Dos. Contours at 1 Boron
Talro of iso—do se line (roentgen.) Included area (ii. ailes)
10,000 0.101,000 0.38
400 1.0- I 100 greater than 3.
1 10 ‘ • 6 .
llNCL~$SIflED 86
~~~~~~~
-—•-••••-‘•
~~
‘ _
u
T ~IIi ~~ —~ -- -~ ••••~~~_ - -
~~~ -~~ ~k/~~ ~~~~~~~~~~ ••-n.••~:.~i
~~~~~~~~~~~~~~~~~~~~~~~~ ~~~~~~~ ~~~~~~~~~~~~~~~ ~~~~~~~~~~~~~~~~~~~~

T~~~TT_ ~~~~~~~~~~~~ ~~~~~ TTi T~ TIIT~~
~~:_I~ UNCUS$IFULP11.O3ECT 2.la • . 4•.. -
~
TABLN L30
Surface 3anst , Iso—Dose Contours at 10 Hours
Value of iso-dose line (roentgens) Included area (sq. sties)
10,000 0.101,000 0.43
400 1.2100 greater than 3.10 N “ 6 .
TA3I~ L4
Surface Burst , Iso—Bate Contours at 1 Hour
I
Talus of iso-rat, line (roentgens/br.) Included, area (sq. silos)
35 greate r than 110 N 1 3
5 I 1 4
-• TABLN L5
UMergrouM Burst , Iso-Dose Conto~~s at 10 Xinu.tes
Value of iso-dose line (roentgena) Included ares (sq. silo.)
It 400 0.70100 1.910 4.21 greater than 6.
UKCthSSIFIEDiiui~~~~~~~~~~~~~~~~~~~~~
.-• —• ..~ ~1 ~~~~~~~~~~~~~~~~~~~~~~~~~~~~~~~~~~~~~~~~~~~~~~~~~~~~ ~~~~~~~~~~~~~~~~~~~~~~~ ~~~~~~~~~ —••

i~~~Iii —_TiT~~ _ _ _
~~i -
~TTI~~ ‘-~‘~r~ T~~ __
~1
• - ---—
I
U~CthSSIF1ED. ’~~~1!~OJ2CT 2 ,],a
TABLN 1.6
• llMergrouad. Burst , Iso— Dos. Conto ur s at 1 Hour
Value of iso-dose line (roentgen.) Included area ( sq,. niles)
1,000 0.47• 400 1.1100 2.7
- : 10 greater than 6.
Underground Burst , I so-Dose Contours at 10 Hours
Value of iso—doss line (roentgens) Included area ( q ~. sties)
1,000 0.70400 1.4100 3.010 greater than 8.
TABLI 1.8
Uthergrousi Burst, Iso-Bate Contour s at 1 Hour
Value of iso—toss line (roentgens/~~) Included area (sq. ails.)
100 1.710 greater than 5.1 I I 7,0.1 I 8.
UI’1C1ASS!F~D
:~~~i 2 T~~ I1I~ -
~~~~~~~~~~~ T ~~~ -
L - —
~~~~~~
I
OPERATION JANGlE
PROJECT 2.1o4
AERIAL SURV~~ OF ICCAL CONTAIIIN&PED TEP~ATW
by
JOHN H. TEI~~CM., t~ N
and
~~~ D. ROBER1~ON12 (3g)., 1~ N
of
BU~~LU OF AERON&UTI~~DEPA~~WNT OF T~~ NAVY
OF T~~ NAVYB~neau of AeronauticsWa.bimgt
~i 25, D. C.
MPA~~~~N~ OF T~~ A~~ POR~~Air s.ear ~ i and Dewelo~~~nt C’~~~’~’Wright Air Devs1o~~~ut Canter
• Wright.. att*rac~ Air Icro. Be..
~~ - NCLASSIFIED ___
_ _ _ — ~~~~~~~~~~~ —--- -i- £ -~~~~~~~~~ , ~~~~~~~~~~~~~
-~~~
- 1_~ ~~~~~~~~~~~~~~

‘• •_ •~~fl ,~~~~ —5’ -r
- - - —
fl —5- — - - -
~1UNCLASSIFIEDPROJECT 2,lc-.2
__
-
_ ____ _
• 1 it
- \ ioo~~~- — ~ q_ _ _
it 4ocR/~ _ _ _ _ _ _ _ _ _ _ _ _ _ _ _ _ _ _
_ _
I _ _ _ _ _ _ _F / 4O~~&
-
• _ __ _ _ _ _ _I I —
~~~~~~ ~i’~i /
_ _ _
~~~~~~~~~~~~~~~~~~~~~~~~~~~~~~~~~~~~~~~~ 2 5- •
j DZSTAICE FROM ZEJ ~) POINT (i~~ T1s)
- Fi~. 1,3 Ga~.~r a tc~:~~ty r~ c~r ~Iap R t i i+3 Hour Me~m~r ic1 by A~/i~IR_~1Sur fac c Sho t
S— 3 6 -
_~ ~~~~~~ z a- ~~~~~~~~~~~~~ . ss_.~~J~~ s~~~~~

—5 - - •~
-~~~~~~~~~r ~~~~~~~~~~~ - ~~~~~~~~~~~~~ - - - -
— — - -
. — —
~~~~~~~~~~~~~~~~~~~~~--
~- -• -5— — - - -
- (INC -
SSIFIEDPROJ1~CT 2 .lc-2
i R k R 5 H/HR 1 O R ~~~ _ _ _ _ _ _ _ _ _ _ _ _ _ _ _ _
1 1 / 5 ~1O ii
I /(
_ _
_
_
-
I
_ _ _
_
_
_
5---
_ _
0 1/1
_
•1 2 ~~~~~~ 0
_____
(D~
DISTANC E FROM ZERO POINT (i~~ YDS)
F~;. ~~~~ ~~~~~~~~ :~ I -~ tci~y - ~~O •~~7e~ a~ t .ruw ~d Leval ~t H + 1 Hour —~~~~~~~~~~~~ • ; ? ~ •- ~
• — 3 7 —
• -‘IJNCIASS,FWD _ _- — - -

:—~~-~-.— - - — -
I ____ - -
___________ - - - - - - - - - - --
~~~~~~~~~~~~~~~~~~~~~~~~~~~~~~~~~~~
5- p
I
S
OPER/~TION ~~~~LE
Pro ject 2.ld.
MONITOR SURVEY OF GROtfl~1D CONT~NINATION (RADSAFE)
• by
G. W. Jobnson, CDR , USN
22 May 1952
Armed Forces Special Weapons Project4 ,
- ~~~~~-
-~~
-•~~~
- -- ~~~~~~~~~~~~~~~~~~~~~~~~~~~~~~~~~~~~~~~~~~~~~~~
Li

-5 -5 -
V - —. - -
~~~~~~~~~~~~~~~~~~~~~~~~~~~~~~~~
- - -
- -a - -- -
‘~NCL4SSIFWD
MONITOR SURVEY OF GROUND CONTAMINATION (a~DS.~rE)V
1.1 INThCDUCTIO2
A~aong the inportant effec t s to be expected. from a si~ ’ccc or under—ground explos ion is that of residual cont aminat Ion on the ground . Quanti-tative informat Ion on the rad i at ion intensit ies and the associate d areas
-
- for such explosions was lacki ng prior to the JA~~LE operat~.on . It was thepur pose of Project 2. id. to provide for the dete rm inat ion of the extent andmagnitude of the radiation fields as measured by monitor survey teamsusing the Racliac Training Set AN/PDR-T1B for m aking the measurements .
-
- 1.2 PROCEDURE
AU instru ments wer e calibrated with gamma rays from an equ111br~i~radium source prior to each surve y. In making readings the instrument ingener a]. was held. about 3 feet above the ground , althou gh very little dif-ference was noted in varying the hei ght from 2 to 1~ feet , and everyattempt was made to get a represent at ive reading . Non-uni formIt Ies th thefIeld were practically absent untIl the wind became sufficIently strong toshift the contamination , at which time there was a localization of con-
• tami nat lon in ditches and behind obstructions .
The plan to get the necessary neasur eirent s involved , in addition tothe RadSafe surveys , the tak ing of readin gs at stations of other projects ,mainly those of’ Projects 2.la and 2.ld .
The station layouts and the deta iled data are given in Appenu. icesA, B, and C.
1.3 RESULTS
The results were reduced to gamma dosage--rat e contours at one hourafter each explosion . In all cases the monitor survey inf ormat4 on wascollected at times later than one hour and. therefore it was necessary tocorrect it to one hour. The correction for decay was based on the t~~-~2
S decay law which was shown to be the best approximation from monitor sur-veys and from gamma decay of’ samples from the field. The radiatIonfields for the surface shot are shown in FI g. 1 and. those for the under-ground in Fig . 2. The detailed data on which the curves were based aregiven In Appendices A, B, and. C.
The values for the fields In the lip areas given in FI gs. 1 and 2were obtained by extrapolation to the lip areas of the fields ob-ta~ned by surveys in the surroundin g areas as given in Figs . 1 and2. Surveys of the lIps of both craters on 25 January 1952 correctedback to H-i hour gave an average value for the surface shot of 6oocr/hr with a peak value of 8500 r/hr , which agrees well with the ex-trapo lat ed. avera ge value of 7500 r/hr . For the underground shot , the
• survey of 25 Januar y -~ave an average value of 6o00 r/hr with a peak5 —1—
- - :~~~~~~~~~~
_~— .~. -~ ~•_______

T~~~~~T-~~ _ _
UNCLASSiFIED
H-
PROJECT Lid
value Gf 7000 r1/hr. The detailed value s of the lIp surveys of 25January 1952 are given in Appendix C.
It must be emphasized. that the particular distribut Ions of’ con-tamination as found in Pi gs. 1 and 2 were a result of the particularwind conditions existing at the t :Iine of the detonat ion .
-,
.1 The wind pattern at the time of the surface shot (0900 PST, 19Noveither 1951) is given in Table 1.
• I TABLE ].
WInd Pattern at Time of Detonation - Surfac e Shot
Altitude above Surface Velocity DirectionFeet icnots
_________________
0 2 l90~- 2000 13 3.700
11.000 2~S i8o°6ooo 32 200°
10,000 11.o 210°
12,000 11.11. 210°].1l~, 000 63 200~16,000 511. 200~
Following the surface det onatIon the wind pat tern was unchangedfor 12 hours . At that time the surfac e wind, increased to 12 knots and.cont inued. to blow at 17 to 30 knots for about 21~. hours . Accompanyingthe Increase Cf wind at H--12 hours was a relatively heavy rainfall.The amount of prec Ipitation was not measur ed by the weather observersat the site but it was sufficient to wet the desert surface to a depth
- - of about 3/11. Inch.
The effect of the rain was to stabilize the soil until aboutH— 27 hours after whIch the soil had dried. to such an extent that thewind was able to pick up dust aga in. For these reasons, the monItorsurvey data collected in the first 27 hours were considered. to be mor e . S
- I reliable than measurements made subsequently. Therefor e, in drawingj the contours the earlier measurement s were given the greatest weI ght .
The wi-nd. pattern at the time of the underground shot (1200 PST ,29 Novezn’oer 1951) i.s given -in Table 2.
-2-
_ _ _ _ _
h I ’ f~~L~~~~IFIED
____ --
I.-.’
.~
S.- ~~~~~~~~~~~~~~~~~~~~~~~~~~~~~~~~~~
— —-5.—- —a-- ~~~~~ ~~~~~g ~~~~~~~~~~~~~~~~~ - ~~~~~‘ - -
~~~~~~~~~ -~ t~~~~ II~
—

-- - - -- ~~~~~~ J~~~~: W~~~~~~ - -~~~
- —
-
— -5 —~ - S -5 --- —
• -
Ini LASSIFIED
S PROJ~~T 2.ld
TABL E 2V
Wind Pattern at Time of’ Detonation — Underground Shot
Altitude above Surface Velocity DirectionFeet Knots —
0 calm —1000 3 10002000 8 19003000 12 210°
-
- 4000 17 210° -
-
5000 22 220°6000 21 220°8000 25 240~
The surfac e winds remained less than 10 knots generally from thesouth for 1e8 hours following the shot , at which time the windsincreased to about 20 knots . Since loose dust on the desert is movedabout by winds of 15 to 20 knots , after 48 hours the distribution ofradioac t ive material was modified by the winds . Therefore , in prepar-ing the dose-rat e cont ours , the measurements made prior to E-148 hours
- - were given the greatest weight .
The assignment of the expected accuracy of the results is some-what questionable but based on the overall performance of the survey in-stru ment s and the general consistency of the data , the radi ation fieldsat a given point are probably accurate to ±25 percent . Such accuracyIs certainly adequate becaus e except for the large downwind areas ofrelatively low intensity, the field gradients are so steep that errorsof 25 percent in radiation field do not markedly affect the areas ofconta minatIon .1.11- RECO 14M~1NDATIONS
In future operations , in the event that another contaminatingburst i~ fired , it is recoimnended that the station layouts for monitorsurvey follow the scheme that was used for the underground shot atJANGLE. The shape of the cont aminated field following the surface shotwas such that it lay between two arms of the radial arrangement ofstations ; and. because of the narro wness and. length of the conta minate dareas , coverage of measurements was not as complete as desired.. Be-cause of th is result , new stat ions for the underground shot in thedo-cn-iwind area were placed on arcs about the cent er of the explosionand therefore led to a more defin ite delineation of the field. . Thusin futur e operations , if the need arises to determine the field. con-tours, the stations should be so positioned that travers es are made atright angles to the expected direction of drift of the cloud at appro-priate downwind positions . The upwind and. crosswind contours arebest determined by a radial arrangement of stations .
-3-I
~~L ~ — - -
~~~~~~~ -

____________________ --—-.w-. ~~~~~~~~~~~~~~~~~~~~~~~~~~~~~~~~~~~~~~~~~~~~~~~~~~~~~~~~~~~~~~ -
~ ,.- ------ -5— - -
-
—
— -5-- — - - -5 - - -
S
PROJECT 2.ld
-
5000 _ _ _ _
. 1 _
_ _
__
_
r
__ _ _ _ __ _ __ _ _ _ _ _ _ _ _ \~ ~~ _ _ _ _ _ _ _ _ _ _ _ _ _ _ _— 1 — t~~ -
~~ ____ ____ ____ ____ ____
~ \ \ ~ DEC~ V FACTORSt \ \ l4 4’IS MIN. 5.4
-- 1~ 24108. 0.02I WK . 0.002
‘ ‘ IMONTh O.0004______ ______ ______
I To $ fields •t limos othsrC S4OFACE ZERO 4~~ -
7 f/ lW / foster
_____ _____ ______ _____ _____ d CON TAMINATED AREAS -7 DOSE RATE SURFACE AREA
~~~.. __.—‘ r/hr sg ml.50 ES
______ ______ ______ ______ 100 1.1looc 300 0.14 -500 Crotsr &1000 LIP only
_ _ _ _ _ _ _ _ _ _ _ _ I I V
1000 0 000 2000 2000DISTANCE FROM ZERO (‘lARDS)
• Fig. 1 Ga.~nzna Dose-Ra te Contours at Hf1 hour - Surface Thirst
-4-
UNCLASSIFIED— ~~ _~ .__.._._ _ ,__. ___ _ .J II4.~~~1L

___________________________ ___________________________________ -- ..,.._,.. ~~~~~~~~~~~~~~~~~~~ .~-,—.—..._ -— -- ~- —--~~ —- -- - ~~~ ~~~~~~~~~~~~~~~~~~~~~~~~~~~~ ~~~~~~~~~~
— - —
—- -5— — -- - —~- —- - - -5 - -5 - - 5 -
- HNCL4SS1FWDI-
PROJECT 2.ld
5-
‘ -H I -- j 1 7
_ _ _ ___
____ _/
/
___
I:
_ __ __ _
/
~~~~~~~~
a
_ I
_ _ 4
~~~~~~~~~~~~~~
_L
_
~~~~~~~~~~\ T~~~~~~~~~~~~~~~~~~~~~~~~~~~ ////j~~~~~~~~~~~~~~~~~~~~~~~~~~~~~~~~~~~~~~~~~~~~~~~
_
_ \~ _ _
_
To qst fields It ?lm~~ otSir
UNOCROROUNO ZCRO\~~~~ ~~~~~~~~~~~~~~ I ~~~~~~~~
_ S
(LIP 7500,/h, ) ~ ____ J — CONTAMPI*TEO A~~A5\ ~ -Z~~ OSE RATE SUR~~~~ ~~~~
______ ______ ______ ______ 100 L i
uvw — 20° 0.94 -, 500 0.1
j 1000 0.05
_ _ _ _ _ _ _ _ _ _ _ _ I I2000 1000 0 1000 2000 1000
~ STAN~~ PROM ZER O C ORDS)
— - Pig. 2 GaiTmia Doee-Ft~ te Contours at HI]. hour - Underground Thirst
UNCLASSIFIED- -
‘~~ .~~~ - .
~~~- ~~~~~~~~~~~~~~~~~~~~~~~~~~~~~~~ - _____________ -
S ~~~~~~~~~~~~~~~~~~~~~~~~~~~~~~~~~~ -
—- — -- —-5— —S—- — -5-~~~-~ - - _.&_v~ ~~ ~~~~~~~~~~~~ L~~~~ ~~~~~~~~~~~—
~----
~~--

fr PROJECT 2.ldAPPENDIX A
Dose-Rate Data - Sur face Detonat ion
- The station layout is shown in Figure 3
TABLE A.l~‘. I
Time after CalculatedStation Detonation Dose-Rat e Dose-Rate at H.J~ hrNumber Hours Roen~gensJhr RoentgensJhr S
- - ]. Data for stations 1 02 through 68 were provided in 0.033 corrected form by NRDL as 0.03ii. given in colt II. . 05 06 0.057 0.178 0.25
9 0.1710 011 0.0612 0.313 1.0
S lii~ 1.3.15 0.516 0.317 018 019 0.220 1.121 11.022 27.523 8.221i. 1.025 026 o.oG27 0.3328 3,14.29 8i.o30 142.031 1.032 033 03II~ 0.3335 2.636 208.0
H
UNCLASSIFIED _ _ _ _ _ _ _ _ _ _ _-5--.--—-
-5 ~~~~~~ -~ ~— ~~~~~~ - - - -~~—--—~~~ . -5 —-5 —~~~~~~—- -- - - -

~~‘~~~~~—-5-5- ~~-_~~~--; ‘ —-5—--- —.— ~~.—-5 -5-5
— -5.— -~~~
-~~~~~~~ ~~~~~~~~~~~~~~~~- - _~~~~~~-~~~~S- - - — — - - - - - — - --
- - -- —-5 — - - _ — - -
.1 y - - 1JNCLASSIF1ED
‘1~~~~~~~~~~~PROJ~~T 2.ld
TABLE A.1 (cont ’d)5
Time after CalculatedStati on Detonat ion - Dose—Rat e Dose—Rate at H.s.3. hrNumber Hours
- Roentgens/br Roentgensfhr
37 511.0.038 11.039 0.51~ 0ii.]. 0.3.2112 0.33-- .
. - li.3 16.514.14. 14.80.014.5 208.014.6 3.11.14.7 0.1014.8 014.’) 0.1250 0.5851 71.052 350.053 170.0511. ]~ 14.55 0.0656 o
-
- 57 0.12H 58
59 93.06o 350.061 91.562 0.914.63 0.01611. 065 69.066 115.067 115.068 115.0
6~ 5.5 0 022 0 050 0 0
I70 6. o.c6 0.52
22 o.oi8 0.714.50 0.005 0.50
71 11 .9 0.003 0.022
- ps _
—
k ,
-- IJNCLASSIFIED -
_ _ _ _ _ _
- - - - - - ~~~~~~~~~~~~~~~~~~~~~~~

— A~. - — - - - - - - - -
UNCLASSIFIED
PROJ ECT 2.ld
. TABLE A.]. ( con ’t)F -
TIme after Calculated 5-
Stat ion Detonation Dose-Rate Dose-Rate at H p]. hrNumber Hours Boentgena/hr Roentgena/lir
72 4.9 0.22 1.4822. 0.032 1.3150. o.oo8 0.88
• I 73 5. 14. o.o8o o.6o22 0.022 0.90
- ; - 50 o.oo8 0.83
711. 5. 11. 0.010 0.7622 0 005 0.21
75 5.6 o.16o 1.2722 0.0314 1.3950 0.013 1.110
76 ~. 6 0.020 0.1622 0.005 0.2].
77 5.5 2. 11.0 18.522 0.36 3.11.850 0.165 18.3.
-r
72 0.05 8.5
5 78 5. 11. 1.05 7.922 0.080 3.350 0.03872 0.03.2 2.0
79 50 0.31 311..72 0.20 311.
8o 5. 11. 0.90 6.8-
-
22 0.033 1.11.50 0.018 2.072 0.008
81 50 0.017 1.0- 1 72 0.010 3.3
82 5.11. 0.75 5.722 0 .012 1.050 0 .009 0.5
—8—
Iii-
uimAs~iCwo ____ ______Ii I - ~~~~~~~~~~~~~~~~~~~~~~~~~~~~ ~~~~~~~~~
- —~~~
-~~~~
_~~~~i-_ _
~~~~~1~--_-_-_
~~~~~
_ -5_ _ -
~~~~~

-
LINCL4SSIF~EJJ
PROJE CT 2.ldTABLE A.1 (cont ’d)
Time after Calculated~3tation Detonat - .on Dose--Rat e Dose--Rate at H+l hrNumber Hours Roentgens~~~ Roentgens/hr
83-’ 50 O.O0O4 0.014.
84~ ~ .3 0.65 14.85-0 0.007 .8
- - 72 0.002 .3
85 5.3 1.25 9.322 0.12 14. 950 o.o14i li. .572 “ .026
86 ~~~~~ 0 0
87 ~6 0.03 7.2
88 22 1.072 0 .20 34~_ 6 0.10 24.
22 0.90 37.72 0.111. 214.96 o.o8 19.
90. 5.2 0.81 5.822 0.120 14.950 0.055 6.o72 0 .019 3.2
- 5 96 0.010 2. 14
- - S
01 72 0 0
92 72 0.036 6.1r 96 0.022 5 .3
93 72 0.090 15.0
L I 96 0.050 12.0
914 72 o.i8o 31.096 0.100 2 14.0
72 0.018 3.1S 96 0.010 2. 14
______ _
~~~~~~~~~~~SS~FIED U-_______________
- -
S - 2
-—

— —-fl---- ——-5- — — -— -5— — - - —___ — w-5_.;;j;~~~~~
__— ~~~~~~~~~~~~~~~~~~~~~~ -~ - -—
-
.1 UNCLASSIFIEDHr
PROJECT 2.ld
TABLE A.]. (con~t)
Time after CalculatedStation Detonation Dose-Rat e Dose-Rat e at He]. hrNumber Hours Roentgens/hr Roentgens/hr
96 72 0.120 20.096 0.060 15.0
97 72 0.270 146.oF’ 96 0.1].’) 26.0
98 72 o.oo8 1.li.
99 72 0.090 15.096 o.o14o 10.0
100 72 0.230 39.096 0 .100 214.0
101 72 0.038 6.~96 0.130 -
7.2
3.02 72 0.250 112.096 0.3.20 2 ) . 0
103 6.o 2.10 18.072 o.i8o 31.096 0.090 23 .0
1011. 72 0.026 4. li96 0.009 2.3
-iS
—3.0-
LJNCLASS~~FIED _ _ _ _
B ~ -. ,_g,~•• ~_~~Ji~~ - ~~~~~ ~~~~~~~~~~~~~~~~~~~~~~~~~~~~~~~~~~~~~~
-
- _ j - - - - — — - ---—--- -- ---—— — - - — - ~~~~~~~~~~~~~~~~~~~~~~ — - ________________________________________________________

-5_i__ bNCLASSIFIED
~~~~~~~~~~~~~
PROJECT 2.ld
S
.- .
•000 • • • •0 104
7000~~ 0~o3
—
. DuoI LIII
- 0102
On
~~0 0 -0100
Oh OIl• - Oh
- - 0~~013
054 0,1
5000 •
LIII N
OI~ £ 0
4000 • OS. £105 II
~:b01
005
3000 - LaOS
OS’ 014
£101k
~~~2000 - ‘ 0.1
Oil
050
1000~~ ~~~~~~ 2o 0 0 0 ~~~~~ Q~~341 41 41 44 ~5 41
1-~~~~~g g ~ — & ~ g9
000 - 9 9 9? 9 9 9 0-2. I~I (~~~~s1-*S)
6 — 0T)~~~ LOC*TSOIIS(Not Ill-all)
• I . . I . I —
2000 1000 1000 1000 1000OI$TNICC ~A0M ZtNo (*NoSI
Fig. 3 Station Layout — Surface Shot
~~~~~~~~ IED _ _ _ _ _
- - - - - 5 - --~~~~~ -- -—~~~~ -- - - - —~~~~~~ —~~~~~~~~~~~~~~~~
-• - ~~~~~~~~~~~~~~~~~~~~~~~~~~~~~~~~~ ~~~~~~ ~~~~~~~~~~~~~~~~~~~~~~~~~~~~~~~~~~ ~~~~~~~~~~~~~~~~~~~~~~~~~~~ -~ ~~~~~~~~~~~~~~~~~~~~~~~~~~~~ ~~~~~~~~~~~~~ --

- r ; , UNCLASSIF IED
PROJECT 2,ld
APPENDIX B5__ --
Dose-Rate Data - Underground Detonation
The Station layout is shown in Figure li.
TABLE B.1
* Time after CalculatedStation Detonation Dose--Rate Dose-Rate at H+1 hr
- - Number Hours Roent gens/br Roentge~~Jhr
1 26 0.002 0.10
2 11. 0 .0140 0.2325.5 0.025 1.2
3 3 .5 0.013 0.0625.5 0.003
• 14. 11.0 1.0 5.319.5 0.3.3 11.525.5 0.09 14.3
5 3 .5 1.30 5.619.5 0.11 3.925.5 0.09 14.3
0.0147 li. . li.
6 3.75 i6.o 78.019.5 1.8 63.025.0 1.6 76.01111.0 0.95 89.0
7 3.7 0.30 1.519.5 0.060 2.1
- - 25.0 0.0140 1.9
27.5 0.030 1.6
8 3.7 0.038 o.i819.5 0.008 0.2825.0 0.009 0.14327.5 0.005 0.26
9 25.0 0.002 0.09—12-
UNCLASSIflED-5----—- -- —--
- --5 —S—~~~~~
- ~~~~~~~~~~~~~~~~
~~~~~~~~~~~~~~~~~~~~~~~~~~~~~~~~~~~~~~~~~~~~~ S —- - I

~~~-iii ~~~ T~~~~’~~~~~~~~~~~~~~~
’1~ ~~~~~~~~~~~~
IJNC LASSIAED - - -
PROJECT 2.ld
• TABLE B.i (con ’t)Time after Calculated
- - Station Detonation Dose-Rat e Dose Rat e at R+l hrNumber Hours ROent gens/hr Roent gena/hr
S ]~0 19.5 2.50 87.026.5 ].140 70.0144.0 0.95 89.0
1]. 211.5 10.0 1i60.o
12 214 6.o 270.0
13 - 19.5 0.38 13.326.5 0.20 10.0li.4.0 0.15 lli..O
11i. 211 .5 9.0 1415.0
* 15 24.0 0.7 31.5
16 19.5 0•26 - 9.126.0 0.1]. 5.5
0.10 9.317 211.5 7.0 320.0
27.5 14.8 250.0
18 211.0 0.170 7.6
19 19.5 0.0314 1.226.0 0.012 0.6
20 2 14.5 3.6 166.027.5 3.3 1714.0
21 214 .0 1.2 514.05 27.5 1.0 53.0
22 26.0 0.009 0.5
23 2 14.5 1.727.5 1.2 63.0
24 25.0 0.28 13.0
25 211.5 0.50 23.0-~~
5 27.5 O . li.O 21.0
‘ 4
-
UNCLASS~F1ED _ _ _ _ _ _
jS ~~~~~~~~~ ~~~~~~~~~~~~~~~ - - - - - - - —;__
~~ - — - —
~—- -
~~~~~~~~ -~- - ~~~~~ ~~
III. ~~~ -.5 — —--.—•- .•-‘~ --—--.~~~~~~~~~~-- —- 5 —~~--‘--- ~~~~~~~ r. ~~~~~ ~~~~~~~~~~~~~~~~~~~~~~~~~~~~~~~~~~~~~ ~ ...~~ 1~~~ IeI 1iI ~~~~
- - “
- ‘
LASSIFIED
r PROJECT 234TABLE B.]. (con ’t)
Time after CalculatedStation Detonation Dose --Rat e Dose-Rat e at 1143. hrNumber Hours
- Roentgen s/hr Roent gene/hr
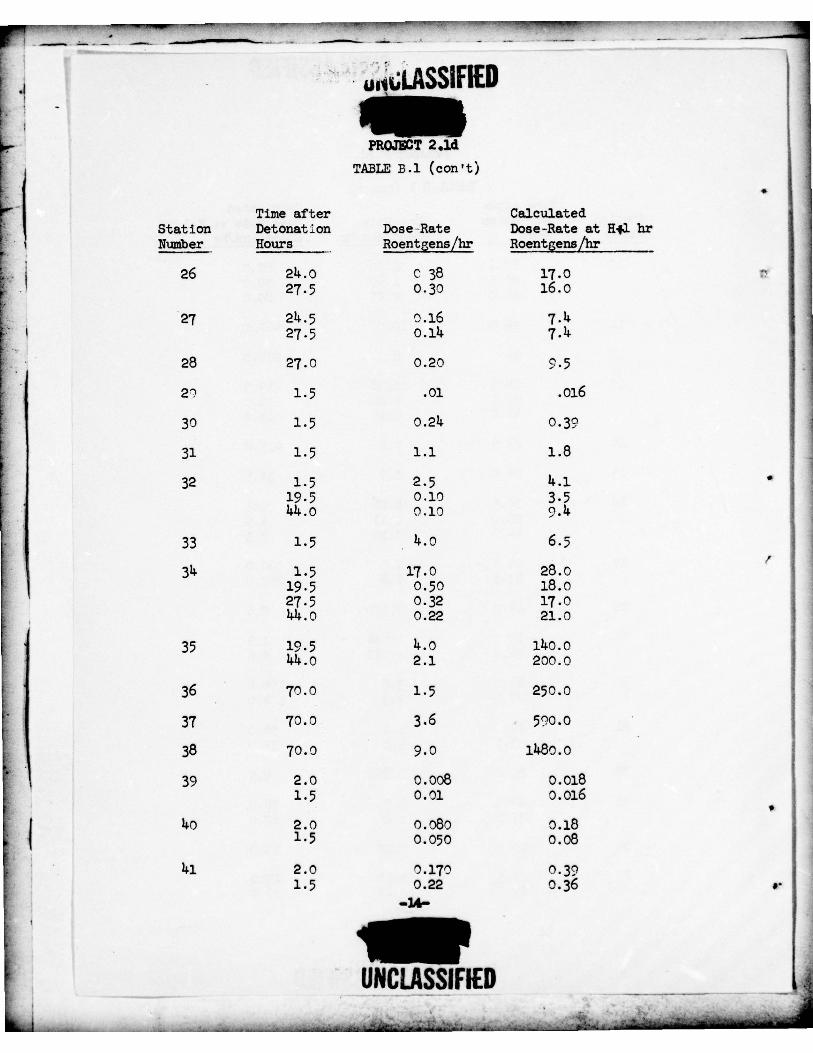
26 214.0 C 38 17.0 ‘-5-
-
-
• 27.5 0.30 16.0
27 2 14.5 0.16 7.14.27.5 0.114. 7.li.
28 27.0 0.20 9.5
20 1.5 .01 .016
30 1.5 0.24 0.39
33. 1.5 1.1 1.8
32 1.5 2. 5 4.119 .5 0.10 3.544.0 0.10 9.14.
33 1.5 - 14.0 6.~
F31i. 1.5 17.0 28.0
19.5 0.50 18.027.5 0.32 17.0)i.14.o 0.22 21.0
35 19.5 4.0 1140.014i..o 2.1 200.0
36 70.0 1.5 250.0
37 70.0 3.6 ~~0.0
38 70.0 9.0
39 2.0 0.008 o.oi81.5 0.0]. 0.016
I
f 140 2.0 0.080 o.i81.5 0.050 0.08
li.i 2.0 0.170 0.391.5 0. 22 0.36
—34—
UNCLASSIFIED~~ .IJ
. .~~~~.
~~~~~~~~~ ~~~. ~~~~
.,~*.J__.
~~~~~~~~~~~~~~~~~—
~~~--—
~~~~~~~~~~~~~~~~~~~~~~~~~~~~

r~~~i ~~~~ 1T - . T~-~ ’ Ti::: IT~T~I~~TI~ TT ~~~~
—
Lh .~I.ASSIFIED
PROJECT 2.ld
TABLE ~.1 (con ’t)
Time after Calculated- Stat ion Detonation Dose—Rat e Dose-Rate at Hf]. hr
- -S Number Hours -
Roent~ensJbr Roent~ensLbr S
5.-
112 2.0 0.70 1.601.5 o. Ii.8 0.78
5
43 2 .0 3.8 8.7
~~ 2 . 0 20 1e6.o1.5 22 36.0
145 1.5 50 8i.o
S 14.6 19 0 .11 3.8
• li.7 19 0.22 7.727.5 0.10 5.31414. 0.10 9. li.
48 19 0 .30 10.5 I -
27.5 o.i4‘- 44 0 .15 114.0
49 19 o. l~.8 16.827 .5 0.30 15.9144 0.30 28.2
50 19 1.00 35.027.5 0.50 27.0114 0.90 8~ .o
5]. ‘9 14.6 161S 27.5 3 .6 191-
- 141. 3.0 282
5 2 - 19 5.5 19~53 19 6.0 210
• 27.5 3 .5 186
54 19 14.2 111.727.5 3 .2 170
~I~~~ 1FIED
263

FT TT~~~ T~~ T~~~ ~~~~~~~~~ ~~~T~~~~: T~ T T~~ T~~~i
-
• UNCLASSIFIEDPROJECT 2.14
TABLE B.l (con t t)T.ime after Calculated
-
- Station Detonation Dose-Rat e Dose-Rate at 11*1 hrNumber Hours Roentgen sJhr Roentgensjbr
55 19 5.5 192• 27.5 1 4 4 233
1414 3.1 292
56 19 5.2 18227.5 3.9 20744 3 .5 321
57 19 11.2 111.727.5 11.8 25411.14. 2.8 263
58 19 2.6 9127 .5 - 1.6 85411. i.~ 114.1
59 19 2.0 7027.5 1.9 101411. 1.14 132
6o 19 1.8 6327.5 1.6 8~141. 1.14. 132
6]. 19 1.3 4611.14. 1.2 113
62 2.5 6.o 1819 0.5 18li.4 o.6 56
63 19 0.018 0.631~4 0.015 1.11
61i. 2.5 o.o6o 0.18-
- - 19 o.oo6 0.21
1~4 0.009 0.85
6~ 19 0.0014 0.111-
66 19 Background -
67 19 Background -
68 27.5 3 .3 175
U~~~~I lED—
- , T - ~~~~~~~~ • - - ~~~~~~~~~~~~~~~~~~~~~~~~~~~~~~~~~~~~~~~~ ~~~~~~~~~~ —-- ---.--~~--- ---— -~~~~~~~~~~—-5— — .—. —-5— __ ~~~~~_ 5__Sfr- -~~

r~ ~~~~~~~~~~~~~~~~~~~~~~~~~~~ Ti~~~~~
1 - 4ee~ LASSIFIEDr PROJECT 2.14
• TABLE -B.l (con h t )
Time after CalculatedStat ion Detonat ion Dose-Rat e Dose-Rate at 1141 hr
• Number Hours Roent gens/br Roentgens/hr5-’ — ___________ ______________ _____________________
69 27.5 1. 14. 72-~
--
- 70 27.5 1.2 62
-
- 71 27.5 0. 14.11. 23
72 27.5 0.28 3.5
73 27.5 0.20 1171i. 27.5 0.30 16
75 27.5 0.16 8.5
76 214. 0.60 2727.5 o.6o 32
77 27.5 o.6o 32
78 21l. 1.10 5027.5 0.80 42
- 79 27.5 2.8 114.8
8o 21i. 3 .2 3.141.27. 5 3.1 161i.
81 211 2.8 32627.5 2.8 11e8
-
- 82 27.5 1.6
83 27.5 0.26 ~~
I I •S
I
—1?-
-
-
-
-
-
± - ‘L Li- - ~
-.—- — S ~~~~~~~~~~~~~~~~~~~~~~~~~~~~~~~~~~~~~~~~~~~~~~~~~~~

-‘. r’’ —— ~~—~~ -—~~~~~—-- -• — - -—----- - ~~~~ ST’~~~~~~~~~~’ ’ - - -— - -‘ fr~~~’r - - -
- UNCLASSIFIED ~~~PROJECT 2.14
6000 • • •
5000 ’ isO270 ~~
770740
- - - - 730 7504000
000 IsO250 hO710700 uO
3000 • 260650250 N
~~0
2000 - 200
~~~~~sO 041 £9 . -
I_ _
- so 40ISO £
130 liD £20 G50sO ~~
-
70
s o t40 0 :2 .
0 I I 4 LOcEIONS910$. 2e S3)
— 1000 - ao0 10
isO
2000 I I •- -i 3000 1000 1000 / 0 1Q00 $000 300C
DIS1AIIC~ F00M ZERO h*R0$ )
Fig. 1~ St tion Layout - Underground Shot4
-
,
U NCLASSIPIED _ _ _ _ _ _
• - - 5—— - 5 - - -
~~~~~~~~~~~~~ ~~~~~~~~~ ~ ~~~~~ ~~~~~~~~~~~~~~~~ ~~~~I.,JL —‘ - - ~~~~‘~~~~~~~
.~~~~~~ ~~~~~~~~~~~~~~~~~~~~~~~~~

--5-.-- —•- ---5—’ - 5.— -5—.- -55- •-5•~•~~
-5•~~
-5— ••~~~~~~
.—~ ‘5 5—
—.
- - - - - - — — . -L -a - -. — —- — -—
:~~
PROJECT 2.id UNCLASSIFIED~ 1APPE3~1DIX C
S
Surveys of Lips
on 25 January 1952 moni tor surveys were made of the 1~p areas of theun dergroun d and surface shots . Readings were made at eight positions equallyspaced on a circle surrounding the craters and are listed below .
TABLE C.l
Surface ShotStat -i on Rate Rate Corrected toNumber Roentgensj~~ 11,1 hr Roentgen~Jhr
1 1.2 86oo2 1.1 79003 1.0 720014. 0.90 65005 0.32 23006 0.50 36007 o.6o 43008 1.0 7200
Mean 6ooo r/hr
Under ground ShotStation - Rate Rate Corrected toNumber Roentgens/hr Nfl hr Roentgensjhr
• 1 1.2 70002 1.0 -
5800
3 0.95 550014. 0.90 52005 1.0 ~8oo6 1.0 58007 1.05 61oo8 1.10 6400
- Mean 6000 r/hr
UNCLA3SIF IED- -
-
~~~~~~~~~~~~~~~~~ ~~~~~~~ J ~~ ~~~~~~~~~~~~~~~~~~~~~~~~~~~~~~~~~~~~~~~~~~~ ~~~~~~~~~~~~~~~~~ -

.1
- UNCLASSIFIED-
~~~ -~~
S
-
- P roject 2.3—1
TO2A L DOSLGE
- by
LT. COL. MERWIN B. POBBBSMR. ROSS G. LAP RTCX
CPL. EDWL~~ J. PULL~~
March 15 1952
-
i SIGNAL 00BPS 1NGIW~~RING LABORA TORIES
I ’S
I~ RT ~ )NMOtJTR, MEW JERSEY
_____
.
~~~~~
‘!
~
! !~~~~~~!
S S~~~~~~~~~~~~~~~~~~~ I~~~~~~~~~~~~~~~
_ _ _ _ _ _ _ _ _
- - ~~~~~~~~~~~~~~~~~~~~~~ -- .~~~ W Y ~~~~~~~~~~~~~~~ A- .4~~~~~~’. ~~~~~~~~~~~~~~~ - ~~~

r~~~~~~~~~-T~ ~~~~~~ T Y TTT I _ _
•~ UNCLASSIFIED
PROJECT 2.3—1
H
S
S000
6000
_
/ / /___ _
I I SURFACE I( ZERO
) )
~oo~
6000 4000 2000 0 2000 4000 6000Fist
Figure 3.1 To tal Gam ma Dosage (50 Hours) Surface Shot
—26
UNCLASSIFIED- — - - —--5-5---—
IIIJil ~ 5 - - ‘ - - S - -
-~~~~~~ ~~ - -— 5— . - 5--- —‘--——---—----‘---- — -———-,---~ ----~~~~~~~~~~~ -~~~~~~ . . A t A . ~~~~~~~~~~~~~~~~~~~ ~~~~~~~~~~~ - ~~~~~~~~~

-~~~~
_
S UELASSIFIEDS
PROJECT 2.3— 1
-S - 12,000
10,000
C
8000
6000
4000
2000 J J J( / 1 UNDERGROUND \ ~S I I ZERO
::_ _ ___ _
6000 4000 2000 0 2000 4000 6000Fist
Figure 3.2 Total Gamna Dosage (50 Hours ) Underground Sho t
27
VNCLASS~FIED 1 -j T T T -—- ~~~~~~~~~~~~~~~~~~~~~~~~~~~~~~~~~~~~~~~~~~~~~~~~~~~~~~~~~~~~~~~~~~~~~~~~~~~~~~~~~~~~~~~~~~~~~~~~~~~~~~~~ ~~~~~~~~~~~~~~~~~~~~~~~~~~~~~~~~~ S

S - -- -~~~---~~~~~~~~ ~~~~~~-‘.~ —S,---- -~~~~
F - — ~~- - -~~ —-5 -5—S-- -5— — - - - - - - S
PROJP~T 2.3— 1
~-1 8000-
6000
_
//
~~~~~~~~~~~~~~~~~~~~~~~~~~~~~~~~~~~~~~~~~
_I I SURFACE
I I ( ZERO )_ __ _ _ _
I
S
2001
~~~~~~~ /4000
•
1
-
6000
6000 4000 2000 0 2000 4000 6000Fist
S -( Figure 3.3 Total Gamma Dosage in ]~irst Hour (Corrected) Surface Sho t
UNCLASSIFIED _ _
~~~~~~~ ~~~~
- - 5—
5 5 - S - S -~~~~~~~~~ ~~~~~~~~~~~~~~ ~~~~ -~~- - -5--—- ~~~~~~~~~~~~~~~~~~~~~~~~~~~~~~~~~~~~~~~~~~~~~~~~~~~~~~~~~~~~~~ 5 — ~~— - - -5

r ~~~~~I _ _
S UNCLASSIFIED
PROJ ECT 2.3—1
I I S
SCALE 2CM ‘tOOOFT
-
~~~~~~~
8000 1-
6000
UNDERGROUND_______ _______
f ZERO
. 5 2000_ _ _
-
4000
6000 ~~~~~~~~~~~~~~ ~~~~~~~~~~~~~~ _______ _______
6000 4000 2000 0 2000 4000 6000Feet
Figure 3, 14 rota l Gamna Dost~ge in i~irst Hour ( Correc ted ) Undergro und Sho t
—29 —
‘UNC SIFIED I
________
~~~~~~~~~~~~~~~~~~~~~~ ~~~~~~~~~~~~~~~~~~~~~~~~~~

- ~W ~~~~~~~~~~~~~~~~~~~~~~~~~ _______-
— - • - — -5 - - — — S
H .
‘
S OP~RATI0N JINGlE -
S PROJECT 2.3-2
YtZR)IE 3}flEIDD(G OF GAIO(& RADIATION
by
- TWJ~(&S 0. WALSH
27 Jima 1952
4 ’_ _
UNCLASSIFIED~ tGDi~~ i R~~E*RCR AND ~~VEZOP!~~(T IAB~~ATORI~~
4
~~~~~~~~~~~~~~~~~~~~~~~~~~~~~~~~~~~~~~~~~~~~~~~~~
- ~~~~~~~~~~~~~~~ ~~ — -- ~~~~~~~~~~ __________________________________________ — _____________

UNCLASSIFIED
~oi~r 2.3—2 -
~
- a,
ABSTRACT
I
This project was designed by the Corps of Engineers to evaluate- the protection aff orded by foxholes against the gamma radiation emit-
ted by atomic weapons deton ated on the surface and beneath the ground.S Film dosimeters were used to measur e total gamma ray doses at dif—
S ferent dep th s in one and two—man foxholes as well as in soil pipessunk into the ground. The film dosimeters were conta lnec. in NationalBureau of Standards 1 type holders and responded to gamma radiation of
S
ener~~r greater tha n 120 Key. In the report, al]. doses are given interms of roentgen s and a reading of 650r (roentgen s) is taken as thelethal dose; that is, the dose which will cause death to near]y 100per cent of exposed personnel.
The maj or conclusi ons of this experiment , based on the dataS
- obtained in the above manner, follow:
1. Standard foxholes , as described in ~~1 5—15, provide excel-lent protection to personnel from the gamma radiation emitted duringthe detonation of an atomic weapon on the surfac e of the ground. Theresults show that the doses in the bottom of such foxholes located inthe crosswind direction during Operation JANGlE were less than 10 percent of the surface doses at identical locations. Since the foxholeøwere located outside of the major fall—out pattern, the complete dosemeasured was due to scattered prompt radiation. If the foxholes hadbeen located downwind, however, the doses would have been higher ,since fall—out into the foxhole and scattered radiation from the con-tamination on the surface would contribute more significantly to thetote]. dose. There are indications that these contributions will notmaterially change the per cent of surface—received radiation reachingtrained personnel in the bottom of the foxholes. An increase of sur-face conta mination will increase the surfac e dose as well as the dose
S at the bottom of the foxhole, thereby maintaining the ratio betweenS the two. The contaminated matter that falls into the foxhole can
easily be removed by occupying personnel before it has time to in-crease the doses received to any great extent.
~ -{ 2. ~ccept in those areas covered by extensive fall—out , f ox—holes also provided effective shielding in the case of the undergrounddetonation of Operation JANGlE. The doses at the bottom of the fox-holes varied from about 21i to 38 per cent of the sur face doses at dis—tances greater than 2500 feet from the burst. A great portion of this
S - v -
UNCLASSIF1ED - - ___
~~~Il~J ~~~~~~~~~~~~~~~~~~~~~~~~~~~~~~~~~~~~~~~~~~~~~~~~~~ L ~
- * ~~~~~~~~~~~~~~~~~~ ~~~~

ONC I-ASSIFIED
— PRO.T~CT 2 .3—2
dose, about 90 per cent, was obviously due to radioactive matter thatfell into the foxhole, because the doses measured in the holes duringthe surface shot were approximately 10 per cent of those measuredduring the underground shot of identical yield. It is expected thatboth bursts contributed equally to the ~‘ioses as far as prompt radia-tion is concerned,
3. The doses obtained from the detonation of atomic weaponson the surface or underground receive cont ributions from prompt gammaradiation, radiation emanating from column and cloud, and from residual
S activity due to fall—out of radioactiv e matter. No base surge act ivityS was evident, S
- - 14. The complete doses at the bottom of the foxholes after the
S surface burst of this operation were attributable to scattered promptradiation in addition to a ~na1l contribution from the column andcloud; no material contribution from fall—out or residual activitywas evident. This lack of effect undoubtedly resulted from the location of the foxholes in the crosswind direction. If the foxholes hadbeen located downwind, there would have been a material contribution
Sfrom tall—out and residual activity. It is not expected that thiswould falsify the conclusions drawn in this report on the effective-ness of foxholes as protection for personnel against gamma radiation.(See conclusion 1, above.)
5. The major portion of the total dose measured at the bottomof the foxholes af ter the underg round burst apparent ly caz~ from fall-out matter in the foxhole, Conta mination on the surface of the groundsurrounding the foxhole contributed only about 1.0 per cent to the doses
S at the bottom of these structures, and prompt radiation could not con-tribute more than evidenced in the surface burst since both weaponswere the same size. Yet~ in a].]. cases the doses were considerably higher S
during the undergrowid detonation , leading to the obvious conclusion S- that matter falling into the foxholes played the most important role .
Also, the doses in the two and one—man foxholes were equal, althoughthe two man foxhole had twice the opening area. If the column or cloi~.taz~tivity contributed great ly to these doses , it could be expected thatthe doses in the two—man foxhole would be about twice as great asthose in the one-man structiire.
~1a
— v i —
—*
- ~~~~~~~~~~L - - ~~~~~~~~~~~~~~~~~~~~~~~~~~~~~~~~~~

11- a
UNCLASSIFIED
• ~~OJ1CT 2.3—2
0 0
-
~~~~~~
El 0
T~~~T T T T T2 2.5 3 3.5 Is ls.5 S
-
Distance (103 ft)
o Soil Pipe
0 Standard One-man Foxhole
Standard Two-man Foxhole
Fig. 2.1 Location of Foxholes
_ _ _ _ _ _
41El i - i 4-
I II I I I ~~~ a
~ i!-1 ~ ~: : i ~’ :
I ‘ft A / ~~
-
~~~~~~~~~~~~~ ....
Fig. 2.2 Film Locations in Pig. 2.3 Fibn Locationa in• Two-man Foxholes One-man Foxholsa
I— 3 - .
H j__________ _
UNCLASSIFIED A- - ! 1_ ~~~~~~~T~~
- ~~~~~~~~~~~~~~ — ~~~~~~~~~~~~~~~~~~~~~~~~~~~~~~~~~~~~~~~~~~~~~~~~~~~~~~~~~~~~~~~~~~

r~~~~~I~~1TTT ~~~~~~~~~~~~~~ —-
I
I
-t
• CHAPTER 3
•
- TEST RESULTS
3.]. GAi~iA RADIATION RESUTJTS
The integrated gamma doses in roentgen s measured in foxholesat various distances from the detonations are shown in Tables 3.1 and3.2 for the surface and widergroimd bursts respectively. These dosesare given for five different levels in a two—man foxhole, 3 feetabove the surfac e of the ground, at the surfac e, and 16, 32, arid uSinche s below the surface. At each level below the surface, threedoses are given in the two—man foxholes and two doses in the one—manfoxhole, representing the results of films located in the positionsshown in Fig. 2 • 2.
• Figs. 3.1 through 3.6 are reproductions of the results obtained• in Project 2.1A, Operation JANGLE. They depict the dose rates at one
hour after the bursts , the total dose received in the first ten minutesand in one hour for both the surface and imdergrotuid shots. The pre-sentation of these graphs is necessar y in this repo rt since the film
• badges were not collec ted until fifty hours after the bur sts and thegraphs give an estimate of the contribution that residual radiationmade to the total doses. On these graphs the locations of the foxholes
• • have been superi mposed to facilitate the evaluati on of the results .Fig. 3.7 shows the prompt radiation expected from detonations of weap-ons of the size employed in the tests. The curve s show the logarith mof the dose received as a function of the distance from the point ofdetonation to the films. Fig. 3.8 shows the theoretical value of theintegrated dose at any ti.~ne after the burst assuming a dose rate of1 r per hour at 1 hour after the detonation and a decay law of t 1.2.I • Total doses for any other dos ? rate may be obtai ned by multiplyingthe value s on the graph by the desired rate at ~t+1 hour s.
4
- _ _ _ _ _ _
UNCLASSIFiED •~~~~~~
_ _ _ _ _
IIIIg_J — —- - ~~ -~E1Ii~~~~~i — ~~~~~~~~~~~~~
-

_ _ _ _ _ _ _ -
LINCLASStFIED
PROJECT 2.3.2 -
TABlE 3.1
Distr ibution of Oaimna Radiation in Foxholes (Surface Burst)
Lnge Two-man ~~e-man Soil(ft) location Foxhole Foxhole
2000 36” Above Surface 800 rSurface 70016” below Surface 230 205 IsiS• 32” Below Surface 214 58 136148” Below Surface
— 12.8 22 62 __________ _______
2500 36” Above Surface 230 rSurface 22016” Below Surfsce 35 60 8532” Below Surface 7 15 26
_____ 148” Below Surface 14 8.5 13.3 __________ _______
3000 36” Above Surface 120 r 73 rSurface 90 5516” Below Surface 23 36 55 6.8 6.6 1032” Below Surface 7.6 12.14 19.14 2.5 2.14 o.5
_____ 148” Below Sur face 2.5 14.8 6.7 1.6 1 03500 36” Above Surface lii r
Surface —-16” Below Sur face 3 —-— 9.7
• 32fl !Beiow Surface 1.6 2.8 3.1k• _____
is8” Below Surf ace ~Sh .99 1.9 __________ _______
14000 36” Above Surface 17 r 17 rSurface 9.616” Below Surface 1.6 3 5.6 — 0.35 —32” Below Surface 0.6 1.12 1.62 — — 0.17
_____ 148” Below Surface — 0.514. 0.57 0.39 —
• 14500 36” Above Surface 9.8 rSurface 14.616” Below Surface 1 1.8 3.532” Below Surface 0.5 0.7 1.014
_____ 148” Below Surface 0.21 0.14 0.57 ___________ _______
5000 36” Above Surface 14.8 rSurface - 2.7 0
16” Below Surface 0.6 0.99 2.95- • 32” Below Surface 0.3 0.5 0.75
_____ 148” Below Surface 0.]? 0.2 0.38 ___________ _______
• 0— 6 —
~~~~~~~~~ ‘•~~~•~~~~~~~
—
-
- • ~
-•
_ _ _ _ _ _ _ _ _ _
UNCLASSIFIED~~~~~~
— -iii—--i: ~~~~~~~~~~~ -.-—- ~~~~~~~~~~~~~~~~~~~~~~~~~~~~~~~ ~~~~~~~~ - —~~~-~~
—

T~~II TTT ~~~~~ ~~~ -- 1
1J~’~ ’~’4’IFlED
PROJ!0T 2.3—2
TABlE 3.2
Distribution of Gamma Radiation in Foxholes (Underground Burst)
Range TWo-man ! ()~e-aan —
SoiI~~*
Cf t) location Foxhole Foxhole ~~~~~~~~~_
2000 34” Above Surface 3850 rSurface 2300
• 16” Below Surface 1150 — 800- •
- 32” Below Surface 700 1000 555-
- _____ 148” Below Surface 200 200 200
___________ ______
-
•
2500 36” Above Surface 1000 — 550 rSurface 7816” Below Surface 78 98 11532” Below Surface 143 56 50
_____ 1s8” Below Sur face 73.14 914 96
___________ ______
3000 36” Above sur face 175 r 1%rSurface 103 7516” Below Surface 30 142 37 20 — 732” Below Surface 22 23 20 2.5 11 3
_____ 1s8” Below Surface I~3.s 1i5 514 I~l 38 -3500 36” Above Surface —
3 Surface 14816”- aslow surrac e 12 17 1532” Below Surface 9 10 9
_____ 148” Below Surface 15 15 22
___________ ______
-
- 14000 36” Above surface 32 r 28 rSurface 22 lu16” Below Surface 6 7 15 7 14 232” Below Surface 5 3.l& 7.2 3.7 2.8 0
_____ 1t8” Be].ffir Surface 6 8.14 8 6 5 9,8 1~.1
14500 36” Above Surface 22 rSurface 1016” Belov surface 14 5 532” Below Surface 5.8 2.8 2.8
_ _ _ 148” Beiow Surface — 7.1 8.9 — _ _ _ _
5000 36” Above Surface 73 r• Surface 23
16” Below Surface 2$ 15 67• 32” Below Surface 21.5 22.6 2$_ _ _ _- 148” Below Surface — 21 2.9
_ _ _ _ _ _ _ _ _ _ _ _
4
_ _ _ _ _

r~~~~ I T ~
_ _ -
‘1 UNCLASSIFIED
PR0J~~T 2.34
( 21. -
~
- ‘Ii———22
Xe ’ I,,
2C ~~~~~
-
NI çr~ /
___ ___ ___ ____
II ___ ____ _ _ _ _ _ — _ _ _ _ _ _ _ _ _ _ _ _ _ _ _ _ _ _—r
1 I’
,
14 ~ - I ~~~~~~~~~
‘/ _ _ _ _ _ _
1/3 1 / / iA_ _ _ _ _ _
3~~~3 / r- L
~~~~~~~~~ ~~~~IHI~ 2~ 6_____
II• IY_ I II _____ _____ _____ ____
I 1 l r~ /
1 1 1 r— ‘ ,/~
~4~if ~‘/• t soy j ( o N ) D a f ,~~I t 5 I f j )‘- M ~~itor Data
6 —-— ____ — ~ thele toast ~~
0 _ __ _
6 14 2 0 2 6 .i.0 C
DISTANCE (2.03 PT) -
Fig. 3.1 Surfac e Burst , Iso—Rate Contours At 1 !~~. 0
I~~~SSIFIED• —
• • •• ~~~~~~~~ •‘, —•, .--~‘—•~.-~•~~~~~~~ ~~~L_ ~~~~~~~~~~~~~~~~~ ~~~ ~~~~~~~~~~
—

____ — ~— ‘ ~~~~ ‘I~~~ T~~~~
- ~~~~
—
— — — - • -~~~• -~~~-_ --_ - • - - • . — -- — -
I
-
U~~
j
~~~~~~~~~ IFIED
PROJICT 2.3.222
p.- 120 —— _ _ —— _ _ _ _
• •
•
18
16 - _ _ __
II I I I
_ _ _ _ _ _ _ _ _
I ‘Sii
I _ _ _ _ _ _ _ II I
12-1 /
_ _ _ _ _ _
I ii~~io
I I 0 NB$ DataI , D NRDL Film Data
8 I ‘ I ~ ++ Foxhole locationsI , I
14
2
14
6
8 6 ~ 2 0 2 8 10
DISTANCE (io~ F?)
Pig. 3.2 Surface Burst, Iso—Dose Contours at 10 Minutes
- 9 -
U~~~~~IFIED
~-__________
________________________
~a_ _• • •-- • - -_ •— ,•~-- — .•
~~ • -—— ~~

— ~•—- —-— •—,•— — —- *~~-~~- — —~~~ —
— - -- ;•
- -
_ UNCLASSIFIED
PR0J~CT 2.3-2• 214
22
_ _ _ _ _ _ _ _ _
I _ _ _ _ _ _ _ _ _20 / / ~
~~~ /
18I )(52 ( N
16 _4ti &~ 2 ~~~~~~~ I _ _ _ _ _ _ _ _ _
_ - _ _ __ _ _ _
10~10 ____- I j ‘AO —— ____ ____ ____ ____
I L..J-. r O N D a t ,
~I ,~~ r / O N ) L F i m D a ~~L
8 ‘I ~~~~~~~~~~~~~~~~ _ _ ~ M hitor~~~+-~ _ _
• 17Io I ++ F thole Ioca~ .ona
6 _ _ _ _ _ _ _ _ _ _ _ _ _ _ _ _ __ - —
~~
6 8 6 1 4 2 0 2 14 6 ~ 10
DISTANCE (103 PT)
Fig. 3.3 Surface Burs t, Iso—Dose Ccntours At 1 Hour0
. 10 —
- •
UNCLASSIFIED• ••---------——— - •- - . _ • -
~ - -- _ ‘ --~~~~-—, _~:•1
• _ •~~___.~_ &__ • •—•••------•—~~
--—~~~~~~•
- • ~~~~~~~~~~~~~~~~~~~~~~~~~~~~~~~~~~~~ ~~~~~~~~~~ ~~~~~~~~~ ~~~~~~~~~~~~~~~ ~~~~~~~~~ ~~~~~~~~~

_ _ _ _ _ _
UNCLASSWWD
PROJECT 2.3.2
0 NBS DataX Monitor Data
- • — -1± Foxhole Locations
18
--- ___ ___ ___ ___ ___ ___ ___ _ _ _ _
16 _ _ —— _ _ _ _ _ _ _ _ _ _ _
t)(29
12 —— ——- -i--/
____ ____ ____
I / / ____ ____1
1 (tv
l
~~~
_ _ _ _ _ _
I I,
~I P-
/ / /
3 1
~~~~~~~~~
_ _ _ _ _ _
~~~~~~~~~
/
_ _ _ _ _ _ _ _ _I
-
•
2
_ __ _ _ _
_
1. 8 * 2 0 2 1 10
DISTANCE (103FT)
Fig. 3.14 Underground Burst, Iso-Rate Contours at 1 Hour
_ _ _
-
_ _ _
- _-t_
~~~~~~~____________ — ~~~~~~~~~~~~ ~~ - ~~~~~~~~~~~~~~~~ • ~~~~~~~~~ —

r~~~~~~~~~ ~~~~~~~ ~~~~~~~~~~• UNCLA IED
k •
p..
PROJECT 2.3-220 -
~~~~~~~~~~~~~~~-—— -— — —
~~~~
- - • • •- • - - - -- - - __
1 C NBS Data
18 -— X Monitor Data-i-F Foxhole Locations
16 ——~~~~~~~~~~
••
—---•-
1412 ——4—------
I) ,
~C8o— — X 7 ~
_ _
8 _~~~~
--- _ - - - —_)1~~~~
--
_ _ _ _ _ _
yoc /
6 —— / ~ /
0 ~~~~~~~~~~~~~~~~~~~~~~~~~~~~~~~~~~~~~~~~~~~~~~~~~~~~~~~~~~~~~~~~~~~~~~~~~~~~~~~~~~~~~~~~~~~~ -!
--- -
~
•nJ
•
_ __ _
~~~~~~~~~~~~~~~~~~ j -. _
8 14 2 0 2 14 8 10
DISTANCE (i~~ F?)
Fig. 3.5 Underground Burst, Iso-Dose Contours At 10 Minute s
• — 12 —
UNCLASSIFIE D~~~~~~~
• ~~~~~~~~~~~~~~~~~~~~~~~~~~~ ~~~~~~~~~~~~~~~~~~~~~~~~~~~~~~~~~~~~~~~~~~~~~~~~~~~~~~~~~~~~~~~~~~~~

FT ’T ~~~~~~~~~~~~~~~~~~~~~~~~~~~~~~~~~~~ ~~~~~~~~~~~~~~~~~~~~~~~~~~~~~~~~~~~~~~~~~~~~~~~~~~~~~~~
- _ _ _
I •
~jj
SIFIE D
PROJECT 2.3—2
o lfBS DataO NRDL p’j]jn D~ta
• 20 • x Monitor Data• • •
-1-4- Foxhole locations
18 - - - - - -~
-—---~~
—- -------
• • N
I 16
i•L.~~~~~~~~
.AL..L. X 40 _ _12 _ _
~~~~~~ /
_ _ _ _ ___ ___
190’ I-~ 10 ----- -- •~~~
-• —--— —----—•~ —---v/ / )(• 100,I / 2iQ /
8 — ----- - - -- -- ---~~~
--~~~~~ ~~~~~~~~
-- ~~~~~
••-- _ _ _ _ _ _
6 -. —- I /-~ ~~~~~~~~ —
/ (~~ -~~~~~~~ 2591 /
_ _ _ _ _ _ _ _ _
/• :.• • _ •
~~4J’ ~~~~
~~~~•—-
6 ~~~~~ 212 14~~~~~ 6 8 10
DISTANCE (i~~ PT)
Fig. 3.6 Undirground Burst, Iso—Dose Contours at 2. Hour4
•13 —
—- UNCLASSIFIED _ _ _ _ _ _ _ _ _ _
I ~ -- -~~~~~~~~-•-- • --
~~ .• -• ~~~~~~—•-•~~-
-~~~~ —~~~~~~~~~~ —~~•~~;_ •
~~~~~~ ~~~~~~~~~~~~~~~~~~~~~~~~~~~~ •:•- r__________________

T~~~~~ii~~ ~~~~~~~ T~~~~~ ~~~~~~~~~~~~~~~~~~~~~~~~~~~~~~~~~~~~
UNCLASSIFIED
PROJECT 2.3.2
10 _ _ _ _ ~~~~ _ _ _ _ _ _ _ _ _ _ _ _ _ _ _ _ _ _ _
—
l.2 KT Surf ~ ~e Downw rid
i
~~~~~~ ~~~~~ C: ~~~~~~
1.2 K? t idergrow I Dow’nwi ci• 1.2 K? ~ idergroui I Cro ssw rid
0.2
- 1
0.02 _______ 1 _____ _______ I I - I f —
2 3 14 5 6 7DISTANCE (ion F?)
Pig. 3.7 Total Dose at 10 Secondg (Surface and Underground Bursts)
-24 —
F- — _ 1 Ji ~~ $ IFW D
• •
~~ — ~ -• _ - • • _ • • - ________________
L~ - - • ••
~• • •
~• •4— ~~~~~~~~~~~~~~~~~~~
‘~~~~~~~
— •- -1~~l~
~~~~~~~~~~~ ~~ -~- —---~~~-‘ -

~~JI - — - ~~~~~~~~~~ ~~ - — —•— - - - — — - - - - - —
UNCLASSIFIED
f
-
— I
CHAPT~~~14
• DISCUSSION OP RESULTS
- I 14.1 GAMMA 1 )SES PROM SURFACE DETONATION
The gsni*a doses recorded during the surface detonation are-
- given in Table 3.1. The readings are consistent among themeelfeeand can be easily interpreted from the contours and graphs given inFigs. 3.1 through 3.3 and 3.7. Consider the dose of 800r, measured3 feet above the foxhole located 2000 feet from the detonation.Fig. 3.7 shows that the total dose to be expected at 2000 feet onehour after the burst was between 600 and 800r. Figs. 3.1 and 3.8show that the contributi on of residual activity to the tots]. doseafter one hour was small, approximately 1$r. However, it must beremombered that the above illustration pertains to crosswind loca-tions only; in the downwind direction surface tots]. doses of about
- - BOOr were found as far as 7000 feet from the detonation at H’~-1• hour., (see Fig. 3.3).
-
The doses in the roxholea at locations below the surface f.Uoff sharply from the surface values. Analysis of the data shown inTable 3.1 indicates that the doses at the bottom at the foxhole wereprimarily the result of the scattering of prompt radiation. For
xamp.Le, the average value of the films at the bottom of the foxhole- 2000 feet from the surface shot was about 32r and the prompt radia-
- tion on the surface was 600r, (see Fig. 3.7) . Therefore, about 5 percent of the prompt surface radiation reached the bottom of the fox-hole. The results from Operation BUST~~ indicated that this dose ws.~just about what should be expected from initial r~~ .ation at the hot-• tom of two-man foxholes. Of course, if the foxhole were locateddirectly downwind, the dose would be higher due to an increased amountof fall-out into the fexhole. However, as wifl be shown in the ane1.ysis
-
- of the results from the underground detonation, only the radioactive• mabt ar that fell into the foxhole contributed to the total dose, the
radiation field on the surface surrounding the foxhole had very littleeffect on the doses at the bott om.
1 14.2 GAWk DOSES PROM All DEEROROUND ~~TOXATION S
The doses received on the surface and in foxholes at varLouadistances from the point of detonation are given in Table 3.2. With
• the exception of the 2000 foot station, all badges gave readings
_ _ _ _ _ _ _ _
V~~~~~RED________ —•-—~.— ~~ .~1 ~~~~~ ~• ~~~~~~~~~ -~~~~~~ ~A ~~~
~- ~~ —

~~~~~~_I~ ~~ iir~ - i T~~
-~~r -
--~~‘T
~~1 - -
~~~~~~~~~
-
-
-
~~~~~ 11
• I~~ILSSIFWD
PROJECT 2.3-2
consistent with the contours shown in Figs. 3.14 through 3.6. The2000 foot station gave a reading of 3850r, considerab ly higher than
- • expected from the contours . However, examination of Fig. 3.6 showsthat althoug h the total dose contours are accur ate over large dis-tances , small areas of very high activity existed in certain loca-tions even though the surrounding areas gave relative ly low radiationdoses. This was undoubtedly caused by the concent ration of & largeamount of fail—out in these locations or by a higher specific contamins—tion of the fall—out in that particular region. Consider the dose of73r obtained 5000 feet from the burs t. from Fig. 3.6 the total doseafter one hour at the distance should be about 20r. Figs. 3.14 aM 3.7show that the residual radiation after one hour added about 27r, for a
• - total of 57r. But, data from monitor readings as shown in Fig. 3.6indicated that the total dose after one hour was Sor, instead of 20,
• in the area where the 5000 foot station was situated, If the 27r resi-dua l. radiation were added to this , the result would be h r which i.very close to the reading obtained by the film.
• Comparison of the results obtained during the underground burstwith those during the surface burst showed that the total gananm doseswere greater at a].]. distances following the underground detonation.The increase was due primarily to the greater amounts of radioactivematter that fell from the f].oud. The doses dropped sharply beyond2000 feet to reading of about l000r at 2500 feet and 175r at 3000 feet,(see Table 3.2). Consideration of the doses recorded at these stationslead to an estimate of the effectiveness of foxholes as shields againstgaiimia radiation from an underground burst. In the 2500 foot foxhole,a dose of less than lOOr was measured at the bottom, while the dose 3feet above the surface was approximately l000r. Clear ly, personnel onthe surface would be exposed to lethal doses while those protected by
• foxholes would receive relative ly unimportant doses~Analysis of the doses obtained at the lower levels inside the
foxholes indicated that only scattered prompt radiation and radioactive• • matter that fell into the foxholes contributed greatly to the measured
doses and that the attendant surface radiation field was relative lyunimportant. This conclusion arose from the fact that the films atthe bottom of the two-man and one—man foxholes received about the ssms
• doses, see Table 3.2, although the one-man foxhole had anl.y one—halfthe area of opening. Therefore, if the colunn and cloud contributed
- great ly to the doses at the bottom , a greater reading should be ox—pected in the Wo—man foxhole • The same argument is true with respect
1 -b to the surface conta mination surro unding the foxholes. If this con-
tamination contributed greatly to the doses inside the foxholesthrough radioactive decay, then it should have a greater effect onthe badges in the Wo-man foxhole b CaU~e the greater opening.
_ _ _ _
-~~~~~~~~__ _ _ _ _ _-
_!CL~SSIFWD •_ •
~~~~~~~~~~i— J~4
____________ - — - •— •-- -—— - — ----——-•~——•-~-- —--~~~~
—. ~~ _i__ _~ ..__~•_a_ ~~~~~~~~~ - -— •-

_ _ _ _ _ __ ~~ T”~ :i ~~~~~~~~
I UNCLASSIFWD
PROJIQT 2.3—2
This was e.e~ing]y not the case. Moreover, Reitaann of the ~ igtnsert Research and Development Laboratories, stated in his report on Pr oject6.2, Land Reclamation, that less than 10 per cent of the sur face• activjt~ was found at the botto. of a ij foot trench that was dug In a
- • • contaminated ares after the surface burst of Operation JIXOZE.
C
&
/
•
1
H ~. — 1$ .,
-~~~~~~~~~~~
_ _ _ _ _ _ _
IINCLASS1FWD - - - - _ _ _ _ _ _ _ _
-__________— - ___________________•
I_ • —•~~~i _~~~__s• - -~ _~_•,_ -.•- ~~~~~~~~~~~~~~~~~~~~~~~~~~~~~~~~~~~~~~~~~~~~~~~~~~~~~~~~~~~~~~~~~~~~~~~~~~ ~~~~~~~~~— ~~~ — ~~~~~~~~~~~~~~~~~~~~~~~~~~~~~~~ —— —~~~~

,~~~~ _
~~TT~~ T~I T~~~~:
ONcU SIFIED
CHAPTER 5
CONCLUSIONS
5.1 FOXW)LE S}tEEIDING OF GAMMA RADIATION
5.1.1 Surface Detonation
Standard foxholes provide excellent protection topersonnel from the gamna radiation emitted during the detonation ofan atomic weapon on the surface of the ground. The results from thecomparatively small sized weapon employed in Operation JARGIE showthat 2000 feet from the burs t, the location of the closest foxholedoses of about 60r were measured at the bottom of a foxhole, lessthan 10 per cent of the dose measured 3 feet above the surface of theground. Due to the location of the foxhole in the crosswind direction,the dose at the bott~i* was caused primarily by scattered prompt radis.tion plus a ~..11 contribution from the residual act ivity of the tie-
• sion products on the surface of the ground. In the d~ nidnd direction• there would be a contribution from matter that falls out from the
cloud into the foxhole in addition to the above mentioned. This fall-out will depend on the wind velocity for a given sized weapon, andalthough it is expected to increase the dose in the fccch.les, es—
• • pscislly in those located close to the detonation, it i. relatively
unimportant in comparison to the prompt and residual activity since- it can be easily shoveled out of the foxhole in a short time.
5.1.2 ~~~~~~~~~ Detonation
With the possible exception of those located in thearea close to the point of detonation where extensive fall-out occur.,foxholes also provide effective shielding in the case of an wider-ground detonation. Even within this area of extensive fail-out, whichat Operation JANGlE extended approximately 2000 f..t, the high dosesrecorded in the foxholes could be greatly reduced by M~ gtYig out theradioactive matter that fell into the hole. It is highly probablethat one-half the doses recorded in the foxholes located within 2500feet of the detonation at Operation JANGlE were directly attributableto this type of fall-out and most likely a higher percentag. at die-
( tone.. greater than 2500 feet.
— 1 9 -
~~~~~~IFIEDIlIlFI lIItliIIIIrIItII_•__••••____•__ •-—-- ~ - -~~~~ —•----•-- a— ~~~~~~~~~~ - - - -
~~~~ ~~~~~~~~~~~~~~~~~~~ •_~~~_ _ . ~~~~~~~~~ • ~~~~~

— — ~~~~~~~~~~~~~~~~~~~~~~~~ ~~ ~~~~ w w ~~ ‘ —.—~~~-‘ ~—-
- — -~ -
~~~~
- _ J- __ -
~~UNCLA_FED
PROJECT 2.3-2
5.2 SOURCES OF RADIATION C~~TRIBUTING TO DOSES
The doses obtained from the detonation of atomic weapons on thesurfac e or underground receive contributions from prompt radiation,residual activity due to fall-out of radioactive matter , and possiblyradiati on emanating from the activity of the soluinn and cloud.
5.2.1 Surface Detonation
The complete doses at the bottom of foxholes in thisoperation were attributable to scattered prompt radiation . No con-tribution from fall-out or cloud and column activity was evident butit i. expected that fall—out would have incr eased the doses if thefoxholes had been located in the downwind direction.
5.2.2 Underground Detonation
The greatest portion to the total. dose measured at thebottom of foxholes apparently came from the fall-out matter in thefoxhole. The contamination on the surface of the ground surroundingthe foxhole contributes only about 10 per cent to the doses at thebottom and the prompt radiation could not contribute more than oc-curred in the surface burst since both weapons were the same size.let, in all cases the doses were considerab ly higher during thewidergz’oimd detonation leading to the obvious conclusion that matterf.11(?~g into the foxholes played the most important role , a].so~ thedoses in the two and one-man foxholes were equal although the two-man foxhole had twice the opening area. If the colwun or cloudactivity contributed greatly to these doses, it was expected thatthe doses in the two-man foxhole would be about twice as great asthat in the one—man.
4
)• .2 0 —
_ _ _
UNCLASSIFiED -
%~~~~~~~ •~~~~~~~~~ Tj~~ -~~~~~ —~~~~~~- — -
~______________ ~~~~~~~~~~~~~ ~~~~~ •~~~ -