operation and control of multiple bnr processes in one · pdf fileoperation and control of...
TRANSCRIPT

1
Operation and Control of Multiple BNR
Processes in One WWTP
Williamsport Sanitary Authority’s
Chesapeake Bay and CSO Compliance Program
June 24, 2015 Presented by: Phil Anderson
CENTRAL PLANT

2
• Understand the operation and control of
multiple the Biological Nutrient
Removal (BNR) Systems.
• Review the Components of the Systems • Design criteria
• Operation and process control
• Target parameters
• Process Optimization
Purpose of Presentation

3
• Overview of Central Plant
• Flow Pattern
• Biological Nutrient Removal
• Design Criteria
• Total Phosphorus Removal
• Total Nitrogen Removal
• Operation & Monitoring
• Optimization
Agenda

4
Where is Williamsport?

5
• Overview of Central Plant
• Flow Pattern
• Biological Nutrient Removal
• Design Criteria
• Total Phosphorus Removal
• Total Nitrogen Removal
• Operation & Monitoring
• Optimization
Agenda

6
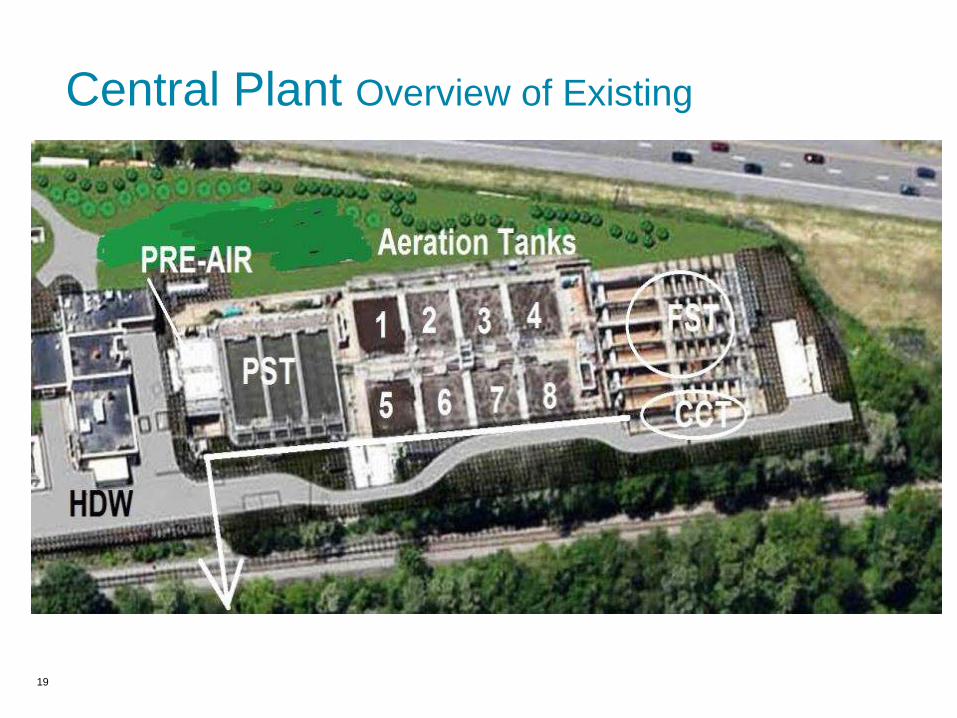
Central Plant Overview of Existing

7
Central Plant Overview of Existing
The Central Plant:
• Initially constructed in 1955
• Upgraded to secondary treatment in 1974.
• Fine bubble air diffusers were installed in 1994
to provide improved air distribution and mixing
in the activated sludge system.
• WSA is a CSO community serving 63,000.

8
Central Plant Overview of Existing
Since 2004 WSA was in negotiations with
USEPA and PADEP:
• Final effluent discharges to the West Branch of
the Susquehanna River (Chesapeake Bay
Watershed).
• In addition to NPDES permit requirements, the
Chesapeake Bay Nutrient Reduction program
requires the removal of nitrogen and phosphorus

9
Central Plant Overview

10
Central Plant
Nutrient Credit Trading:
• DEP Requires Evaluation: Credit purchase to
be considered for PENNVEST funding.
• DEP Favors Trading: Encourages POTWs to
fund non-point BMPs if more cost-effective
• Premise: Buying credits may be less
expensive than building and operating new
infrastructure.
• “Truing-up”: Defer upgrades, use for permit
year shortfalls.

11
Central Plant Nutrient Credit Trading
Nutrient Credit Trading (cont):
• Credit Program: Rules and policies not settled
• Credit Supply/Price: Availability uncertain;
price subject to market variation.
• Cost Comparison: Current credit price is close
to the cost of building some increments of
treatment facilities.
12
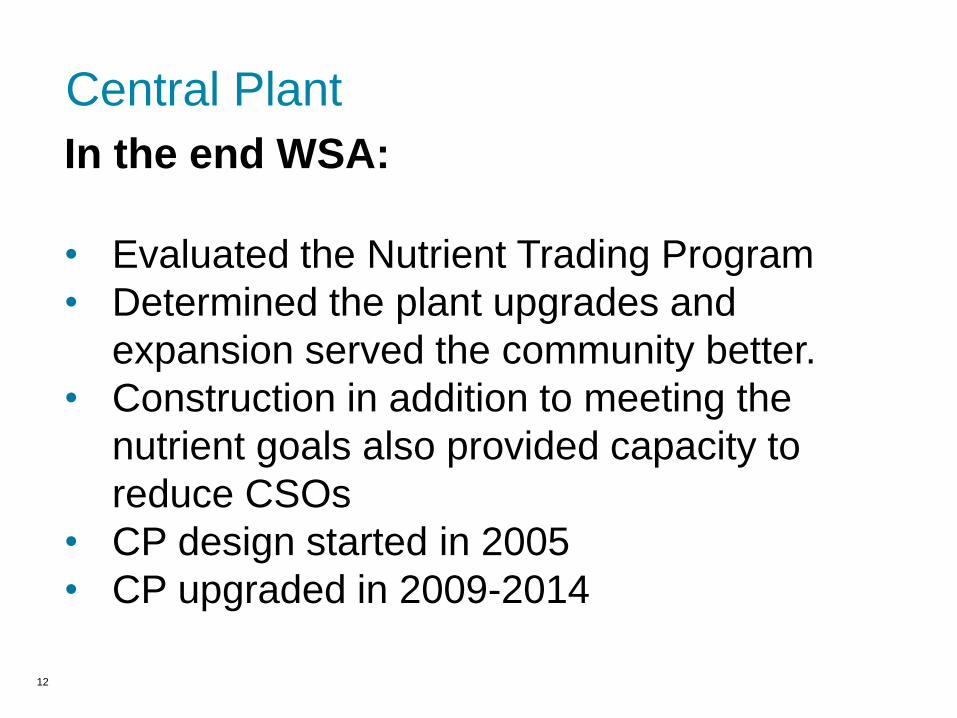
Central Plant
In the end WSA:
• Evaluated the Nutrient Trading Program
• Determined the plant upgrades and
expansion served the community better.
• Construction in addition to meeting the
nutrient goals also provided capacity to
reduce CSOs
• CP design started in 2005
• CP upgraded in 2009-2014
© 2013 ARCADIS 1 July 2015 13
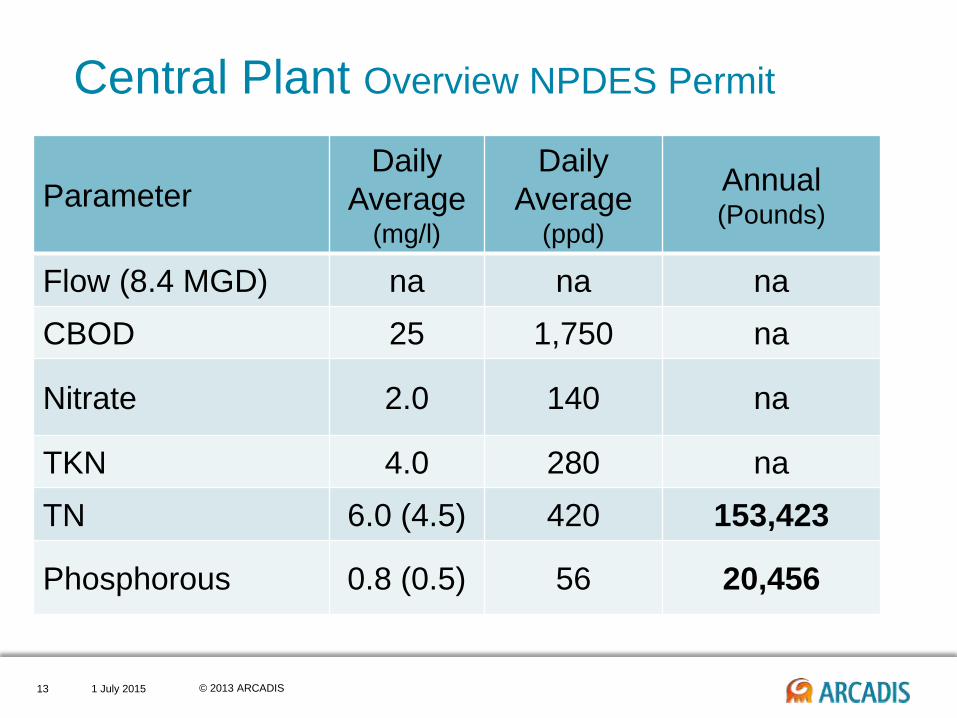
Central Plant Overview NPDES Permit
Parameter Daily
Average (mg/l)
Daily
Average (ppd)
Annual (Pounds)
Flow (8.4 MGD) na na na
CBOD 25 1,750 na
Nitrate 2.0 140 na
TKN 4.0 280 na
TN 6.0 (4.5) 420 153,423
Phosphorous 0.8 (0.5) 56 20,456

14
Central Plant Overview Process Modeling
Influent Parameters
(Including Recycle
Streams)
Annual Average
- Average Flows,
Average Loads
Annual Average -
Average Flows,
Max. Month
Loads
Max Day
Flow 8.4 8.4 21
cBOD5 (mg/L) 112 162 77
cBOD5 (lb/d) 7,860 11,374 13,485
TSS (mg/L) 101 179 89
TSS (lb/d) 7,098 12,509 15,646
TKN (mg/L) 24 34 13
TKN (lb/d) 1,660 2,358 2,358
TP (mg/L) 3.8 7 2.6
TP (lb/d) 267 457 4571

15
Central Plant Overview Process Modeling
Modeled 3 Different Conditions:
1.Average flows and average loads (to assess year-round
performance)
2.Maximum month loads at average flow
3.Maximum month flows at max month loads (design condition to meet
nutrient requirements)

16
Central Plant Overview Improvements

17
• Activated Sludge
• Improved Air Flow and DO Control (Aerobic)
• Changed AS to Modifed Ludzak-Ettinger (MLE)
Process for the removal of Nitrate.
• Added IMLR Pumps – Return Nitrates to Influent
Zones (Anoxic)
• Anoxic Zones – Mixing only
• Swing Zones – Mixing for Anoxic/Anaerobic and
Air Diffusers for Aerobic
• Anaerobic Zone for phosphorus removal
• Secondary Clarifiers converted to Bioreactors
• CCT converted to Reaeration Tanks
Central Plant Overview Improvements to Existing

18
Central Plant Overview
New Facilities:
• CSO Tank
• Headworks
• Secondary Clarifiers
• Chemical Feed – Polymer, FeCl2 & NaOH
• Denitrification Filters – Carbon Feed
• Chlorine Contact Tank
• Sidestream Treatment – for recycle loading
• Gravity Belt Thickener
• SCADA
19
Central Plant Overview of Existing

20

21
Central Plant Overview
22
• Overview of Central Plant
• Flow Pattern
• Biological Nutrient Removal
• Design Criteria
• Total Phosphorus Removal
• Total Nitrogen Removal
• Operation & Monitoring
• Optimization
Agenda

© 2013 ARCADIS 1 July 2015 23
PRE
AIR BNR
(MLE)
CSO
2 MG
Tank
Disinfection Denite
Filters
PS
Belt Filter Press
GT
Sidestream
Treatment
GBT
SLUDGE
CAKE TO
LANDFILL
FeCl3 / Polymer
0 – 25 MGD
UP TO 22 MGD
21 MGD
RECYCLE
RECYCLE
BACKWASH
(RECYCLE)
PSTs
22 MGD
RECYCLE
1 MGD
Sec.
Clarifiers
Anaerobic
Digestion
FeCl3 / Polymer
RAS
Flow Pattern
NaOH
WAS
0 TO 8.9 MGD

24
Flow Pattern

25
• Overview of Central Plant
• Flow Pattern
• Biological Nutrient Removal
• Design Criteria
• Total Phosphorus Removal
• Total Nitrogen Removal
• Operation & Monitoring
• Optimization
Agenda

26
Biological Nutrient Removal Overview
27

28
Biological Nutrient Removal Overview
BNR by Activated Sludge using three zones (aerobic,
anoxic & anaerobic):
• Aerobic to remove:
CBOD and Ammonia - Nitrification (produces nitrates)
• Anoxic to remove:
Nitrates using Denitrification
• Anaerobic to remove:
Phosphorus
•Permit Goal
Total Nitrogen (Nitrate Plus TKN)
Total Phosporus

29
• Overview of Central Plant
• Flow Pattern
• Biological Nutrient Removal
• Design Criteria
• Total Phosphorus Removal
• Total Nitrogen Removal
• Operation & Monitoring
• Optimization
Agenda

30
Operation & Monitoring - MOPO
Schedule System Startup
August 2012 Headworks; Influent and CSO Pumping, Screening and
Grit Removal
September 2012 Primary Sludge Pumping
October 2012 Aeration Tanks (MLE)
January 2013 Secondary Clarifiers, RAS, Disinfection and CCT, Final
Scum Pumping
March 2013 Denitrification Filters and Methanol System
BFP Sludge Cake Conveyor and Cake Pumps
May 2013 Chemical Feed Systems (Ferric Chloride & Sodium
Hydroxide)
August 2013 Side Stream Treatment (SST)
September 2013 Gravity Belt Thickener (GBT)
October 2013 Bio-reactors and Re-aeration Tanks

31
Operation & Monitoring - MOPO
• WWTP Staff - Who are they? What is their
experience?
• Formed the WSA Process Control Team (PCT)
• WSA Operations Manager
• WSA WW Operations Manager
• WSA CP Superintendent
• WSA CP Assistant Superintendent
• ARCADIS RPR (Resident Engineer)
• ARCADIS Operations Specialist
• ARCADIS Liaison Engineer
• Gannett Fleming Construction Manager

© 2013 ARCADIS 1 July 2015 32
Operation & Monitoring - MOPO
Operational Goals:
• Meet the limits of the NPDES
• TN
• TP
• Manage peak flows
• Flow Controls
• Maintain Bio Mass
• Well established operating procedures
• SCADA and process control
32
© 2013 ARCADIS 1 July 2015 33
Operation & Monitoring
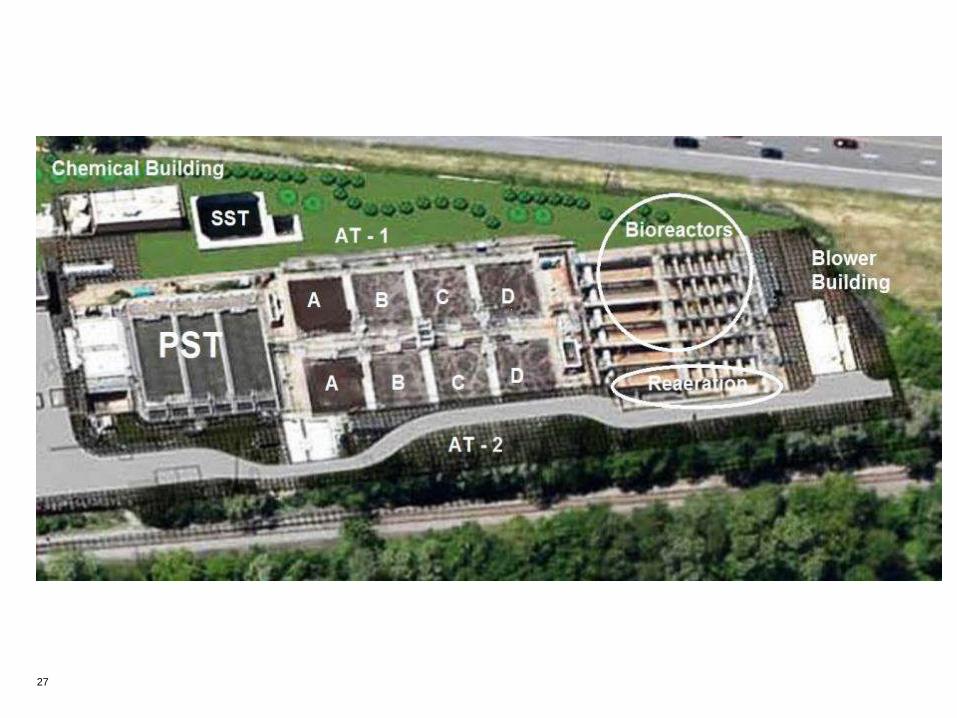
• The BNR Process has three types of zones:
• Selector anoxic zones (A) for selection against
filamentous microorganisms and for
denitrification (nitrate removal).
• Swing zones anoxic/anaerobic/aerobic (B) and
(Bioreactors – anoxic/aerobic).
• Aerobic zones (C & D) for CBOD/COD removal
and nitrification and reaeration (Reaeration
Tanks).
33

© 2013 ARCADIS 1 July 2015 34
Operation & Monitoring
Warm weather operation:
• Zone A and the bioreactors are operated in
anoxic mode
• Zone B anaerobic for P removal
• Plus RAS and Primary Effluent
• Zones C and D, and the reaeration tanks in
aerobic mode.
34

35 © 2010 ARCADIS
A ANOXIC
B AN -
AEROBIC
C OX
Reaeration OX
(typ. of 2 trains) RAS
Internal Recycle
Bio-Reactors ANOXIC
D OX
Sec.
Clar.
Operation & Monitoring
Anoxic Aerobic Aerobic Anoxic
Denite Filters
Nitrate

36
Operation & Monitoring
36
32
28
24
MG/L 20
16
12
8
4
0
A B C D BR
AX AN AE AE AX
- P - NOx - NH3N

© 2013 ARCADIS 1 July 2015 37
Operation & Monitoring
Fall & Spring Conditions:
• Maintain warm weather operation as long as
possible to maintain P removal
• Zone B and the Bio-Reactors are operated in
anoxic or aerobic modes in the transition
seasons of fall and spring as necessary to
achieve nitrification and denitrification.
• Any remaining nitrate removal is achieved in
the denitrification filters.
37

38 © 2010 ARCADIS
A ANOXIC
B ANOXIC
C OX
Reaeration OX
(typ. of 2 trains) RAS
Internal Recycle
Bio-Reactors ANOXIC
D OX
Sec.
Clar.
Operation & Monitoring
Anoxic Aerobic Aerobic Anoxic
Denite Filters
Nitrate
© 2013 ARCADIS 1 July 2015 39
Operation & Monitoring
Cold weather conditions:
• Low wastewater temperatures (< 12°C) slow
microbial activity.
• Zones A and B operated in anoxic mode
• Any phosphorus is passed on to the
denitrification filters.
• Zones C and D, and bioreactors are operated
in aerobic mode.
39

© 2013 ARCADIS 1 July 2015 40
Operation & Monitoring
Cold weather conditions (continued):
• This maximizes the volume available for
nitrification, while still achieving partial
denitrification in Zone A and B.
• Any remaining nitrate and phosphorus
removal is achieved in the denitrification
filters.
40

41 © 2010 ARCADIS
Operation & Monitoring Cold Weather
A AX
B AX
C OX
Reaeration OX
(typ. of 2 trains) RAS
Internal Recycle
Bio-Reactor OX
D OX
Sec. Clar.
Aerobic Aerobic Anoxic
Denite
Filters
Nitrate

42
Operation & Monitoring
Analytical Probes and Transmitters:
• Dissolved Oxygen (Zones B, C & D and
Reaeration Tanks)
• Improved Air Flow and DO Control Loop
• ORP (Zones A & B, Bioreactor effluent)
• Nitrate (Zones A, B & D)
• Ammonia (D)
• Phosphorus (Plant Influent Denite Filter Influent
& Plant Effluent)

Imagine the result
Operation & Monitoring DO and Air Flow Control
Target Parameters
Parameter Zone A Zone B P - Removal
Zone B Winter
Zone C
ORP - 50 to -450 -300 to -450 -50 to +100 --
DO 0 to 0.2 mg/l 0 to 0.2 mg/l 2 to 3 mg/l 3 mg/l
Nitrate 0 to 10 mg/l 0 to 2 mg/l 0 to 10 5 to 20 mg/l
Ammonia >20 mg/l >25 mg/l >20 0 to 10 mg/l
43

Imagine the result
Operation & Monitoring DO and Air Flow Control
Target Parameters
Parameter Zone D Bioreactor Reaeration Tank
ORP -- -50 to +100 --
DO 2 mg/l 0 to 3 mg/l 2 to 3 mg/l
Nitrate 0 to 4 mg/l 0 to 4 mg/l 0 to 4 mg/l
Ammonia <5 mg/l <5 mg/l <5 mg/l
44

45
Operation & Monitoring IMLR Control
Parameter Value Comment
IMLR Pumps
Return Rate
% Return Rate
of Plant Influent Flow
100 to 300%
0% to 100%
Pumps Off
Influent Flow < 9.0
MGD
Influent Flow 9.0
to 12.5 MGD
Influent Flow >12.5 MGD

46
Imagine the result
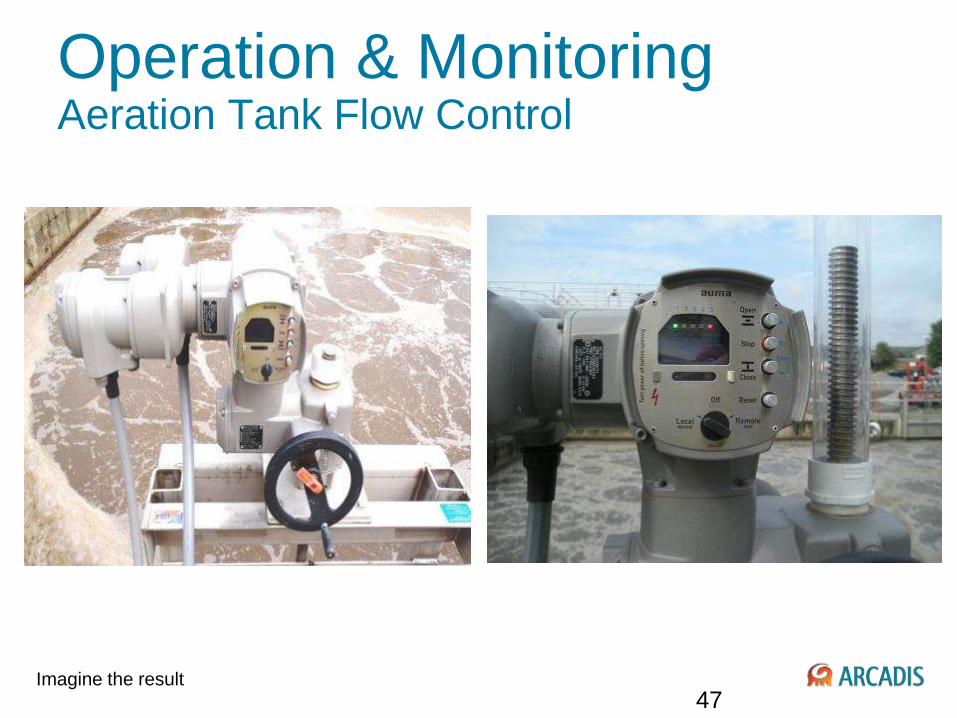
Operation & Monitoring Aeration Tank Flow Control
47
Imagine the result
Operation & Monitoring Aeration Tank Gates & Flow Control
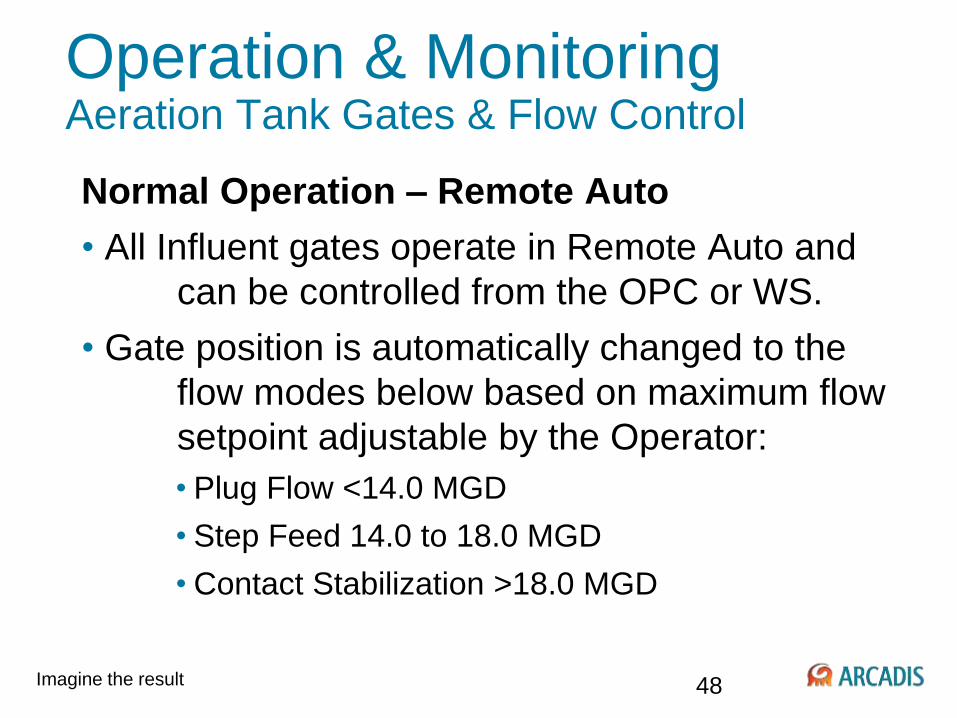
Normal Operation – Remote Auto
• All Influent gates operate in Remote Auto and
can be controlled from the OPC or WS.
• Gate position is automatically changed to the
flow modes below based on maximum flow
setpoint adjustable by the Operator:
• Plug Flow <14.0 MGD
• Step Feed 14.0 to 18.0 MGD
• Contact Stabilization >18.0 MGD
48

49
Operation & Monitoring
50
Operation & Monitoring

51
Operation & Monitoring

52

53
Process Monitoring & Control System
OPC OWS

54
• Overview of Central Plant
• Flow Pattern
• Biological Nutrient Removal
• Design Criteria
• Startup Planning
• Operation & Monitoring
• Optimization
Agenda

55
On Going:
• Created a tiered TN loading target
• Assist with BNR operation
• Aeration tanks and bioreactors
• Denitrification filters
• Continue to confirm the Bio Win Model
• Update Normal and Wet Weather BNR
Operation and Denitrification SOPs
• Assist WSA in fine-tuning operations and
SCADA control schemes
Optimization

56
Optimization

57
Questions?