operating budget data - maryland general...
TRANSCRIPT

J00H01
Maryland Transit Administration Maryland Department of Transportation
Note: Numbers may not sum to total due to rounding. For further information contact: Steven D. McCulloch Phone: (410) 946-5530
Analysis of the FY 2018 Maryland Executive Budget, 2017 1
Operating Budget Data
($ in Thousands)
FY 16 FY 17 FY 18 FY 17-18 % Change
Actual Working Allowance Change Prior Year
Special Fund $722,830 $728,191 $768,874 $40,682 5.6%
Adjustments 0 0 -248 -248
Adjusted Special Fund $722,830 $728,191 $768,626 $40,434 5.6%
Federal Fund 58,940 59,501 59,501 0
Adjusted Federal Fund $58,940 $59,501 $59,501 $0 0.0%
Adjusted Grand Total $781,769 $787,692 $828,127 $40,434 5.1%
Note: Includes targeted reversions, deficiencies, and contingent reductions.
The fiscal 2018 Maryland Transit Administration (MTA) adjusted allowance is $40.4 million
(5.1%) higher than the current year working appropriation.
Section 19 of the fiscal 2018 budget bill makes reductions to funding for pension contributions
contingent on provisions in the Budget Reconciliation and Financing Act of 2017. This provision
will reduce the MTA fiscal 2018 budget by $248,000.
PAYGO Capital Budget Data
($ in Thousands)
Fiscal 2016 Fiscal 2017 Fiscal 2018
Actual Legislative Working Allowance
Special $244,639 $217,472 $235,315 $278,227
Federal $145,349 $457,758 $400,708 $356,051
Total $389,987 $675,230 $636,023 $634,278

J00H01 – MDOT – Maryland Transit Administration
Analysis of the FY 2018 Maryland Executive Budget, 2017 2
The fiscal 2017 working appropriation is a net $39.2 million lower than the legislative
appropriation. This does not include “other funds” that do not flow through MTA’s budget but
that support some of MTA’s capital projects. Special funds increase by $17.8 million but are more
than offset by a decrease in federal funds of $57.1 million. Some of the larger changes include:
$10.4 million – Kirk Bus Facility Replacement;
-$10.5 million – Purple Line;
-$10.6 million – Light Rail Vehicle Overhaul;
-$13.0 million – Maryland Area Regional Commuter (MARC) Locomotives Overhauls and
Replacements; and
-$20.5 million – Purple Line – Montgomery County Funded Projects.
The fiscal 2018 allowance decreases a net $1.7 million from the current year working
appropriation, exclusive of other funds. An increase in special funds of $42.9 million is more than
offset by a federal fund decrease of $44.7 million. Some of the larger changes include:
$26.5 million – Light Rail Vehicle Overhaul;
$21.4 million – Metro Railcar and Signal System Overhauls and Replacement;
$18.5 million – MARC Locomotives Overhauls and Replacements;
-$14.5 million – Kirk Bus Facility Replacement;
-$15.4 million – Metro Safety Improvements; and
-$52.0 million – Purple Line.

J00H01 – MDOT – Maryland Transit Administration
Analysis of the FY 2018 Maryland Executive Budget, 2017 3
Operating and PAYGO Personnel Data
FY 16 FY 17 FY 18 FY 17-18
Actual Working Allowance Change
Regular Operating Budget Positions
3,263.50
3,297.50
3,279.50
-18.00
Regular PAYGO Budget Positions
94.00 92.00 88.00 -4.00
Total Regular Positions 3,357.50 3,389.50 3,367.50 -22.00
Operating Budget FTEs 16.00 16.00 16.00 0.00
PAYGO Budget FTEs 0.00 0.00 0.00 0.00
Total FTEs 16.00 16.00 16.00 0.00
Total Personnel 3,373.50 3,405.50 3,383.50 -22.00
Vacancy Data: Regular Positions
Turnover and Necessary Vacancies, Excluding New
Positions 94.62 3.02%
Positions and Percentage Vacant as of 1/1/17 182.00 5.4%
Regular positions decrease by 22.0 in the fiscal 2018 budget compared to the current year working
appropriation. This reduction results from the abolition of vacant positions as part of the Maryland
Department of Transportation’s long-term cost containment efforts.
Contractual full-time equivalents remain unchanged between the current year working
appropriation and the fiscal 2018 allowance.
As of January 1, 2017, there were 182.0 vacant positions (excluding vacant positions being
abolished in fiscal 2018) for a vacancy rate of 5.4%. Turnover in the fiscal 2018 allowance is
budgeted at 3.02%, which will require that an average of 94.6 positions remain vacant the entire
year.

J00H01 – MDOT – Maryland Transit Administration
Analysis of the FY 2018 Maryland Executive Budget, 2017 4
Analysis in Brief
Major Trends
Boardings Decrease in Fiscal 2016: For all modes of MTA service, there were 110.7 million
boardings in fiscal 2016, representing a 4.6% decrease from the prior year.
On-time Performance: For the first time, going back to at least fiscal 2005, all modes met or exceeded
the on-time performance goal.
Farebox Recovery: The farebox recovery rates improved in fiscal 2016 for all modes except MARC
service, which remained unchanged from the prior year. Despite these improvements, no mode other
than MARC met the 35% requirement set in statute.
Transit Performance Measures: Passengers per revenue vehicle mile declined in fiscal 2016 from a
year prior for core bus, light rail, and Metro. Operating expenses per passenger trip were higher for all
modes; however, operating expenses per revenue vehicle mile declined for all three modes from
fiscal 2015 levels.
Peer Performance: MTA’s performance on operating expenses per vehicle revenue mile, operating
expenses per passenger trip, and passenger trips per vehicle revenue mile for local bus service
compared favorably to its nationwide peers based on fiscal 2015 data.
Issues
Collective Bargaining Agreement Includes Annual Cost-of-living Increases, Requires Employee
Pension Contribution: On May 22, 2016, a Memorandum of Understanding between MTA and its
largest union was executed amending the Collective Bargaining Agreement (CBA) that had expired on
June 30, 2014. The amended CBA is covering the period from July 1, 2014, through June 30, 2018,
and includes pay increases (with retroactive requirements) and a requirement for the first time that
union employees contribute 2% of their gross pay to the MTA Pension Plan. MTA should brief the
committees on when it expects to process the budget amendment to cover the retroactive pay or
if it intends to request a supplemental deficiency appropriation for this purpose. MTA should
also discuss with the committees the impediments to negotiating a new agreement prior to the
expiration of the current one and what actions it can take to remove these impediments.
Fare Increase Due: Statute requires MTA, beginning in fiscal 2015 and on a biennial basis thereafter,
to increase base fares and the cost of multiuse passes to the nearest 10¢ for core transit services, by the
same percentage as the biennial increase in the Consumer Price Index (CPI) for all urban consumers.
Fare increases for MARC are required every five years based on the five-year increase in the CPI.
Under these provisions, MTA must increase fares before the end of the current fiscal year. MTA
should inform the committee of when the new rates will be effective and when they will be
announced to the public.

J00H01 – MDOT – Maryland Transit Administration
Analysis of the FY 2018 Maryland Executive Budget, 2017 5
Operating Budget Recommended Actions
1. Concur with Governor’s allowance.
PAYGO Budget Recommended Actions
1. Concur with Governor’s allowance.
Updates
BaltimoreLink Transit Initiative on Track: In October 2015, MTA announced the beginning of a
$135 million, multi-phase initiative to improve transit services in the Baltimore region called
BaltimoreLink. Full implementation, planned for June 2017, is to include a redesign of local and
express bus routes, new and enhanced commuter bus service, the creation of 12 high-frequency routes
along major arterials connecting to downtown, and 5 new suburb-to-suburb express bus routes.
Existing transit services are renamed with “Link” appended to denote each service being part of a
greater transit network. MTA held the required public hearings for the local bus route changes in
January 2017. Implementation of the new local routes is still scheduled for June 2017.

J00H01 – MDOT – Maryland Transit Administration
Analysis of the FY 2018 Maryland Executive Budget, 2017 6

J00H01
Maryland Transit Administration Maryland Department of Transportation
Analysis of the FY 2018 Maryland Executive Budget, 2017 7
Budget Analysis
Program Description
The Maryland Department of Transportation supports transit in Maryland through the
Maryland Transit Administration (MTA). MTA consists of the following operating budget programs:
Transit Administration provides executive direction and support services for MTA.
Bus Operations manages bus services in Baltimore City and surrounding counties. These
services include the operation of fixed route and paratransit lines and contracts with commuter
and paratransit service providers.
Rail Operations includes the Baltimore Metro heavy rail line and the Baltimore area light rail
line as well as the management of the Maryland Area Regional Commuter (MARC) contracts
with Amtrak and Bombardier.
Statewide Operations provides technical assistance and operating grants to local jurisdictions’
transit services, including Montgomery County’s “Ride-On,” Prince George’s County’s
“the Bus,” and Baltimore City’s “Charm City Circulator” services. Additionally, the program
contracts with private carriers to operate commuter bus services throughout the State.
Assistance is also provided to several short-line freight railroads to support the maintenance of
State-owned rail lines.
MTA has identified the following goals:
to provide outstanding service;
to encourage transit ridership in Maryland;
to use MTA resources efficiently and effectively and be accountable to the public, customers,
and employees with performance measured against prior years; and
to provide a safe environment for customers and employees.

J00H01 – MDOT – Maryland Transit Administration
Analysis of the FY 2018 Maryland Executive Budget, 2017 8
Performance Analysis: Managing for Results
1. Boardings Decrease in Fiscal 2016
MTA has a goal to encourage transit ridership. One method of measuring transit ridership is the
number of boardings that occur during a specified period. For all modes of MTA service, there were
110.7 million boardings in fiscal 2016 representing a 4.6% decrease from the prior year. Exhibit 1 shows
the percent change in boardings from the prior year for fiscal 2012 through 2016. Core bus services, which
accounted for 68.3% of all boardings in fiscal 2016, decreased by 3.9% from the prior year. Boardings
were down for all services in fiscal 2016 except for Mobility (4.6%). MTA should brief the committees
on the factors that contributed to the decreased boardings in fiscal 2016.
Exhibit 1
Percent Change in MTA Boardings Fiscal 2012-2016
MARC: Maryland Area Regional Commuter MTA: Maryland Transit Administration
Source: Department of Budget and Management
-3.9%
-12.1%
-3.0%
4.6%
-4.7%-3.1% -2.6%
-4.6%
-15%
-10%
-5%
0%
5%
10%
15%
20%
25%
30%
Bus Metro Light Rail Mobility TaxiAccess MARC Commuter
Bus
Total
2012 2013 2014 2015 2016

J00H01 – MDOT – Maryland Transit Administration
Analysis of the FY 2018 Maryland Executive Budget, 2017 9
2. On-time Performance
As part of its goal to provide outstanding service to customers, MTA attempts to provide high
on-time performance with goals of 85% on-time performance for core bus service, 95% for Metro and
light rail service, 93% for MARC service, and 92% for mobility services. Exhibit 2 shows the percent
of on-time service by mode for fiscal 2012 through 2016. For the first time, going back to at least
fiscal 2005, all modes met or exceeded the on-time performance goal. For bus and MARC service, it
was only the third time this goal was met since fiscal 2005 and for mobility it was only the second time.
Metro and light rail service has met or exceeded the on-time goal every year going back to fiscal 2007.
Exhibit 2
On-time Performance Fiscal 2012-2016
MARC: Maryland Area Regional Commuter
Source: Department of Budget and Management
0 5 10 15 20 25 30
0
0.1
0.2
0.3
0.4
0.5
0.6
0.7
0.8
0.9
1
Bus Metro Light Rail MARC Mobility
2012 2013 2014 2015 2016 Goal

J00H01 – MDOT – Maryland Transit Administration
Analysis of the FY 2018 Maryland Executive Budget, 2017 10
3. Farebox Recovery
Section 7-208 of the Transportation Article sets the statutory farebox recovery rate at 35% for
Baltimore area core services and MARC service. Exhibit 3 shows the farebox recovery rates by mode
of transit and for the Baltimore area services as a whole for fiscal 2012 through 2016. The farebox
recovery rates improved in fiscal 2016 for all modes except MARC service, which remained unchanged
from the prior year. Despite these improvements, no mode other than MARC met the 35% requirement
set in statute. The MARC farebox recovery rate of 44% in fiscal 2016, while still well above the 35%
threshold, remained well below its 10-year average of 51%.
Exhibit 3
Farebox Recovery Rates Fiscal 2012-2016
MARC: Maryland Area Regional Commuter
Source: Department of Budget and Management
Baltimore Area
Services
Baltimore
Core/
Commuter Bus
Metro Light Rail MARCWashington
Commuter Bus
2012 27% 29% 28% 16% 56% 28%
2013 27% 30% 26% 16% 55% 25%
2014 28% 28% 24% 16% 50% 33%
2015 25% 28% 21% 16% 44% 30%
2016 26% 29% 23% 18% 44% 34%
Goal 35% 35% 35% 35% 35% 35%
0%
10%
20%
30%
40%
50%
60%
J00H01 – MDOT – Maryland Transit Administration
Analysis of the FY 2018 Maryland Executive Budget, 2017 11
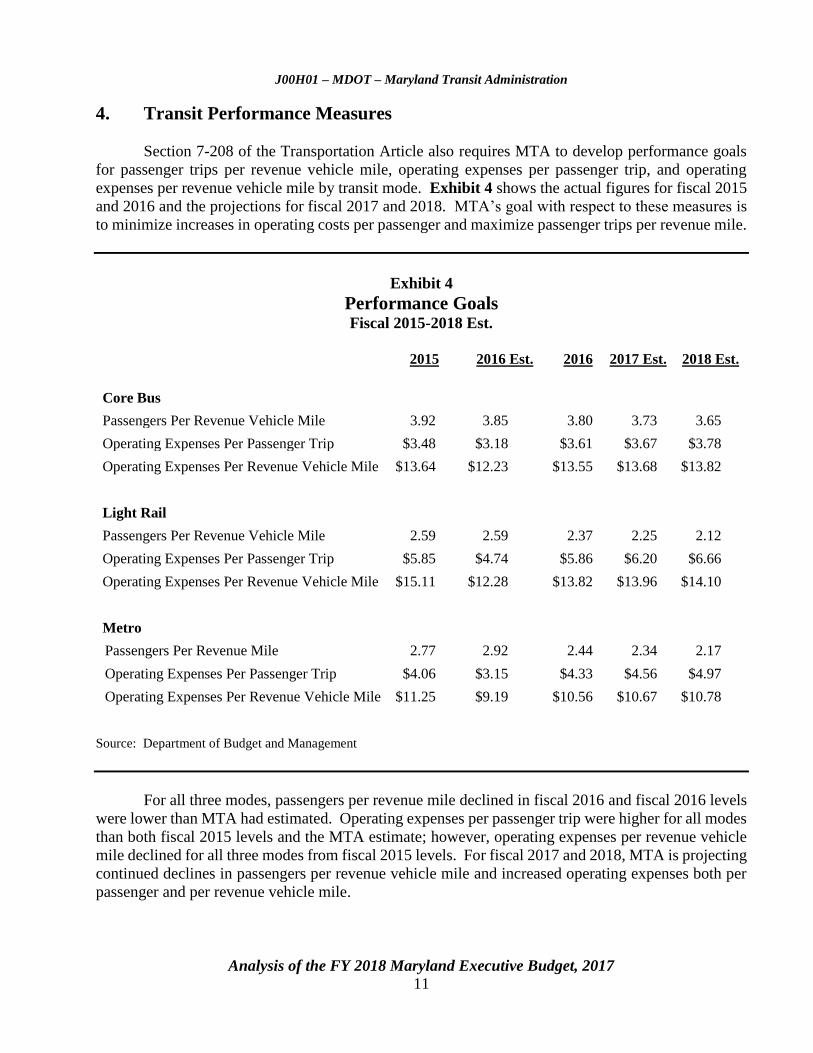
4. Transit Performance Measures
Section 7-208 of the Transportation Article also requires MTA to develop performance goals
for passenger trips per revenue vehicle mile, operating expenses per passenger trip, and operating
expenses per revenue vehicle mile by transit mode. Exhibit 4 shows the actual figures for fiscal 2015
and 2016 and the projections for fiscal 2017 and 2018. MTA’s goal with respect to these measures is
to minimize increases in operating costs per passenger and maximize passenger trips per revenue mile.
Exhibit 4
Performance Goals Fiscal 2015-2018 Est.
2015 2016 Est. 2016 2017 Est. 2018 Est.
Core Bus
Passengers Per Revenue Vehicle Mile 3.92 3.85 3.80 3.73 3.65
Operating Expenses Per Passenger Trip $3.48 $3.18 $3.61 $3.67 $3.78
Operating Expenses Per Revenue Vehicle Mile $13.64 $12.23 $13.55 $13.68 $13.82
Light Rail
Passengers Per Revenue Vehicle Mile 2.59 2.59 2.37 2.25 2.12
Operating Expenses Per Passenger Trip $5.85 $4.74 $5.86 $6.20 $6.66
Operating Expenses Per Revenue Vehicle Mile $15.11 $12.28 $13.82 $13.96 $14.10
Metro
Passengers Per Revenue Mile 2.77 2.92 2.44 2.34 2.17
Operating Expenses Per Passenger Trip $4.06 $3.15 $4.33 $4.56 $4.97
Operating Expenses Per Revenue Vehicle Mile $11.25 $9.19 $10.56 $10.67 $10.78
Source: Department of Budget and Management
For all three modes, passengers per revenue mile declined in fiscal 2016 and fiscal 2016 levels
were lower than MTA had estimated. Operating expenses per passenger trip were higher for all modes
than both fiscal 2015 levels and the MTA estimate; however, operating expenses per revenue vehicle
mile declined for all three modes from fiscal 2015 levels. For fiscal 2017 and 2018, MTA is projecting
continued declines in passengers per revenue vehicle mile and increased operating expenses both per
passenger and per revenue vehicle mile.

J00H01 – MDOT – Maryland Transit Administration
Analysis of the FY 2018 Maryland Executive Budget, 2017 12
5. Peer Performance
MTA is required by statute to submit an annual report that compares MTA to other similar
transit systems nationwide. Exhibit 5 shows this comparison for local bus systems for operating
expenses per vehicle revenue mile, operating expenses per passenger trip, and passenger trips per
vehicle revenue mile based on fiscal 2015 data. MTA’s performance on these measures compares
favorably to its peers with its operating expenses, both per vehicle revenue mile and per passenger trip
are lower than the average for the group, and its passenger trips per vehicle revenue mile are higher
than the group average.
Exhibit 5
Performance Indicators for MTA and Peer Local Bus Service Fiscal 2015
Operating Expenses Per
Vehicle Revenue Mile
Operating Expenses
Per Passenger Trip
Passenger Trips Per
Vehicle Revenue Mile
Baltimore $13.64
$3.48
3.9
Average 14.04
5.14
3.1
Atlanta 9.37
3.45
2.7
Dallas 8.54
6.42
1.3
Houston 9.24
5.35
1.7
New York 30.38
3.58
8.5
Pittsburgh 15.57
7.28
2.7
San Jose 15.88
7.25
2.1
Seattle 13.88
4.44
3.1
Utah 7.63
5.44
1.4
Washington, DC 16.24
4.66
3.5
MTA: Maryland Transit Administration
Source: Maryland Transit Administration; National Transit Database

J00H01 – MDOT – Maryland Transit Administration
Analysis of the FY 2018 Maryland Executive Budget, 2017 13
Fiscal 2017 Actions
Section 20 Position Abolitions
Section 20 of the fiscal 2017 budget bill required the Governor to abolish 657 vacant positions.
Pursuant to this section, 55 MTA positions were abolished. Exhibit 6 lists the positions abolished by
job title.
Exhibit 6
Fiscal 2017 Budget Bill Section 20 Position Reductions
Job Title Reduction
Administrative Officer III 1
Administrator II 1
A-Repairman 4
A-Repairman Bus 2
A-Repairman Plumber 1
A-Repairman Rail 4
A-Repairman Track and Way 1
B-Repairman 3
B-Repairman Bus 2
Bus Operator 5
Civilian Uniformed Personnel 2
Cost Price Clerk 1
C-Repairman 3
C-Repairman Bus 1
Dispatcher 1
Electric Technician 1
Executive Project Director New Starts – Capital 1
Information Services Clerk 4
Information Technology Programmer Analyst Supervisor 1
Payroll Clerk 1
Personnel Officer I 1
Planner V – Capital 1
Senior Transit Analyst 1
Starter 1
Superintendent – Transportation 2
Supervisor Service and Inspection 1
Supervisor Systems Maintenance 1
Supervisor Transportation 3
Technician Rail 4
Total 55
Source: Department of Budget and Management

J00H01 – MDOT – Maryland Transit Administration
Analysis of the FY 2018 Maryland Executive Budget, 2017 14
Proposed Budget
As shown in Exhibit 7, MTA’s fiscal 2018 allowance is $40.4 million higher than the current
year working appropriation. Personnel expenses increase by a net $17.2 million driven primarily by
salary increases required by the Collective Bargaining Agreement reached in May 2016. For
nonpersonnel expenses, bus and rail operations each contribute just over $8.0 million to the increase
with transit administration adding another $5.7 million, and statewide operations increasing by
$1.2 million to reflect operating costs for the newly opened Takoma Park/Langley transit center.
Exhibit 7
Proposed Budget MDOT – Maryland Transit Administration
($ in Thousands)
How Much It Grows:
Special
Fund
Federal
Fund
Total
Fiscal 2016 Actual $722,830 $58,940 $781,769
Fiscal 2017 Working Appropriation 728,191 59,501 787,692
Fiscal 2018 Allowance 768,626 59,501 828,127
Fiscal 2017-2018 Amount Change $40,434 $0 $40,434
Fiscal 2017-2018 Percent Change 5.6% 5.1%
Where It Goes:
Personnel Expenses
Union Collective Bargaining Agreement costs ............................................................. $13,936
Union health insurance subsidies .................................................................................. 2,974
BaltimoreLink position expense annualization and overtime ....................................... 1,900
Turnover adjustments .................................................................................................... 314
Employee and retiree health insurance .......................................................................... -153
Workers’ compensation ................................................................................................. -207
Accrued leave payout .................................................................................................... -379
Vacant position abolitions ............................................................................................. -1,112
Other fringe benefit adjustments ................................................................................... -35
Transit Administration 0
Software system maintenance – police closed circuit television system ....................... 3,317
Automated fare collection system contract ................................................................... 1,000
Software system maintenance information technology contracts ................................. 600
Office assistance ............................................................................................................ 468
Transit insurance claims adjuster contract .................................................................... 360
Rent paid to the Department of General Services ......................................................... 106

J00H01 – MDOT – Maryland Transit Administration
Analysis of the FY 2018 Maryland Executive Budget, 2017 15
Where It Goes:
Computer maintenance contracts .................................................................................. 97
Office of Administrative Hearings allocated costs ........................................................ 29
Vehicle insurance allocated costs .................................................................................. -17
Contractual health insurance ......................................................................................... -56
Insurance allocated cost................................................................................................. -205
Bus Operations 0
Washington commuter bus service ................................................................................ 4,041
Vehicle maintenance and repair .................................................................................... 3,300
Paratransit contact increases .......................................................................................... 2,567
Tire contact escalation ................................................................................................... 2,000
BaltimoreLink Eco-Seal seat cushion stain resistance coating ..................................... 1,100
BaltimoreLink schedule analysis network design contract ........................................... 1,100
System software maintenance – computer aided dispatch/automatic vehicle locator ... 435
Grounds maintenance – snow removal.......................................................................... 381
Office assistance ............................................................................................................ 261
Natural gas/propane ....................................................................................................... -142
Electricity ...................................................................................................................... -269
Diesel fuel based on actual mileage and current prices ................................................. -6,689
Rail Operations 0
Maryland Area Regional Commuter third-party contract cost escalation ..................... 7,231
Maryland Area Regional Commuter contract cost escalation ....................................... 2,674
Electricity ...................................................................................................................... 582
Grounds maintenance – snow removal.......................................................................... 173
Office assistance ............................................................................................................ 171
Natural gas/propane ....................................................................................................... -135
Diesel fuel based on actual mileage and current prices ................................................. -2,483
Statewide Operations 0
Takoma Park/Langley transit center operations and maintenance contract .................. 1,211
Other Changes .................................................................................................................... -12
Total $40,434
MDOT: Maryland Department of Transportation
Note: Numbers may not sum to total due to rounding.

J00H01 – MDOT – Maryland Transit Administration
Analysis of the FY 2018 Maryland Executive Budget, 2017 16
Potential Underfunding
Two areas of the MTA budget have historically experienced significant underfunding. The first
is salary and benefit funding for its union workforce during periods in which Collective Bargaining
Agreements (CBA) are not in effect. The second area where underfunding has occurred is in funding
for mobility services where the amount included in the allowance was less than the amount actually
spent in the most recently ended fiscal year. Neither of these situations apply to the fiscal 2018 budget.
MTA has signed an agreement with two of its three unions covering 93% of its union workforce.
Funding for mobility services is higher by $3.3 million in the current year compared to the fiscal 2016
actual and the allowance increases funding for mobility services by an additional $2.5 million.
The fiscal 2017 budget does not yet, however, reflect the retroactive pay due to union members
to cover pay increases agreed to in the CBA for fiscal 2015 through 2017 (See Issue 1). MTA has a
projected $24.5 million projected budget amendment for fiscal 2017 to provide retroactive pay to union
members as well as to cover other operating expenses. Some or all of this funding could be included
as a supplemental deficiency instead of a budget amendment.
Across-the-board Reductions
The fiscal 2018 budget bill includes a $54.5 million (all funds) across-the-board contingent
reduction for a supplemental pension payment. Annual payments are mandated for fiscal 2017 through
2020 if the Unassigned General Fund balance exceeds a certain amount at the close of the fiscal year.
MTA’s share of these reductions is $247,631 in special funds. This action is tied to a provision in the
Budget Reconciliation and Financing Act of 2017.

J00H01 – MDOT – Maryland Transit Administration
Analysis of the FY 2018 Maryland Executive Budget, 2017 17
PAYGO Capital Program
Program Description
MTA’s capital program provides funds to support the design, construction, rehabilitation, and
acquisition of facilities and equipment for bus, rail, and statewide programs. The program also provides
State and federal grants to local jurisdictions and nonprofit organizations to support the purchase of
transit vehicles and the construction of transit facilities.
Fiscal 2017 to 2022 Consolidated Transportation Program
The fiscal 2017 to 2022 six-year capital program for MTA totals $3.7 billion (including
“other funding” that does not flow through the MTA budget), a decrease of $86.1 million from the prior
year six-year program. Six-year funding decreases for major projects (-$141.3 million) and the
development and evaluation program (-$5.9 million) while system preservation and minor project
funding increases by $61.7 million. Exhibit 8 shows the programmed spending by category for
fiscal 2017 to 2022.
Exhibit 8
Programmed Spending by Category Fiscal 2017-2022
($ in Millions)
D&E: development and evaluation
Source: Maryland Department of Transportation, 2017-2022 Consolidated Transportation Program
2017 2018 2019 2020 2021 2022
Capital Salaries, Wages, and Other $14.1 $13.0 $12.5 $12.5 $12.5 $12.5
D&E Program 0.7 5.1 3.2 0.0 0.0 0.0
System Preservation Minor Projects 86.5 66.3 51.3 56.7 53.7 110.6
Major Projects 589.9 609.6 737.5 385.1 313.9 510.8
Total $691.2 $694.0 $804.5 $454.3 $380.1 $633.9
$0
$100
$200
$300
$400
$500
$600
$700
$800
$900

J00H01 – MDOT – Maryland Transit Administration
Analysis of the FY 2018 Maryland Executive Budget, 2017 18
Fiscal 2018 PAYGO Capital Allowance
MTA’s capital program for fiscal 2018, including other funds that do not flow through MTA’s
budget, totals $694.0 million, an increase of $2.8 million over the current year working appropriation.
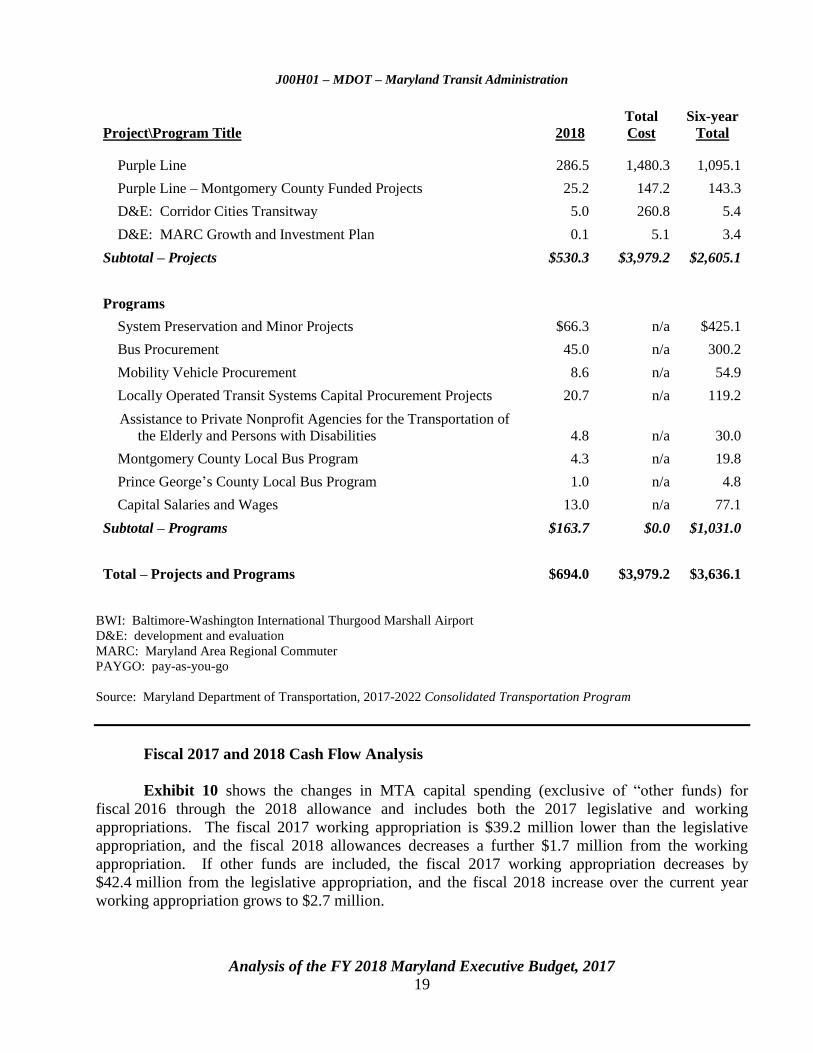
Exhibit 9 shows the programmed fiscal 2018 capital spending by project and program along with the
estimated total project costs and six-year funding included in the Consolidated Transportation Program
(CTP).
Exhibit 9
Maryland Transit Administration PAYGO Capital Fiscal 2018
($ in Millions)
Project\Program Title 2018
Total
Cost
Six-year
Total
Projects
MARC Maintenance, Layover, and Storage Facility $1.5 $43.9 $42.3
MARC Improvements on Camden, Brunswick, and Penn Lines 20.2 316.7 144.9
MARC Coaches – Overhauls and Replacement 10.0 224.4 57.3
MARC Locomotives – Overhauls and Replacements 20.0 73.5 55.0
MARC Positive Train Control 5.8 16.6 9.0
MARC BWI Station Upgrades and Repairs 2.6 13.8 8.6
Homeland Security 1.4 18.1 6.5
Freight Bridge Rehabilitation 1.6 26.7 10.0
Light Rail Vehicle Overhaul 48.9 196.7 123.6
Light Rail Safety Improvements 4.6 39.2 36.0
Metro Railcar and Signal System Overhauls and Replacement 32.3 578.6 467.7
Metro Safety Improvements 4.0 67.6 57.8
Kirk Bus Facility Replacement 4.4 157.5 90.8
Bus Communications Systems Upgrade 11.0 45.1 38.4
Bus Network Improvements 13.7 36.9 34.0
North Avenue Rising 7.9 27.3 27.3
Montgomery County Bus Rapid Transit 9.0 40.5 40.5
Fare Collection System Enhancements and Equipment Preservation 4.0 61.7 17.6
Agencywide Roof Replacement Program 3.5 30.7 20.5
Agencywide Elevator and Escalator Rehabilitation 0.3 40.0 40.0
Agencywide Radio and Telecommunications Upgrade 6.5 30.2 30.0
J00H01 – MDOT – Maryland Transit Administration
Analysis of the FY 2018 Maryland Executive Budget, 2017 19
Project\Program Title 2018
Total
Cost
Six-year
Total
Purple Line 286.5 1,480.3 1,095.1
Purple Line – Montgomery County Funded Projects 25.2 147.2 143.3
D&E: Corridor Cities Transitway 5.0 260.8 5.4
D&E: MARC Growth and Investment Plan 0.1 5.1 3.4
Subtotal – Projects $530.3 $3,979.2 $2,605.1
Programs
System Preservation and Minor Projects $66.3 n/a $425.1
Bus Procurement 45.0 n/a 300.2
Mobility Vehicle Procurement 8.6 n/a 54.9
Locally Operated Transit Systems Capital Procurement Projects 20.7 n/a 119.2
Assistance to Private Nonprofit Agencies for the Transportation of
the Elderly and Persons with Disabilities 4.8 n/a 30.0
Montgomery County Local Bus Program 4.3 n/a 19.8
Prince George’s County Local Bus Program 1.0 n/a 4.8
Capital Salaries and Wages 13.0 n/a 77.1
Subtotal – Programs $163.7 $0.0 $1,031.0
Total – Projects and Programs $694.0 $3,979.2 $3,636.1
BWI: Baltimore-Washington International Thurgood Marshall Airport
D&E: development and evaluation
MARC: Maryland Area Regional Commuter
PAYGO: pay-as-you-go
Source: Maryland Department of Transportation, 2017-2022 Consolidated Transportation Program
Fiscal 2017 and 2018 Cash Flow Analysis
Exhibit 10 shows the changes in MTA capital spending (exclusive of “other funds) for
fiscal 2016 through the 2018 allowance and includes both the 2017 legislative and working
appropriations. The fiscal 2017 working appropriation is $39.2 million lower than the legislative
appropriation, and the fiscal 2018 allowances decreases a further $1.7 million from the working
appropriation. If other funds are included, the fiscal 2017 working appropriation decreases by
$42.4 million from the legislative appropriation, and the fiscal 2018 increase over the current year
working appropriation grows to $2.7 million.

J00H01 – MDOT – Maryland Transit Administration
Analysis of the FY 2018 Maryland Executive Budget, 2017 20
Exhibit 10
Cash Flow Changes Fiscal 2016-2018 Allowance
($ in Millions)
Source: Maryland State Budget, Volume I
Cash Flow Analysis – Fiscal 2017 Changes
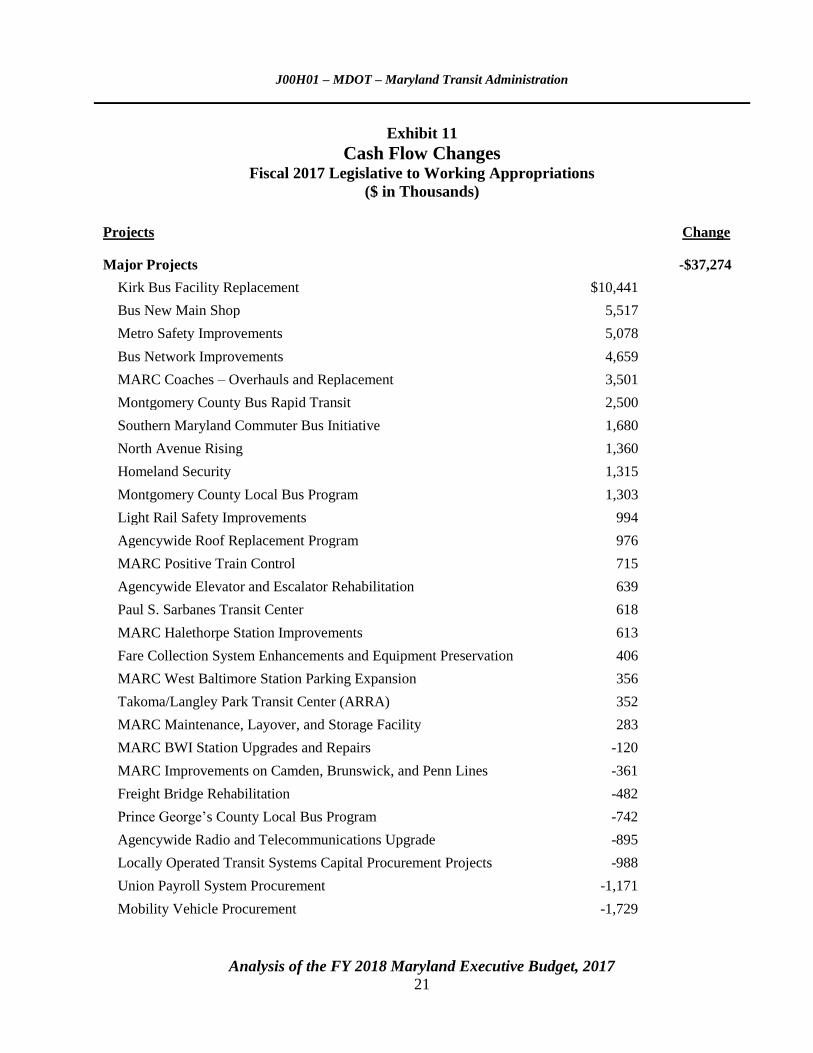
As seen in Exhibit 11, the net decrease of $42.4 million (including other funds) between the
fiscal 2017 legislative and working appropriations comprises reductions in major projects
(-$37.3 million) and development and evaluation projects (-$22.7 million) partially offset by increases
in funding for system preservation and minor projects ($16.0 million) and capital salaries and wages
($1.6 million).
$0
$100
$200
$300
$400
$500
$600
$700
$800
2016 2017
Legislative
2017
Working
2018
Allowance
Special Fund Federal Fund
J00H01 – MDOT – Maryland Transit Administration
Analysis of the FY 2018 Maryland Executive Budget, 2017 21
Exhibit 11
Cash Flow Changes Fiscal 2017 Legislative to Working Appropriations
($ in Thousands)
Projects Change
Major Projects -$37,274
Kirk Bus Facility Replacement $10,441
Bus New Main Shop 5,517
Metro Safety Improvements 5,078
Bus Network Improvements 4,659
MARC Coaches – Overhauls and Replacement 3,501
Montgomery County Bus Rapid Transit 2,500
Southern Maryland Commuter Bus Initiative 1,680
North Avenue Rising 1,360
Homeland Security 1,315
Montgomery County Local Bus Program 1,303
Light Rail Safety Improvements 994
Agencywide Roof Replacement Program 976
MARC Positive Train Control 715
Agencywide Elevator and Escalator Rehabilitation 639
Paul S. Sarbanes Transit Center 618
MARC Halethorpe Station Improvements 613
Fare Collection System Enhancements and Equipment Preservation 406
MARC West Baltimore Station Parking Expansion 356
Takoma/Langley Park Transit Center (ARRA) 352
MARC Maintenance, Layover, and Storage Facility 283
MARC BWI Station Upgrades and Repairs -120
MARC Improvements on Camden, Brunswick, and Penn Lines -361
Freight Bridge Rehabilitation -482
Prince George’s County Local Bus Program -742
Agencywide Radio and Telecommunications Upgrade -895
Locally Operated Transit Systems Capital Procurement Projects -988
Union Payroll System Procurement -1,171
Mobility Vehicle Procurement -1,729

J00H01 – MDOT – Maryland Transit Administration
Analysis of the FY 2018 Maryland Executive Budget, 2017 22
Projects Change
Assistance to Private Nonprofit Agencies for the Transportation of the
Elderly and Persons with Disabilities -1,994
Bus Procurement -4,886
Bus Communications Systems Upgrade -5,504
Metro Railcar and Signal System Overhauls and Replacement -7,185
Purple Line -10,487
Light Rail Vehicle Overhaul -10,597
MARC Locomotives – Overhauls and Replacements -12,955
Purple Line – Montgomery County Funded Projects -20,484
Development and Evaluation Projects -$22,728
MARC Growth and Investment Plan -$1,119
Southern Maryland Mass Transportation Analysis -1,331
MARC Northeast Maintenance Facility -7,653
Corridor Cities Transitway -12,625
System Preservation and Minor Projects $16,000
Capital Salaries and Wages $1,600
Total Change -$42,402
ARRA: American Recovery and Reinvestment Act of 2009
BWI: Baltimore-Washington International Thurgood Marshall Airport
MARC: Maryland Area Regional Commuter
Source: Maryland Department of Transportation, 2016-2021 and 2017-2022 Consolidated Transportation Programs
Cash Flow Analysis – Fiscal 2017 to 2018 Changes
As shown in Exhibit 12, the fiscal 2018 capital appropriation increases by a net $2.7 million
(including other funds) over the current year working appropriation. Funding increases for major
projects ($19.7 million) and development and evaluation projects ($4.3 million) are partially offset by
decreases in funding for system preservation and minor projects (-$20.2 million) and capital salaries
and wages (-$1.1 million).

J00H01 – MDOT – Maryland Transit Administration
Analysis of the FY 2018 Maryland Executive Budget, 2017 23
Exhibit 12
Cash Flow Changes Fiscal 2017 Working Appropriation to Fiscal 2018 Allowance
($ in Thousands)
Projects Change
Major Projects $19,717
Light Rail Vehicle Overhaul $26,499
Metro Railcar and Signal System Overhauls and Replacement 21,438
MARC Locomotives – Overhauls and Replacements 18,500
Mobility Vehicle Procurement 7,702
MARC Improvements on Camden, Brunswick, and Penn Lines 7,154
Bus Communications Systems Upgrade 6,852
North Avenue Rising 6,510
Montgomery County Bus Rapid Transit 6,500
Agencywide Radio and Telecommunications Upgrade 5,385
Purple Line – Montgomery County Funded Projects 4,997
Locally Operated Transit Systems Capital Procurement Projects 4,528
Assistance to Private Nonprofit Agencies for the Transportation of the
Elderly and Persons with Disabilities 4,089
MARC Positive Train Control 2,572
MARC BWI Station Upgrades and Repairs 2,243
MARC Maintenance, Layover, and Storage Facility 621
Freight Bridge Rehabilitation 390
Prince George’s County Local Bus Program 242
Agencywide Roof Replacement Program 190
Takoma/Langley Park Transit Center (ARRA) -352
MARC West Baltimore Station Parking Expansion -356
Agencywide Elevator and Escalator Rehabilitation -361
Homeland Security -606
MARC Halethorpe Station Improvements -613
Paul S. Sarbanes Transit Center -618
Fare Collection System Enhancements and Equipment Preservation -795
MARC Coaches – Overhauls and Replacement -1,220
Southern Maryland Commuter Bus Initiative -1,780
Montgomery County Local Bus Program -2,277

J00H01 – MDOT – Maryland Transit Administration
Analysis of the FY 2018 Maryland Executive Budget, 2017 24
Projects Change
Bus Procurement -2,414
Light Rail Safety Improvements -2,904
Bus Network Improvements -4,920
Bus New Main Shop -5,517
Kirk Bus Facility Replacement -14,528
Metro Safety Improvements -15,434
Purple Line -52,000
Development and Evaluation Projects $4,330
Corridor Cities Transitway $4,625
MARC Northeast Maintenance Facility -1
MARC Growth and Investment Plan -22
Southern Maryland Mass Transportation Analysis -272
System Preservation and Minor Projects -$20,200
Capital Salaries and Wages -$1,100
Total Change $2,747
ARRA: American Recovery and Reinvestment Act of 2009
BWI: Baltimore-Washington International Thurgood Marshall Airport
MARC: Maryland Area Regional Commuter
Source: Maryland Department of Transportation, 2017-2022 Consolidated Transportation Program

J00H01 – MDOT – Maryland Transit Administration
Analysis of the FY 2018 Maryland Executive Budget, 2017 25
Significant Changes in Major Projects from the Fiscal 2016-2021 Consolidated
Transportation Program
The fiscal 2017 to 2022 CTP lists significant changes to three major projects from what was
shown in the fiscal 2016 to 2021 CTP. These changes are shown in Exhibit 13.
Exhibit 13
Significant Changes to Major Projects Between Fiscal 2016-2021 and 2017-2022 Consolidated Transportation Programs
($ in Millions)
Project Total Cost Projects Added to the Construction Program
North Avenue Rising $27.3
Montgomery County Bus Rapid Transit 40.5
Projects Moved to the Development and Evaluation Program from the Construction
Program
Corridor Cities Transitway $260.8
Source: Maryland Department of Transportation, 2017-2022 Consolidated Transportation Program

J00H01 – MDOT – Maryland Transit Administration
Analysis of the FY 2018 Maryland Executive Budget, 2017 26
Issues
1. Collective Bargaining Agreement Includes Annual Cost-of-living Increases,
Requires Employee Pension Contribution
MTA and its largest union, Amalgamated Transit Union Local 1300 representing
2,326 members, ratified a Memorandum of Understanding (MOU) on May 22, 2016, amending the
CBA that expired on June 30, 2014, to cover the period from July 1, 2014, through June 30, 2018.
Major changes to the CBA with fiscal impacts included:
annual pay increases with retroactive pay due for fiscal 2015 through as follows:
1.5% effective July 1, 2014;
2.5% effective July 1, 2015;
3.5% effective July 1, 2016;
3.5% effective July 1, 2017; and
a requirement imposed for the first time and effective July 1, 2016, that union employees
contribute 2.0% of their gross pay to the MTA Pension Plan until the plan achieves 100.0%
funding (as of June 30, 2016, the funded ratio was 40.0%).
MTA’s fiscal 2017 budget does not include funding for fiscal 2017, the pay increase provided
in the CBA since the budget was developed prior to execution of the MOU. Funding for retroactive
pay for fiscal 2015 and 2016, to which union members are entitled under the CBA, is not included in
the fiscal 2018 allowance. MTA has reported the need for a budget amendment totaling $24.5 million
to cover the retroactive pay and for additional maintenance and other costs for operating expenses in
fiscal 2017. MTA should brief the committees on when it expects to process the budget
amendment to cover the retroactive pay or if it intends to request a supplemental deficiency
appropriation for this purpose.
Operating for extended periods without a CBA in effect distorts the budget evaluation process.
The true rate of growth in MTA operations is masked when budgets do not reflect the full cost of
employee compensation and when the large retroactive payments are included. Having a new
agreement in place, prior to the expiration of the existing one, would remove these distortions. MTA
should discuss with the committees the impediments to negotiating a new agreement prior to the
expiration of the current one and what actions it can take to remove these impediments.

J00H01 – MDOT – Maryland Transit Administration
Analysis of the FY 2018 Maryland Executive Budget, 2017 27
2. Fare Increase Due
Statute requires MTA, beginning in fiscal 2015 and on a biennial basis thereafter, to increase
base fares and the cost of multi-use passes to the nearest 10¢, for core transit services, by the same
percentage as the biennial increase in the Consumer Price Index (CPI) for all urban consumers. Fare
increases for MARC are required every five years based on the five-year increase in the CPI. Under
these provisions, MTA must increase fares before the end of the current fiscal year. In fiscal 2015, the
fare increase went into effect five days before the end of the fiscal year.
In fiscal 2015, based on a 2.82% increase in the CPI, MTA increased the base one-way fare
from $1.60 to $1.70, an increase of 6.25%. The larger percentage increase resulted from the statutory
requirement that fares be increased to the nearest 10¢ combined with MTA’s interpretation that a
calculation which resulted in a fare that would round down to the starting fare was not permissible
because that is not an increase. Thus, unless the CPI decreases or remains unchanged, base fare prices
will increase at least 10¢ every two years. The CPI increase, upon which the fiscal 2017 fare increase
will be based, is 1.12%. A base fare of $1.80, the minimum increase under the MTA methodology, is
an increase of 5.88% over the current base fare of $1.70.
The first public announcement of the fiscal 2015 fare increase was made on May 26, 2015, just
a month prior to the new rates going into effect. Fare increases due to changes in the CPI were exempted
from the public hearing requirements that would apply to any other proposed increase in fares.
MTA should inform the committee of when the new rates will be effective and when they
will be announced to the public.

J00H01 – MDOT – Maryland Transit Administration
Analysis of the FY 2018 Maryland Executive Budget, 2017 28
Operating Budget Recommended Actions
1. Concur with Governor’s allowance.

J00H01 – MDOT – Maryland Transit Administration
Analysis of the FY 2018 Maryland Executive Budget, 2017 29
PAYGO Budget Recommended Actions
1. Concur with Governor’s allowance.

J00H01 – MDOT – Maryland Transit Administration
Analysis of the FY 2018 Maryland Executive Budget, 2017 30
Updates
1. BaltimoreLink Transit Initiative on Track
In October 2015, MTA announced the beginning of a $135 million, multi-phase initiative to
improve transit services in the Baltimore region called BaltimoreLink. Full implementation, planned
for June 2017, is to include a redesign of local and express bus routes, new and enhanced commuter
bus service, the creation of 12 high-frequency routes along major arterials connecting to downtown,
and 5 new suburb-to-suburb express bus routes. Existing transit services are renamed with “Link”
appended to denote each service being part of a greater transit network. MTA held the required public
hearings for the local bus route changes in January 2017. Implementation of the new local routes is
still scheduled for June 2017.
J00H01 – MDOT – Maryland Transit Administration
Analysis of the FY 2018 Maryland Executive Budget, 2017 31
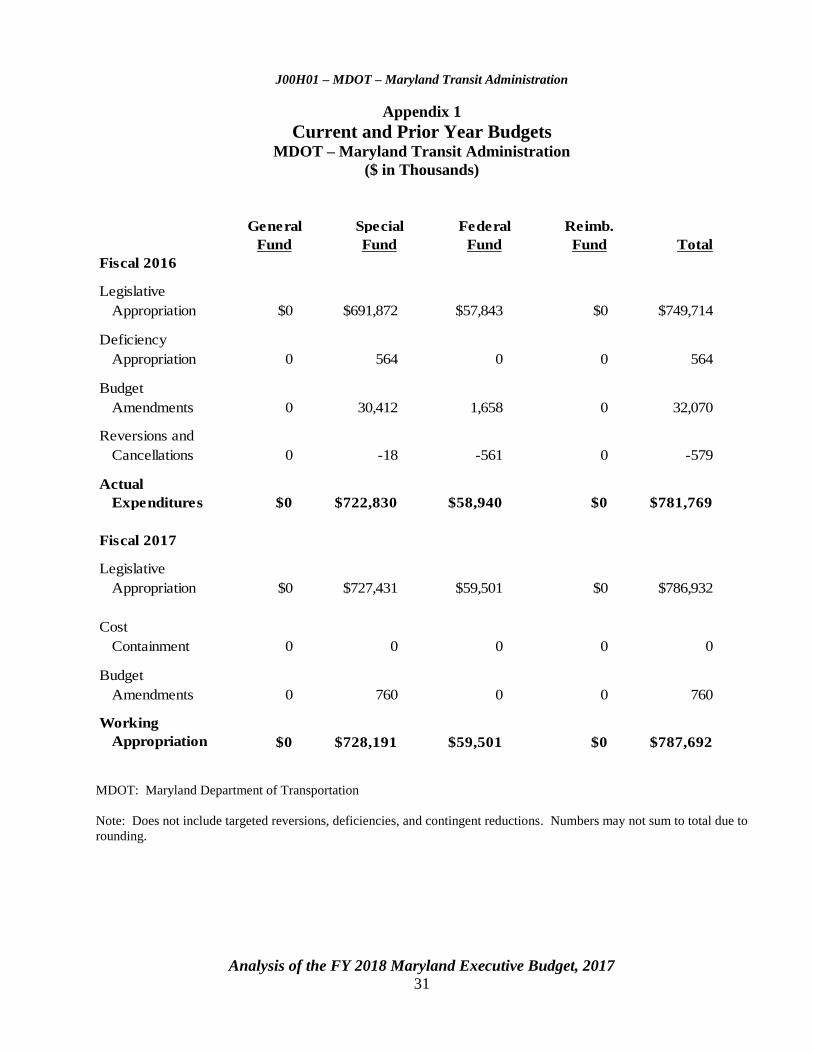
Appendix 1
Current and Prior Year Budgets MDOT – Maryland Transit Administration
($ in Thousands)
Fiscal 2016
Legislative
Appropriation $0 $691,872 $57,843 $0 $749,714
Deficiency
Appropriation 0 564 0 0 564
Budget
Amendments 0 30,412 1,658 0 32,070
Reversions and
Cancellations 0 -18 -561 0 -579
Actual
Expenditures $0 $722,830 $58,940 $0 $781,769
Fiscal 2017
Legislative
Appropriation $0 $727,431 $59,501 $0 $786,932
Cost
Containment 0 0 0 0 0
Budget
Amendments 0 760 0 0 760
Working
Appropriation $0 $728,191 $59,501 $0 $787,692
General Special Federal
TotalFund FundFund
Reimb.
Fund
MDOT: Maryland Department of Transportation
Note: Does not include targeted reversions, deficiencies, and contingent reductions. Numbers may not sum to total due to
rounding.
J0
0H
01
– M
DO
T M
aryla
nd
Tra
nsit A
dm
inistra
tion
Appen
dix
1

J00H01 – MDOT – Maryland Transit Administration
Analysis of the FY 2018 Maryland Executive Budget, 2017 32
Fiscal 2016
The fiscal 2016 budget for the Maryland Transit Administration closed out $32.1 million higher
than the legislative appropriation. Deficiency appropriations added special funds totaling $563,810 to
support the BaltimoreLink transit initiative. Special and federal fund budget amendments added a net
of $32.1 million. These additions were slightly offset by year-end cancellations totaling $579,115 due
primarily to lower than anticipated federal grant levels for locally operated transit systems.
Special fund budget amendments added a net $30,411,943 as follows:
Maryland Area Regional Commuter contract and ridership increases $7,538,582
Mobility new contract and ridership increases 7,349,433
Overtime and Social Security 6,346,881
Snow removal\winter maintenance expenses 5,632,325
Additional funds for local transit properties based on current grant agreement 4,924,432
Washington and InterCounty Connector commuter bus contract and ridership
increase 4,671,373
2% salary reduction restoration 2,871,008
Washington commuter bus new rates and added service 2,756,657
Supplies and materials 1,531,352
Janitorial contracts 1,416,820
Baltimore commuter bus 1,115,331
Benefits technical and consultant support 981,236
Information technology contracts/expenditures 554,166
Grounds maintenance 513,005
Rent 90,496
Vehicle insurance 5,845
Travel expenses -67,161
Maintenance savings -265,626
Voluntary Separation Program savings -438,898
Salaries, fringes, and accrued leave -548,057
Realign the Office of Administrative Hearings, communications, and workers’
compensation charges -650,306
Utilities -2,056,223
Diesel savings -13,860,728
Total $30,411,943

J00H01 – MDOT – Maryland Transit Administration
Analysis of the FY 2018 Maryland Executive Budget, 2017 33
Federal fund budget amendments added $1,658,033 for the following purposes:
Additional funds for local transit properties based on current grant agreement $1,544,983
Preventative maintenance 100,000
Canine Unit additional grant 13,050
Total $1,658,033
Fiscal 2017
The fiscal 2017 special fund working appropriation is $759,956 higher than the legislative
appropriation due to a budget amendment adding funds for salary increments.

An
alysis o
f the F
Y 2
018 M
aryla
nd E
xecu
tive Bu
dget, 2
017
34
Appendix 2
Object/Fund Difference Report
MDOT – Maryland Transit Administration
FY 17
FY 16 Working FY 18 FY 17 - FY 18 Percent
Object/Fund Actual Appropriation Allowance Amount Change Change
Positions
01 Regular 3,263.50 3,297.50 3,279.50 -18.00 -0.5%
02 Contractual 16.00 16.00 16.00 0.00 0%
Total Positions 3,279.50 3,313.50 3,295.50 -18.00 -0.5%
Objects
01 Salaries and Wages $ 319,123,925 $ 322,869,095 $ 340,355,144 $ 17,486,049 5.4%
02 Technical and Spec. Fees 598,664 1,192,706 1,136,586 -56,120 -4.7%
03 Communication 1,711,757 1,210,718 1,210,718 0 0%
04 Travel 469,921 434,855 434,855 0 0%
06 Fuel and Utilities 14,051,939 14,190,577 14,254,374 63,797 0.4%
07 Motor Vehicles 58,931,922 64,038,613 60,150,201 -3,888,412 -6.1%
08 Contractual Services 286,069,390 283,202,835 310,378,234 27,175,399 9.6%
09 Supplies and Materials 8,322,225 5,643,653 5,643,653 0 0%
10 Equipment – Replacement 423,022 111,490 111,490 0 0%
11 Equipment – Additional 153,357 130,635 130,635 0 0%
12 Grants, Subsidies, and Contributions 84,221,417 86,659,042 86,659,042 0 0%
13 Fixed Charges 7,691,534 8,007,882 7,909,238 -98,644 -1.2%
14 Land and Structures 88 0 0 0 0.0%
Total Objects $ 781,769,161 $ 787,692,101 $ 828,374,170 $ 40,682,069 5.2%
Funds
03 Special Fund $ 722,829,550 $ 728,191,437 $ 768,873,506 $ 40,682,069 5.6%
05 Federal Fund 58,939,611 59,500,664 59,500,664 0 0%
Total Funds $ 781,769,161 $ 787,692,101 $ 828,374,170 $ 40,682,069 5.2%
MDOT: Maryland Department of Transportation
Note: Does not include targeted reversions, deficiencies, and contingent reductions.
J0
0H
01
– M
DO
T –
Ma
rylan
d T
ran
sit Ad
min
istratio
n

An
alysis o
f the F
Y 2
018 M
aryla
nd E
xecu
tive Bu
dget, 2
017
35
Appendix 3
Fiscal Summary
MDOT – Maryland Transit Administration
FY 16 FY 17 FY 18 FY 17 - FY 18
Program/Unit Actual Wrk Approp Allowance Change % Change
01 Transit Administration $ 54,260,520 $ 55,246,549 $ 87,724,258 $ 32,477,709 58.8%
02 Bus Operations 348,341,746 355,312,182 429,323,359 74,011,177 20.8%
04 Rail Operations 244,444,188 239,366,007 222,594,584 -16,771,423 -7.0%
05 Facilities and Capital Equipment 388,256,104 628,989,000 620,828,000 -8,161,000 -1.3%
06 Statewide Programs Operations 134,722,707 137,767,363 88,731,969 -49,035,394 -35.6%
08 Major Information Technology Development Projects 1,731,044 7,034,000 13,450,000 6,416,000 91.2%
Total Expenditures $ 1,171,756,309 $ 1,423,715,101 $ 1,462,652,170 $ 38,937,069 2.7%
Special Fund $ 967,468,197 $ 963,506,437 $ 1,047,100,506 $ 83,594,069 8.7%
Federal Fund 204,288,112 460,208,664 415,551,664 -44,657,000 -9.7%
Total Appropriations $ 1,171,756,309 $ 1,423,715,101 $ 1,462,652,170 $ 38,937,069 2.7%
MDOT: Maryland Department of Transportation
Note: Does not include targeted reversions, deficiencies, and contingent reductions.
J0
0H
01
– M
DO
T –
Ma
rylan
d T
ran
sit Ad
min
istratio
n

J00H01 – MDOT – Maryland Transit Administration
Analysis of the FY 2018 Maryland Executive Budget, 2017 36
Appendix 4
Budget Amendments for Fiscal 2017
Maryland Department of Transportation
Maryland Transit Administration – Operating
Status Amendment Fund Justification
Approved $759,956 Special Funding for increments.
Projected 24,514,734 Special Union agreement retroactive pay (fiscal 2015 to 2017); new
systems maintenance, bus maintenance, MARC funding, and
other operating needs.
Projected 1,467,571 Federal Greyhound and Bayrunner subsidies in locally operated
transit systems program.
$25,982,305 Total Projected
MARC: Maryland Area Regional Commuter
Source: Maryland Department of Transportation

J00H01 – MDOT – Maryland Transit Administration
Analysis of the FY 2018 Maryland Executive Budget, 2017 37
Appendix 5
Budget Amendments for Fiscal 2017
Maryland Department of Transportation
Maryland Transit Administration – Capital
Status Amendment Fund Justification
Approved $138,392 Special Funding for increments.
Pending 17,704,383 Special Adjusts the amended appropriation to agree with the final
fiscal 2017 to 2022 Consolidated Transportation Program. -57,050,000 Federal
-$39,345,617 Total Pending
Source: Maryland Department of Transportation