openness to experience in managers and company … · web viewthis research aims to link the...
TRANSCRIPT
Openness to experience in managers and company performance
To what extent exerts the Big Five personality factor Openness to Experience an influence on the
financial performance of the company?
Department of Economics
Supervisor: Dr. Kapoor
Ingeborg de Graaf
368462
8/3/2015
Content
This research aims to link the personality factor Openness to Experience (as a facet of the Big Five personality measures) to company performance. The relationship was investigated by multiple regression, controlling for all other Big Five factors, as well as job tenure. The results showed that Openness to Experience has a significant positive influence on company performance. However, this relation was moderated negatively by the Big Five factor Agreeableness.

2
s
1. Introduction.......................................................................................................................4
2. Theoretical framework......................................................................................................6
2.1 Personality; the Big Five..........................................................................................6
2.2 Personality as performance indicator......................................................................7
2.3 Company success.....................................................................................................8
2.4 Hypothesis:..............................................................................................................9
3. Data and Methodology....................................................................................................10
3.1 Research design.....................................................................................................10
3.2 Data collection.......................................................................................................10
3.3 Analysis techniques...............................................................................................12
3.4 Sample strategy.....................................................................................................12
3.5 Quality indicators..................................................................................................13
3.5.1 Validity....................................................................................................13
4. Results.............................................................................................................................14
4.1 Differences in average Openness to Experience....................................................14
4.2 Multiple regression analysis..................................................................................15
4.3 Regression estimates Revenues............................................................................16
4.3.1 Model 1...................................................................................................16
4.3.2 Model 2...................................................................................................18
4.3.3 Model 3...................................................................................................18
4.3.4 Model 4...................................................................................................19
4.3.5 Model 5...................................................................................................20
4.3.6 Model 6...................................................................................................21
4.3.7 Model 7...................................................................................................22
4.3.8 Model 8...................................................................................................24
5. Conclusion.......................................................................................................................25
6. Discussion & limitations..................................................................................................27
7. References.......................................................................................................................29
8. Appendices......................................................................................................................31
8.1 Appendix 1: survey in Dutch (as distributed to the respondents).........................31
3
8.2 Appendix 2: survey translated to English...............................................................41
8.3 Excluded regression models..................................................................................44

4
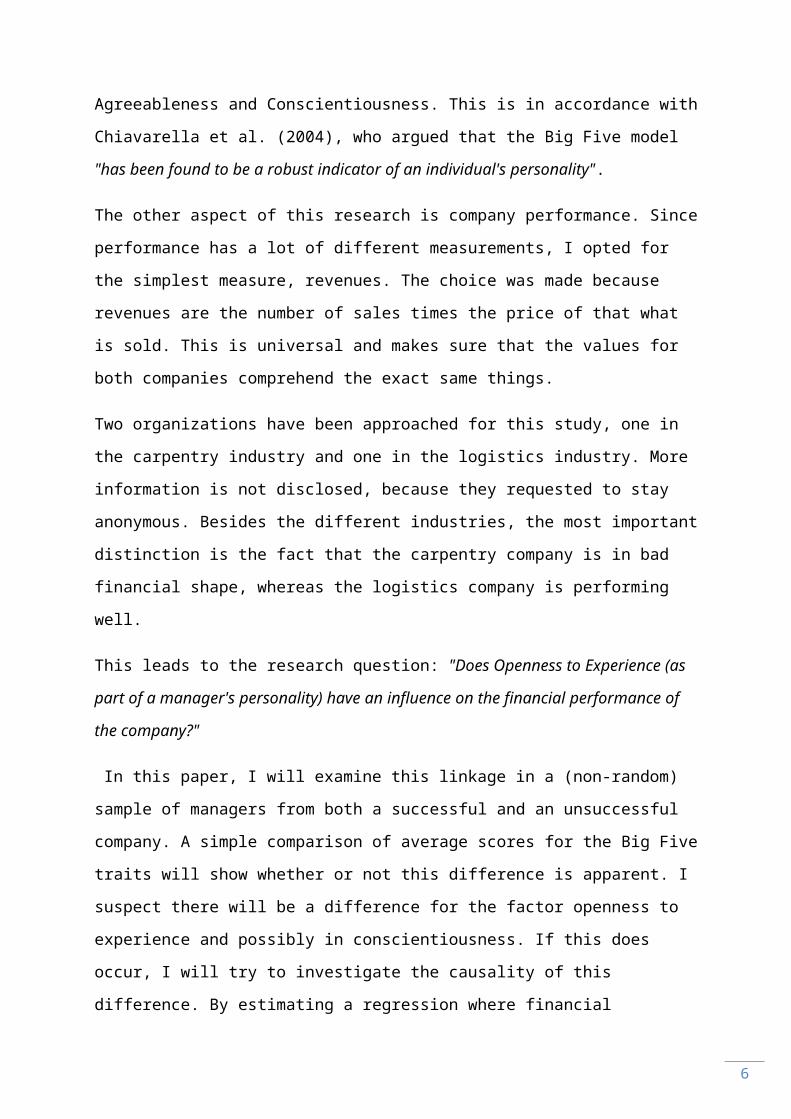
1. Introduction
Hiring the right people for the right job is something that has gotten quite some attention
over the years. Since there are a lot of aspects to this process, I will focus on one aspect:
employee personality. In a simple Web of Science™ search for the words "personality" and
"job performance" in the title resulted in 101 scientific publications.
Financial performance as a stand-alone topic is a widely discussed topic as well, as is
mentioned by Capon et al. (1990), who reviewed 320 empirical studies in their meta-analysis
of financial performance.
However, a search for personality and company/business/financial performance in the title
resulted in only four publications, two of which two addressed company performance, the
other two both addressed job performance. Moreover, a search for papers which addressed
manager's job performance and a search for personality and company/business/financial
performance resulted in only one paper for the former and only two for the latter, both not
relevant for the research I am proposing. In this research, I will take on a different
perspective on hiring and company performance. I will investigate whether the personality
of the manager has an influence on financial performance.
For the measurement of the managers' personalities, I will make use of the Big Five
construct (IPIP). This is a fifty-item questionnaire which addresses the five key personality
traits: Openness to experience, Extraversion, Emotional Stability, Agreeableness and
Conscientiousness. This is in accordance with Chiavarella et al. (2004), who argued that the
Big Five model "has been found to be a robust indicator of an individual's personality".
The other aspect of this research is company performance. Since performance has a lot of
different measurements, I opted for the simplest measure, revenues. The choice was made
because revenues are the number of sales times the price of that what is sold. This is
universal and makes sure that the values for both companies comprehend the exact same
things.
Two organizations have been approached for this study, one in the carpentry industry and
one in the logistics industry. More information is not disclosed, because they requested to
stay anonymous. Besides the different industries, the most important distinction is the fact
5
that the carpentry company is in bad financial shape, whereas the logistics company is
performing well.
This leads to the research question: "Does Openness to Experience (as part of a manager's
personality) have an influence on the financial performance of the company?"
In this paper, I will examine this linkage in a (non-random) sample of managers from both a
successful and an unsuccessful company. A simple comparison of average scores for the Big
Five traits will show whether or not this difference is apparent. I suspect there will be a
difference for the factor openness to experience and possibly in conscientiousness. If this
does occur, I will try to investigate the causality of this difference. By estimating a regression
where financial performance of a company is regressed on the manager's score on each of
the Big Five characteristics (either per company or department). If the coefficient of the
openness factor is significant from zero, there might be an effect of the personality of the
managers on the company performance.
From a company perspective, this research is an interesting subject when companies are
faced with deteriorating financial health, provided that the causality leads from the
personality traits to the company performance. For the investigated companies especially,
this information could lead to better financial performance when the hiring processes are
adapted to take personality into account (if an effect of personality on company financial
performance is found).
Furthermore, this research contributes to the current literature by examining managers'
personalities as a variable which might influence company performance. Moreover, this is a
link that has not been studied before and might provide a useful insight in the realization of
financial goals. This research aims to provide a helpful notion for those examining the
determinants of financial performance. Future research can either replicate or evaluate this
research, or use it as a starting point for new studies.
I will proceed with the theoretical framework on which this research is based, followed by a
description of the data, the methodology and the results. The conclusion will relate these
results to the research question and the before mentioned theories. Finally, the implications
of the findings, as well as limitations of this research are discussed.
6
2. Theoretical framework
2.1 Personality; the Big Five
The Big Five personality dimensions addressed a need in the field of personality research, by
integrating the numerous and divergent ways of studying and/or describing personality in
one framework (John, 2001). The starting point of the Big Five lies with the lexical approach
of personality research, which posits that “most of the socially relevant and salient
personality characteristics have become encoded in the natural language” (John, 2001). Over
the course of the 20th century, all the words that could be used to describe any human’s
behavior as differing from the behavior of another. The amount of categories of words
differed per researcher, as well as the vision of the boundaries used (mutually exclusive an
clear, or overlapping and fuzzy). Over time, the amount of describing terms was reduced
more and more, from almost 18.000 terms (Allport, 1936) of which Cattell picked 4.500 to
reduce further to only 35 in 1943 and 1945 researches to arrive at 12 personality factors,
which were eventually included in his 16 Personality Factors survey. The work of Cattell
(both the outcomes and the reduction of the amount of variables used) inspired other
researchers to investigate personality. (Fiske, 1949) simplified 22 of the 35 variables of
Cattell and constructed a 5-factor structure which came close to the Big Five. When
reanalyzing the correlation matrices from eight samples (which ranged from people with no
more than high school education to graduate students), they found that the five factors
emerged clearly and frequent, across self-ratings, peer, supervisor, teacher and clinician
ratings (John, 2001).
In accordance with Norman (1963), the factors were initially named Extraversion (or
Surgency), Agreeableness, Conscientiousness, Emotional Stability versus Neuroticism and
Culture. The name Big Five came to be because of the broad scope of the factors (Goldberg,
1981). However, the Big Five does not suggest that that personality differences can be
captured in just five traits, but rather that personality can be represented by five dimensions
at the highest level of abstraction.
An important note to be made, is that an individual's personality obtains its final form
between the ages of 21 and 30, changes in personality traits after the age of 30 are therefore

7
rare (Costa & McCrae, 1994). Since the average age of the respondents is higher than 30,
reverse causality seems highly unlikely.
2.2 Personality as performance indicator
The link between personality and company success has been investigated by Chiavarella et
al. (2004), who found that the personality of the entrepreneur had an effect on venture
survival. They characterized the personality through the Big Five (Openness to experience,
Extraversion, Emotional Stability, Agreeableness and Conscientiousness) and venture
survival. They defined entrepreneurs as "those that have decided to launch a small business
by forgoing all other career alternatives and without the safety net of a professional license
in case of failure". For these entrepreneurs, extraversion, emotional stability and
agreeableness had no effect. Survival of a company was defined as the company still existing
after 8 years. Conscientiousness had a significant and positive effect on the life span of the
venture (p<.01), whereas openness to experience was expected to have a positive effect, it
had a significant negative effect (p<.10). They reason that openness to experience might be a
factor in starting a business, but over time, the job may require a shift from creative and
broad-mindedness to a managerial approach.
A paper by Barrick & Mount (1991) found that conscientiousness had a positive effect on
the job performance of managers as well, However, they found that openness to experience
had a weak and positive effect on managerial performance, contrasting the above reasoning.
A logical conclusion of this latter result would be that higher openness to experience in
managers leads to better company performance through better job performance.
The personality of managers will be assessed through the Big Five personality factors.
Ciavarella et al. (2003) have constructed the following overview of the Big Five based on the
descriptions in Barrick & Mount's 1991 paper, in their attempt to uncover the relationship
between an entrepreneurs personality and venture survival:

8
Big Five Factor Traits Components
Extraversion Sociable, gregarious,
assertive, talkative, active
ambition—initiative, surgency, impetuous,
likes to be in charge, seeks leadership roles,
persuasive
sociability—talkative, gregarious, enjoys
meeting people
individuality—shows off, enjoys taking
chances and stirring up excitement
Emotional
Stability
Calm, even-tempered, self-
satisfied, comfortable,
unemotional, hardy, stable,
confident, effective
Steady —even-tempered, steady emotionally
Security — feels secure about self, not
bothered by criticism
Agreeableness Being courteous, flexible,
trusting, good-natured,
cooperative, forgiving,
soft-hearted, tolerant
Cooperative — likes to help others and does
things for friends, trusting of others
Considerate — good-natured, cheerful,
forgives others easily
Conscientiousness Responsible, well-
organized, planful,
hardworking,
achievement-oriented,
persevering
Dependability — thorough, careful
Industriousness — strives to do best, does
more than planned, hardworking, persistent
Efficiency — neat and orderly, plans in
advance, rarely late for appointments
Openness to
experience
Being imaginative,
creative, cultured, curious,
original, broadminded,
intelligent, artistically
sensitive
Intellect — imaginative, likes abstract ideas
and concepts, analytical and introspective,
enjoys philosophical debates
Open — cultured, likes to try new and
different things, enjoys art, music, literature
Table 1: The Big Five Factors, Traits and Components (Ciavarella et al., 2003)
Despite the fact that openness to experience the interesting factor is in this case, all factors
are assessed in the survey, providing data for both control and interaction variables.
2.3 Company success
The dependent variable in my research question is company performance. However, this
term is very broad (and broadly used as well). Moreover, the ways to measure it are
numerous and ranging from extremely simple to complicated formulas. In this research, I
will focus on the simplest measure of company success: revenues. The choice for this

9
measure comes down to the fact that calculating revenues is straightforward and there is
only one way to do it, which makes sure that the measures are performed (and thus are
measuring) exactly the same in both companies (in accordance with Dutch tax policies).
2.4 Hypothesis:
Reasoning from the arguments posited in the previous paragraphs, I pose the following
hypothesis, which is the research question of this paper:
Average managers' openness to experience will have a positive influence on company
revenues.
The following chapter will elaborate on the methodology of this research, as well as
information concerning the data.
Company RevenuesManager's Openness to Experience

10
3. Data and Methodology
In this section, the data collection and the methodology of this paper is explained. This
research aims to uncover the relationship between the Openness to Experience of managers
and the consecutive financial performance of their company.
3.1 Research design
As mentioned, I will focus on managers from both successful and unsuccessful companies,
and I will define a company as unsuccessful when the bank has declared that the company is
under "Bijzonder Beheer" or, in English: Special Asset Management (SAM). This means that
the bank has serious doubts whether or not the company is able to keep paying its bills and
thus decides that the company needs help in becoming financially healthy again or help
concerning termination, to ensure that the loss is kept to a minimum (Rabobank, n.d.).
Unfortunately, I was not allowed to get more information about which criteria are used to
determine whether or not a company should be under SAM. However, the binary division of
successful and unsuccessful is sufficient for this research, for it is only used to determine the
type of company that is studied.
The factor Openness to Experience is part of the Big Five Factor model, which is the reason I
chose the standard IPIP 50-item questionnaire to use in my survey. To study the outcomes
appropriately, the survey responses will be aggregated per company.
3.2 Data collection
The data are obtained from two companies. The company under SAM is a manufacturer of
wooden window frames (carpentry industry). The company that is financially sound, is a
provider of value-added logistics and warehousing (transportation and storage industry). The
survey was distributed to the managers of the two companies, which amounted to 11
managers of the company under SAM and five managers of the financially healthy company.
All subjects responded, totaling 16 surveys in total. Personality was assessed by the 50-item
set of IPIP Big Five Factor Markers (IPIP). The answers to the questions concerning the Big
Five consisted of a five-point Likert scale, which makes it easier to fill in the questionnaire
and will reduce possible errors due to inattentiveness. The questionnaire can be found in
appendix 2 (this is the translated version, the version that was send out was in Dutch and

11
can be found in appendix 1). The answers ranged from "strongly disagree" to "strongly
agree", expressing neutrality towards the question was possible as well.
Financial performance will be measured by the revenues of the year 2013. Control variables
will consist of: the remaining four of the Big Five personality factors, which have been found
to be predictors of job performance in managers (Rothmann, 2003). Logical reasoning leads
me to think that good job performance should lead to better financial results. However, as I
mentioned before, this relationship has not yet been investigated. Continuing on this view, I
accounted for job tenure, which was found to have a positive (but diminishing over time)
effect on job performance (Hg, 2010). These variables were reported in the survey.
In accordance with the papers by Ciavarella et al (2004) and Barrick & Mount (1991), I
control for the other determinants of personality as well. In both papers, it was found that
Conscientiousness had a favorable influence on venture survival and on job performance. I
expect that this factor will have the most dominant effect on company performance.
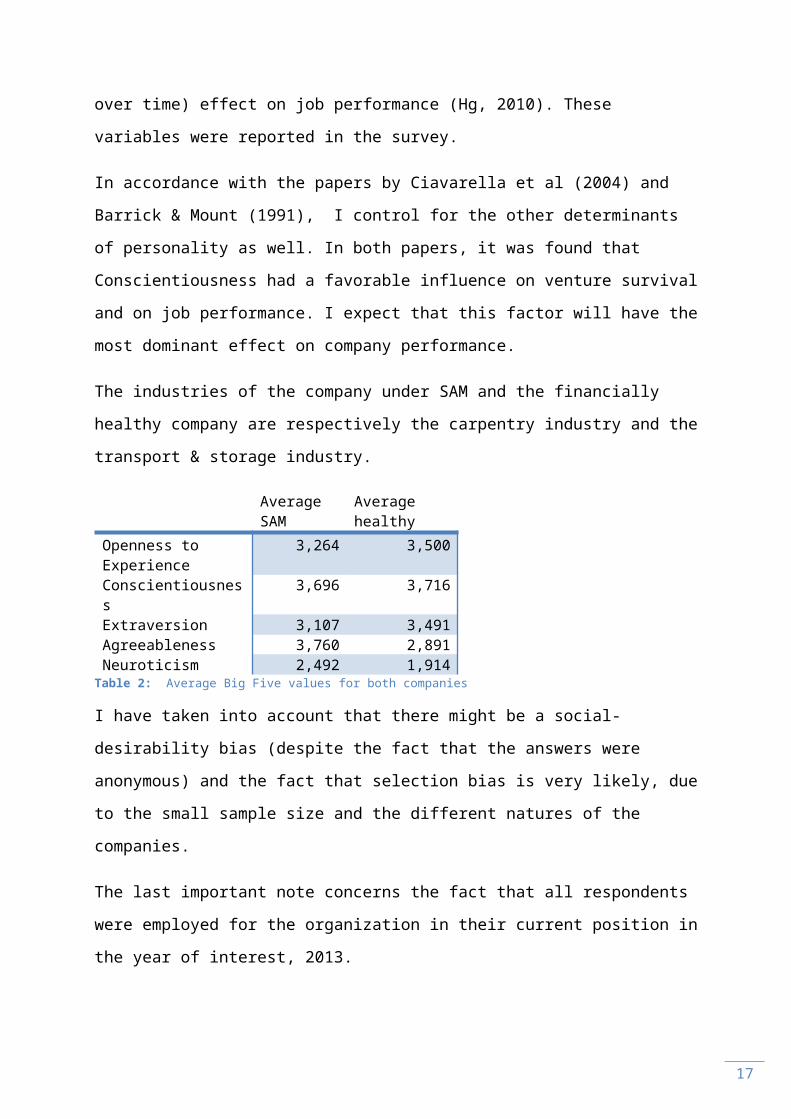
The industries of the company under SAM and the financially healthy company are
respectively the carpentry industry and the transport & storage industry.
Average SAM Average healthyOpenness to Experience 3,264 3,500Conscientiousness 3,696 3,716Extraversion 3,107 3,491Agreeableness 3,760 2,891Neuroticism 2,492 1,914
Table 2: Average Big Five values for both companies
I have taken into account that there might be a social-desirability bias (despite the fact that
the answers were anonymous) and the fact that selection bias is very likely, due to the small
sample size and the different natures of the companies.
The last important note concerns the fact that all respondents were employed for the
organization in their current position in the year of interest, 2013.

12
3.3 Analysis techniques
After the collection of data was completed, an independent t-test was run to see if the mean
values of Openness to Experience differed between the two groups. The choice for an
independent t-test was made because of the small sample size and the fact that the samples
were drawn from two different groups. This is an important step, because in order to prove
a causal relationship between the Openness to Experience factor and company
performance, there must be a difference in Openness to Experience, as well as in company
performance.
After this comparison, a normal quantile plot was constructed, to check if Openness to
Experience is distributed normally.
Finally, several multiple regression models were estimated. I have disclosed eight models,
the first five adding the Big Five factors step-by-step, starting with Openness to Experience,
then Conscientiousness, followed by Extraversion, Agreeableness and Neuroticism (forming
OCEAN). In the sixth model, the variable job tenure was added, and in the seventh, the
interaction between Openness to Experience and Agreeableness. In the final model, the
variable Extraversion is deleted, to arrive at the model with both the highest explanatory
value (as depicted by the Adjusted R-square) and the most significant estimates of the
coefficients of the included variables. For some models, residual plots are provided, to see if
the assumption of homoscedasticy of the errors is satisfied.
3.4 Sample strategy
The sample was purposely created, which means that only managers of the companies were
asked to fill in a survey. The choice for managers was made because the results of Barrick &
Mount (1991) indicated that Openness to Experience was a significant indicator of
manager’s job performance. In the carpentry company, the managers belonged to either
one of tree management groups: Owner-managers, Management Team and Operations
Management. In the transport & storage company, all managers were partial owners,
resulting in only one group. Convenience sampling was only the case in the carpentry
company, because two managers were on holiday during the time the survey was available.
Because this information was available prior to the sending out of the survey, they have not
been approached.

13
3.5 Quality indicators
3.5.1 ValidityTo enhance the validity of this research, I included some control variables. The first four
control variables concern the Big Five factors of Conscientiousness, Extraversion,
Agreeableness and Neuroticism. These were taken into account because all of them have an
influence on managerial job performance (Rothmann, 2003), and thus logically on company
performance as well.
The fifth control variable is the job tenure of the managers. This control might prove to be
important, because a manager with a longer time on the job might understand the processes
in the company better, and therefore be more able to interpret correctly what influence his
or her actions indirectly have on other parts of the company. Hg & Feldman (2010) found
that job tenure had a positive (but diminishing) effect on job performance. Again, this
variable is included because of the effect that job performance is logically thought to have
on company performance.
The sixth control variable indicates the size of the companies, as measured by the average
number of employees per year. This was in accordance with Ciavarella et al (2004), who
examined different companies in different industries as well.
The seventh, and last, control variable concerns the performance per industry. This is in
accordance with the meta-analysis performed by Capon & Hoenig (1990), which was aimed
to discover the determinants of financial performance.
The validity of the survey was secured, because it is widely used, supported widely, as well
as plenteously used in personality-related research (Gosling, 2003).

14
4. Results
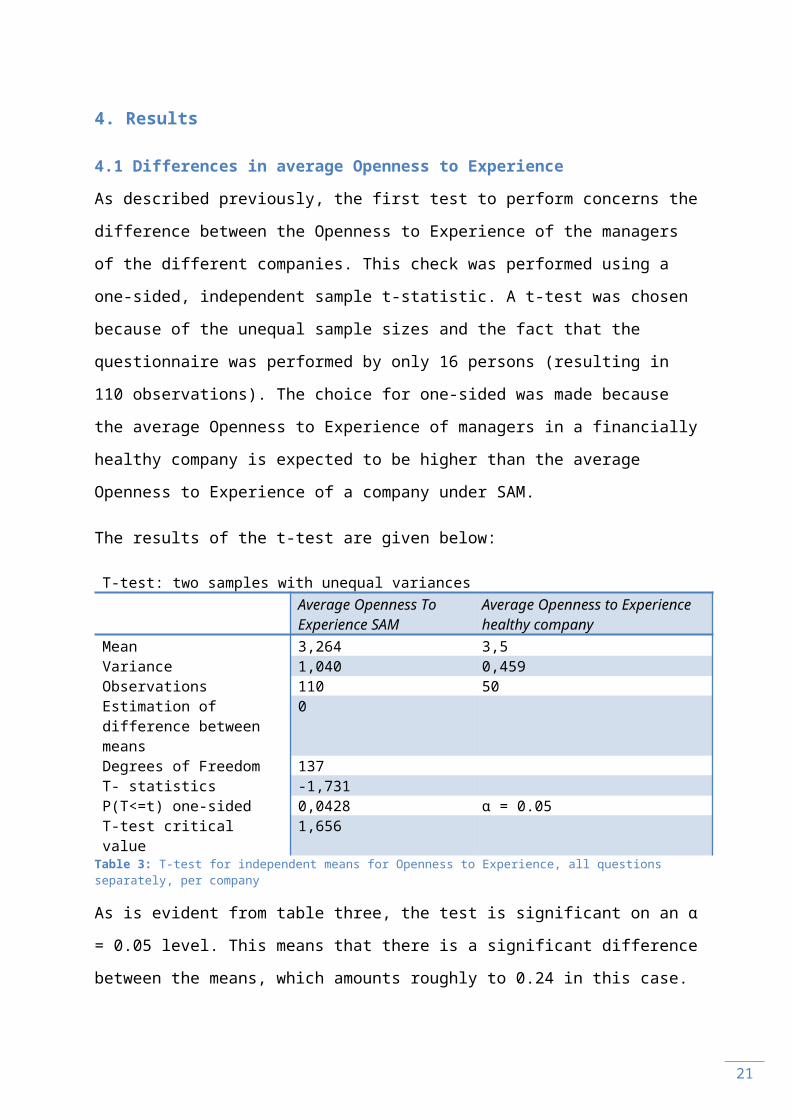
4.1 Differences in average Openness to Experience
As described previously, the first test to perform concerns the difference between the
Openness to Experience of the managers of the different companies. This check was
performed using a one-sided, independent sample t-statistic. A t-test was chosen because of
the unequal sample sizes and the fact that the questionnaire was performed by only 16
persons (resulting in 110 observations). The choice for one-sided was made because the
average Openness to Experience of managers in a financially healthy company is expected to
be higher than the average Openness to Experience of a company under SAM.
The results of the t-test are given below:
T-test: two samples with unequal variancesAverage Openness To Experience SAM
Average Openness to Experience healthy company
Mean 3,264 3,5Variance 1,040 0,459Observations 110 50Estimation of difference between means
0
Degrees of Freedom 137T- statistics -1,731P(T<=t) one-sided 0,0428 α = 0.05T-test critical value 1,656
Table 3: T-test for independent means for Openness to Experience, all questions separately, per company
As is evident from table three, the test is significant on an α = 0.05 level. This means that
there is a significant difference between the means, which amounts roughly to 0.24 in this
case.
However, since the results of the test would yield an average score per respondent, The
same test was performed on the much smaller observation of the score on Openness to
Experience per respondent. The independent samples t-test yielded the following results:
15
T-test: two samples with unequal variances
Average Openness To Experience SAM
Average Openness to Experience healthy company
Mean 3,5 3,264Variance 0,065 0,152Observations 5 11Estimation of difference between means
0
Degrees of Freedom 12T- statistics 1,441P(T<=t) one-sided 0,0874 α = 0.10T-test critical value 1,782
Table 4: T-test for independent means for the variable Openness to Experience per manager, per company
Again, the difference is visible, however the significance has decreased a little, to α = 0.10.
With the difference between levels of Openness to Experience apparent, it is possible to
advance to the next section of the results.
4.2 Multiple regression analysis
One of the assumptions of regression is normality. The below Normal Quantile Plot shows
the dispersion of the data against the normal line. As is visible, there are outliers in the
middle, but the deviation seems small and the overall pattern has a reasonable fit with the
line, as is indicated by the R-square of approximately 0.73.
-2.5 -2 -1.5 -1 -0.5 0 0.5 1 1.5 2 2.50
0.5
1
1.5
2
2.5
3
3.5
4
f(x) = 0.297183646480822 x + 3.275R² = 0.729186581045192
Normal Quantile Plot
Rank-based Z-score
Ope
nnes
s to
Expe
rienc
e
Figure 1: Normal Quantile Plot for the variable Openness to Experience
16
4.3 Regression estimates Revenues
A significance level of α = 0.10 is used, unless specified otherwise.
I will first provide a short overview of the regressions performed:
Model R-
squared
Adjusted R-
squared
Variables used
1 0,0971 0,0326 Openness to Experience
2 0,106 -0,031 Openness to Experience and Conscientiousness
3 0,179 -0,026 Openness to Experience, Conscientiousness and
Agreeableness
4 0,746 0,654 Openness to Experience, Conscientiousness, Agreeableness
and Extraversion
5 0,829 0,743 Openness to Experience, Conscientiousness, Agreeableness,
Extraversion and Neuroticism
6 0,830 0,717 Openness to Experience, Conscientiousness, Agreeableness,
Extraversion, Neuroticism and job tenure
7 0,893 0,799 Openness to Experience, Conscientiousness, Agreeableness,
Extraversion, Neuroticism, job tenure and Openness to
Experience*Agreeableness
8 0,883 0,806 Openness to Experience, Conscientiousness, Agreeableness,
Extraversion, Neuroticism, job tenure and Openness to
Experience*Agreeableness
Table 5: Overview of the regression models
4.3.1 Model 1
In order to estimate the effect of Openness to Experience on company performance more
clearly, I will show six regression models: three with revenues as dependent variable and
three with EBIT as dependent variable. I will start with the regression of revenues:
Regression StatisticsMultiple R - correlation coefficient 0,312R-square 0,097Adjusted R-square 0,033Standard error 154993,515Observations 16
Coefficients Standard t Stat P-
17
Error valueIntercept 12911337,58 369890,078 34,90
60.000
Openness to Experience -135253,003 110218,699 -1,227 0,240Table 6: Model 1, regression of company revenue on Openness to Experience
The estimation results in the following regression:
company revenue = 12911337,58 -135253,0025*(Openness to experience managers)
This regression, however, is not very accurate, as is depicted by the very low R-square (0.09).
Moreover, the effect of Openness to Experience is not significant, which means that there is
no evidence that it’s effect is different from zero.
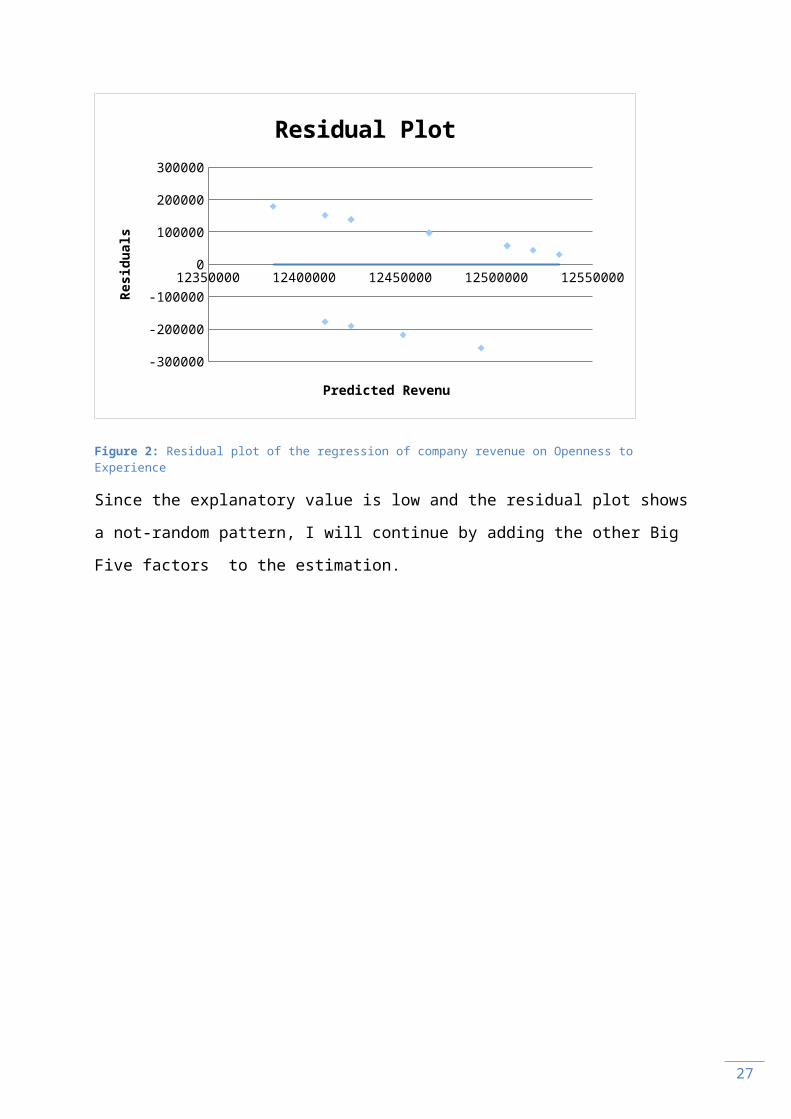
Since one of the assumptions of the regression model assume homoscedasticy, I will check
for this by using a residual plot. As is visible from the plot, the estimate is both biased and
heteroscedastic. The blue (horizontal) line depicts the linear trend line, or the regression line
of the data. This line is horizontal, even when there is a clear downward slope visible in the
plot, because the line does not follow the line the data appears to follow, the residuals are
biased. Moreover, the residuals are divided into two groups, indicating that there is
homoscedasticity.
12350000 12400000 12450000 12500000 12550000
-300000
-200000
-100000
0
100000
200000
300000
Residual Plot
Predicted Revenu
Resid
uals
Figure 2: Residual plot of the regression of company revenue on Openness to Experience
Since the explanatory value is low and the residual plot shows a not-random pattern, I will
continue by adding the other Big Five factors to the estimation.

18

19
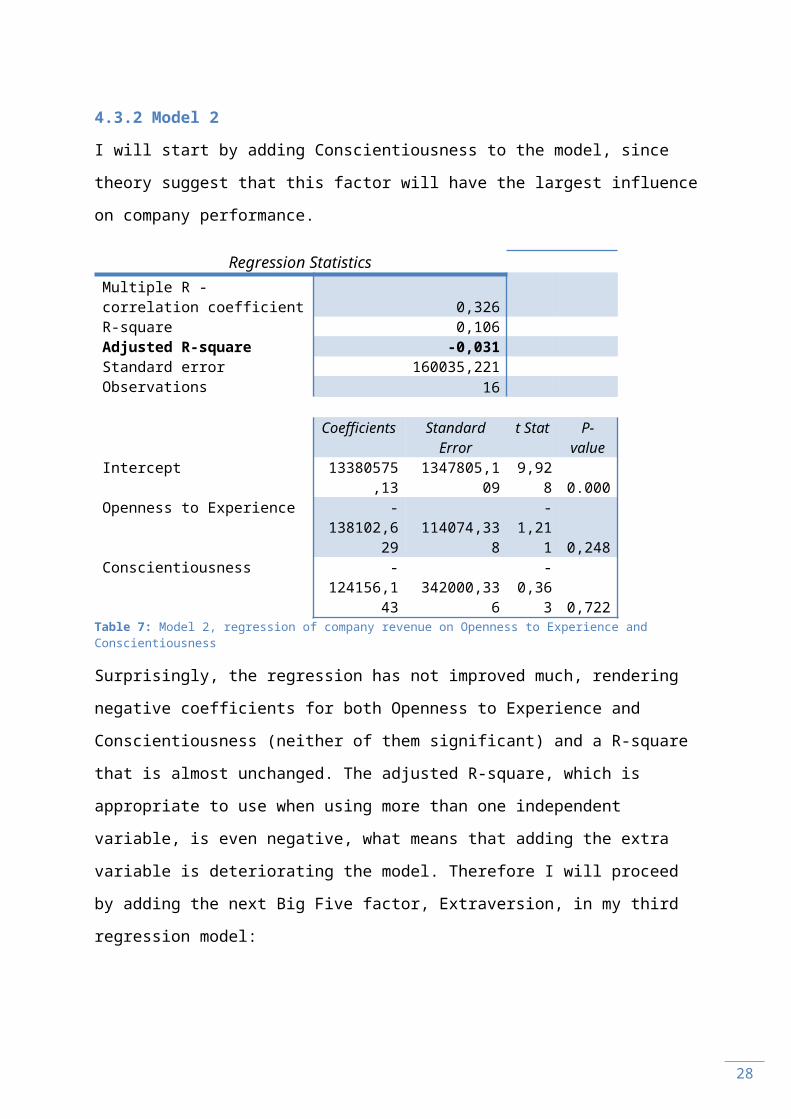
4.3.2 Model 2
I will start by adding Conscientiousness to the model, since theory suggest that this factor
will have the largest influence on company performance.
Regression StatisticsMultiple R - correlation coefficient 0,326R-square 0,106Adjusted R-square -0,031Standard error 160035,221Observations 16
Coefficients Standard Error
t Stat P-value
Intercept 13380575,13 1347805,109 9,928 0.000Openness to Experience -138102,629 114074,338 -1,211 0,248Conscientiousness -124156,143 342000,336 -0,363 0,722
Table 7: Model 2, regression of company revenue on Openness to Experience and Conscientiousness
Surprisingly, the regression has not improved much, rendering negative coefficients for both
Openness to Experience and Conscientiousness (neither of them significant) and a R-square
that is almost unchanged. The adjusted R-square, which is appropriate to use when using
more than one independent variable, is even negative, what means that adding the extra
variable is deteriorating the model. Therefore I will proceed by adding the next Big Five
factor, Extraversion, in my third regression model:
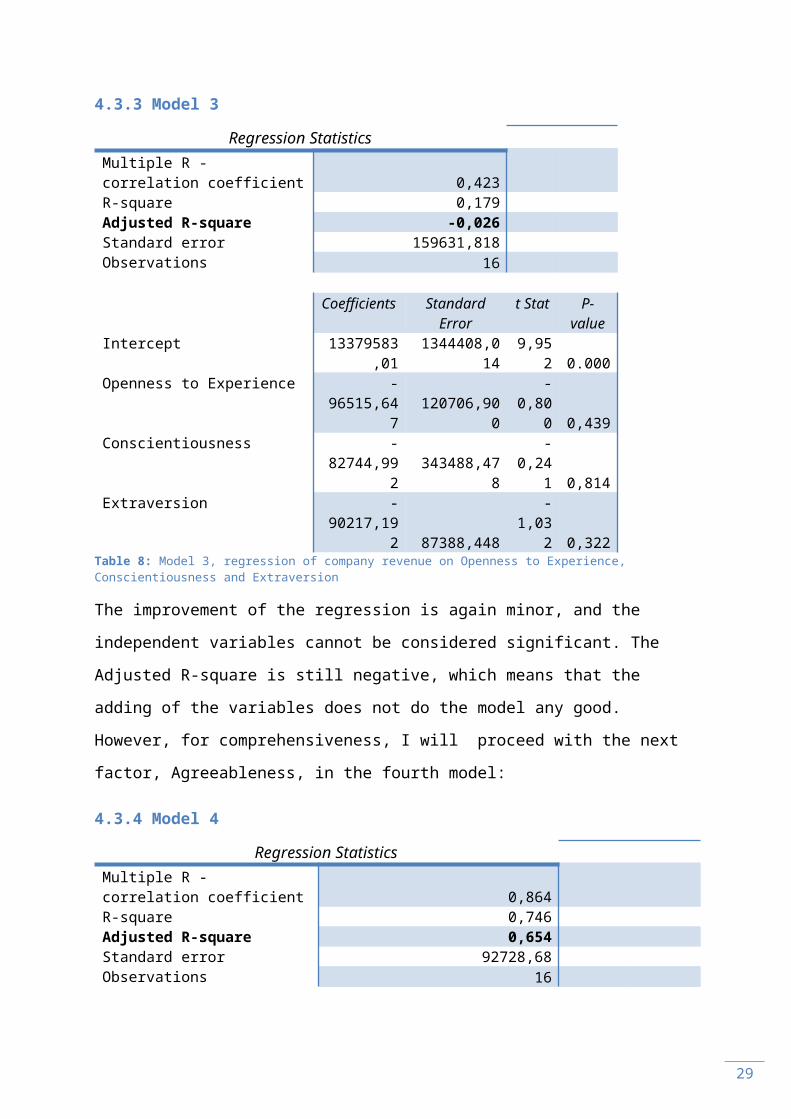
4.3.3 Model 3
Regression StatisticsMultiple R - correlation coefficient 0,423R-square 0,179Adjusted R-square -0,026Standard error 159631,818Observations 16
Coefficients Standard Error
t Stat P-value
Intercept 13379583,01 1344408,014 9,952 0.000Openness to Experience -96515,647 120706,900 -0,800 0,439Conscientiousness -82744,992 343488,478 -0,241 0,814Extraversion -90217,192 87388,448 -1,032 0,322
Table 8: Model 3, regression of company revenue on Openness to Experience, Conscientiousness and Extraversion
The improvement of the regression is again minor, and the independent variables cannot be
considered significant. The Adjusted R-square is still negative, which means that the adding
20
of the variables does not do the model any good. However, for comprehensiveness, I will
proceed with the next factor, Agreeableness, in the fourth model:
4.3.4 Model 4
Regression StatisticsMultiple R - correlation coefficient 0,864R-square 0,746Adjusted R-square 0,654Standard error 92728,68Observations 16
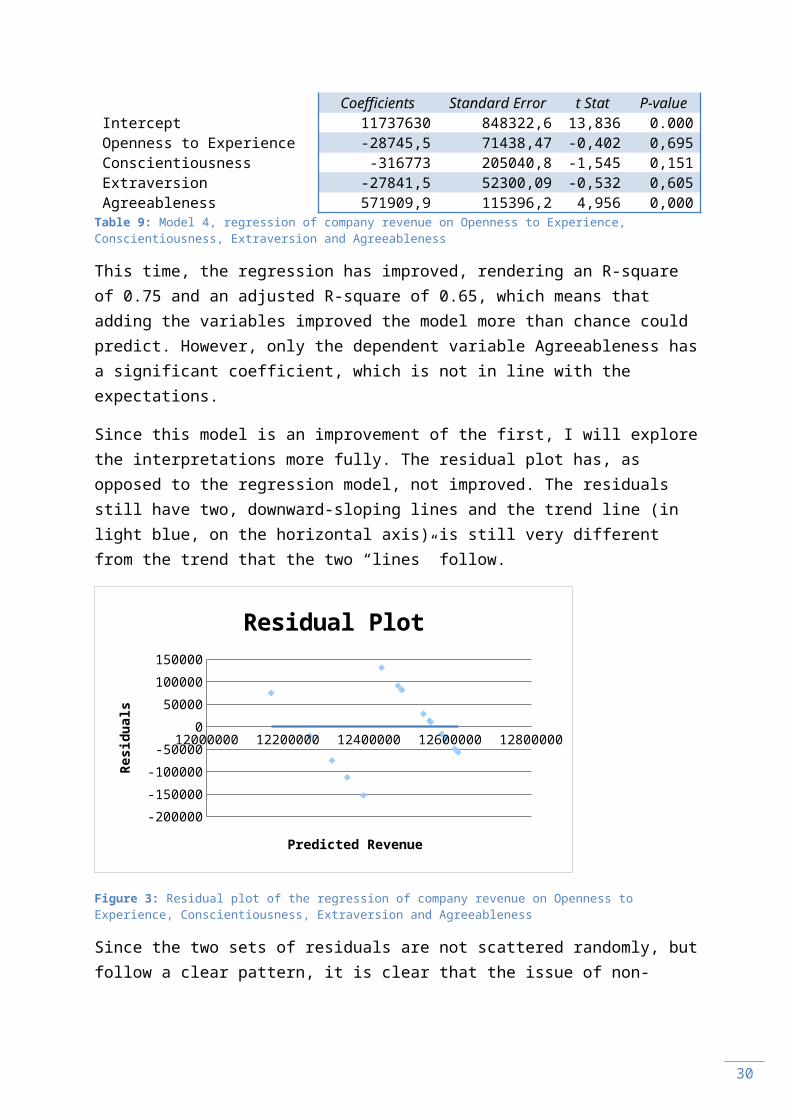
Coefficients Standard Error t Stat P-valueIntercept 11737630 848322,6 13,836 0.000Openness to Experience -28745,5 71438,47 -0,402 0,695Conscientiousness -316773 205040,8 -1,545 0,151Extraversion -27841,5 52300,09 -0,532 0,605Agreeableness 571909,9 115396,2 4,956 0,000
Table 9: Model 4, regression of company revenue on Openness to Experience, Conscientiousness, Extraversion and Agreeableness
This time, the regression has improved, rendering an R-square of 0.75 and an adjusted R-square of 0.65, which means that adding the variables improved the model more than chance could predict. However, only the dependent variable Agreeableness has a significant coefficient, which is not in line with the expectations.
Since this model is an improvement of the first, I will explore the interpretations more fully. The residual plot has, as opposed to the regression model, not improved. The residuals still have two, downward-sloping lines and the trend line (in light blue, on the horizontal axis) is still very different from the trend that the two “lines” follow.
21
12100000 12200000 12300000 12400000 12500000 12600000 12700000
-200000
-150000
-100000
-50000
0
50000
100000
150000
Residual Plot
Predicted Revenue
Resid
uals
Figure 3: Residual plot of the regression of company revenue on Openness to Experience, Conscientiousness, Extraversion and Agreeableness
Since the two sets of residuals are not scattered randomly, but follow a clear pattern, it is clear that the issue of non-normality of the sample is not resolved. However, this was to be expected, since the sample was not selected randomly.
Now, I will run a regression with all Big Five estimates:
4.3.5 Model 5
Regression StatisticsMultiple R - correlation coefficient 0,910R-square 0,829Adjusted R-square 0,743Standard error 79858,71Observations 16
Coefficients Standard Error t Stat P-valueIntercept 11266290 761403,6 14,797 0.000Openness to Experience -8336,7 62220,12 -0,134 0,896Conscientiousness 67887,35 248612,4 0,273 0,790Extraversion -49479,1 46104,5 -1,073 0,308Agreeableness 56072,32 254859,8 0,220 0,830Neuroticism 400479,1 182201,7 2,198 0,053
Table 10: Model 5, regression of company revenue on Openness to Experience, Conscientiousness, Extraversion, Agreeableness and Neuroticism

22
The regression formula generated by this model is the following:
company revenue = 11266290 -8336,7*(Openness to experience managers) +
67887,35* (conscientiousness managers) -49479,1*(extraversion managers) +
56072,32*(emotional stability managers) + 400479,1*(agreeableness managers)
The effect of Openness to Experience remains negative and insignificant and the coefficient
of Agreeableness has deteriorated, not even coming close to being statistically significant.
Another surprise is the significance of Neuroticism (significant at the 0.10 level). The
adjusted R-squared shows that this regression is preferable to the previous one (0.74 versus
0.65).
12100000 12200000 12300000 12400000 12500000 12600000 12700000
-200000
-150000
-100000
-50000
0
50000
100000
150000
Residual Plot
Predicted Revenue
Resid
uals
Figure 4: Residual plot of the regression of company revenue on Openness to Experience, Conscientiousness, Extraversion, Agreeableness and Neuroticism
The residual plot shows a similar pattern to the residual plot of the previous regression. Therefore, the interpretation stays the same: since there are two sets which appear to be following a clear pattern, means that the sample does not suffice the condition of normality.
A possible way to improve the normality is to take job tenure into account, which will be done in the next model:
4.3.6 Model 6
Regression StatisticsMultiple R - correlation coefficient 0,911R-square 0,830Adjusted R-square 0,717Standard error 83765,919

23
Observations 16
Coefficients Standard Error
t Stat P-value
Intercept11120538,04 936427,159
11,875 0.000
Job Tenure 1034,799 3471,202 0,298 0,772Openness to Experience -5265,119 66072,654 -0,080 0,938Conscientiousness 118288,100 310786,357 0,380 0,712Extraversion -40233,210 57451,315 -0,700 0,501Agreeableness 7623,277 312854,488 0,024 0,981Neuroticism 435663,151 224621,994 1,940 0,084
Table 11: Model 6, regression of company revenue on the Big Five and job tenure
This regression model has a lower adjusted square, which means that the previous model is
better at explaining the different revenues. Therefore, I will not elaborate further on this
specific model.
Another way for Openness to Experience to influence company revenue could be through
interactions with other variables. Because of the large amount of variables, I will only
present the variables that generated an adjusted R-square that was higher than the fifth
model:
4.3.7 Model 7
Regression StatisticsMultiple R - correlation coefficient 0,945R-square 0,893Adjusted R-square 0,799Standard error 70632,416Observations 16
Coefficients Standard Error t Stat P-valueIntercept -1135873,681 5733452,832 -0,198 0,848Job Tenure 3387,446 3123,352 1,085 0,310Openness to Experience 3377020,886 1568120,414 2,154 0,063Conscientiousness 385186,432 289771,260 1,329 0,220Extraversion -40892,882 48444,594 -0,844 0,423Agreeableness 2869370,088 1351934,18 2,122 0,066Neuroticism 711179,065 228407,359 3,114 0,014Openness to Experience * Agreeableness -915656,586 424255,448 -2,158 0,063
Table 12: regression of company revenue on the Big Five, job tenure and the interaction of Openness to Experience and Agreeableness
In this model, both Openness to Experience, Agreeableness and the interaction are
statistically significant at the 0.10 level, as well as Neuroticism (which is significant at the

24
0.05 level). The interaction means that for a given value of Agreeableness, say, 3, the effect
of Openness to Experience does not only incorporate the coefficient of Openness to
Experience, but the coefficient of the interaction as well. This means that for a higher value
of Agreeableness, the effect of Openness to Experience diminishes.
For the average levels of the manager's Agreeableness of the both companies, the effect of
Openness to Experience amounts to:
For the company under SAM, the effect amounts to:
3377020.886−915656.586∗3.714=−23269.846
For the financially healthy company, the effect amounts to:
3377020.886−915656.586∗3.372=289793.141
This small mathematical example shows the magnitude of the interaction on the effect that
is examined in the paper. This is yet another confirmation that the interaction is a factor that
should not be left out.
Unfortunately, but unsurprisingly, the residual plot still shows the non-normality because of
the non-random selection of the sample.
12100000 12200000 12300000 12400000 12500000 12600000 12700000
-200000
-150000
-100000
-50000
0
50000
100000
Residual Plot
Predicted Revenue
Resid
uals
Figure 5: Residual plot of the regression of company revenue on the Big Five, job tenure and the interaction of Openness to Experience and Agreeableness

25
Looking at the other factors, it is visible that job tenure, Conscientiousness and Extraversion
are not statistically significant. Because Neuroticism is statistically significant, it might be
useful to see if the interaction effect of Neuroticism with Openness to Experience is an
improvement over the sixth model. However, neither the model where this interaction was
added to the sixth model, nor the one where it was added to the seventh were an
improvement of the seventh model with respect to the adjusted R-square. Therefore, I will
not include them. These excluded regression models can be found in appendix three.
4.3.8 Model 8
In this model, I will delete the variable with the highest p-value, Extraversion:
Regression StatisticsMultiple R - correlation coefficient 0,940R-square 0,883Adjusted R-square 0,806Standard error 69495,233Observations 16
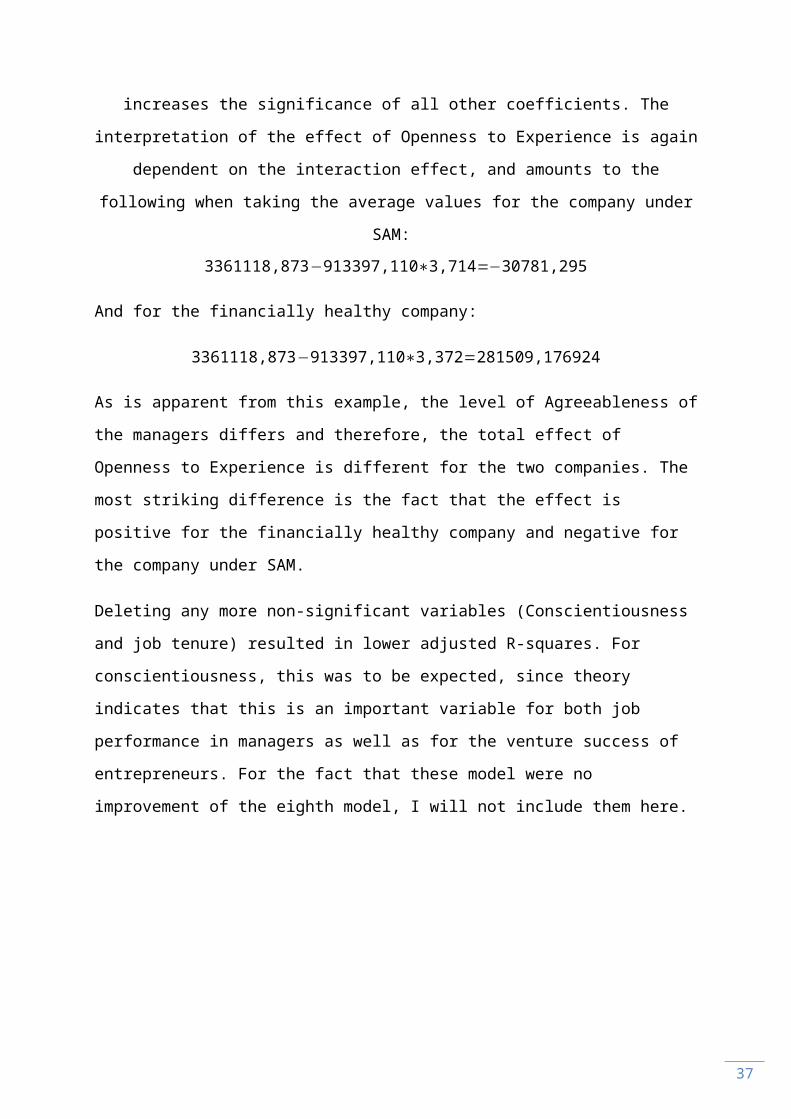
Coefficients Standard Error t Stat P-valueIntercept -1306586,869 5637633,674 -0,232 0,822Job Tenure 4715,422 2654,766 1,776 0,109Openness to Experience 3361118,873 1542762,316 2,179 0,057Conscientiousness 408041,550 283858,616 1,437 0,184Agreeableness 2846034,943 1329889,908 2,140 0,061Neuroticism 731400,322 223490,569 3,273 0,010Openness to Experience * Agreeableness -913397,110 417416,622 -2,188 0,056
Table 13: regression of company revenue on the Openness to Experience, Conscientiousness, Agreeableness, Neuroticism, job tenure and the interaction of Openness to Experience and Agreeableness
Deleting this variable from the equation has improved the model (as indicated by a higher
adjusted R-squared). It also increases the significance of all other coefficients. The
interpretation of the effect of Openness to Experience is again dependent on the interaction
effect, and amounts to the following when taking the average values for the company under
SAM:
3361118,873−913397,110∗3,714=−30781,295
And for the financially healthy company:
3361118,873−913397,110∗3,372=281509,176924

26
As is apparent from this example, the level of Agreeableness of the managers differs and
therefore, the total effect of Openness to Experience is different for the two companies. The
most striking difference is the fact that the effect is positive for the financially healthy
company and negative for the company under SAM.
Deleting any more non-significant variables (Conscientiousness and job tenure) resulted in
lower adjusted R-squares. For conscientiousness, this was to be expected, since theory
indicates that this is an important variable for both job performance in managers as well as
for the venture success of entrepreneurs. For the fact that these model were no
improvement of the eighth model, I will not include them here.
Since this model is the model with the highest explanatory value (as indicated by the
Adjusted R-squared), I will discuss the residual plot:
12100000 12200000 12300000 12400000 12500000 12600000 12700000
-150000
-100000
-50000
0
50000
100000
Residual Plot
Predicted Revenue
Resid
uals
Figure 6: Residual plot of the regression of company revenue on the Openness to Experience, Conscientiousness, Agreeableness, Neuroticism, job tenure and the interaction of Openness to Experience and Agreeableness
The division into two groups of the sample is very clear, indication non-normality of the data.
However, when comparing to the previous residual plots, the residuals have decreased in
seze, indicating a better-fitting model.
5. Conclusion
To answer the research question "Does Openness to Experience (as part of a manager's
personality) have an influence on the financial performance of the company?", the regression
models show that Openness to Experience has a significant (p value 0.057) and positive
27
influence on company performance as measured by revenues. Moreover, the interaction
effect between Openness to Experience and Agreeableness is negative, which means that
the effect of Openness to Experience decreased when the value of Agreeableness increases.
This effect was very visible in both companies as well, the company under SAM for instance,
had a higher value for Agreeableness than the financially healthy company, which resulted in
a negative overall effect of Openness to Experience for this company. For the financially
healthy company, which had a lower value of Agreeableness, the overall effect was positive.
Therefore, the hypothesis "Average managers' openness to experience will have a positive
influence on company revenues" is rejected. From the results it has become clear that the
interaction between Openness to Experience and Agreeableness has a significant effect on
the overall effect of Openness to Experience. The model which was presented in the theory
section, must be adjusted.
Now, the model visualizes the direct effect of Openness to Experience (as indicated by the
horizontal arrow), which is positive, and the interaction effect (as represented by the vertical
arrow), which is negative. Despite the fact that the coefficient of the interaction is smaller
than the coefficient of Openness to Experience, it turns negative when the value of
Agreeableness exceeds 3.680.
The implications of this research are the following: all in all, Openness to Experience seems
to be a factor that has quite some influence on the financial performance of the company.
However, whether this effect is positive of negative depends on the level of Agreeableness
of the managers in the company. This is an important fact for both the companies examined
and companies in general. For the company under SAM, it might be useful in their quest for
financial prosperity. For the company that is already financially healthy, it might be a way to
secure this, even when there is employee turnover.
(-)
(+)Company RevenuesManager's Openness to Experience
Manager's Agreeableness
28
When comparing these results to the literature previously examined, there are some
differences. For instance, Conscientiousness was one of the least significant factors in the
regression models, whereas this factor has been highlighted as one of the biggest predictors
of performance. The factor Openness to Experience has not been fully explored in the
papers reviewed, since they did not take an interaction effect into account. This interaction
effect causes my results to deviate from previous ones. In the paper by Barrick & Mount
(1991), Openness to Experience was thought to have a weak and positive effect. In this
research however, the effect of Openness to Experience is heavily influenced by the
interaction with Agreeableness. However, when Agreeableness is high, which causes the
overall effect of Openness to Experience to be negative, the effect is in accordance with the
paper on venture survival and entrepreneur personality by Chiaravella et al (2004).
6. Discussion & limitations
The most important limitation of this research has to do with the sample size. Since the
sample was not random and consisted of only 16 people, the representativeness of this
research is very limited. Moreover, since this paper has focused on the data from a survey,
the typical survey limitations apply:
- Common method bias, the potential inflation of correlations between measures that are
computed via the same method (e.g., self-report) (Meade, Watson, & Kroustalis, 2007).
However, this bias is likely to be small to moderate in organizational research (Meade,
Watson, & Kroustalis, 2007).
- Social desirability (or self-deception) bias, the possibility that respondents answer the
questions in a way that portrays them as nicer, better persons. However, this effect is
expected to be small, because the stakes are low with regard to the outcomes of this paper.
- The possibility that the Big Five personality factors are not comprehensive enough. This
topic has been investigated by Judge et al (1991), claiming that the evidence suggests that
virtually all personality measures can be categorized or led back to the Big Five.
- Survey outcomes can be seen as a snapshot, it might be that something that happened
before taking the survey has influenced the respondent, inducing them to answer in a way
that is not representative of their normal behavior or feelings.
29
There are multiple recommendations for future research. I will start with the most common
and most obvious: a bigger, randomly selected sample. With regard to sample size, this
research can be pegged as more exploratory than explanatory. However, since the results
indicated an effect, true explanatory research is recommended.
Secondly, it might be interesting if the relations found in these two Dutch companies can be
confirmed in different countries.
All in all, this research has contributed to research regarding financial performance, which
tends to focus on other financial indicators. This research shows that the personalities in a
company are forces to reckon with. Moreover, this research seems to indicate that the
different aspects have a different influence than expected, because of interaction effects.
30
7. References
Airioldi, M. (2013). Disinvestments in Practice: Overcoming Resistance to Change through a Sociotechnical Approach with Local Stakeholders. Journal of Health Polotics Policy and Law (38), 1149-1171.
Allport, G. W. (1936). Trait-names: A psycho-lexical study. Psychological Monographs , i-171.
Barrick, M. R., & Mount, M. K. (1991). The Big Five Personality Dimensions and Job Performance: A Meta-Analysis. Personnel Psychology (44), 1-26.
Capon, N. F. (1990). Determinants of Financial Performance: a Meta-Analysis. Journal of Management Science , 1143-1159.
Cattell, R. B. (1943). The description of personality: basic traits resolved into clusters. The Journal of Abnormal and Social Psychology , 476-506.
Cattell, R. B. (1945). The Description of Personality: Principles and Findings in a Factor Analysis. The American Journal of Psychology , 69-90.
Centraal Bureau voor de Statistiek. (2015, April 15). Bedrijfsleven; arbeids- en financiële gegevens, per branche, SBI 2008. Retrieved Juli 15, 2015, from Statline; Centraal Bureau voor de Statistiek: http://statline.cbs.nl/Statweb/publication/?DM=SLNL&PA=81156NED&D1=1,3-21&D2=38,228&D3=3-4&HDR=G2,G1&STB=T&VW=T
Choe, & Yongduk. (2013). Resistance to Organizational Change and Organizational Commitment: The Mediating Role of Job Stress and the Moderating Roles of Union Instrumentality and Procedural Justice. Korean Journal of Management (21), 1-36.
Ciavarella, M. A., Buchholtz, A. K., Riordan, C. M., Gatewood, R. D., & Stokes, G. S. (2004). The Big Five and Venture Survival: Is there a linkage? Journal of Business Venturing (19), 465-483.
Costa, J. P., & McCrae, R. R. (1994). Set like plaster? Evidence for the stability of adult personality. American Psychological Association , 21-40.
Fiske, D. W. (1949). Consistency of the factorial structures of personality ratings from diffent sources. The Journal of Abnormal and Social Psychology , 329-344.
Goldberg, L. R. (1981). Language and Individual differences: the search for universals in personality lexicons. Review of personality and social psychology , 141-165.
Gosling, S. D. (2003). A very brief measure of the Pig-Five personality domains. Journal of Research in Personality , 504-528.
Hg, T. W. (2010). Organizational Tenure and Job Performance. Journal of Management , 1220-1250.
Hurtz, G. M., & Donovan, J. J. (2000). Personality and Job Performance: The Big Five Revisited. Journal of Applied Psychology (85), 869-879.

31
IPIP. (n.d.). A Scientific Collaboratory for the Development of Advanced Measures of Personality Traits and Other Individual Differences. Retrieved 6 19, 2015, from International Personality Item Pool: http://ipip.ori.org/
John, O. P. (2001). The Big Five Trait Taxonomy: History, Measurement, and Theoretical Perspectives. In O. P. John, Handbook of personality: Theory and research. New York: The Guilford Press.
Lundy, V., & Morin, P.-P. (2013). Project Leadership Influences Resistance to Change: The Case of the Canadian Public Service. Project Management Journal (44), 45-64.
McCrae, R. R. (1994). Openness to Experience: expanding the boundaries of Factor V. European Journal of Personality (8), 251-272.
Meade, A. W., Watson, A. M., & Kroustalis, C. M. (2007). Assessing Common Methods Bias in Organizational Research. 22nd Annual Meeting of the Society for Industrial and Organizational Psychology (pp. 1-10). New York: .
Rabobank. (n.d.). Our aim is to enable a business to survive. Retrieved April 29, 2015, from Background stories: Cooperative, Special Asset Management: https://www.rabobank.com/en/about-rabobank/background-stories/cooperative/our-aim-is-to-enable-a-business-to-survive.html
Rothmann, S. C. (2003). The Big Five Personality Dimensions and Job Performance. Journal of Industrial Psychology , 68-74.

32
8. Appendices
8.1 Appendix 1: survey in Dutch (as distributed to the respondents)
Welkom en bij voorbaat dank voor uw participatie in deze enquête. Wij willen graag benadrukken dat het van groot belang is dat u het antwoord kiest dat het dichtste bij uzelf staat. Wij willen u erop attent maken dat er geen 'vorige'-knop is. Wees dus alstublieft zeker over uw antwoord voordat u naar de volgende vraag gaat!
Er is geen vastgestelde tijd waarbinnen u de vragenlijst moet beantwoorden.
Mocht u vragen en/of opmerkingen hebben tijdens de enquête, pauzeer deze, dan kunt u uw vraag sturen naar het volgende e-mail adres:[email protected]. Zou u ons willen vertellen hoeveel jaar u uw huidige functie vervult?
Als u dit niet zeker weet, geef dit dan als volgt aan: "schatting: # jaar"Q1. Kunt u aangeven in hoeverre u het eens bent met de volgende zinnen?Ik heb moeite met het begrijpen van abstracte ideeën.
Sterk mee oneens
Mee oneens
Niet mee eens niet mee oneens
Mee eens
Sterk mee eensQ2.Ik ben niet geïnteresseerd in abstracte ideeën.
Sterk mee oneens
Mee oneens
Niet mee eens niet mee oneens
Mee eens
Sterk mee eensQ41.Ik heb een grote woordenschat.
Sterk mee oneens
Mee oneens
Niet mee eens niet mee oneens
Mee eens
Sterk mee eens

33
Q3.Ik heb geen grote verbeeldingskracht.
Sterk mee oneens
Mee oneens
Niet mee eens niet mee oneens
Mee eens
Sterk mee eensQ4.Ik zit vol met ideeën.
Sterk mee oneens
Mee oneens
Niet mee eens niet mee oneens
Mee eens
Sterk mee eensQ5.Ik begrijp zaken snel.
Sterk mee oneens
Mee oneens
Niet mee eens niet mee oneens
Mee eens
Sterk mee eensQ6.Ik gebruik moeilijke woorden.
Sterk mee oneens
Mee oneens
Niet mee eens niet mee oneens
Mee eens
Sterk mee eensQ7.Ik besteed tijd aan reflectie.
Sterk mee oneens
Mee oneens
Niet mee eens niet mee oneens
Mee eens
Sterk mee eensQ8.Ik heb uitstekende ideeën.

34
Sterk mee oneens
Mee oneens
Niet mee eens niet mee oneens
Mee eens
Sterk mee eensQ9.Ik heb een levendige fantasie.
Sterk mee oneens
Mee oneens
Niet mee eens niet mee oneens
Mee eens
Sterk mee eensQ10.Ik ben de gangmaker op een feest.
Sterk mee oneens
Mee oneens
Niet mee eens niet mee oneens
Mee eens
Sterk mee eensQ11.Ik praat niet zo veel.
Sterk mee oneens
Mee oneens
Niet mee eens niet mee oneens
Mee eens
Sterk mee eensQ12.Ik blijf op de achtergrond.
Sterk mee oneens
Mee oneens
Niet mee eens niet mee oneens
Mee eens
Sterk mee eensQ13.Ik praat met veel verschillende mensen op feesten.
Sterk mee oneens
Mee oneens

35
Niet mee eens niet mee oneens
Mee eens
Sterk mee eensQ14.Ik ben stil in het gezelschap van vreemden.
Sterk mee oneens
Mee oneens
Niet mee eens niet mee oneens
Mee eens
Sterk mee eensQ15.Ik vind het niet erg om het middelpunt van de aandacht te zijn.
Sterk mee oneens
Mee oneens
Niet mee eens niet mee oneens
Mee eens
Sterk mee eensQ16.Ik vind het niet leuk om de aandacht op mezelf te vestigen.
Sterk mee oneens
Mee oneens
Niet mee eens niet mee oneens
Mee eens
Sterk mee eensQ17.Ik heb niet zo veel te zeggen.
Sterk mee oneens
Mee oneens
Niet mee eens niet mee oneens
Mee eens
Sterk mee eensQ18.Ik start conversaties.
Sterk mee oneens
Mee oneens
Niet mee eens niet mee oneens
Mee eens

36
Sterk mee eensQ19.Ik voel me comfortabel in het gezelschap van anderen.
Sterk mee oneens
Mee oneens
Niet mee eens niet mee oneens
Mee eens
Sterk mee eensQ20.Ik vergeet vaak dingen op de juiste plek terug te leggen.
Sterk mee oneens
Mee oneens
Niet mee eens niet mee oneens
Mee eens
Sterk mee eensQ21.Ik ontloop het werk dat ik moet doen.
Sterk mee oneens
Mee oneens
Niet mee eens niet mee oneens
Mee eens
Sterk mee eensQ22.Ik houd van orde.
Sterk mee oneens
Mee oneens
Niet mee eens niet mee oneens
Mee eens
Sterk mee eensQ23.Ik ga grondig te werk.
Sterk mee oneens
Mee oneens
Niet mee eens niet mee oneens
Mee eens
Sterk mee eensQ24.
37
Ik volg het plan.
Sterk mee oneens
Mee oneens
Niet mee eens niet mee oneens
Mee eens
Sterk mee eensQ25.Ik besteed aandacht aan details.
Sterk mee oneens
Mee oneens
Niet mee eens niet mee oneens
Mee eens
Sterk mee eensQ26.Ik voer mijn klusjes meteen uit.
Sterk mee oneens
Mee oneens
Niet mee eens niet mee oneens
Mee eens
Sterk mee eensQ27.Ik maak rommel.
Sterk mee oneens
Mee oneens
Niet mee eens niet mee oneens
Mee eens
Sterk mee eensQ28.Ik laat mijn eigendommen slingeren.
Sterk mee oneens
Mee oneens
Niet mee eens niet mee oneens
Mee eens
Sterk mee eensQ29.Ik ben altijd voorbereid.
Sterk mee oneens

38
Mee oneens
Niet mee eens niet mee oneens
Mee eens
Sterk mee eensQ30.Ik ben snel gestrest.
Sterk mee oneens
Mee oneens
Niet mee eens niet mee oneens
Mee eens
Sterk mee eensQ31.Ik ben meestal relaxed.
Sterk mee oneens
Mee oneens
Niet mee eens niet mee oneens
Mee eens
Sterk mee eensQ32.Ik maak me zorgen over dingen.
Sterk mee oneens
Mee oneens
Niet mee eens niet mee oneens
Mee eens
Sterk mee eensQ33.Ik voel me zelden verdrietig.
Sterk mee oneens
Mee oneens
Niet mee eens niet mee oneens
Mee eens
Sterk mee eensQ34.Ik ben snel verontrust.
Sterk mee oneens
Mee oneens
Niet mee eens niet mee oneens

39
Mee eens
Sterk mee eensQ35.Ik ben snel van streek.
Sterk mee oneens
Mee oneens
Niet mee eens niet mee oneens
Mee eens
Sterk mee eensQ36.Ik wissel vaak van stemming.
Sterk mee oneens
Mee oneens
Niet mee eens niet mee oneens
Mee eens
Sterk mee eensQ37.Ik heb regelmatig stemmingswisselingen.
Sterk mee oneens
Mee oneens
Niet mee eens niet mee oneens
Mee eens
Sterk mee eensQ38.Ik ben snel geïrriteerd.
Sterk mee oneens
Mee oneens
Niet mee eens niet mee oneens
Mee eens
Sterk mee eensQ39.Ik voel me vaak verdrietig.
Sterk mee oneens
Mee oneens
Niet mee eens niet mee oneens
Mee eens
Sterk mee eens
40
Q40.Ik voel weinig bezorgdheid om anderen.
Sterk mee oneens
Mee oneens
Niet mee eens niet mee oneens
Mee eens
Sterk mee eensQ42.Ik ben teerhartig.
Sterk mee oneens
Mee oneens
Niet mee eens niet mee oneens
Mee eens
Sterk mee eensQ43.Ik ben niet geïnteresseerd in anderen.
Sterk mee oneens
Mee oneens
Niet mee eens niet mee oneens
Mee eens
Sterk mee eensQ44.Ik voel andermans emoties aan.
Sterk mee oneens
Mee oneens
Niet mee eens niet mee oneens
Mee eens
Sterk mee eensQ45.Ik zorg ervoor dat anderen zich op hun gemak voelen.
Sterk mee oneens
Mee oneens
Niet mee eens niet mee oneens
Mee eens
Sterk mee eensQ46.Ik doe moeite voor anderen.
41
Sterk mee oneens
Mee oneens
Niet mee eens niet mee oneens
Mee eens
Sterk mee eensQ47.Ik ben niet geïnteresseerd in andermans problemen.
Sterk mee oneens
Mee oneens
Niet mee eens niet mee oneens
Mee eens
Sterk mee eensQ48.Ik voel mee met andermans gevoelens.
Sterk mee oneens
Mee oneens
Niet mee eens niet mee oneens
Mee eens
Sterk mee eensQ49.Ik beledig mensen.
Sterk mee oneens
Mee oneens
Niet mee eens niet mee oneens
Mee eens
Sterk mee eensQ50.Ik ben geïnteresseerd in mensen.
Sterk mee oneens
Mee oneens
Niet mee eens niet mee oneens
Mee eens
Sterk mee eensQ51. Zouden wij uw naam en/of e-mail adres mogen weten?(De antwoorden op deze enquête zullen geanonimiseerd worden en kunnen niet naar u worden teruggeleid)
Mocht u deze informatie liever niet geven, vul dan in:
42
"Zeg ik liever niet"
8.2 Appendix 2: survey translated to English
Welcome and thank you in advance for participating in this survey. We would like to stress that it is imperative that you choose the answer which is closes to your person. Please take notice of the fact that there is no "previous" button. Please be sure of your answer before you proceed to the next question.
There is no time limit for this survey.
If you have any questions or remarks during the time that you are making this survey, please pause your survey response and send your question to the following e-mail address:
Please indicate how much you agree with the following statements:I …
Am the life of the party.Strongly agree / agree / don’t know / disagree / strongly disagree
Feel little concern for others.Strongly agree / agree / don’t know / disagree / strongly disagree
Am always prepared.Strongly agree / agree / don’t know / disagree / strongly disagree
Get stressed out easily.Strongly agree / agree / don’t know / disagree / strongly disagree
Have a rich vocabulary.Strongly agree / agree / don’t know / disagree / strongly disagree
Don't talk a lot.Strongly agree / agree / don’t know / disagree / strongly disagree
Am interested in people.Strongly agree / agree / don’t know / disagree / strongly disagree
Leave my belongings around.Strongly agree / agree / don’t know / disagree / strongly disagree
Am relaxed most of the time.Strongly agree / agree / don’t know / disagree / strongly disagree
Have difficulty understanding abstract ideas.Strongly agree / agree / don’t know / disagree / strongly disagree
Feel comfortable around people. Strongly agree / agree / don’t know /

43
disagree / strongly disagree
Insult people.Strongly agree / agree / don’t know / disagree / strongly disagree
Pay attention to details.Strongly agree / agree / don’t know / disagree / strongly disagree
Worry about things.Strongly agree / agree / don’t know / disagree / strongly disagree
Have a vivid imagination.Strongly agree / agree / don’t know / disagree / strongly disagree
Keep in the background.Strongly agree / agree / don’t know / disagree / strongly disagree
Sympathize with others' feelings.Strongly agree / agree / don’t know / disagree / strongly disagree
Make a mess of things.Strongly agree / agree / don’t know / disagree / strongly disagree
Seldom feel blue.Strongly agree / agree / don’t know / disagree / strongly disagree
Am not interested in abstract ideas.Strongly agree / agree / don’t know / disagree / strongly disagree
Start conversations.Strongly agree / agree / don’t know / disagree / strongly disagree
Am not interested in other people's problems.Strongly agree / agree / don’t know / disagree / strongly disagree
Get chores done right away.Strongly agree / agree / don’t know / disagree / strongly disagree
Am easily disturbed.Strongly agree / agree / don’t know / disagree / strongly disagree
Have excellent ideas.Strongly agree / agree / don’t know / disagree / strongly disagree
Have little to say.Strongly agree / agree / don’t know / disagree / strongly disagree
Have a soft heart.Strongly agree / agree / don’t know / disagree / strongly disagree
Often forget to put things back in their proper place.Strongly agree / agree / don’t know / disagree / strongly disagree

44
Get upset easily.Strongly agree / agree / don’t know / disagree / strongly disagree
Do not have a good imagination.Strongly agree / agree / don’t know / disagree / strongly disagree
Talk to a lot of different people at parties.Strongly agree / agree / don’t know / disagree / strongly disagree
Am not really interested in others.Strongly agree / agree / don’t know / disagree / strongly disagree
Like order.Strongly agree / agree / don’t know / disagree / strongly disagree
Change my mood a lot.Strongly agree / agree / don’t know / disagree / strongly disagree
Am quick to understand things.Strongly agree / agree / don’t know / disagree / strongly disagree
Don't like to draw attention to myself.Strongly agree / agree / don’t know / disagree / strongly disagree
Take time out for others.Strongly agree / agree / don’t know / disagree / strongly disagree
Shirk my duties.Strongly agree / agree / don’t know / disagree / strongly disagree
Have frequent mood swings.Strongly agree / agree / don’t know / disagree / strongly disagree
Use difficult words.Strongly agree / agree / don’t know / disagree / strongly disagree
Don't mind being the center of attention.Strongly agree / agree / don’t know / disagree / strongly disagree
Feel others' emotions.Strongly agree / agree / don’t know / disagree / strongly disagree
Follow a schedule.Strongly agree / agree / don’t know / disagree / strongly disagree
Get irritated easily.Strongly agree / agree / don’t know / disagree / strongly disagree
Spend time reflecting on things.Strongly agree / agree / don’t know / disagree / strongly disagree

45
Am quiet around strangers.Strongly agree / agree / don’t know / disagree / strongly disagree
Make people feel at ease.Strongly agree / agree / don’t know / disagree / strongly disagree
Am exacting in my work.Strongly agree / agree / don’t know / disagree / strongly disagree
Often feel blue.Strongly agree / agree / don’t know / disagree / strongly disagree
Am full of ideas.Strongly agree / agree / don’t know / disagree / strongly disagree
Could you tell us your name or e-mail address? (the answers to this survey will be kept anonymous and cannot be traced back to you)
If you would rather not provide this information, please write "I prefer not to"
Please note, since the Dutch survey was in a certain format and I did not send out an English version, the questions are presented in a different manner. However, the questions are exactly the same.
8.3 Excluded regression models
Regression of company revenue on all Big Five, job tenure and the interaction of Openness to Experience and Neuroticism:
Regression StatisticsMultiple R - correlation coefficient 0,943R-square 0,889Adjusted R-square 0,792Standard error 71953,956Observations 16
Coefficients Standard Error t Stat P-valueIntercept 5724868,891 2753728,066 2,079 0,071Job Tenure 1978,734 3017,109 0,656 0,530Openness to Experience 1384296,894 680615,950 2,034 0,076Conscientiousness 225623,669 272054,067 0,829 0,431Extraversion -32886,421 269464,812 -0,122 0,906Agreeableness -20288,542 50301,036 -0,403 0,697Neuroticism 2530764,890 1040662,971 2,432 0,041Openness to Experience * Agreeableness -574040,366 280189,191 -2,049 0,075

46
Regression of company revenue on all Big Five, job tenure, the interaction of Openness to Experience and Agreeableness and the interaction of Openness to Experience and Neuroticism
Regression StatisticsMultiple R - correlation coefficient 0,949R-square 0,900Adjusted R-square 0,785Standard error 73050,697Observations 16
Coefficients Standard Error t Stat P-valueIntercept 641027,194 6461592,398 0,099 0,924Job Tenure 2999,079 3278,655 0,915 0,391Openness to Experience 2835435,882 1800689,582 1,575 0,159Conscientiousness 341256,494 306338,915 1,114 0,302Extraversion -30371,266 52358,377 -0,580 0,580Agreeableness 1784489,290 2100389,943 0,850 0,424Neuroticism 1688227,444 1431200,702 1,180 0,277Openness to Experience * Agreeableness -575211,947 659124,853 -0,873 0,412Openness to Experience * Neuroticism -295770,212 427307,996 -0,692 0,511