opening new perspectives for visual characterisation of pharmaceutical solids
DESCRIPTION
Solid particles characterizationTRANSCRIPT

Pharmaceutical Technology Division Department of Pharmacy
Faculty of Science University of Helsinki
Opening New Perspectives for Visual Characterisation of Pharmaceutical Solids
by
Niklas Laitinen
Academic Dissertation
To be presented with the permission of the Faculty of Science of the University of Helsinki,
for public criticism in Auditorium 1 at Viikki Infocentre (Viikinkaari 11A) on June 13th , 2003, at 12 noon
Helsinki 2003

Supervisor: Professor Jouko Yliruusi Pharmaceutical Technology Division Department of Pharmacy University of Helsinki Finland
Reviewers: Docent Jyrki Heinämäki Pharmaceutical Technology Division
Department of Pharmacy University of Helsinki Finland
Docent Jorma Laaksonen Laboratory of Computer and Information Science Department of Computer Science and Engineering Helsinki University of Technology Finland
Opponent: Dr. Robert T. Forbes School of Pharmacy
University of Bradford United Kingdom
© Niklas Laitinen 2003 ISBN 952-10-1037-1 ISBN 952-10-1038-X (pdf, http://ethesis.helsinki.fi/) ISSN 1239-9469 Yliopistopaino Helsinki 2003 Finland

1
ABSTRACT Laitinen, N.O., 2003. Opening New Perspectives for Visual Characterisation of Pharmaceutical Solids. Dissertationes Biocentri Viikki Universitatis Helsingiensis 16/2003, pp. 59.
ISBN 952-10-1037-1, ISBN 952-10-1038-X (pdf), ISSN 1239-9469
The physical characterisation of pharmaceutical solids is fundamental in the drug development
process. At present, the utilisation of descriptive image information in pharmaceutical technology
is very limited. Subsequently, the development of this discipline creates a challenge within the
characterisation of pharmaceutical solids. Research contributions aiming to improve the
efficiency of pharmaceutical manufacturing processes are needed. The attempts in developing
image-based particle characterisation tools for pharmaceutical powders should strive for reliable,
fast, and easily usable methods. New ideas in the field of visual characterisation can broaden the
scope of analytical techniques in pharmaceutical technology.
The aim of this study was to find new ways of using image information in pharmaceutical
powder technology and characterisation of pharmaceutical solids. The goal was to extract
relevant information from powder surfaces with the aim to broaden the use of image information
compared to the commonly used image analysis (IA) approaches in pharmaceutics, which only
measure properties of individual particles. Moreover, the aim was to link the information from
powder surface images with functional physical properties of pharmaceutical solids and to
enhance the use of surface imaging as a tool within pharmaceutical process analytical
technologies.
The characterisation of particulate populations through surface images was successful, with
respect to classification of powder images, measurement of the particle size of granular materials
and the prediction of tabletting behaviour of granules. A new parameter for describing the
particle size of granular material, the grey scale difference matrix (GSDM), was developed and
used effectively in particle size measurement. The idea of using a content-based image retrieval
(CBIR) technique for pharmaceutical powder images was also introduced and a basis was laid for
the future use of CBIR in powder characterisation. In addition, the presented visual
characterisation approach was effectively used as a process analytical tool. The utilisation of
surface image information to assure acceptable end product quality at the completion of a
granulation process was also possible.

2
ACKNOWLEDGEMENTS
This study was carried out at the Pharmaceutical Technology Division, Department of
Pharmacy, University of Helsinki, during the years 1998-2003.
I wish to express my deepest gratitude to Professor Jouko Yliruusi for his supervision
and encouragement during this study. His ingenious idea of visual characterisation of undispersed
powder surfaces started this work and evolved to this thesis through the many fruitful
discussions during these years. His inspiration and enthusiasm for physical pharmacy has always
been admirable and it has been a pleasure to learn and work under his guidance.
I am sincerely grateful to Docent Jukka Rantanen for his support and friendship during
these years. His interest and devotion to my work has given confidence and improved many
features of the study. I owe my thanks to him for encouraging me to return to academia and to
the exciting world of pharmaceutical research.
I express my respectful thanks to Docent Jyrki Heinämäki and Docent Jorma Laaksonen
for the reviewing of this thesis, the constructive comments and valuable suggestions for its
improvement.
I am most indebted to my co-author Osmo Antikainen whose contribution for this work
has been indispensable. Our inspiring discussions about the different aspects of surface imaging
in powder characterisation have shaped this work more than anything else. His skills in
programming and data analysis have been invaluable. Special thanks belong to the other co-
authors Sampsa Laine at the Neural Networks Research Centre, for pleasant and successful
collaboration in data visualisation and Eetu Räsänen and Sari Airaksinen, for granulation
expertise. I express my thankfulness for the collaboration of M.Sc. Susanna Miettinen and the
contributions of students Tea Lehtonen, Heidi Kettunen, Tina Suominen, and Antti Eskelinen.
I am very grateful to Professor Jukka-Pekka Mannermaa for his support in the early
stages of this work. I also wish to thank Esko Lauronen for the skillful installation of the imaging
instrument. I express my warm thanks to all colleagues (especially roommates!) at the
Pharmaceutical Technology Division for all the fun and the truly pleasant working atmosphere.
The co-operation with the National Technology Agency of Finland (TEKES) enabled
the first stages of the study. I gratefully acknowledge the financial support from the Association
of Finnish Pharmacies.
I am most thankful to all family members, especially my parents and my brother for all
the love and support during my studies. I am also grateful to friends who have shared the
moments of everyday life. Finally, my warmest thanks and love go to my loving and encouraging
wife Charlotta and our beautiful daughter Rakel for bringing extra happiness to my life.
Helsinki, May 2003

3
TABLE OF CONTENTS ABSTRACT 1 ACKNOWLEDGEMENTS 2 TABLE OF CONTENTS 3 List of abbreviations and mathematical symbols 5 List of original publications 6 1. INTRODUCTION 7 2. REVIEW OF THE LITERATURE 9
2.1 Pharmaceutical powders and granules 9 2.1.1 Classification of powders 9
2.1.2 The complexity of powders systems 9
2.1.3 Particle size 10
2.1.4 Particle shape 11
2.1.5 Segregation 12
2.1.6 Adhesion, cohesion and triboelectrification 12
2.1.7 Flowability 13
2.2 Particle size measurement techniques 13 2.3 Image analysis 16
2.3.1 Digital image information 16
2.3.2 Computerised image analysis in powder technology 17
2.3.3 Content-based image retrieval 18
2.3.4 Surface and bulk imaging 21
2.4 Data projection methods 23 2.4.1 Principal component analysis 24
2.4.2 Self-organising maps 26
3. AIMS OF THE STUDY 29 4. EXPERIMENTAL 30
4.1 Materials 30 4.1.1 Excipients mixtures 30
4.1.2 Model particles 30
4.1.3 Granules 30
4.2 Unit operations 31 4.2.1 Mixing 33
4.2.2 Fluidised bed granulation 33

4
4.2.3 Tablet compression 32
4.3 Characterisation of materials 32 4.3.1 Laser diffraction 32
4.3.2 Sieve analysis 32
4.3.3 Scanning electron microscopy 33
4.3.4 Optical microscopy 33
4.3.5 Image analysis of size and shape parameters 33
4.4 Content-based image retrieval 33 4.5 Surface imaging of powders and granules 35
4.5.1 The imaging setup 35
4.5.2 Grey scale difference matrix 36
4.6 Data analysis and modelling 37 4.6.1 Correlation analysis 37
4.6.2 Multivariate regression 37
4.6.3 Principal component analysis 38
4.6.4 Self-organising maps 38
4.6.5 Partial least squares modelling 38
5. RESULTS AND DISCUSSION 40 5.1. Visualisation of traditional image analysis data 40 5.1.1 Principal component analysis 40
5.1.2 Self-organising maps 40
5.1.3 Comparison of data visualisation
with PCA and SOM 41
5.2. Data extraction from powder surface images 42 5.2.1 Content-based image retrieval 42
5.2.2 The GSDM in particle size measurements 43
5.2.3 Imaging conditions 44
5.2.4 Comparison of methods used in particle
size analysis 45
5.2.5 Surface images in process monitoring 46
5.2.6 Prediction of compression behaviour 48
6. SUMMARY AND CONCLUSIONS 50 References 51

5
List of abbreviations and mathematical symbols Abbreviations ANN Artificial neural network API Active pharmaceutical ingredient BMP Bit map picture CBIR Content-based image retrieval FDA Food and drug administration GSDM Grey scale difference matrix IA Image analysis MCC Microcrystalline cellulose PAT Process analytical technologies PCA Principal component analysis PLS Partial least squares projection to latent variables PSD Particle size distribution PVP Polyvinylpyrrolidone QBIC Query by image content SEM Scanning electron microscopy SOM Self-organising map 3-D Three-dimensional Symbols C Contrast, texture feature in QBIC D Directionality, texture feature in QBIC O Coarseness, texture feature in QBIC PC Principal component in PCA Q2 Predicted variation in multivariate regression and PLS modelling R2 Predictive power in multivariate regression and PLS modelling t Score values in PCA δ Variance factor in QBIC texture feature

6
List of original publications This thesis is based on the following original papers, which are referred to in the text by the Roman numerals I-IV. I Laitinen, N., Antikainen, O., Mannermaa, J-P. and Yliruusi, J. 2000 Content-
based image retrieval: a new promising technique in powder technology. Pharmaceutical Development and Technology , 5(2), 171-179.
II Laitinen, N., Rantanen, J., Laine, S., Antikainen O., Räsänen, E., Airaksinen, S.
and Yliruusi, J. 2002. Visualization of particle size and shape distributions using self-organizing maps. Chemometrics and Intelligent Laboratory Systems, 62(1), 47–60.
III Laitinen, N., Antikainen, O. and Yliruusi J. 2002. Does a powder surface contain
all necessary information for particle size distribution analysis? European Journal of Pharmaceutical Sciences, 17(4-5), 217-227.
IV Laitinen N., Antikainen O., Rantanen, J. and Yliruusi, J. 2003. New perspectives
for visual characterization of pharmaceutical solids. (submitted)

7
1. INTRODUCTION
“A picture tells more than a thousand words”. Visual information and seeing is
considered to be an indicator of truth and it is thus connected to reason. On the other
hand seeing is linked with emotions and is therefore associated with a certain amount of
subjectivity. If visual or image information is used in science, exact descriptors for this
information are needed. The utilisation of descriptive image information in
pharmaceutical technology is rather limited. Subsequently, the development of this
discipline is a challenge within physical characterisation of pharmaceutical solids.
The physical characterisation of pharmaceutical solids is fundamental in the drug
development process. Complete physical characterisation of solid materials is possible
with high-resolution analytical techniques on the molecular, particulate and bulk levels
(Brittain et al., 1991, Pifferi, 1999, Stephenson et al., 2001). Byrn et al. (1995) introduced
decision trees for the controlling of different crystal forms to develop information on
pharmaceutical solids for both scientific and regulatory purposes. Their aim was to
anticipate towards direct approach in the characterisation of pharmaceutical solids and
eventually to faster approval of regulatory documents containing information on
pharmaceutical solids. The use of solid-state spectroscopy techniques used in the physical
characterisation of the active pharmaceutical ingredient (API), excipients, physical
mixtures, and the final dosage form has been recently reviewed (Bugay, 2001).
Stephenson et al. (2001) have addressed the quantitative issues and methods in solid-state
characterisation. The usual molecular-level properties are addressed using infrared
spectroscopy and nuclear magnetic resonance spectrometry. Important particulate-level
properties are particle morphology and particle size distribution, not to mention
properties that are revealed using powder X-ray diffraction and thermal methods of
analysis. Important bulk-level properties are e.g. surface area, porosity and pore size
distribution and powder flow characteristics (Brittain et al., 1991).
The characterisation of powders and granular materials is of great interest within
pharmaceutical sciences. There has been awareness for characterisation of particulate
materials in the pharmaceutical sciences for a long time (Rees, 1977). As approximately
80 % of all drug products are solids i.e. tablets or capsules, the understanding of the
physical characteristics of powders and granules is essential (Muzzio et al., 2001). For the

8
pharmaceutical industry, a comprehensive knowledge of these materials has a major
economic impact. The physical characteristics of solid particulates have to be considered
and studied throughout the development process of a product, from the preformulation
stage to large-scale manufacturing. In development and manufacturing many powder
handling steps are involved, including crystallisation, blending, granulation and
compaction. Thus, different kind of interactions between particles and between particles
and process equipment occur. All these interactions together with specific behaviour of
bulk materials in certain unit operations may give rise to many problems.
Development of process analytical technologies aims at improving the efficiency of drug
manufacturing processes. At present, the Food and Drug Administration (FDA) is
establishing guidelines for process analytical technologies (PAT) to facilitate the
introduction of new technologies for the pharmaceutical industry. The development aims
at systems for analysis and control of manufacturing processes based on timely
measurements of critical quality parameters and performance attributes of raw and in-
process materials. The initiative will focus on technologies that will assure acceptable
end product quality at the completion of the process.
Research contributions aiming to improve the efficiency of pharmaceutical
manufacturing processes are needed. The attempts in developing image-based particle
characterisation tools for pharmaceutical powders should strive for reliable, fast, and
easily usable methods. New ideas in the field of visual characterisation will broaden the
scope of analytical techniques in pharmaceutical technology. These new tools should be
exploited comprehensively in terms of potential use in the full development cycle of
pharmaceutical solids.

9
2. REVIEW OF THE LITERATURE
2.1 Pharmaceutical powders and granules The fields of pharmaceutical product development and manufacturing, which mostly deal
with particle technology, should focus more on physical characterisation of
pharmaceutical solids, especially powders and granules (Muzzio et al., 2002). The present
literature review concentrates on physical characteristics of particulate and bulk level
properties of pharmaceutical powders and granules. In the next sections particle size and
shape properties are discussed together with a brief insight into common particle size
analysis methods. Also the fundamental phenomena of segregation, flowability,
adhesion, cohesion and triboelectricity are covered. A special emphasis is put on imaging
techniques and common data projection techniques are also described.
2.1.1 Classification of powders
Most often the term powder technology will cover both powders and granules. APIs or drug
substances and excipients as such are often regarded as powders. Granules are usually
considered to be a product of a size enlargement process i.e. granulation. According to
British Standard 2955 (1991) a powder consists of dry, discrete particles with a maximum
dimension of 1000 µm. A classification of pharmaceutical particles based on their size is
given by Barber (1993): coarse powders >1000 µm, conventional powders 50-1000µm,
fine particles 1-50 µm, very fine (submicron) particles 0.1-1 µm and ultrafine particles <
0.1 µm.
2.1.2 The complexity of powder systems
A powder is a complex system with solid–solid and solid-air interactions, since a gaseous
phase exists between the solid particles. Powders are unlike other physical states of
matter. Powders are related to solids since they can resist deformation. Powders also
posses the ability to flow like liquids do and they can be compressed like gases
(Swarbrick and Boylan, 1988, Geldhart, 1990). Particle size, shape and adsorption of the
gaseous phase on the surface influence the properties of a powder or granular material
(Geldhart, 1990). Consequently, the bulk behaviour or the behaviour of the collective

10
properties of the material is influenced by these factors. The bulk material will usually go
through several powder handling situations and processes. This requires fundamental
understanding of the nature of the particles, their size, shape, surface morphology,
packing conditions and interparticulate forces. The handling of a bulk mass is influenced
by any factor which has an effect on interactions between particles. Early reviews on
particle-particle interactions of powders can be found (Hiestand, 1966). Still today,
research in powder technology concentrates on relationships between particle properties
and bulk behaviour of industrial powders (Hoffman et al., 1996).
2.1.3 Particle size
The bulk properties of a material depend to a great extent on its particle size distribution
(Barber, 1993). The size, as a scalar measure, describes the dimensions of a particle in a
population. The size of spherical and other regular particles is easy to define, but it is
impossible to use linear measures for determining sizes of irregularly shaped particles.
Derived diameters, so called equivalent diameters, are determined by measuring a size-
dependent property of the particle, which is then related to a single linear dimension.
Particle sizes of irregular particles are usually presented as equivalent spherical diameters.
Typical equivalent size parameters are listed in the literature (Allen, 1990, Barber, 1993,
Washington, 1992). Normally the equivalence is established on particle mass, volume,
projected 2-dimensional area or sedimentation rate diameters. Examples of the most
typical spherical equivalence diameters (d) are expressed with the equations 1-3.
3
6 : vv dVddiameterVolume π= (Eq. 1)
2 : ss dSddiameterareaSurface π= (Eq. 2)
2
4 : aa dAddiameterarea Projected π= (Eq. 3)
The particle size measurement results are most often presented with a particle size
distribution (PSD). Depending on the measurement technique employed, e.g. number,

11
volume and mass distributions are used. Mathematical transformations between the
different kinds of distributions can always be made.
The PSD and surface area of an API are properties of great importance with regard to
the bioavailability and the processing of drug products. The regulatory authorities have
made international guidelines for acceptance criteria for particle size distributions of new
drug substances (ICH Q6A, 1999). Within the specific guideline, specifications should be
included if the particle size has an impact on the quality of the drug substance or the final
product. The particle size has to be evaluated with respect to whether it has a significant
effect on dissolution rates, bioavailability, stability, prosessability, drug product content
uniformity and appearance. These aspects and the influence of particle size on
physicochemical properties of pharmaceutical powders have been extensively studied
(Atkinson et al., 1962, Lees, 1963, Kaneniwa et al., 1967, Ikekawa and Kaneniwa, 1968,
Hunter and Ganderton, 1972, Walton and Pilpel, 1972, Jounela et al., 1975, York, 1978,
Hintz and Johnson, 1989, Ibrahim et al., 1988, Yalkowsky and Bolton, 1990, Johnson
and Swindell, 1996, Bønløkke et al., 2001, Scholz et al., 2002).
2.1.4 Particle shape
It is very difficult to define shapes of irregular particles. The usual means to describe
shapes include terms such as acicular, angular, fibrous and flaky (BS 2955). These
common descriptions do not quantitatively illustrate a shape. Numerous researchers have
worked with defining shape parameters, such as, roundness, sphericity, circularity,
flakiness, etc. (Cox, 1927, Wadell, 1932, Heywood, 1937, 1954 ). Also approaches based
on Fourier descriptors and fractal geometry has been used in representation of particle
shape and morphology (Meloy, 1977a, 1977b, Kaye, 1981, Luekens, 1982, Rösler, 1987,
Carstensen and Franchini, 1993). The methods of shape characterisation have been
reviewed by Kaye (1997), Allen (1990) and Barber (1993). Within pharmaceutical
technology shape factors have also been used and studied in analysis of powders,
granules and pellets (Ridgway and Rupp, 1969, Staniforth, 1987, Hellén, 1993, Podczeck
and Newton, 1994, 1995, Podczeck et al., 1999).

12
2.1.5 Segregation
Differences in particle size, shape and density in a powder system may cause segregation,
e.g. during mixing or the handling of a tabletting mass. The difference in particle size is
the most important factor (Williams, 1990). The particle size distribution of both drugs
and excipients will have consequences on the mixing phenomena and potential
segregation of mixed materials (Carson, 1988, Wong and Pilpel, 1990). Segregation of
coarse and fine particles can result tablet die fill variations and hence weight variation in
tablets. Travers (1988) and Johanson (1996) have described the most usual mechanisms
of segregation (1996). The ability of smaller particles to fit between coarser particles is
critical for segregation. A size difference of three times or more in particle diameter may
cause considerable segregation (Johanson, 1996).
2.1.6 Adhesion, cohesion and triboelectrification Profound forces that have an impact on bulk behaviour are adhesion and cohesion.
Cohesion occurs between similar surfaces (particle-particle) and adhesion e.g. between
the particle and an instrument wall. The forces are mainly non-specific short-range van
der Waal’s forces. The van der Waal’s forces increase when particle size decreases and
diverge with changes in relative humidity. Other attractive forces in interparticulate
cohesion can be electrostatic forces, which arise from contact or frictional charging
(Staniforth, 1998). Generally, particles are charged statically by grinding, attrition and
collision or triboelectrification. When dry particles are sieved, mixed and moved through
a hopper, surface charge can also be generated. According to Staniforth (1982)
excipients are normally charged negatively in contact with metal or glass surfaces, while
positive charges are created with plastic surfaces. Moisture, particulate contamination and
method of cleaning of processing equipment during pharmaceutical manufacturing
operations may influence the electrostatic behaviour of powders (Eilbeck et al., 2000).
Rowley (2001) studied pharmaceutical solid systems and found that charge acquisition
was inversely related to particle size where contact surface contamination was negligible.
Electrostatic studies on pharmaceutical powders have recently been made by Murtomaa
(2002). Pharmaceutical compounds are cohesive in nature meaning that their flow
characteristics are most likely undesirable (Brittain et al., 1991). A typical way of reducing

13
the cohesivity and improving flowability of materials is by different granulation
techniques.
2.1.7 Flowability
The importance of flow properties in powder handling cannot be overemphasized
(Swarbrick and Boylan, 1988). Carr (1965) has done fundamental work in evaluation and
classification of the flow properties of solids. In drug product formulation work the
understanding of powder flow properties is essential. Flowability influences and may
cause problems in the mixing of powders, as well as tabletting and encapsulation
processes. The powder flow properties are related to weight variation in tablets and
capsules and consequently dose uniformity. For the pharmaceutical industry, problems
with flowability can be critical and cause major economic setbacks (Prescott and
Hossfield, 1994). The particle size of a material has an impact on the flow properties of a
powder (Staniforth, 1988). Particles larger than 250 µm are usually relatively free flowing.
Finer particles (<100 µm) with larger surface areas tend to be more cohesive, which
results flow problems. The flow rate and particle size has been shown to have a strong
correlation (Gold et al., 1968, Danish and Parrot, 1971). However, the particle shape also
affects the flow properties. Spherical particles have least interparticle contacts and good
flow properties. The flowability of elongated and irregular particles is poorer. Thus,
powders with similar particle size but different shape characteristics may have very
different flow properties. The effects of particle shape on particle flow have been
extensively studied (Ridgeway and Rupp, 1969, Danjo et al., 1989, Cartilier and Tawashi,
1993).
2.2. Particle size measurement techniques
Various techniques for measuring the particle size distribution of powders exist. A single
measurement technique cannot be used to cover the wide size range from nanometres to
millimetres. Moreover, the many aspects have to be considered before making the proper
choice of measurement principle e.g. the capital costs versus running costs, speed of
operation, degree of skill required for operation, and most important, the end-use
requirement (Show et al., 1998). Different particle size analysis techniques are well
described in the literature (Allen, 1990, Washington, 1992, Iacocca and German, 1997,

14
Show et al., 1998). Microscopy or computer-assisted microscopy is often considered as a
reference method in particle size analysis since they enable visual inspection of particles.
Probably the most common particle-sizing methods for pharmaceutical dry powders and
granules are sieve analysis, laser diffraction and computerised image analysis techniques.
According to Brittain (1991) microscopy and sieving are normally carried out on dry
powders and are truthful indicators of the actual particle size of a powdered solid.
Measuring particle size distributions by sieving is a simple and inexpensive method and it
gives reproducible results.
Nevertheless, there are many problems in sieving. For reaching better accuracy, great
care of sieves and careful calibrations are necessary (Allen, 1997). Sieving is a useful
technique in particle sizing if the goal is to produce a certain size fraction. It is also
convenient for easily flowing and fairly coarse material above e.g. 100 µm with a few
fines (Washington, 1992). The choice of sieving time can have considerable effects on
the results and the amount of material sieved may affect reproducibility. Material
cohesiveness may also cause errors in measurements and result in false size distributions.
The amount of sample in sieving is relatively large, therefore, it is not suitable for
expensive materials or materials of which only small quantities are available. Sieve
analysis is also very time consuming.
Optical microscopy has a magnification limit approximately of 600x. Electron
microscopy may be utilised at remarkably higher magnifications; it gives more
information about surface structures. Simple microscopic examination is relatively slow
and the information is only visual and descriptive. However, microscopy can be used in
conjunction with image analysis systems. Microscopy is often used as an absolute method
of particle size analysis (Allen, 1997). Yet, there are some problems encountered in
microscopic examination of particles. When three-dimensional particles are studied they
usually lie in their energetically most favourable position and tend to show their
maximum area to the viewer. Since particles orientate in this manner particle sizes have a
tendency to be somewhat larger than measured with other methods. The analysis can be
time consuming. A relatively small number of particles is usually analysed, which may
lead to statistical errors. The introduction of combined microscopy and computerised
analysis systems has made particle studies faster, consequently more particles can be

15
examined. Sample preparation plays a significant role for successful particle size analysis
in microscopy (Iacocca and German, 1997).
Washington (1992) lists various errors and disadvantages of laser diffraction size analysis,
such as poor submicrometer performance and computing artefacts. A disadvantage is
that the amount of sample is very large when using the particles in air (PIA) -method.
For small particles, the particles in liquid (PIL) -method is used in order to achieve an
effective dispersion. For some materials, finding a well-dispersing and suitable solvent
might be difficult. There are many advantages with laser diffraction analyses, for
example, the ease of operation and that the instruments usually produce very
reproducible results. Light scattering methods do not produce flawless data for particles
in all size ranges (Iacocca and German, 1997). Inaccuracy is created e.g. by particle
aggregation, multiple particles in the measurement zone, unknown or improper relative
refractive index.
Instruments that are based on measurements of a particle’s aerodynamic time-of-flight
have been developed and have gained a lot of popularity in particle size analysis of
pharmaceutical materials, especially within aerosol sciences (Dahneke, 1973, Dahneke
and Cheng, 1979, Niven, 1993, Mitchell and Nagel, 1996, Laitinen and Juppo, 2003).
Other methods within pharmaceutical particle size analysis include electrical sensing zone
(Beaubien and Vanderwielen, 1980), sedimentation and photon correlation spectroscopy.
Comparative studies between methods have been made (Kanerva et al., 1993, Etzler and
Sanderson, 1995, Andrès et al., 1996, Etzler and Deanne, 1997, Kaye et al., 1997). On-line
techniques for particle size process control have been developed and reported, including
image processing-based systems and light scattering methods (Lin and Miller, 1993,
Watano and Miyanami, 1995, Bonifazi, 1997, Novales et al., 1998, Scott et al., 1998,
Perry, 1998, Watano et al., 2000, Bordes et al., 2002). The concept of computerised
image analysis is described more thoroughly below.

16
2.3. Image analysis
2.3.1 Digital image information
A digital image consists of picture elements called pixels. The pixels contain information
about the brightness of a certain location in the image. Therefore, the term
monochrome image or a black and white image refers to a two-dimensional matrix of
pixels with particular levels of brightness. Only monochrome images are covered in this
text since these were used in the experimental part of this thesis. The concept of digital
images is well described in textbooks (Sonka et al., 1998, Gonzalez and Woods, 2001).
The image and its two-dimensional pixel matrix can be presented as a light intensity
function f(x,y), where x and y are discrete valued spatial coordinates and f at the point
(x,y) is proportional to the brightness of the image at that point. Depending on the
application and imaging resolution, the size of the images i.e. size of its brightness matrix
can vary. In monochrome images, for each pixel, the grey level that corresponds to the
average transmitted beam from the surface of the object, is typically characterised by a
number in the 0–255 range. In this range 0 is totally black and 255 completely white.
Figure 1 illustrates the concept of pixels and grey level values in an image.
In an image the three-dimensional (3-D) reality is projected on a plane. A certain amount
of 3-D characteristics is often required in order to get quantitative information about
particle morphology. To acquire 3-dimensionality in images, viewing under different
angles is possible (Russ, 1999). Furthermore, depending how the picture is produced
different amount of 3-D features can be distinguished. For example, optical microscopy
has a poorer depth of field than scanning electron microscopy. 3-D features can also be
revealed using lateral illumination (Pons et al., 1999). These features are connected to
106 112 116 120 120 122 122 12195 105 112 117 118 119 120 12084 95 104 111 114 116 117 11876 86 96 104 108 111 113 11571 80 89 98 103 106 109 11266 75 82 90 97 101 105 10761 68 75 82 89 94 98 10156 60 67 74 80 84 88 9152 54 58 63 69 74 79 8551 52 52 57 62 66 71 77
Figure 1. The concept of a digital image. Left: original digital image (resolution 800x600), Middle: top right corner of the original image with visible pixels, Right: gray level values of the white rectangular area from the previous image.

17
shading effects that expose the topography or the visual texture of an object or a surface
(Fig. 2.). A rough structure produces an image with large grey scale variations and
smoother structures generate images with smaller grey scale variations. If we consider
particulate analysis, in controlled illumination conditions comparisons between materials
can be made. The challenge is to find, extract and quantify the information that is
produced.
2.3.2 Computerised image analysis in powder technology
Computerised analyses of microscope pictures have gained much popularity in particle
size and shape analysis since they allow relatively fast handling of a great amount of
information in a picture. Computerised systems make particle size measurements faster
and more practical. Image analysis (IA) systems allow the user to process images.
However, Pons et al. (1999) have discussed the reluctance of the use of IA in routine
analysis of particle morphology e.g. due to relative slowness of the process and the large
size of the image as a dataset. Orientation effects of particles can also distort the
generated IA data (Turbitt-Daoust et al., 2000).
By image processing it is possible to correct defects in the measured particles, e.g.
enhance the visibility of particular structures, outline the particles from the background
and perform steps to separate touching objects or select those particles to be measured
(Russ, 1999). The field of image processing is used for two purposes: to improve visual
appearances of images and to prepare images for measurement of characteristic features
and structures. In general, image processing and analysis methods include the steps of
image acquisition, preprocessing, segmentation, data extraction and data representation
Shade formation
Direction of lateral light
Surface
Figure 2. Shade formation using lateral illumination.

18
(Nazar et al., 1996, Russ, 1999). Image acquisition means digitalisation of the picture, e.g.
transformation of the picture to numerical values for the computer. Correcting image
faults such as noise and brightness defects and enhancing distinct characteristics of
images falls under preprocessing. In segmentation, the aim is to select the objects of
interest. Different image analysis systems apply many operations for separating objects
from each other with procedures such as skeletonisation, watershed and erosion-dilation.
In traditional IA of powders and granules different particle size and shape parameters of
individual particles are then measured.
Since image processing tasks are needed the IA procedure is usually performed semi-
automatically and a skilled operator is usually needed. The largest source of error in
optical IA is probably the sample preparation i.e. the dispersion of the powder (Iacocca
and German, 1997). However, even automated on-line systems have been successfully
used (Watano and Miyanami, 1995, Watano et al., 2000). In pharmaceutical technology,
computerised image analysis has been widely used in particle size measurement and
shape analysis (Staniforth, 1987, Hellén, 1993a, 1993b, Lindner and Kleinebudde, 1993,
Podczeck and Newton, 1994, 1995, Etzler and Sanderson, 1995 Andrés et al., 1996,
Eriksson et a., 1997, Hundal, 1997, Podczeck 1997, Podczeck et al., 1999, Larsen et al.,
2002). According to Pons et al. (1999) there is a demand for routine morphology
quantification of particles. However, they stated that operator dependence in sample
preparation does not enable real –time process control.
2.3.3 Content-based image retrieval
The objective of the development of content-based image retrieval (CBIR) systems is to
efficiently extract relevant feature information from images. These systems compare
images based on the content information. Recent descriptions of principles of visual
information retrieval have been given in literature (Del Bimbo, 1999, Lew, 2000, Castelli
and Bergman, 2002). Gudivada and Raghavan (1995) have represented possible
approaches that can be used in similarity retrieval: retrieval by texture, shape, spatial
constraints, colour, sketch, volume, motion, objective and subjective attributes, and text.
The development of CBIR systems uses ideas from areas such as knowledge-based
systems, cognitive science, user modelling, computer graphics, image processing, pattern
recognition, database management systems, and information retrieval.

19
According to Aigran et al. (1996), a system for content-based image retrieval by similarity
rests on three components: 1. Extraction of features from images and an efficient system
of representation and storage of this data, 2. Assortment of meaningful and effectively
computable similarity measures, 3. User interface for the choice of the similarity measure
to be applied and for efficient presentation of retrieved images.
In a typical content-based image retrieval system, the image features are pre-computed
and indexed as the images are loaded in the system. The features include properties such
as local intensity histograms, edge histograms, region-based moments. The features are
stored in a database and to make a query, the user normally presents a sample image to
the system. Retrieval by a user-drawn sketch is also possible. When the query image has
been introduced, its features are calculated and compared against the features of the
images in the database. The result of the comparisons is a score that indicates the degree
of similarity and is used to rank order the images. This process can be very fast since
image features are pre-computed in the image insertion phase, and distance functions
have been designed to be extremely efficient at query time (Bach et al., 1996). A
schematic diagram of the operation of a CBIR system is presented in figure 3.
Query by image
content information
Image database
Selected query image(s)
Feature information
Selection of weights of content measures: shape, texture, color
Similarity measure
Images in certain rank order
Figure 3. A diagram of a content-based image retrieval system.

20
Content-based image retrieval systems create an abstraction of the raw information of
images in the form of features. Current approaches to CBIR differ in terms of choice of
image features extracted, level of abstractions manifested in the features, similarity
functions used and the degree of desired domain independence. Two major categories of
features are primitive and logical (Gudivada and Raghavan, 1995). Primitive image
features include, e.g. object centroids and boundaries. Logical features are abstract
representations of images at various levels of detail. The logical features express the
deeper domain semantics represented in an image (Gudivada and Raghavan,1995). For
image information, features may be regarded as belonging to five abstract data types
presented by Bach et al. (1996): values, indexed values, distributions, indexed
distributions, and graphs. A value is usually a set of vectors that presents a global
property of the image. An indexed value is an indexed set of vectors local to a region of
an image. A distribution, like a colour histogram, is a multi-dimensional vector. An
indexed distribution is a local pattern like the intensity profile of a region of interest. A
graph represents relational information like spatial relations of objects in an image.
Queries of the image data include comparisons of feature vectors of a query image with
the stored database images.
Colour, texture and shape are the most commonly acknowledged and utilised feature
categories and the data type grouping in the previous paragraph suits them all. The grey
level images used in this study are a special example of colour features. A number of
researchers have proposed methods for image indexing based on colour (Ng et al., 1995,
Smith and Chang, 1996), texture (Pentland et al., 1994, You et al., 1997, Aksoy and
Haralick, 1998) and shape (Mehrotra and Gary, 1995). Caelli and Reye (1993) and
Niblack et al. (1993) have described methods for indexing combining all these three
features.
CBIR systems may be developed with emphasis on automatic and dynamic feature
extraction or with weight on semi-automatic extraction (Gudivada and Raghavan 1995).
Ideally all object and feature identifications would be done automatically, but automatic
methods to identify and outline objects are not yet adequate enough. Naturally, manual
or semi-automatic methods are more time-consuming, but they are often necessary for
satisfactory feature extraction. Colour and texture features are often extracted without
manual intervention. One of the most difficult aspects of content-based image retrieval is

21
retrieval by shape (Faloutsos, 1994). Ashley et al. (1995) describe two methods, enhanced
floodfill and snake-based edge following, for semi-automatic object shape identification.
As shapes can be arbitrary, exact descriptions of shape are very difficult. There is no
mathematical definition that would accurately match the human conception of shape
(Del Bimbo, 1996). Many practical shape description methods exist, but there is no
generally accepted methodology of shape description (Sonka et al., 1998). In a CBIR
system, described by Faloutsos et al. (1994), the primary shape features are based on the
combination of area, circularity, eccentricity and major axis orientation, in addition to a
set of algebraic moment invariants.
CBIR systems for general use do not usually meet the same level of performance as
systems which are tuned for special applications. Therefore, almost every application
requires special development of a CBIR system. The aim is often to develop systems
which can distinguish the objects in an image and which have the capability to learn, e.g.
by employing relevance feedback given by the user. Several image retrieval applications,
such as, QBIC (Niblack et al., 1993, Flickner et al., 1995), Photobook (Pentland et al.,
1994), VisualSEEk (Smith and Chang, 1996), Virage (Bach et al., 1996), and PicSOM
(Laaksonen et al., 2000, 2001, 2002) have been developed and described in literature.
CBIR systems have been used with applications in various fields. In medicine, magnetic
resonance chest images were retrieved by certain proposed spatial features of images
(Hou et al., 1992). Gupta et al. (1996) described a prototype content-based retrieval
system for ophthalmologic images. Medical applications for CBIR are useful since image
archives are large, and certain people need to use the image databases effectively. Medical
images are often not only retrieved by looking at the image content but also in terms of
other information associated with the images, such as text describing treatment and
diagnosis (Gudivada and Raghavan, 1995). Retrieval systems have been developed also,
e.g. for fingerprint identification (Manjunath and Ma, 1996) and for geographical images
(Ratha et al., 1996, Soffer and Samet, 1996).
2.3.4 Surface and bulk imaging
Optical techniques for measurement of surface characteristics are widely used in different
industrial inspection applications (Cielo, 1988). Often, these industrial techniques are

22
used to characterise roughness properties of different kinds of surfaces in process
control and quality control. Russ (1999) has described the concept of surface imaging.
The inspection of surface information can be made in terms of qualitative or quantitative
properties. To obtain quantitative information exact descriptors for the image
information is required. In order to receive qualitative data generalisation of the image
information is possible.
A key property of a bulk particulate material is a typical pattern of the image field-of-view
called texture (Fig. 4.). Texture is related to distribution of the spatial variation in grey
scale levels (or colour levels in colour images) and can be connected to general bulk-
particle characteristics (Bonifazi, 2002). Global measurements of the texture that is
observed in an image can portray information about the size of the particles (Novales et
al., 1998). Smaller particles lead to finer textures and larger particles to coarser textures.
Apparently the presentation geometry, e.g. the magnification and resolution used will
affect the outcome. Standardised imaging conditions for this kind of textural
comparisons are therefore needed. An advantage of textural methods is that particles do
not have to be identified individually. Bonifazi (2002) has shown that particulate overall
pictorial characteristics influenced by grain size, shape and colour distribution can be
correlated to the chemical composition of powders.
Bertrand et al. (1991) characterised the texture of pea samples by the grey level run
lengths method and found it to be useful in powder classification. A grey level run length
Figure 4. Demonstration of textural differences in a set of six different granules with dissimilarsize characteristics. Smaller particles have finer textures and larger particles coarser textures.

23
is a set of subsequent pixels having the same grey scale value. In this approach, for each
grey level, the number of runs that have a certain length are counted for a given
direction. Novales et al. (1998) successfully used global features of images in particle size
characterisation of a cereal milling process. The methods applied were based on textural
analysis, such as grey level run lengths and grey level co-occurrence. Gray level co-
occurrence describes the spatial relationships between grey level values. Russ (1999) has
covered the general concept of texture and different texture operators.
Bonifazi and co-workers (1997, 2002) discussed the new perspectives in the field of
particulate solids control of bulk or collection of particles instead of single particles.
Huang and Esbensen (2000) introduced a method of IA that does not deal with
individual particles and acquires images directly from in-situ powders. They addressed
that this type of images of the entire field-of-view of powders also contain some
information which relates to individual particles, but mainly about the bulk powder. They
presented that this information is the reflection of complex bulk properties, such as
flowability and fluidisation velocity. In a later study with seven reference powders Huang
and Esbensen (2001) established quantitative predictive models between multivariate
images and particle size, density, minimum fluidisation velocity, wall friction angle and
angle of repose. They applied Angle Measure Technique (AMT) in image analysis of a
variety of powders. In the AMT approach a special camera with red, green and near
infrared channels was used with low-angle unilateral illumination. AMT has been
developed to describe signal complexity as a function of geometrical scale from local to
global. In the described application the images of powders were unfolded to produce
one-dimensional measurement series, which AMT transforms to multivariate scale
characterisations.
2.4 Data projection methods
Commonly, any produced measurement data is multidimensional. In order to
understand, interpret and summarise a large data set, visualisation of its structure with
projection methods is needed. A functional projection tool compresses the original data
while preserving relevant features in the original data structure, and allows its
visualisation. Different projection techniques, linear and nonlinear, exist. When
chemically relevant information is extracted from data produced in chemical experiments

24
the term chemometrics is often used (Wold, 1995). Chemometrics offers a large variety of
compression techniques, which by data dimensionality reduction allow data visualisation.
Daszykowksi and co-workers (2003) have recently reviewed different chemometric
projection methods. There are two dominant projection methods in chemistry. The
most popular linear projection method is principal component analysis (PCA). If PCA is
not suitable for efficient compression of the data, then usually the nonlinear self-
organising maps (SOM) are used. Other projection methods are Sammon mapping,
generative topographic mapping (GTM), principal curves, multidimensional scaling and
auto-associative neural networks (Daszykowksi et al., 2003). Here, the methods used in
this thesis, PCA and SOM, are presented.
2.4.1 Principal component analysis Pearson (1901), Hotelling (1933) and Karhunen (1947) were pioneers with principal
component analysis. Today, PCA is the most popular linear projection method
(Daszykowksi et al., 2003). PCA is used to examine observations, structures, similarities
and trends of large data tables. It projects multidimensional data into a few orthogonal
features, called principal components (PCs).
The PCs are constructed as a linear combination of the original variables to maximise the
preservation of the data variance. The PCs of a data set are found by calculating the
eigenvectors and eigenvalues of the data covariance matrix. These vectors give the
directions in which the data cloud is stretched in the data space. The projections of the
data on the eigenvectors are the PCs. The corresponding eigenvalues give an indication
of the amount of variance the respective PCs stand for, i.e. large eigenvalues signify a
large amount of variance in the data set. Consequently, principal components with large
eigenvalues inform more about the relations between the data points than any other
directions.
The principal components are also known as latent variables which sum up the variation
of the original dataset. The reduction of the dimensionality of the original variables to
latent variables makes the data visualisation possible. The main property of PCA is that it
reaches the best linear map by minimising the squared error of the data reconstruction
from the latent variables back to the original high-dimensional space. Significant principal
25
components are often used as a starting point in other methods, such as Sammon
projection, SOM or GTM (Daszykowksi et al. 2003).
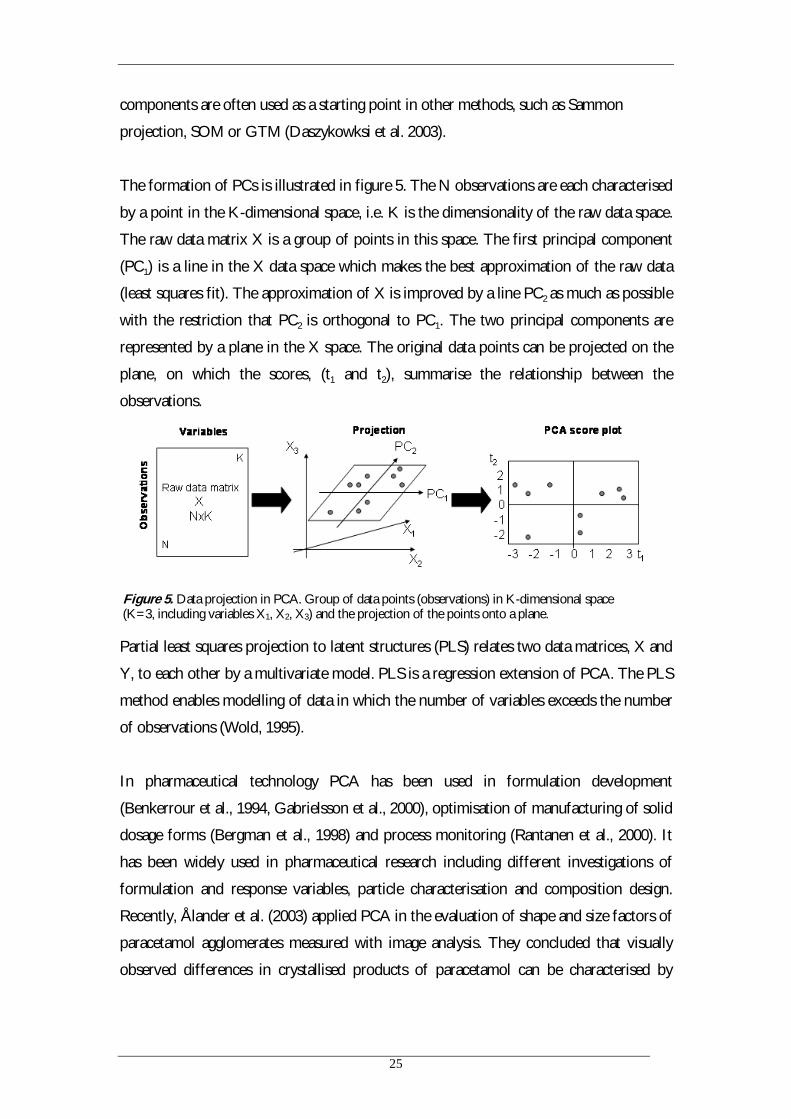
The formation of PCs is illustrated in figure 5. The N observations are each characterised
by a point in the K-dimensional space, i.e. K is the dimensionality of the raw data space.
The raw data matrix X is a group of points in this space. The first principal component
(PC1) is a line in the X data space which makes the best approximation of the raw data
(least squares fit). The approximation of X is improved by a line PC2 as much as possible
with the restriction that PC2 is orthogonal to PC1. The two principal components are
represented by a plane in the X space. The original data points can be projected on the
plane, on which the scores, (t1 and t2), summarise the relationship between the
observations.
Partial least squares projection to latent structures (PLS) relates two data matrices, X and
Y, to each other by a multivariate model. PLS is a regression extension of PCA. The PLS
method enables modelling of data in which the number of variables exceeds the number
of observations (Wold, 1995).
In pharmaceutical technology PCA has been used in formulation development
(Benkerrour et al., 1994, Gabrielsson et al., 2000), optimisation of manufacturing of solid
dosage forms (Bergman et al., 1998) and process monitoring (Rantanen et al., 2000). It
has been widely used in pharmaceutical research including different investigations of
formulation and response variables, particle characterisation and composition design.
Recently, Ålander et al. (2003) applied PCA in the evaluation of shape and size factors of
paracetamol agglomerates measured with image analysis. They concluded that visually
observed differences in crystallised products of paracetamol can be characterised by
Figure 5. Data projection in PCA. Group of data points (observations) in K-dimensional space (K=3, including variables X1, X2, X3) and the projection of the points onto a plane.

26
image analysis in combination with PCA. Lindberg and Lundstedt (1995) have reviewed
applications of multivariate analysis in pharmaceutical development work.
2.4.2 Self-organising maps
Artificial neural networks (ANNs) became quite widely used as a data analysis method in
the 1990s in pharmaceutical development (Hussain et al., 1991, Murtoniemi et al., 1994,
Watano et al., 1997, Bourquin et al., 1997). A specific method that is based on neural
networks is the self-organising map (SOM) (Kohonen, 1982, 1997). The SOM is an
unsupervised ANN. While typical ANNs are often used for data modelling the SOM can
be applied for data visualisation. Supervised techniques (e.g. back-propagation algorithm
(Haykin, 1994)) create a model for the relationships between training inputs and the
required responses. Unsupervised techniques discover similarity in the input vectors
without a training target. The purpose of SOM is to perform nonlinear mapping of input
data objects typically on a two-dimensional grid with a distinct topology, i.e. a layer of
active neurons is arranged into a grid of squares or hexagons on a two-dimensional
plane. The SOM is particularly advantageous in visualisation of high-dimensional,
nonlinear data.
The SOM is an elastic net with a grid of nodes connected to their neighbours with elastic
bands. Input observations are presented in random order for training and for each
observation the winning node is located on the map. The winning node is the one best
matching the presented observation. The standard method is to represent the
observations and SOM nodes with vectors. The vectors of the SOM nodes are often
called model vectors. Thus, the winning node is the one whose model vector has the
shortest distance to the presented vector. In the training the model vectors of the winner
and its neighbouring nodes are modified to represent the input signals more closely.
Such training causes the net to stretch through the densely populated areas of the input
data space. This net can be straightened back to two dimensions from the K-dimensional
space and investigated with different visualisation methods. This gives information with
regard to how the data resides in the K-dimensional space, which is the principal
advantage of the SOM. The architecture of the SOM is illustrated in figure 6.

27
If the input vector is denoted by x=[ x0, x1,…,xK-1]T and the model vector of a map node
by mi =[mi,0, mi,1,…,mi,K-1] T, then the algorithm which explains the self-organising
operation can be presented:
A. Model vectors of the nodes are initialised with random values.
B. Steps C and D are computed for each vector x(t) in the training data.
C. The SOM node mc (winning neuron) that matches best to the data vector x(t) is
found by searching all nodes by:
||})()({||min||)()(|| tmtxtmtx iic −=−
D. The model vectors of the nodes are adjusted by
where the parameter (t) is a coefficient which determines to what extent the winning
node and the neighbourhood are moved in the direction of vector x(t). During training,
the parameter (t) is decreasing with time. Nc is a neighbourhood set of map points
around node c and it can be defined Nc(t) as a decreasing function of time. Euclidean
metric can be used as the distance measure |||| ⋅ in equation 4.
indicesotherallfortmi ),(),()},()(){()( tNifortmtxttm cii ∈−+α{
Figure 6. The architecture of the self-organizing map (SOM). A topological map of the input vector signals is created during the training phase. Each input vector finds a winning neuron. Similar vectors become arranged in same regions of the SOM during the training cycle.
(Eq. 6)
(Eq. 4)
(Eq. 5) =+ )1(tmi

28
Zupan and Gasteiger (1993) and Melssen et al. (1994) have discussed the practical issues
concerning the use of self-organising maps in solving chemical problems. In
pharmaceutical technology Antikainen et al. (2000) have used the SOM to predict the
flowability of powders with satisfactory results. Recently, Kachrimanis et al. (2003)
applied SOMs for visualisation of the correlation of certain micromeritic properties of
powders. The SOM was also successfully used for visualisation of fluid bed granulation
by Rantanen et al. (2001). Bourquin et al. (1997) modeled data sets from tablet
compression with different ANN models, including self-organising maps.

29
3. AIMS OF THE STUDY The purpose of this study was to find new ways of using image information in
pharmaceutical powder technology and characterisation of pharmaceutical solids. The
goal was to extract relevant information from powder surfaces with the aim to broaden
the use of image information compared to the commonly used image analysis (IA)
approaches in pharmaceutical technology, which only measure properties of individual
particles. The specific aims of the study were:
1. to characterise undispersed particulate populations through surface images.
2. to extract relevant information from powder surfaces.
3. to link the information from powder surface images with functional physical
properties of pharmaceutical solids.
4. to enhance the use of surface imaging as a tool for pharmaceutical process analytical
technologies (PAT).
5. to develop a useful and reliable method for particle size analysis with emphasis on
uncomplicated sample preparation.
6. to evaluate different chemometric methods in data visualisation.

30
4. EXPERIMENTAL
In this chapter the materials and methods used in this thesis are covered. A more detailed
description of materials and methods is given in the original publications which are here
referred to by their respective Roman numerals I-IV.
4.1 Materials
4.1.1 Excipient mixtures Microcrystalline cellulose (MCC), Avicel grades PH 101, PH 102, and PH 200 (FMC
International, Ireland), was used as test material in the first stage of the study (I). Sixteen
mixtures of the different MCC grades were prepared. A mixture design was used.
4.1.2 Model particles In the second phase of the study a series of model particles with a range of different
shapes and sizes were used (II). A pilot batch of pellets was chosen to represent large
round particles (Pharmaceutical Technology Division, University of Helsinki, Finland).
Sodium phosphate (Riedel de Häen, Seelze, Germany) particles had sharp edges and
many were diamond-shaped with a large size distribution. The salt (Jozo, Amersfoort,
The Netherlands) and sugar (Finnsugar, Finland) particles represented cube-shaped
particles with smaller particles and a narrower size distribution, lactose monohydrate
(Pharmatose 200 M, DMW International, Veghel, The Netherlands) was chosen to
represent a finer material with a smaller particle size distribution. Finally, dry black tea
(Twinings Ltd, London, England) represented elongated particles with large size and
shape variations.
4.1.3 Granules
Seventeen different granulations were made in study II using verapamile hydrochloride
(Orion Pharma, Finland) as a model drug substance with varying amounts of three
excipients: MCC (Emcocel 50M, Penwest Pharmaceuticals, Nastola, Finland), lactose
monohydrate (Pharmatose 200 M, DMW International, The Netherlands) and

31
pregelatinised starch (Starch 1500, Colorcon, Indianapolis, IN, USA). A mixture design
was used. In study III granules from 40 different pilot batches (Pharmaceutical
Technology Division, University of Helsinki, Finland) with varying particle sizes and
compositions prepared with fluidised bed granulation were analysed.
In the final stage of the study (IV), a model formulation (batch size 3500 g) consisting of
5% wt/wt of caffeine (Orion Pharma, Espoo, Finland), 475 g MCC (Emcocel 50M,
Penwest Pharmaceuticals, Nastola, Finland), 2200 g lactose monohydrate (Pharmatose
200M, DMV Pharma, Veghel, The Netherlands), and 500 g pregelatinised starch (Starch
1500, Colorcon, Indianapolis, IN, USA). Polyvinylpyrrolidone (PVP) (Kollidon K25,
BASF, Ludwigshafen, Germany) was used as a binder in the formulation (5 % wt/wt).
Solutions in purified water were prepared using 8.75 % wt/wt of PVP. In total, 34
granulations were prepared.
4.2 Unit operations
4.2.1 Mixing (I)
200 grams of each powder mixture was mixed at 14 rpm for 8 min using glass jars in a
laboratory mixer (Turbula mixer T10B, Willy A. Bachofen AG Maschinenfabrik, Basel,
Switzerland).
4.2.2 Fluidised bed granulation (II,III,IV)
All granulations were made in a bench-scale fluidised bed granulator (Glatt WSG 5, Glatt
GmbH, Binzen, Germany). The granulation setup has been described in detail by
Rantanen et al. (2000). In study IV 34 granulations were made with a bench-scale
fluidised bed granulator (Glatt, WSG 5, Glatt Gmbh, Binzen, Germany). The process
conditions were planned using an experimental design. Three process variables were
altered on three levels: inlet air temperature (30°, 40°, 50°C), nozzle spraying pressure (1,
1.5, 2 bar) and granulation liquid flow rate (160, 175 and 190 g/min). A series of 17
granulations was performed two times in randomised order.

32
4.2.3 Tablet compression (IV)
Tablets of 17 batches were compressed using an instrumented Korsch (EK-0, Korsch
AG, Berlin, Germany) eccentric tablet machine. Flat-faced 9 mm punches were utilised.
The target crushing strength of tablets was 100 N and the target weight was 250 mg.
Prior to tabletting the granules were mixed with 0.5 w-% magnesium stearate (Ph.Eur.) in
a Turbula mixer for 5 minutes. The tabletting was carried out in a condition-controlled
room (55 ± 3 RH%, 24 ± 2°C). In total, 500 tablets of a selection batches were
compressed. The weight variation of the tablets was determined using the relative
standard deviation of the upper punch force profiles for the 500 tablets. The weight
variation (wv) of the tablets was calculated according to equation 6:
wv= r.s.d.fv/ average fv · 100 %, (Eq. 6)
where r.s.d.fv is the relative standard deviation in the upper punch force profile and
average fv is the average of the upper punch force measurements for the 500
tablets/batch. The tablet weight variation was also measured by weighing 50 tablets from
a random selection of 10 tabletted batches.
4.3 Characterisation of materials 4.3.1 Laser diffraction (I- III)
The particle size of the MCC mixtures (I) and 40 granule batches (III) were measured
with a Fraunhofer laser diffraction particle sizer (Malvern 2506 LC Droplet and Particle
Size Analyser, Malvern Instruments Ltd., Worcestershire, UK) using a dry powder feeder.
The focal lens lengths used were 600 mm (I) and 800 mm (III). Three replicate samples
were measured (n=3).
4.3.2 Sieve analysis (III, IV)
The particle size distributions were measured with sieve analysis (Fritsch analysette, Idar-
Oberstein, Germany) using the following sieves: 0.045 mm; 0.071 mm; 0.090 mm; 0.125

33
mm; 0.180 mm; 0.250 mm; 0.355 mm; 0.500 mm; 0.710 mm; 1.000 mm; 1.400 mm and
2.000 mm. The sample size in sieve analysis was 20 grams (5 min with amplitude 6)(n=3).
4.3.3 Scanning electron microscopy (II)
A scanning electron microscope, SEM, (Zeiss DSM 962, Zeiss, Germany) was used to
take the micrographs of the model particles.
4.3.4 Optical microscopy (I)
An optical microscope (Leica MZ6, Leica Mikroskopie und Systeme Gmbh, Bensheim,
Germany) was used to take surface images of the mixtures of MCC. The magnification
was 0.8x. The microscope was operated in a dark room with the absence of any
background illumination. The sample was illuminated with two light fibers and the light
intensity was constant during the imaging. The positioning of the lights was made in a
way that the illumination created a good contrast and shadows could be distinguished
when the sample was inspected through the microscope. Three grey scale images of each
MCC mixture were captured and stored in bmp (bit map picture) format.
4.3.5 Image analysis of size and shape parameters (II) An optical microscope (Leica MZ6, Leica Microskopie und Systeme GmbH, Germany)
which was connected to an image analysis (IA) software (Leica Qwin, Leica Imaging
Systems Ltd, Cambridge, England) was used to determine the size and shape parameters
of the granules and model particles in study II. The parameters were: Convex area,
Aspect Ratio, Equivalent diameter, Roundness and Fullness ratio. Approximately 1000
particles of the 6 model particles and the 17 granule batches were measured. The
description of the shape parameters is given in table 1 (II).
4.4 Content-based image retrieval (I) A web version of the QBIC system, Query by Image Content (IBM, Almaden Research
Center, CA, USA), was used as the content-based image retrieval system. This QBIC
version included an indexing and a retrieval engine, a user interface, and APIs
(Application Programming Interface). The QBIC version supported queries based on

34
colour histogram, colour layout, and texture. The image database created consisted of 64
images. The images were indexed, and thereafter each image was used as a sample image
for a query. The texture feature was used as the search criterion. The texture feature in
QBIC is based on mathematical representations of coarseness, contrast, and
directionality. Coarseness measures the scale of texture (pebbles vs. boulders) and is
calculated by using moving windows of different sizes. Contrast describes the vividness
of pattern. It is a function of the variance of the grey level histogram. Directionality
describes whether the image has a favored direction (e.g. grass) or is isotropic (e.g. a
smooth object), and it is a measure of the peakedness of the distributions of gradient
directions in the image (Faloutsos et al., 1994). In QBIC, similarity queries are performed
against the database of pre-extracted features using distance functions between the
features (Flickner et al., 1995). The normalisation factors are the inverse variances of
each feature component. In a texture query, the distance d between object i and object j
is calculated as
dij = (Oi-Oj)2/ δ2 O + (Ci-Cj)2/ δ2
C + (Di-Dj)2/ δ2 D , (Eq. 7)
where O, C, and D represent the features coarseness, contrast, and directionality,
respectively. The δ stands for the variance factor (Faloutsos et al., 1994).
The rank order of images and the image similarity values were compared to the particle
size of the different mixtures. The similarity value of each image shows how the
extracted image features differ from the features of the sample image. The similarity
value for the query image is 0.000000 and the more dissimilar the compared images are
the higher the value. The program used (Modde 3.0, Umetri AB, Umeå, Sweden)
calculated the predictive power according to cross validation. The original model was a
quadratic mixture model from which the least significant terms were removed as long as
the predictive power was increasing. A statistical analysis (Spearman test) of the
correlation of the similarity value and the particle size was made using the Windows
version of Systat 5.0. Figure 7 shows the course of the use of QBIC in analysis of the
images of MCC.

35
4.5 Surface imaging of powders and granules
4.5.1 The imaging setup (III, IV) In order to improve imaging conditions and reproducibility, a new optical setup was
constructed during the study. This optical instrument consisted of the following
elements. The imaging unit, with a light source, a monochrome CCD camera (JAI, CV-
M50, Copenhagen, Denmark) and a lens objective, is connected to a frame grabber
(WinTV, Hauppauge Computer Works Inc., Hauppauge, NY, USA) and a Personal
Computer. The symmetrically positioned, bilateral light sources, on opposite sides of the
sample, stand on rails, on which they can be accurately positioned. The illumination
system includes two lamp housings, 100 W quartz tungsten halogen lamps, and two
collimating lens assemblies (Oriel Instruments, Stratford, CT, USA). The collimated
output beam can be turned 90 degrees with a beam turning assembly. The light sources
are connected to stabilised DC power supplies (Oriel Instruments, Stratford, CT, USA).
A sketch of the imaging setup is presented in figure 8.
Image acquisition
of MCC powders
Extraction of texture features
Determi-nation of similarity measure
Correlation with particle
size data
1.
2a.
4.
5.
2b.
3.
Figure 7. The flow of the use of QBIC texture features in analysis of surface images of MCC powders.
Fig 8. Imaging setup. 1: CCD camera with optics. 2a and 2b: light sources on rails with collimated light
beams. 3: Powder sample in sample cup 4: PC and frame grabber.

36
Extensive optimising studies concerning the illumination and imaging conditions were
performed. Consequently, the following imaging settings were established for studies III
and IV. A 50 mm lens objective with additional 40 mm extension tube was used. The
light source distance from the sample was 20 cm. The angle of illumination was 30° with
referral to the horizontal line. The used power source voltage was 5.5 V and the image
resolution in the frame grabber was 600 x 800 pixels. The dimensions of each sample
surface in the taken images were 8.2 mm x 6.1 mm. All images were taken in a dark room
with no disturbing light sources. The calibration of the imaging conditions was made
with a smooth white calibration board (Xerox Premier, batch 11/DD/YKD/1, Xerox
Corporation, CONN, USA).
4.5.2 Grey scale difference matrix (III,IV)
In studies III and IV a parameter, grey scale difference matrix (GSDM), for calculations
of the particle size from surface images was developed and used. The subsequent steps
were taken in the creation of the GSDM. The two light sources were used to illuminate
the sample from opposite sides. Two images of a sample surface were taken. A digital
image of the sample was first captured by using one light source. Then, another image
was taken by illuminating the sample with the other light source. Consequently, two
digital images were received and two matrices of their grey scale values were formed. The
difference of these two matrices was then calculated. The operation of matrix subtraction
is explained by equation 8 using a 2x2 example matrix.
−
−=
−
=−=
6404
11568
5964
21 MMGSDM , (Eq. 8)
where M1 is the grey scale matrix of image 1 and M2 is the grey scale matrix of image 2.
The difference is thus calculated for each corresponding pixel in M1 and M2.
For an ideal completely smooth surface the difference of the two matrices consist of
zeros. For a real surface the difference matrix gets values between –255 and +255. In the
next step a distribution of the difference matrix is formed: i.e. how many matrix cells
holds each of the possible 511 values. Figure 9 presents two different example granule
sample surfaces with two images illuminated from the opposite sides for each material.
Subsequently, the formation of the difference distributions from the difference matrices

37
is shown. One can notice that the difference distribution is characteristic for the different
kind of surfaces. The particle size distributions in studies III and IV was derived from
the GSDM .
4.6 Data analysis 4.6.1 Correlation analysis (I, III, IV)
A Spearman test to find out the correlation of the similarity value and the particle size
was performed (I). In the later part of the work (III, IV) Pearson correlation analysis was
made between the particle sizes modelled from image information and particle median
size values measured with sieve analysis and laser diffraction.
4.6.2 Multivariate regression (I) In the first study (I) a regression model between the image similarity values and the
particle size of the different mixtures was created using Modde software (Modde v. 3.0,
Umetri AB, Umeå, Sweden). The program calculated the predictive power according to
Figure 9. Generation of the grey scale difference distribution from granule surface images.
-255 0 255
-255 0 255
10000 5000 0
10000 5000 0

38
cross validation. The original model was a quadratic mixture model from which the least
significant terms were removed as long as the predictive power (R2) was increasing.
Modelling can be used to find quantitative relations between predictors and responses.
The model explains the variation in the responses with R2 and Q2. R2 is the fraction of
the variation which is explained by the model and Q2 indicates the fraction of the
variation that can be predicted by the model. Possible values will be in the range of 0-1.0
where 1.0 represents a model with excellent predictive power.
4.6.3 Principal component analysis (II, IV)
The measured image analysis data was evaluated using principal component analysis
(PCA) employing Simca-P Software version 8.0 (Simca-P v. 8.0, Umetrics,
Umeå,Sweden) software.
4.6.4. Self-organising maps (II)
The SOM was used for training and visualisation of the IA data matrix. The work was
performed using a Matlab (Matlab, v. 5.3, MathWorks Inc., USA) SOM toolbox, which is
available on a public domain (Alhoniemi et al., 1997). Figure 10 shows a simplified
illustration of the steps in data reduction and visualisation.
4.6.5 Partial least squares modelling (III, IV)
PLS models were created in studies III and IV. The vector with 511 values consisting of
GSDM distribution data was used as explanatory variables (predictors) and size fractions
were used as the response variables in the creation of the model (Fig. 11.). In both
studies (III and IV) the percent mass proportion of sieve fractions of the analysed
IA data matrix
PCA
SOM
Data
visualisation
Figure10. The reduction of dimensionality and visualisation of the IA data in paper II.

39
granule batches were used as the response variables. In the former study a model was
also created for laser diffraction data using the percent volume proportions of size
fractions as response variables. In the former study, the models were evaluated using
nine granule batches as test data. In the later study, the created model was evaluated by
inspecting the goodness of fit (R2) and the predicted variation (Q2). The terms R2 the Q2
are explained above in paragraph 4.6.2.
X=
Predictors= GSDM data
PLS model
Y= responses= Particle size distribution
data
Figure 11. A simplified graph showing the idea of the creation of a PLS model between the gray scale distribution data and the measured size distributions.

40
5. RESULTS AND DISCUSSION In this chapter the results of this thesis are summarised. A more detailed discussion is
presented in the original publications which are referred to in the text by their respective
Roman numerals I-IV.
5.1 Visualisation of traditional image analysis data
5.1.1 Principal component analysis (II)
The two principal components form a plane in the original image analysis data space.
The differently shaped and sized model particles are projected on different areas on the
score plot (II, Fig. 6a-b.). PCA indicated that two components explained about 83
percent of the variance of the data investigated. The first component accounted for 50 %
of the variance and was characterised by the size factors. The second component
described the shape parameters. Similar PCA plots for the IA for the granules were
formed (Fig. 7a-b.). The first two components accounted for 85.2 % of the variation,
with the first component explaining 54.9 % of the variance. The results indicated that
PCA is a good technique to study the variance within samples of different kind of
particles.
5.1.2 Self-organising maps (III)
Self-organising maps were also used for visualisation and reduction of the IA data. The
results of the trained SOM for the model particles are visualised in Figures 8 – 9 (II). In
figure 8 the values of the 5 different variables of the particles are visualised. The colour
of the node indicates the level of the individual variable in the specific region of the map.
The high values are indicated with red colour. When the size parameters (equivalent
diameter and convex area) are studied we can notice that the particles with the largest
values for these variables are organised in the lower left corner of the map with
maximum values in the middle on the left side edge. The particles with large values for
the shape factors roundness and aspect ratio are located in the upper left corner of the
SOM. The particles with highest values of the fullness ratio shape parameter are
organised in the bottom of the map, around the left side corner.

41
Figures 9a-f (II) show the organisation of the particle data on the map for each sample of
model particles. The SOM visualises clearly the differences between the particles. For
example, when studying the size variables one can notice that the particles with larger
values for these variables are organised on the lower side of the map, more specifically, in
the left-hand corner. Particles with a wider size distribution are spread more widely on
the map, such as sugar (II, Fig. 9 a, yellow colour) and salt (II, Fig. 9 d, cyan colour)
particles. The smallest particles (lactose, II, Fig. 9 b, red colour) could also be
distinguished. The variation and the differences in the data for the 5x17330 data matrix
for the granules were also clearly visualised by the SOM. The results of the trained SOM
are visualised in figures 10-11(II). Figure 11a-c (II) shows the visualisation of the particle
data on the map for the granule formulations A, B, C, which represented the corner
points of the mixture design used.
5.1.3 Comparison of data visualisation with PCA and SOM
Multivariate data analysis methods are capable of creating a perceptive presentation of
various data sets. Both methods used, SOM and PCA, enable the lowering of the
dimensionality of multivariate data. In this study (II) SOM was capable of creating
intuitive presentation of the differences between the examined particles. If more than
two principal components are needed to capture the variation in data with PCA, the
visualisation of the projection is more complicated. Subsequently, 3D or parallel 2D plots
are needed. The use of the unsupervised SOM enables the 2D plotting, and all the
information is in the same plot. The SOM illustrates structures in the data in a different
way than PCA multivariate data analysis by focusing to preserve the topological
neighbourhood relations in the data instead of trying to preserve the distances between
the data items. In a majority of cases, PCA, as a linear projection method, allows efficient
compression of the data and produces profound insight into the data structure. When
PCA is inefficient, nonlinear projection methods, such as the SOM, should be applied
(Daszykowski et al. 2003). For inexperienced persons in data analysis the interpretation
of SOMs can be somewhat more difficult than the analysis with PCA plots.

42
5.2 Data extraction from powder surface images 5.2.1 Content-based image retrieval Surface images of powders and granules were evaluated with respect to particle size of
the materials (I, III, IV). The results from first the phase studies showed that the
content-based image retrieval system used, QBIC, extracted applicable information
connected to the particle size of the excipient mixtures (I). The texture feature used was
capable of extracting relevant information of the appearance of the powder surfaces,
which could be connected to particle size (I, Fig. 4.).
With large image databases and a lot of image information, efficient image retrieval
systems become a necessity. Image retrieval technology combined with text querying can
lead to powerful retrieval of image data, which may effectively be used in different fields
of pharmaceutical research and industry. Possible application areas include: measurement
of size and shape distributions of samples, analysis of crystalline habit and the
examination of batch quality of raw materials.
Applications of CBIR are usually automatic and do not take into account user feedback
during queries. Interactivity in a CBIR system could be an advantage in image retrieval of
pharmaceutical powder images. Laaksonen et al. (2000, 2001, 2002) have developed a
content-based image retrieval system using the self-organising map (SOM) as the image
similarity scoring method. The system employs user feedback for supervised learning to
adjust following queries. We applied PicSOM successfully in classification of granules
using certain shape and texture features (Laitinen et al., 2002). To achieve the goal of
developing a CBIR tool, which is efficient and has a high precision rate for powder
technology, requires that the algorithms for measurement of image content should be
essential.
This study (I) was a fundamental step towards further advances in the use surface image
information of pharmaceutical solids. It established the basis of the development of the
GSDM algorithm and evolved the sample preparation and the methods of imaging.

43
5.2.2 GSDM in particle size measurements Models between surface image information of granules and their respective particle size
distributions were formed (III, IV). The results indicate that the GSDM feature can be
used in particle size measurements. The modelled particle size distributions of 5 test
batches with respect to particle size measurements with sieve analysis are presented in
figure 5 (III) and one example batch is shown in figure 12. The figures indicate that the
created models corresponded fairly well with the particle size distributions measured with
sieve analysis. The correlation coefficient between the median particle size of the results
from the optical measurements and sieve analysis was 0.82 (P<0.0001). The distributions
are more similar for particles in the size range from 100 to 200 micrometers (mean
granule size with sieve analysis). Granule batches with size fractions with smaller sizes
were over-represented in the training data compared to granules with fractions
containing larger sizes. This is an explanation for the better models for the batches with
smaller particles. This is clearly indicated in the cumulative graphs (III, Fig. 5.). When the
batches with the largest particle sizes were omitted from the test data the correlation
coefficient improved significantly to 0.915 (P< 0.0001).
0 2 4 6 8 10 12 14
mas
s %
05
101520253035404550
20000 45 125 180 250 355 500 710 1000 140071 90 3000
0 2 4 6 8 10 12 14
mas
s %
05
101520253035404550
20000 45 125 180 250 355 500 710 1000 140071 90 3000
granule size (µm)
granule size (µm)
Comparable models were made between the GSDM data and laser diffraction
measurements (III, Fig. 6a-e). The correlation coefficient between the median particle
size of the results from the optical measurements and laser diffraction was 0.92
(P<0.0001). These figures show that the created models correspond well with the particle
size distributions measured with laser diffraction. However, there are some differences
C
B
granule size (mm)
0,0 0,2 0,4 0,6 0,8 1,0 1,2 1,4 1,6 1,8 2,0 2,2 2,4 2,6 2,8 3,0
cum
ulat
ive
%
0
20
40
60
80
100
Sieve analysisOptical analysisMean granule size (sieve)Mean granule size (optical)
Figure 12. An example of the particle size distributions measured with sieve analysis (A) and modelledusing the GSDM (B). Figure C shows the cumulative graphs (sieve analysis= • , GSDM (image information)= ) with the mean granule size (dotted lines). Figure taken from publication III.
A

44
compared to the models of sieve analysis. The differences of the models for sieve
analysis and laser diffraction result from the different nature of the particle sizing
methods. Sieve analysis measures the percent mass proportions and laser diffraction
measures the percent volume proportion of the size fractions.
An improved model between the GSDM features and sieve analysis was created in paper
IV. The Pearson correlation coefficient between the mean sizes measured from surface
images and the mean size measured by sieving was 0.97. The degree of explanation or
goodness of fit (R2) for the PLS-model was 0.91 and the predicted variation (Q2) was
0.87.
5.2.3 Imaging Conditions
Digital images taken from powder surfaces contain substantial information that is needed
for particle size distribution analysis. To obtain this information reproducibly from
images, careful consideration has to be given on the imaging conditions. In this work
(III, IV) two stabilised collimated illumination units were used, but the illumination could
also be made with one light source and by rotating the sample. The main issue is that the
sample has to be unilaterally illuminated and the optical axis has to remain the same. By
taking several images while rotating the sample round its optical axis, 3–D spatial
information of the surface could be revealed (Russ, 1999). Lateral illumination reveals
distinct details of the analysed material (Pons et al. 1999, Huang and Esbensen, 2000). A
controlled and reproducible imaging environment enables inspection of differences
between batches. As we are examining surface images from identically-sized areas we are
in fact inspecting textural properties of materials. The texture of a surface is formed by
shading effects, which in turn expose the topographic properties of the surfaces (Pons et
al. 1999). When the GSDM is calculated the means of image subtraction is used.
Subtraction is primarily a way to discover differences between images (Russ 1999). In the
present approach, the combining of information from two images strengthens the
shading effects.
The measurement sensitivity and the particle size range depend on the magnification
used. In studies III and IV the approach was used for granules in the size range of
approximately 20 – 2500 µm. In future studies the use of this optical technique with

45
larger magnifications and a smaller particle size range has to be investigated. The limiting
factor for very small particles will be the wavelength of electromagnetic light. Larger
particles can be measured representatively by taking several images of a powder surface.
Some improvements in the imaging can be made with increased resolution of the system.
Likewise, using more advanced cameras can increase the number of grey scale levels
distinguished at each point. On the other hand, these improvements would mean slower
image acquisition, digitisation and overall data processing time. Naturally, with high-
resolution imaging the costs of equipment rise (Russ, 1999).
5.2.4 Comparison of methods used in particle size analysis
The introduced approach is very fast including the sample preparation, imaging and
achieving the results, compared with sieve analysis. The time of analysis for replicate
samples was 3 minutes for the introduced optical method and approximately 120 min for
sieve analysis (III). In practice, the analysis of three samples with one sieve took
approximately 8 hours if the time for cleaning and drying of equipment was included.
When comparing to particle size determination with traditional image analysis, the
examination is easier as the sample does not have to be dispersed. However, lately IA
system providers have introduced relatively effective sample dispersers for measurements
of individual particles (Hammond 1999). Extensive image pre-processing is also avoided
when analysis is made directly from a surface image of undispersed particles. Such image
processing steps, including noise reduction, binarisation and filtering, are needed to
obtain results when measuring single particles.
An advantage of the GSDM method described in this paper is that the analysed sample
can be utilised for other purposes after the analysis, since the sample is not destroyed.
This is an advantage when the analysed particles are brittle. Sometimes a particle sizing
method, such as sieve analysis might break larger granules to smaller units and give
erroneous results. In sieving the blockage or blinding of the sieves is often encountered
(Iacocca and German, 1997). In addition, static attraction of particles on sieves may
create a problem.

46
The sample size, when using the introduced imaging method can be very small (a few
milligrams). However, it has to be enough to completely cover the field-of-view of the
employed imaging equipment. Samples for especially sieve analysis but also most often
for laser diffraction as well have to be much larger. This makes the technique suitable for
samples and materials which are expensive or available in small quantities only. Wet
samples e.g. analysis of granules during granulation, can also be measured (IV). In this
work (III, IV) models were calculated for sieve-analysis and laser diffraction, but similar
models can be created for other particle size analysers as well. If viable models are
created between the powder surface information and different sizing instruments, a
particle size distribution that corresponds to all methods can be determined from powder
surface data simultaneously. While the models are created using a reference method they
can only be as good as the quality of measurements with the reference method.
Since the function of the GSDM approach has only been studied with granular materials
in this work, future studies should focus on a wide range of materials including relatively
small particles with different properties, e.g. highly cohesive powders. Moreover, studies
on the effects of particle shape and the relation of shape on shade formation in particle
size measurement from powder surface images have to be made. This will enable the
evaluation of the possibilities and limitations of the introduced approach in powder
characterisation. Naturally, also issues of qualification and validation have to be
addressed. This aspect has been taken up by Bell et al. (1999) in the case of new analytical
techniques for particle size measurement.
5.2.5 Surface images in process monitoring
Particle size measurements from a selection of 10 batches with different kind of granule
growth behaviour are presented in figure 2 (IV). Three different growth kinetics curves
(one from each distinct size range from figure 2, IV) were chosen to show how the
process can be controlled and monitored visually by images and data points. These
batches, R2, R13, and R23 with one image from each data point during processing and
three end-point images are shown in Figs 3a-c (IV). Batch R23 is also visualised in figure
13 below. By inspecting the images, it is clearly seen how the particle growth is evolving.

47
As images from only one sample per data point were captured and used in particle size
measurement, the particle size might be slightly over- or underestimated. The sizes of the
samples that are taken from the process are also relatively small with respect to total
mass in the granulator. However, as approximately 14 samples were collected from one
process run both over- and underestimations occur evenly. In order to create a growth
kinetic curve, a log-normal curve fit was made, which travels as close to the centre of
data points as possible (IV, Eq. 2).
Non-destructive at-line particle sizing methods can be advantageous to use if the applied
method provides close to real time results and the analysis of material can be made
during all process phases from both moist and dry samples. When samples are taken out
of the process during granulation, it may be beneficial for the operator to be able to
inspect the material visually. If real time monitoring of the particle size can be made at-
line leaving the sample undamaged, physical characterisation of the sample with other
techniques is also possible. The method used was suitable in the measurement of granule
samples during all process phases. It was possible to measure both dry and wet samples
with a wide particle size range. We used a prototype of the imaging instrument that was
Figure 13. The granule growth of example batch R23. Each dot (•) shows the data point for the particlemean size measured from the surface image information. Each numbered dot corresponds to the numberedsurface images. Additionally, three end-point data points and images are shown together with three replicatedata points from end-point sieve analysis ( ). The spraying and drying phases of the process are separatedwith the dashed line. Figure taken from publication IV.

48
built in our laboratory, which was not located in the same room with the granulator. This
did not enable real time monitoring of particle size. However, if the optical instrument
would be located next to the granulator the analysis of a sample within 5-10 s would be
possible. Automatic sampling would enable on-line measurements. A pilot scale fluidised
bed granulation process is usually relatively short (15-25 min). The monitoring of granule
growth by the introduced method is more suitable for large-scale granulations, where
processing times are longer. The operator has more time to use the visual information of
the images and the particle data generated as a tool in process control decision-making.
One advantage of the presented approach is that inspection of different granule samples
can be made visually without difficulty and batch-to-batch comparisons of these images
can be helpful. Optimally the visual inspection can be made first in real time and then in
addition as a control after the completed process.
Process monitoring can often be established on visual observations. The use of acoustic
methods in monitoring of particle fluidisation has been investigated successfully
(Tsujimoto et al., 2000). An interesting aim would be to try to mimic human perception
in process control situations. By combining acoustic and visual methods together with
multivariate modelling one could open further perspectives in process control.
5.2.6 Prediction of compression behaviour
Principal component analysis was capable of visualising the differences in the particle
size distribution information generated from the images. The observations are arranged
into a plane (IV, Fig 4a-b.). The granule batches with different kind of particle size
distributions are projected on different areas on the score plot. PCA indicated that two
components explained about 85 percent of the variance of the data investigated. The first
component accounted for 59.8 % of the variance. The loadings plot shows how the
different size fractions reside on the plane. The area with the tablets with the smallest
weight variation (r.s.d. between 1.8 and 4.2 %) is marked with a circle on the score plot.
Characteristic for this area is that size fractions 0.250-0.355 mm and 0.355-0.500 mm
dominate. The batches with a large amount of particles in this size range are situated
here. This is confirmed by table 3 (IV). It can clearly be seen from the score plot that the
granule batches that have the largest weight variation are situated outside the circle. In
the case of size fractions with the largest particles the larger weight variation is caused by

49
the fact that large particles do not fill the die completely and a varying amount of empty
space is left between the granules. The weight variation of the batches containing smaller
particle fractions is most likely explained by poor flowability of smaller particles.
There has to be a balance between fine and coarser particles. A critical increase in the
amount of fines results in poorer flowability (Danish and Parrot, 1971). The results of
this study show that granules with a larger amount of particles in size fractions 0.250-
0.355 mm and 0.350-0.500 mm have the best behaviour to fill the tablet machine die
causing the smallest weight variation in tablets. This valuable information could be
directly extracted from the images of granule surfaces.
Principal component analysis as a data projection method was capable of efficiently
visualise the variation in the data. PCA was useful in the prediction of tabletting
behaviour of granules in question when using particle size data generated from surface
images. It has always been difficult to give a definition for good granules. From the
tabletting point of view granules are good when the bulk behaviour results in minimal
weight variation of tablets. The introduced method gives one example how to define
good granules by using information extracted from images.

50
6. SUMMARY AND CONCLUSIONS
In this study, the use of image information from surfaces of pharmaceutical powders was
exploited in a novel fashion. The characterisation of particulate populations through
surface images was successful, with respect to classification of images, measurement of
the particle size of granular materials and the prediction of tabletting behaviour of
granules.
The novel surface-imaging instrument was successfully used in surface imaging of
undispersed powder surfaces. A new descriptor for describing the particle size of
granular material, the grey scale difference matrix (GSDM), was developed and used
effectively in particle size measurement.
The idea of using a content-based image retrieval (CBIR) technique for pharmaceutical
powder images was introduced and a basis was laid for the future use of CBIR in powder
technology.
It was also found that the current visual characterisation approach could be used as an
effective process analytical tool. The utilisation of surface image information to assure
acceptable end product quality at the completion of a granulation process was also
possible. Fast screening of properties can be made using the combination of
automatically processed image information and multivariate visualisation.
This work promotes the use of image information more comprehensively in
pharmaceutical powder technology and physical characterisation. In general, the idea of
characterisation of bulk surface images opens new perspectives for visual characterisation
of pharmaceutical solids.

51
References Aigrain, P., Zhang, H. and Petkovic, D. 1996. Content-based representation and retrieval of visual media: A state-of-the-art review. Multimedia Tools and Applications 3, 179-202. Aksoy, S. and Haralick, R.M. 1998. Textural features for image database retrieval Proceedings. IEEE Workshop on Content-Based Access of Image and Video Libraries. P. 45 –49. Allen, T. 1988. Particle size measurement, 4 th Ed., Chapman & Hall, London, New York. Andersson, M., Holmquist, B., Lindquist, J., Nilsson, O., and Wahlund, K-G. 2000. Analysis of film coating thickness and surface area of pharmaceutical pellets using fluorescence microscopy and image analysis. J. Pharm. Biomed. Anal. 22, 325-339. Andrès, C., Bracconi, P., Réginault, P., Blouquin, P., Rochat, M.H., and Pourcelot, Y. 1998. Assessing the particle size of a broadly dispersed powder by complementary techniques. Int. J. Pharm. 167 (1-2), 129-138. Andrés, C., Réginault, P., Rochat, M.H., Chaillot, B. and Pourcelot, Y. 1996. Particle size distribution of a powder: comparison of three analytical techniques. Int. J. Pharm. 144, 141-146. Antikainen, O.K., Rantanen, J.T. and Yliruusi, J.K. 2000. Use of Kohonen self-organising map to predict the flowability of powders. S.T.P. Pharma Sci. 10 (5), 349- 354. Ashley, J., Barber, R., Flickner, M, Hafner, D., Lee,D., Niblack, W. and Petkovic, D. 1995. Automatic and semi-automatic methods for image annotation and retrieval in QBIC. Storage and retrieval for image and video datbases III, Proc. SPIE -Int. Soc. Opt. Eng. 2420, 24-35. Atkinson, R.M., Beford, C., Child, K.J., and Tomich, E.G. Effect of particle size on blood griseofulvin levels on man. Nature. 193, 588-589. Bach, J.R., Fuller, C., Gupta, A., Hampapur, A., Horowitz, B., Humphrey, R., Jain, R.and Shu, C. 1996. The Virage image search engine: An open framework for image management. Storage and retrieval for image and video datbases, Proc. SPIE -Int. Soc. Opt. Eng. 2670, 76-87. Barber, T.A.(editor). 1993. Pharmaceutical particulate matter -Analysis and control, Interpharm Press, Buffalo Grove, IL. Bell, R., Dennis, A, Hendriksen, B., North, N. and Sherwood, J. 1999. Position paper on particle sizing, Sample preparation, method of validation and data presentation. Pharm. Technol. Europe. Nov. 1-3. Benkerrour, L., Duchêne, D., Puisieux, F. and Maceario, J. 1984. Granule and tablet formulae study by principal component analysis. Int. J. Pharm. 19( 1), 27-34. Bergman, R, Johansson, M.E., Lundstedt, T., Seifert, E. and Åberg, J. 1998. Optimisation of a granulation and tabletting process by sequential design and multivariate analysis. Chemom. Intell.Lab.Syst. 44(1-2), 271-286. Bertrand, D., Robert, P., Melcion J.P. and Sire, A. 1991. Characterisation of powders by video image analysis. Powder Technol. 66(2), 171-176. Bonifazi, G. 1997. Particulate solids control in bulk by image analysis. Proceedings in Powder and bulk solids conference, Rosemont III, May 5-8, 337-348. Bonifazi, G., La Marca, F. and Massacci, P. 2002. Characterisation of bulk particles in real time. Part. Part. Syst. Charact. 19, 240-246. Bønløkke, L., Hovgaard, L., Kristensen H.G., Knutson, L. and Lennernäs, H. 2001. Direct estimation of the in vivo dissolution of spironolactone, in two particle size ranges, using the single-pass perfusion technique (Loc-I-Gut®) in humans. Eur. J. Pharm. Sci., 12(3), 239-250.

52
Bordes C, Garcia, F. Snabre, P. and Frances C. 2002. On-line characterisation of particle size during ultrafine wet grinding process. Powder Technol. 128, 218-228. Bosquillon, C., Lombry, C., Preat, V., and Vanbever, R. 2001. Comparison of particle sizing techniques in the case of inhalation dry powders. J. Pharm.Sci. 90(12), 2032-3041. Bourquin, J., Schmidli, H., van Hoogevest, P. and Leuenberger, H. 1997. Application of artificial neural networks (ANN) in the development of solid dosage forms. Pharm. Dev. Tech. 2(2), 111-121. Bourquin, J., Schmidli,H., van Hoogevest, P. and Leuenberger, H. 1997. Basic concepts of artificial neural networks (ANN) modelling in the application to pharmaceutical development. Pharm. Dev. Tech. 2(2), 95-109. Brewer, E., and Ramsland, A. 1995. Particle size determination by automated microscopical imaging analysis with comparison to laser diffraction. J. Pharm. Sci. 84(4), 499-501. British Standard BS 2955. 1991. Glossary of Terms Relating to Particle Technology, British Standards Institution, London. Brittain H.G., Bogdanowich S.J., Bugay D.E., DeVincentis J., Lewen G., Newman A.W. 1991. Physical characterisation of pharmaceutical solids. Pharm. Res. 8(8), 963-73. Brown R.L. and Richards J.C. 1970. Principles of Powder Mechanics, Oxford Pergamon Press, UK. Bugay D.E. 2001.Characterisation of the solid-state: spectroscopic techniques. Adv. Drug Deliv. Rev. 48 ,43–65. Byrn S, Pfeiffer R, Ganey M, Hoiberg C. and Poochikian G. 1995. Pharmaceutical solids: a strategic approach to regulatory considerations. Pharm.. Res. 12(7), 945-54. Caelli, T. and Reye, D. 1993. On the classification of Image regions by colour, texture and shape. Pattern Recognition 26, 461-470. Carr R.L. 1965. Evaluating flow properties of solids. Chem. Eng. (Jan.) 163-168. Carr R.L. 1965. Classifying flow properties of Solids. Chem. Eng (Feb.) 69-72. Carson J.W. 1988. Overcoming particle segregation in the pharmaceutical and cosmetics industries. Drug Dev. Ind. Pharm. 14, 2749-2758. Carstensen J.T. and Franchini M. 1993. The use of fractal geometry in pharmaceutical systems. Drug Dev. Ind. Pharm.19(1-2), 85-100. Cartilier, L.H., and Tawashi R.1993. Effect of particle morphology on the flow and packing properties of lactose. S.T.P. Pharma Sciences, 3(3), 213-220. Castelli, V. and Bergman, L.D. (Editors). 2002. Image Databases – Search and Retrieval of Digital Imagery. John Wiley & Sons Inc. New York. Cielo, P. 1988. Optical Techniques for Industrial Inspection, Academic Press, London. Coppens, P., Deriemaker, L. and Finsy,R. 2000. Shape and size determination by laser diffraction: feasibility of data analysis by neural networks. Part. Part. Syst. Charact., 17, 111 -125. Cox, E.P. 1927 A method of assigning numerical and percentage values on the degree of roundness of sand grains. J. Paleont. 1, 179-183. Dahneke, B.E. 1973. Aerosol beam spectrometry. Nature Phys. Sci. 244, 54-55. Danish F.Q. and Parrot E.L. 1971. Flow rates of solid particulate pharmaceuticals. J.Pharm. Sci. 60, 548-554.

53
Danjo K., Kinoshita, K., Kitagawa, K, Iida K. Sunada, H and Otsuka, A. 1989. Effect of particle shape on the compaction and flow properties of powders. Chem. Phar. Bull. 11, 3070-3073. Dasykowski, M., Walczak, B. and Massart, D.L. 2003. Projection methods in chemistry. Chemom Intell. Lab Syst. 65, 97-112. Del Bimbo. A. 1996. Image and video databases: Visual browsing, querying and retrieval. J. Visual Lang. Comput. 7, 353-359. Del Bimbo. A. 1999. Visual iinformation retrieval, Morgan Kaufmann Publishers Inc. San Fransisco. Eilbeck, J., Rowley, G., Carter, P.A., Fletcher, E.J. 2000. Effect of contamination of pharmaceutical equipment on powder triboelectrification. Int. J. Pharm. 195, 7–11. Eriksson, M., Alderborn, G., Nyström, C., Podczeck F. and Newton, J. M. 1997. Comparison between and evaluation of some methods for the assessment of the sphericity of pellets. Int. J. Pharm.. 148(29), 149-154. Etzler F.M. and Sanderson, M.S. 1995. Particle size analysis: A comparative study of various methods. Part. Part. Syst. Charact. 12( 5), 217-224. Etzler F.M. and Deanne, R. 1997. Particle size analysis: A comparative study of various methods. Part 2. Part. Part. Syst. Charact. 14(6), 278-282. Faloutsos, C. , Barber, R., Flickner, M., Hafner, J., Niblack, W. and Petkovic, D. 1994. Efficient and effective querying by image content. J. Intell. Inf. Syst. 3, 231-262. Faure, A., York, P. and Rowe, R.C. 2001. Process control and scale-up of pharmaceutical wet granulation processes: review. Eur .J. Pharm. Biopharm. 52, 269-277. Flickner, M., Sawhney, H., Niblack, W., Ashley, J. Huang, Q., Dom, B., Gorkani, M., Hafner, J., Lee, D., Petkovic, D., Steele,D., Yanker, P. 1995. Query by image and video content: The QBIC system. Computer. 28(9), 23-31. Geldhart, D.1990. Powder processing the overall view, In Principles of Powder Technology, M. Rhodes (editor). John Wiley & Sons, New York. P.1-7. Gold, G. Duvall, R.N. Palermo, B.T. and Slater, G. 1968. Powder flow studies III, Factor affecting the flow of lactose granules. J. Pharm. Sci. 57, 667-671. Gonzalez and Woods 2001. Digital Image Processing. Prentice-Hall, Inc. Upper Saddle River, New Jersey. Grasa, G. and Abanades, J.C. 2001. A calibration procedure to obtain solid concentrations from digital images of bulk powders. Powder Technol. 114, 125-128. Gudivada, V.N. and Raghavan, V.V. 1995. Content-based image retrieval systems. Computer 28(9), 18-21. Gupta, A. , Moezzi, S., Taylor, A., Chatterjee, S., Jain, R., Goldbaum, M and Burgess, S. 1996. Content-based retrieval of opthalmological images, IEEE –International Conference on Image Processing, 3, 703-706. Hammond, S. and Egelberg, P. 1999. Particle size and shape measurement by automated microscopy. Eur. Pharm. Rev. 4(4), 16-20. Hassel, D. and Bowman, E. 1998. Process analytical chemistry for spectrosopists. Appl. Spectrosc. 52, 18A-29A . Haykin, S. 1994. Neural Networks. A Comprehensive Foundation. Macmillan Press, New York. Hellén, L., Yliruusi, J. and Kristofferson, E. 1993a Process variables of instant granulator and spheroniser: II. Size and size distributions of pellets. Int. J. Pharm. 96(1-3), 205-216. Hellén, L. and Yliruusi, J. 1993b. Process variables of instant granulator and spheroniser: III. Shape and shape distributions of pellets. Int. J. Pharm. 96(1-3), 217-223.

54
Heywood, H. 1937. Numerical definitions of particle size and shape. Chem. Ind. 15, 149-154. Heywood, H. 1954. Particle shape coefficients. J. Imp.Coll. Eng .Soc. 8, 25-39. Hoffmann, A.C, Finkers, H.J. and Seegers, J.A. 1996. Relationships between particle properties and bulk behaviour for some industrial powders. Part. Part. Syst. Charact. 13, 354-361. Hiestand E.N. 1966. Powders: particle-particle interactions. J. Pharm. Sci. 55(12), 1325-1344. Hintz, R.J. and Johnson, K. C. 1989. The effect of particle size distribution on dissolution rate and oral absorption. Int. J. Pharm. 51(1), 9-17. Hörter, D. and Dressman, J. B. 2001. Influence of physicochemical properties on dissolution of drugs in the gastrointestinal tract. Adv. Drug Del. Rev. 46(1-3), 75-87. Hotelling, H., 1933. Analysis of a complex of statistical variables into principal components. J. Educat. Psych. 24, 417-441. Hou, T.-Y., Liu, P., Hsu, A. and Chiu, M.-Y. 1992. Medical Image Retrieval by Spatial Features. Proc. IEEE -International Conference on System, Man and Cybernetics, 1364-1369. Houghton M.E. and Amidon, G.E. 1992. Microscopic characterisation of particle size and shape: an inexpensive and versatile method. Pharm. Res. 9(7), 856-859. Huang, J. and Esbensen, K.H. 2000. Applications of Angle Measure Technique (AMT) in image analysis. Part I. A new methodology for in situ powder characterisation. Chemom. Intell. Lab. Syst. 54, 1-19. Huang, J. and Esbensen, K.H. 2001. Applications of Angle Measure Technique (AMT) in image analysis. Part I. Prediction of powder function properties and mixing components using Multivariate AMT regression (MAR). Chemom. Intell. Lab. Syst. 57, 37-56. Hundal, H.S., Rohani, S. , Wood, H.C. and Pons, M.N. 1997. Particle shape characterisation using image analysis and neural networks. Powder Technol. 91, 217-227. Hunter, B.M. and Ganderton, D. 1972. Effect of particle size on the granulation of lactose by massing and screening. J. Pharm. Pharmac. 24, 17-24. Hussain, A.S., Yu, X., Johnson, R.D. 1991. Application of neural computing in pharmaceutical product development. Pharm. Res. 8, 1248-1252. Ibrahim, H., Sallam, E., Takieddin, M., Shamat, M., Abu. 1988. Dissolution characteristics of interactive powder mixtures. Part one: Effect of solubility and particle size of excipients. Drug Dev. Ind. Pharm. 14(9), 1249-76. Iacocca, R.G. and German, R.M. 1997. A comparison of powder particle size measuring instruments. Int. J. Powder Metall. 33(8), 35-48. Ikekawa, A. and Kaneniwa, N. 1968. Influence of particle size on physicochemical properties of pharma-ceutical powders. IV. On packing of pharmaceutical powders 2. Chem. Pharm. Bull. 16(7), 1174-1180. International Conference on Harmonisation (ICH).1999. ICH 6QA - Specifications: Test procedures and acceptance criteria for new drug substances and new drug products: Chemical substances. Iveson, S.M., Litster, J.D., Hapgood, K. and Ennis, B.J. 2001. Nucleation, growth and breakage phenomena in agitated wet granulation processes: a review, Powder Technol. 117, 3-39. Johanson, J.R. 1996. Predicting segregation of bimodal particle mixtures using the flow properties of bulk solids, Pharm. Technol. Europe. 8(1), 38-44. Johnson K.C.and Swindell A.C. Guidance in the setting of drug particle size specifications to minimize variability in absorption. Pharm.Res. 13(12), 1795-1798.

55
Jounela, A., Pentikäinen P. and Sothmann, A. 1975. Effect of particle size on the bioavailability of digoxin. Eur. J. Clin. Pharmacol.. 8, 365-370. Kachrimanis, K. Karamyan, V. and Malamataris, S. 2003. Artificial neural networks (ANNs) and modelling of powder flow. Int. J. Pharm. 250(1,) 13-23. Kaneniwa, N.; Ikekawa A.; and Aoki, H. 1967. Influence of particle size on physicochemical properties of pharmaceutical powders. I. On fluidity of sodium borate and boric acid powders 1. Chem. Pharm. Bull. 15(10), 1441-1445. Karhunen, K. 1947. Uber lineare methoden in der Wahrscheinlichkeitsrechnung. Annales Academiae Scientiarum Fennicae, Seried A1: Mathematica-Physica, 37, 3-79. Kaye B.H. 1978. Specifications of the ruggedness and/or texture of a fine particle profile by its fractal dimension. Powder Technol. 1-16. Kaye B.H., Alliet D. Switzer, L. and Turbitt-Daoust, C. 1997. The effect of shape intermethod correlation of techniques for characterizing the size distribution of powder. Part 1: correlating the size distribution measured by sieving, image analyis and diffractometer methofs. Part. Part. Syst. Charact. 14, 219-224. Kennedy J.P. and Niebergall, P.J. 1997. Preliminary assessment of an image analysis method for the evaluation of pharmaceutical coatings. Pharm. Dev.Tech. 2, 205-212. Kohonen, T. 1982. Self-organised formation of topologically correct feature maps. Biol. Cybern. 43, 56-69. Kohonen,T. 1997. Self-organizing Maps. In: Series in Information Sciences, vol. 30, Springer Heidelberg, Germany. Laaksonen, J.T. , Koskela, J.M., Laakso, S.P. and Oja, E. 2000. PicSOM - content-based image retrieval with self-organizing maps. Pattern Recogn. Lett. 21(13-14), 1199-1207. Laaksonen, J., Koskela, M. Laakso, S. and Oja, E. 2001. Self-organizing maps as a relevance feedback technique in content-based image retrieval. Pattern Anal. Appl. 4(2+3), 140-152. Laaksonen, J., Koskela, M. and Oja, E. 2002. PicSOM –self organizing image retrieval with MPE-7 contetnt descriptor. IEEE Transactions on Neural Networks 13(4), 841-853. Laitinen, N., Rantanen, J., Laaksonen, J., Antikainen, O., and Yliruusi, J. 2002. Major advances in the use of digital image information in pharmaceutical powder characterisation. Proceedings in 4th World meeting on Pharmaceutics, Biopharmaceutics and Pharmaceutical Technology, 8-11.4.2002, Florence, Italy. p. 33-34. Laitinen, N. and Juppo, A.M. 2003. Measurement of pharmaceutical particles using a time-of-flight particle sizer. Eur.J.Pharm.Biopharm. 55(1), 93-98. Larsen, C.C., Sonnergaard, J.M. Bertelsen, P., and Holm, P. 2003. Validation of an image analysis method for estimating coating thickness on pellets. Eur.J.Pharm.Sci 18, 191-196. Lees, K.A. 1963. Pharmaceutical aspects of fine particles and their evaluation. Pharm. J. 191(5211):289-291. Lin, C.L. and Miller, J.D. 1993. The development of a PC, image based, on-line particle size anlyzer. Miner Metall. Proc. (Feb), 29-35. Lindberg, N-O. and Lundstedt, T. 1995. Application of multivariate analysis in pharmaceutical development work, Drug Dev. Ind. Pharm. 21 (9), 987-1007. von Lindener, H. and Kleinebudde P. 1993. Anwendung der automatischen Bildanalyse zur Charkteriserung von Pellets. Pharm. Ind. 55(7) 694-701. Luekens, D.W., Beddow, J.K. and Vetter, A.F. 1982. Morphological fourier descriptors. Powder Technol. 31, 209-215.

56
Manjunath, B.S. and Ma, W.Y. 1996. Browsing large satellite and aerial photographs. IEEE - International Conference on Image Processing, 2, 765-767. Mehrotra, R. and Gary, J.E. 1995. Similar-shape retrieval in shape data mangement. Computer. 28(9), 57-62. Meloy, T.P. 1977a. A hypothesis on morphological characterisation of particles shape and physicochemical properties. Powder Technol. 16, 233-253. Meloy, T.P. 1977b. Fast fourier transorms applied to shape of particle silhouettes to obtain morphological data. Powder Technol. 17, 27-35. Melssen, W.J. Smits, J.R.M, Buydens, L.M.C. and Kateman, G. 1994. Using artificial neural networks for solving chemical problems, Part II,. Kohonen self-organising feature maps and Hopfield networks. Chem. Intell. Lab. Syst. 23, 267-291. Mitchell, J.P. and Nagel, M.W. 1995. An assessment of the API Aerosizer® for the real-time measurement of medical aerosols from pressurised metered-dose inhaler (pMDI) systems. Aerosol Sci. Technol. 25, 411-423. Murtomaa, M. 2002. Electrostatic studies on pharmaceutical powders and aerosols, Doctoral Thesis, Annales Universitatis Turkuensis, Turku, Finland. Murtoniemi, E., Yliruusi, J., Kinnunen, P., Merkku, P., and Leiviskä, K. 1994. The advantages by the use of neural networks in modelling the fluidised bed granulation process. Int. J. Pharm. 108,155-164. Muzzio, F.J., Shinbrot, T. and Glasser, B.J. 2002. Powder technology in the pharmaceutical industry: The need to catch up fast. Powder Technol. 124(1-2), 1-7. Nazar, A.M., Silca, F.A. and Amman, J.J. 1996. Image processing for particle characterisation. Mater. Charact. 36, 165-173. Ng, V., Cheung, D. and Fu, A. 1995. Medical image retrieval by colour content. Proc. IEEE International Conference on System, Man and Cybernetics: Intelligent Systems for the 21st century, 3:1980-1985. Niblack, W., Barber, R. Equitz., W., Flickner, M.B., Glasman, E., Petkovic, D., Yanker, P., Faloutsos, C. and Taubin, G. 1993.The QBIC project: querying images by content using colour, texture and shape. Storage and Retrieval for Image and Video Databases, Proc. SPIE -Int. Soc. Opt. Eng. 1908, 173-181. Niven, R.W.. 1993. Aerodynamic particle size testing using a time-of-flight aerosol beam spectrometer. Pharm. Technol. 17, 72-78. Novales, B., Guillaume, S. Devaux, M.F. and M. Chaurand. 1998. Particle size characterisation of in-flow milling products by video image anlysis using global features. J.Sci. Food Agric. 78, 187-195. Passerini, N., Albertini, B., González-Rodríguez, M.L., Cavallari, C. and Rodriguez, L. 2002. Preparation and characterisation of ibuprofen-poloxamer 188 granules obtained by melt granulation. Eur. J. Pharm. Sci. 15, 71-78. Pearson, K. 1901. On lines and planes of closest fit to systems of points in space. Philos.Mag. Ser. 6, 2 559-572. Pentland, A., Picard, R.W. and Scarloff, S. 1994. Photobook: tools for content-based manipulation of image databases. Storage and Retrieval for Image and Video Databases II, Proc. SPIE -Int. Soc. Opt. Eng. 2185, 34-47. Pifferi, G, Santoro,P. and Pedrani, M. 1999. Quality and functionality of excipients, Farmaco. 54(1-2), 1-14. Podczeck ,F., Rahman, S.R., and Newton, J.M. 1999. Evaluation of a standardised procedure to assess the shape of pellets using image analysis. Int. J. Pharm. 192(2), 123-138. Podczeck, F. 1997. A shape factor to assess the shape of particles using image analysis. Powder Technol. 93, 47-53.

57
Podczeck, F. and Newton, J.M . 1995. Evaluation of a three-dimensional shape factor for the quantitative assessment of the sphericity and surface roughness of pellets. Int J Pharm. 124, 253-259. Podczeck, F., Newton J.M. 1994. A shape factor to characterise the quality of spheroids. J. Pharm. Pharmacol. 46(2), 82-95. Pons, M.N., Vivier, H., Belaroui,K., Bernard-Michel,B., Cordier,F., Oulhana, D., and Dodds, J.A. 1999. Particle morphology: from visualisation to measurement. Powder Technol. 103, 44-57. Pons, M.N., Vivier, H. Belaroui, K., Bernard-Michel, B., Cordier, F., Oulhana, D., and Dodds J.A. 1999. Particle morphology: from visualisation to measurement. Powder Technol. 103, 44-57. Pons, M-N., Vivier, H., Delcour, V., Authelin J-R. and Paillères-Hubert, L. 2002. Morphological analysis of pharmaceutical powders. Powder Technol., 128(2-3), 276-286. Prescott, J.K. and Hossfield, R.J. 1994. Maintaining product uniformity and uninterrupted flow to direct-copmpression tabletting presses. Pharm.Technol. June, 99-114. Rantanen, J. , Känsäkoski, M., Suhonen, J., Tenhunen, J., Lehtonen,S., Rajalahti, T., Mannermaa J.-P. and Yliruusi, J. 2000. Next generation fluidised bed granulator automation. AAPS Pharm. Sci. Tech. 1 (2) article 10 (http://www.pharmscitech.com). Rantanen, J.T., Laine, S.J., Antikainen, O.K., Mannermaa, J-P. , Simula, O.E. and Yliruusi, J.K. 2001. Visualisation of fluid-bed granulation with self-organizing maps, Pharm. Biomed. Anal. 24, 343-352. Ratha, N., Karu, K., Chen, S. and Jain, A. 1996. A real-time matching system for large fingerprint databases. IEEE Trans. PAMI, 18(8), 799-812. Rees, J.E. 1977. Characterisation of pharmaceutical particulate materials. Boll Chim. Farm. 116(3), 125-41. Ridgway K, and Rupp R. 1969. The effect of particle shape on powder properties. J. Pharm. Pharmacol. 21, Suppl. 30-39. Ros,. F., Guillaume, S., Bellon-Maurel, V., and Bertrand, D. 1997. Building and preprocessing image data using indices of representativeness and classification applied to granular product characterisation. J. Chemometrics. 11, 469-482. Rowley, G. 2001. Quantifying electrostatic interactions in pharmaceutical solid systems, Int.J. Pharm. 227, 1-2(4), 47-55. Russ, J. 1999. The Image Processing Handbook. 3rd Ed., CRC Press, Boca Raton, FL. Rösler, R. Schneider, H.A. and Schuberth R. 1987. Relation between particle shape and profile Fourier coefficients. Powder Technol. 49, 255-260. Scholz, A., Abrahamsson, B., Diebold, S.M., Kostewicz, E., Polentarutti, B.I, Ungell, A-L., and Dressman, J.B. 2002. Influence of hydrodynamics and particle size on the absorption of felodipine in labradors. Pharm. Res. 19(1), 42-46. Scott, D.M., Boxman, A. and Davies. R. 1998. Industrial applications of in-line particle characterisation. Proc. in World Congress on particle Technology 3, Brighton, UK, July 6-9. Smith, J.R. and Chang, S.-F. 1996. Visual SEEk: A fully automated content-based image query system. Proc. ACM –Int. Conf. Multimedia. 96, 87-96. Smith, J.R. and Chang, S.-F. 1996. Tools and techniques for colour image retrieval, Storage and retrieval for image and video databases, Proc. SPIE -Int. Soc. Opt. Eng. 2670, 426-437. Snow, R.H., Allen, T., Ennis, B.K. and Litster, J.D. 1997. Size reduction and size enlargement. In Perry’s Chemical Engineers’ Handbook, McGraw-Hill, New York, p. 20-56 – 20-89.

58
Soffer, A. and Samet, H. 1996. Retrieval by content in symbolic-image databases Storage and retrieval for image and video databases IV, Proc. SPIE -Int. Soc. Opt. Eng. 2670, 144-155. Sonka, M., Hlavac, V. and Boyle, R. 1998. Image Processing, Analysis and Machine Vision, Brooks/Cole Publishing company., Pacific Grove, CA. Staniforth, J.N. and Rees J.E. 1982. Electrostatic charge interactions in ordered powder mixes. J. Pharm. Pharmacol. 34(2), 69-76. Staniforth, J.N 1988. Particle size anlaysis, In Pharmaceutics - the science of dosage form design, M.E. Aulton (editor).Churchill Livingstone, London, UK. p. 566-558. Stephenson,G.A, Forbes R.A. and Reutzel-Edens., S.M. 2001. Characterisation of the solid state: quantitative issues, Adv. Drug Deliv. Rev. 48( 1), 67-90. Swarbrick J. and Boylan, J.C. 1992. Encyclopedia of Pharmaceutical Technology: Film coatings and film forming materials: Evaluation to generic drugs and generic equivalency, Marcel Decker Inc., New York. Travers, D.N. 1988. Mixing, In Pharmaceutics - the science of dosage form design, M.E. Aulton (editor). Churchill Livingstone, London, UK. p. 550-565. Tsujimoto, H, Yokoyama, T., Huang, T.T., Sekiguchi, I. 2000. Monitoring particle fluidisation in a fludized bed granulator with an acoustic emission sensor. Powder Technol. 113, 88-96. Turbitt-Daoust, C., Alliet, D.F., Kaye, B.H., and Matchett, A.J., 2000. Orientation effects in the evaluation of populations of irregularly shaped particles by image analysis, Part. Part. Syst .Charact. 17, 159-166. Wadell, H. 1933. Sphericity and roundness of rock particles. J.Geol. 41, 310-331. Walton, C. A. and Pilpel, N. 1972. Effects of particle size, shape, and moisture content on the tensile properties of procaine penicillin powders. J. Pharm. Pharmac. 24, 10-16. Washington, C. 1992. Particle Size Analysis in Pharmaceutics and Other Industries: Theory and Practice, Ellis Horwood Limited, UK. Watano, S. and Miyanami, K. 1995. Image processing for on-line monitoring of granule size distribution and shape in fluidised bed granulation. Powder Technol. 83:55-60. Watano, S. Numa, T., Miyanami, K., and Osako, Y.2000. On-line monitoring of granule growth in high shear granulation by an image processing system. Chem. Pharm. Bull. 48(8), 1154-1159. Watano, S., Sato, Y. and Miyanami, K. 1997. Application of neural network to granulation scale-up. Powder Technol. 90, 153-59. Williams, D.1990. Mixing and segregation of powders, In Principles of Powder Technology, M. Rhodes (editor). John Wiley & Sons, New York. p.71-90. Wold S. Chemometrics. 1995. What do we mean with it, and what do we want from it? Chemom .Intell. Lab. Syst. 42, 175-185. Wold S., Trygg,J., Berglund,A. and Antti, H. 2001. Some recent developments in PLS modelling. Chemom. Intell. Lab. Syst. 58, 131–150. Wold, S. 1995. PLS for multivariate linear modelling, In: QSAR: Chemometric methods in molecular design, Vol. 2. H. van de Waterbeemd. Ed. VCH, Weinheim. Wold, S. Sjöström, M.and Eriksson L. 2001. PLS-regression: a basic tool of chemometrics. Chemom. Intell. Lab. Syst. 58, 109-130. Wong, L.W. and Pilpel, N. 1990. Effect of particle shape on the mixing of powders. J. Pharm. Pharmac. 42(1), 1-6.

59
Yalkowsky and Bolton. 1990. Particle size and content uniformity. Pharm. Res. 7(9), 962-966. York, P. 1978. Particle slippage and rearrangement during compression of pharmaceutical powders. J. Pharm. Pharmac. 30(1), 6-10. You, J., Shen, H. and Cohen, H.A. 1997. An efficient parallel texture classification for image retrieval. J Visual Lang. Comput. 8, 359-372. Zupan, J. and Gasteiger, J. 1993. Neural Networks for Chemists: An introduction, VCH, Wienheim, 1993, Chapters 10, 16, 18 and 19. Ålander, E.M., Uusi-Penttilä, M.S. and Rasmuson, Å.C. 2003. Characterisation of paracetamol agglomerates by image analysis and strength measurement. Powder Technol. 130, 298-306.